

Abstract
Dendritic Ca2+ signaling is central to neural plasticity mechanisms allowing animals to adapt to the environment. Intracellular Ca2+ release (ICR) from endoplasmic reticulum has long been thought to shape these mechanisms. However, ICR has not been investigated in mammalian neurons in vivo. We combined electroporation of single CA1 pyramidal neurons, simultaneous imaging of dendritic and somatic activity during spatial navigation, optogenetic place field induction, and acute genetic augmentation of ICR cytosolic impact to reveal that ICR supports the establishment of dendritic feature selectivity and shapes integrative properties determining output-level receptive fields. This role for ICR was more prominent in apical than in basal dendrites. Thus, ICR cooperates with circuit-level architecture in vivo to promote the emergence of behaviorally-relevant plasticity in a compartment-specific manner.
One-Sentence Summary:
Intracellular Ca2+ release orchestrates subcellular, cellular, and circuit architecture to shape learning in the hippocampus.
Learning occurs when experience-driven neuronal activity patterns induce changes in synaptic strengths, thereby altering how future information propagates through neuronal circuits. This process, known as synaptic plasticity, is a fundamental way in which animals adapt to the environment and yet it remains enigmatic. At the cellular level, Ca2+ helps transduce specific patterns of synaptic activation into long-lasting changes in synaptic efficacy (1). The magnitude and spatiotemporal patterning of cytosolic Ca2+ are therefore critical in determining which synapses will undergo plasticity and the extent to which they will do so. Most studies of the mechanisms regulating dendritic Ca2+ dynamics have focused on the role of voltage-gated channels mediating Ca2+ conductances at the plasma membrane (2–4). However, another regulator of intracellular Ca2+ dynamics is the main internal Ca2+ store, the endoplasmic reticulum (ER) (5), which pervades the dendritic arbor (6–8) where it sequesters nearly all Ca2+ within a neuron. The ER can release its highly-concentrated store of Ca2+ in an activity-dependent manner, significantly amplifying the impact of Ca2+ influx from the extracellular space (5, 9–14).
While much attention has been paid to the potential role for ICR in plasticity through numerous in vitro studies (11–21), and recently in Drosophila (22), this powerful intracellular amplificatory process remains unexplored in mammalian neurons in vivo. This is due to a lack of tools to precisely and effectively manipulate ICR in awake, behaving vertebrates. Such an approach would require not only cellular and pre- vs. postsynaptic specificity but also the ability to influence ICR across each of its two canonical release mechanisms (5, 23). To overcome this limitation, we focused on Pdzd8; a gene that encodes a tethering protein that brings ER and mitochondria into direct contact, thereby enabling mitochondria to buffer a substantial fraction of ER-released Ca2+ (9). Reduction of Pdzd8 expression allows approximately 50% more Ca2+ to escape into the cytosol upon synaptically-driven ICR in dendrites while leaving functional and morphological properties of ER and mitochondria intact (9). Therefore, Pdzd8-mediated ER-mitochondria contacts present an avenue to manipulate ICR in vivo across its multiple release pathways.
Here we leverage Pdzd8 deletion as a gain-of-function tool to augment the cytosolic impact of ICR. We deploy this molecular-genetic tool in pyramidal neurons of hippocampal area CA1 (CA1PNs). The CA1PN is a rich model system to interrogate general principles of experience-dependent synaptic plasticity: it receives diverse, circuit-specific excitatory inputs transmitting complementary streams of information relevant to an animal’s environment and these inputs target dendritic compartments that are morphologically and biophysically distinct from one another (24–29). As an animal explores its environment, CA1PNs integrate these diverse inputs to generate spatially-tuned receptive fields, known as ‘place fields’ (PFs), which manifest as the cell selectively firing when the animal occupies a particular location within the environment and collectively form a comprehensive map of an animal’s environment (30, 31). Recent work has established a plasticity mechanism, known as behavioral timescale plasticity (BTSP) (32–34), that is sufficient to drive rapid PF formation in CA1PNs. BTSP is driven by large, prolonged dendritic depolarization events, known as plateau potentials, that potentiate dendritic spines receiving presynaptic input within a seconds-long temporal window surround plateau potential onset. We leveraged the well-characterized functional-anatomical complexity of CA1PNs, and the robust in vivo plasticity mechanism BTSP, to test the role of ICR in synaptic plasticity mechanisms supporting dendritic and cellular feature selectivity.
Single-cell genetic deletion and in vivo subcellular imaging in hippocampal area CA1
We simultaneously monitored activity of dendrites and their cognate somata in CA1PNs with either normal or augmented ICR during spatial navigation. Using in vivo single-cell electroporation (see Methods), we introduced pCAG-Cre, pCAG-FLEX-jGCaMP7b, and pCaMKII-bReaChes-mRuby3 to single CA1PNs in anesthetized adult mice (Fig. 1A, left and middle). We targeted single cells in a Pdzd8 conditional knockout mouse line (Pdzd8F/F) (fig. S1, A and B) and in WT control mice to generate single Pdzd8 KO (augmented ICR) and WT cells (Fig. 1A, right) expressing a high-baseline Ca2+ indicator (jGCaMP7b) and a fluorescently-tagged excitatory opsin (bReaChes-mRuby3). In vivo single-cell electroporation of a Cre-expressing plasmid in Pdzd8F/F mice eliminated Pdzd8 mRNA within 3 days (fig. S1, C–F) and expression of Cre recombinase in cortical neurons significantly reduced PDZD8 protein levels within 7 days (fig. S1, G and H). We performed all imaging experiments no less than 7 days post-electroporation. Our acute, single-cell genetic deletion in adult CA1PNs circumvented potential non-cell-autonomous (22, 35) and developmental (16) effects that might have arisen from broad and constitutive perturbations. During head-fixed spatial navigation on a cue-rich, 2-meter treadmill belt (36, 37), we simultaneously monitored activity dynamics in one dendritic focal plane, which ranged from basal dendrites in stratum oriens (SO) to distal tuft dendrites in stratum lacunosum moleculare (SLM, fig. S2), and in a somatic plane which often contained co-planar segments of basal dendrite (Fig. 1, B and C, Movie 1). For motion correction (fig. S3) and dendritic ROI registration (see Methods), we co-acquired static mRuby3 signals through a dedicated collection channel (Fig. 1B).
Fig. 1. Simultaneous imaging of somatic and dendritic activity in single, spatially-tuned CA1PNs with normal and augmented ICR.
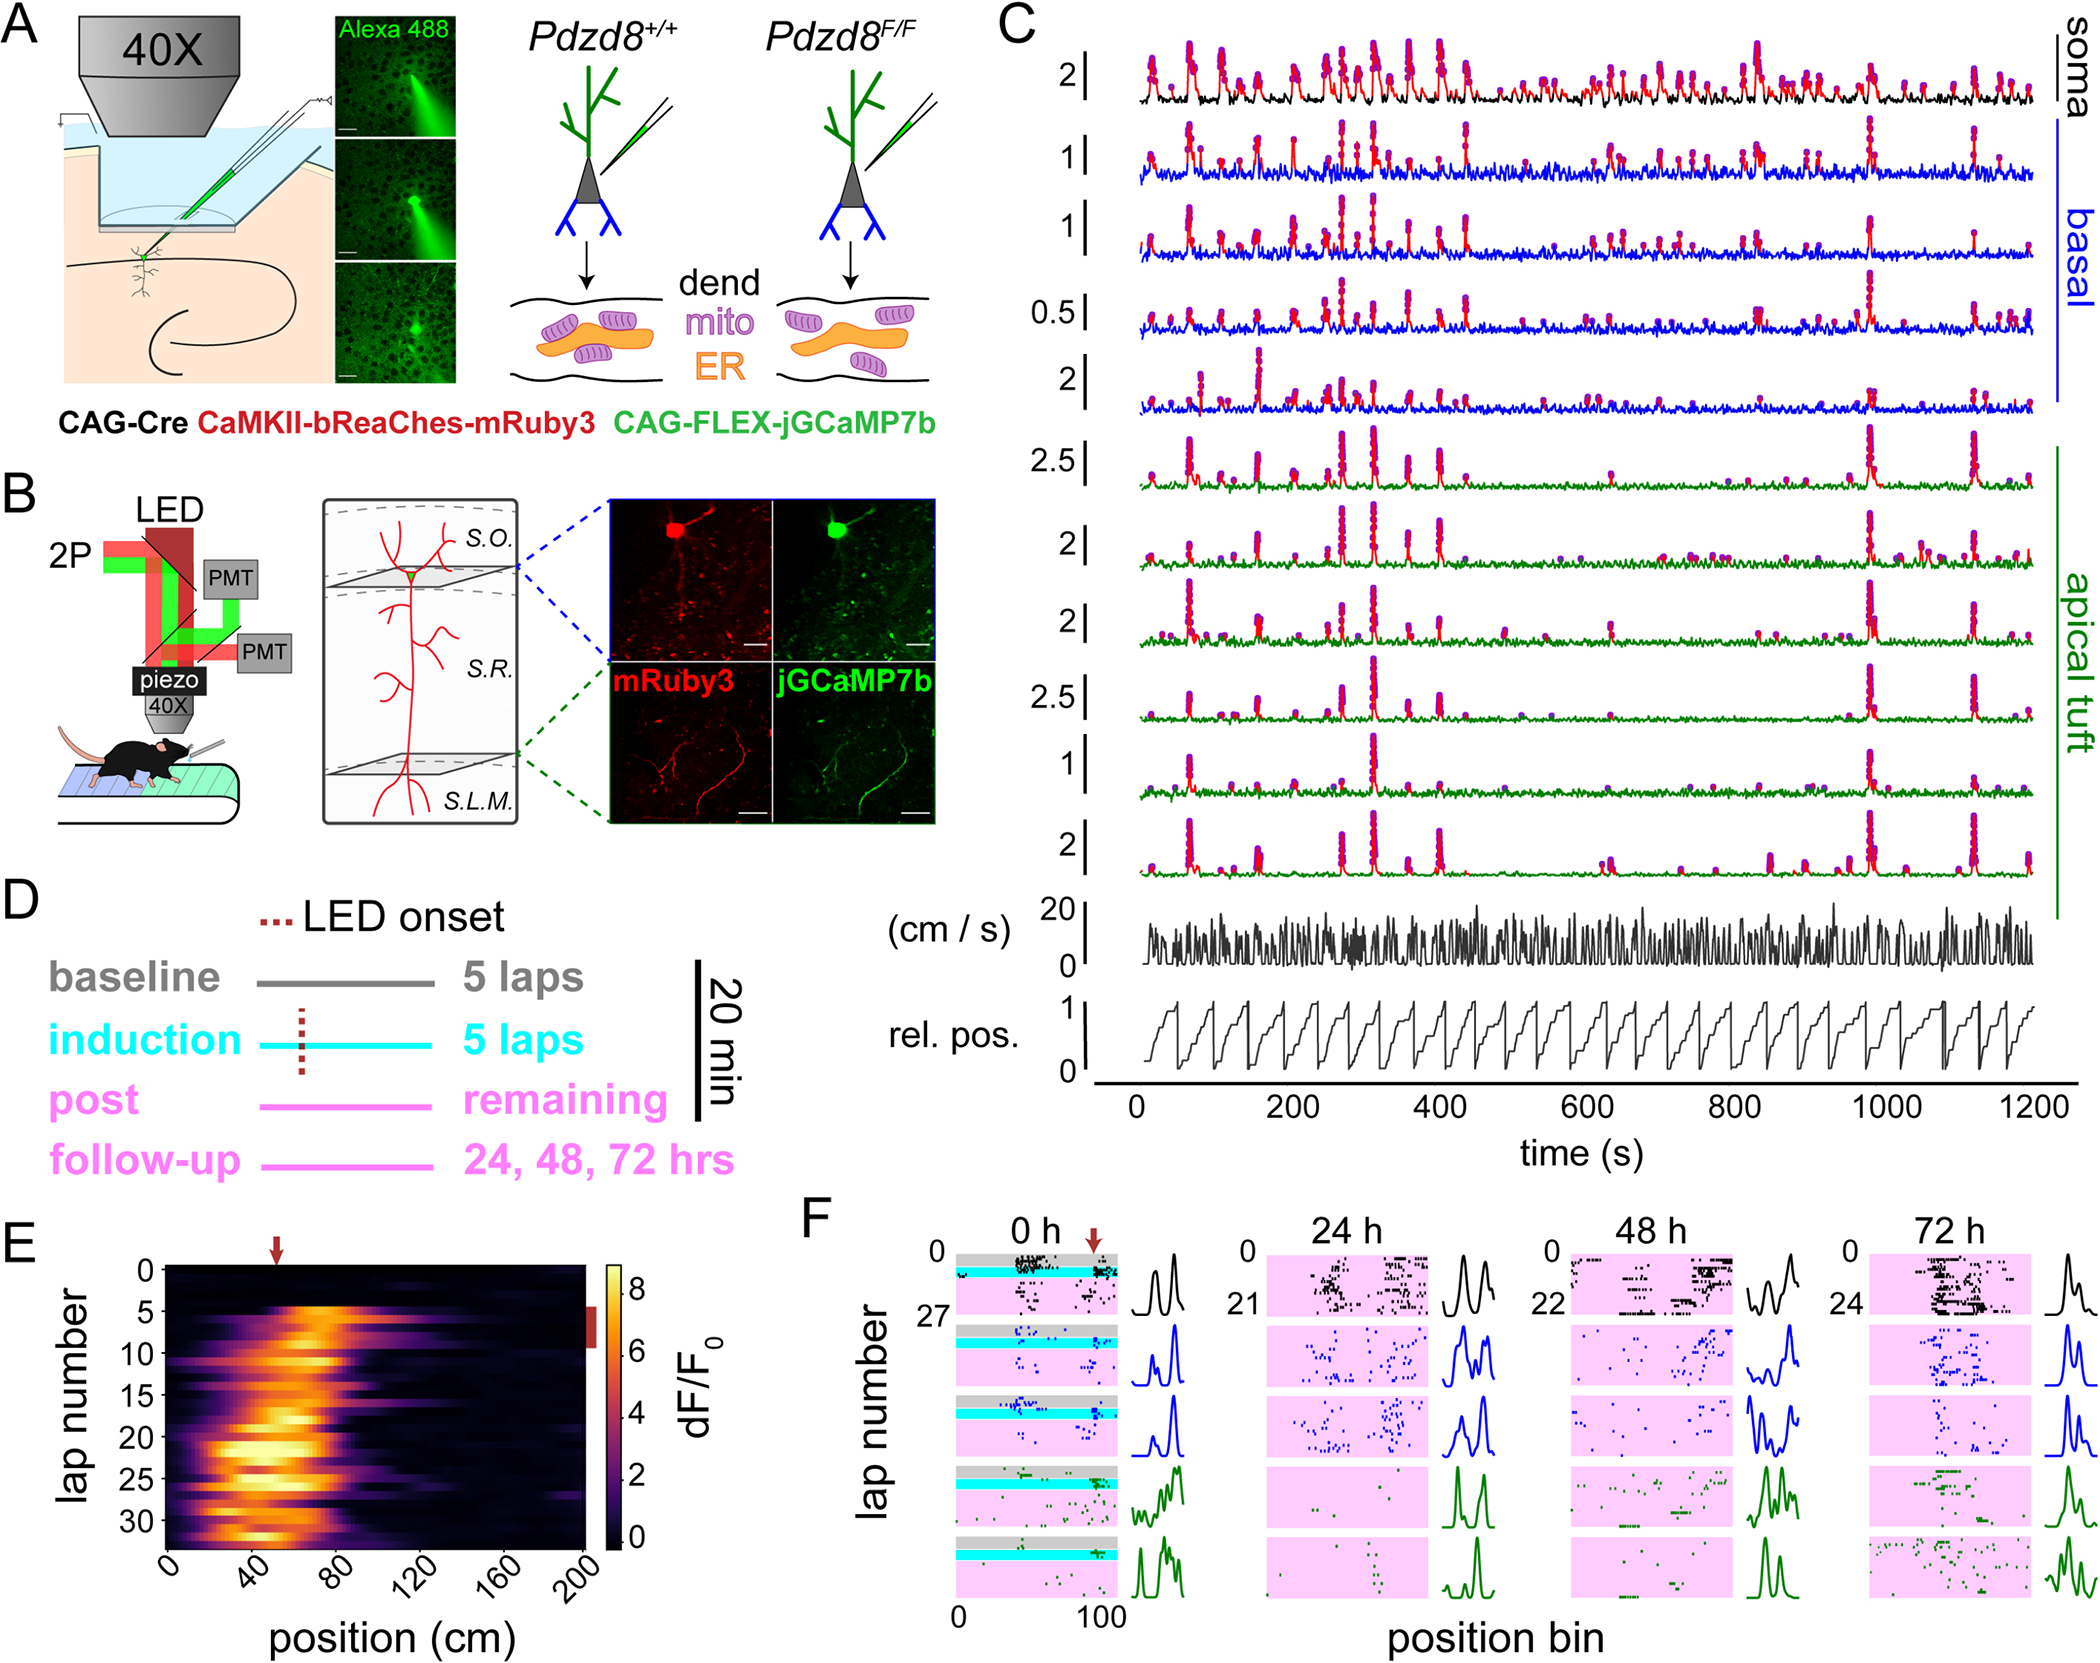
(A) Left: An electroporation pipette containing plasmid DNAs (listed below) is guided through a silicon-protected slit in an imaging window implanted over dorsal CA1. Middle: 2-photon images before (top), during (middle), and after (bottom) electroporation of plasmid solution to a single cell in the pyramidal layer. Scale bar 20 μm. Right: Plasmid mixture is delivered via single cell electroporation to CA1PNs in Pdzd8+/+ and Pdzd8F/F mice. Schematic shows Cre-mediated ablation of ER-mitochondria (mito) contacts in dendrite (dend) of Pdzd8F/F CA1PN, augmenting cytosolic impact of ICR. (B) Left: Multi-plane, dual-channel imaging during head-fixed spatial navigation. LED (620 nm) is used for photoactivation of the opsin-expressing cell. Right: Diagram approximating focal planes imaged for an example cell with corresponding motion-corrected, time-averaged fields of view from each channel showing soma/co-planar basal dendrites (top row) and distal apical tuft dendrites (bottom row). Scale bar 50 μm. Hippocampal strata indicated by dashed lines: S.O., stratum oriens; S.R., stratum radiatum; S.L.M., stratum lacunosum moleculare. (C) Traces of soma (black), as well as basal (blue) and apical tuft (green) dendrites co-acquired from example cell in (B). Vertical scale bars indicate dF/F0. Detected Ca2+ transients drawn in red with deconvolved events as magenta circles. Frame-synchronized animal running speed and relative position (rel. pos.) shown below traces. (D) Schematic describing optogenetic place field induction paradigm. (E) Somatic activity heatmap from induction session. LED location denoted by red arrow at top; LED laps by red bar at right. (F) Event rasters and spatial tuning curves from a single CA1PN showing somatic and subset of dendritic dynamics on induction day (0 h) and at 24 h, 48 h, and 72 h timepoints. ROI types colored as in (C); conditions colored as in (D). Tuning curves are scaled to maximum values to aid visualization.
Movie 1.
Somatic (left) and apical dendritic (right) imaging planes of example CA1PN shown in Fig. 1B (right) displayed side-by-side during a place field induction lap. jGCaMP7b response to a single, 1-second LED pulse is shown. Frames are motion-corrected and shown at actual speed. Data acquired using 2-photon microscopy with a 40X objective lens at 1.0X optical zoom.
To evaluate the role of ICR in plasticity and learning, we sought to image CA1PNs expressing PFs. To boost the fraction (36, 38) of CA1PNs functioning as ‘place cells’, and to track the stability of a subset of PFs with a defined time-zero, we carried out an optogenetic PF induction protocol in each imaged cell (Fig. 1, D and E, see Methods). Optogenetically-induced PFs displayed characteristic hallmarks (fig. S4, A–D) of naturally-occurring in vivo place cell formation (32, 33, 39, 40) and shared similar properties with spontaneous, non-induced PFs (fig. S4, E–G). We therefore pooled spontaneous and induced PFs except in longitudinal analyses addressing the stability of spatial feature selectivity, where a defined time point for PF formation was necessary. We imaged somatic and dendritic activity in 20-minute sessions on four consecutive days (Fig. 1F, fig. S5) including the initial PF induction day, comparing post-induction dynamics in CA1PNs with normal and augmented ICR.
Acute Pdzd8 deletion as a tool to investigate the role of ICR
Given the absence of in vivo functional imaging data for apical CA1PN dendrites and the paucity of such data for basal dendrites (41–43), we first characterized spontaneous Ca2+ transient properties in apical and basal dendrites with respect to their parent soma and assessed any impact of our ICR-augmenting manipulation on basic CA1PN activity dynamics. Pdzd8 WT and WT CA1PN cell bodies did not differ in Ca2+ transient frequency or amplitude (fig. S6, A and B). Isolated dendritic transients (no coincident somatic event, see fig. S6, C and D for examples) were overall rare compared to somatic transients with minor but significant differences in event frequency between compartment and genotype (fig. S6E). Isolated apical dendritic Ca2+ transients, which have not previously been reported in CA1PNs, were larger and more frequent than those observed in basal dendrites (fig. S6, E and F). Increasing ICR via Pdzd8 WT did not affect isolated transient amplitude in either dendritic compartment (fig. S6F). We cannot formally rule out the possibility that undetected somatic action potentials backpropagate into imaged dendrites and contribute to apparent isolated events. However, a difference in event amplitude between genotype would be reasonably expected if ICR were routinely activated in the setting of local dendritic Ca2+ transients.
To further assess potential effects of acute Pdzd8 WT on baseline Ca2+ handling and excitability in adult CA1PNs, we first compared isolated, single-spine Ca2+ transients (no coincident shaft-level event, see fig. S6, G and H for examples) in a separate set of CA1PNs electroporated with pCAG-Cre, pCAG-NES-jRGECO1a, and pCAG-FLEX-eGFP. We imaged individual apical and basal dendritic segments at high magnification in Pdzd8F/F and WT control mice under light anesthesia on a treadmill belt lacking spatial cues (fig. S6, G and H, see Methods). While isolated spine Ca2+ transients were generally of greater amplitude and frequency in apical versus basal dendrites, these event properties did not significantly differ between Pdzd8 WT and WT CA1PNs (Fig. S6, I and J). Next, we compared electrophysiological properties of Pdzd8 WT and WT CA1PNs after targeting either AAV-CaMKII-Cre-mCherry or mCherry-only control virus to dorsal CA1 of adult Pdzd8F/F mice (fig. S7A, see Methods). Apart from minor but significant differences in action potential amplitude and half-width, Pdzd8 WT and WT CA1PNs shared similar electrophysiological attributes (fig. S7, B–K).
ICR controls diversity and reliability of dendritic spatial tuning in single CA1PNs
We reasoned that, if ICR regulates synaptic plasticity in vivo, then augmenting its spread and magnitude should impact specific aspects of dendritic feature selectivity in CA1PNs. These effects would in turn provide insight into the endogenous function of ICR. We thus surveyed spatial tuning properties of apical and basal dendrites, with respect to their cognate soma, in individual Pdzd8 WT and WT CA1PNs. Because optogenetically-induced PFs represented only a fraction of those observed across all four days (Fig. 2, A and B), and induced PFs shared similar characteristics with spontaneous PFs (fig. S4E–G), we initially analyzed PFs regardless of their location relative to prior LED stimulation. In Pdzd8 WT cells with augmented ICR, both apical and basal dendritic activity showed increased overall spatial tuning (Fig. 2C, see Methods). Pdzd8 WT apical and basal ‘place dendrites’, i.e. dendrites in which PFs were detected, fired more reliably upon the animal’s traversal of their PFs (Fig. 2D) while basal place dendrites fired more selectively within their PFs (Fig. 2E). Increasing the cytosolic impact of ICR did not significantly affect any measure of somatic spatial tuning (Fig. 2, C–E). This is consistent with the previous finding that increased within-field basal dendritic activity does not portend increased CA1PN somatic activity (41) but may also be due to relatively low sample sizes for somatic ROIs; all three metrics in Fig. 2, C–E trended higher for Pdzd8 KO CA1PN somata. In conclusion, while augmenting the cytosolic impact of ICR does not affect measures of baseline Ca2+ handling or excitability (figs. S6 and S7), the same manipulation promotes feature selectivity in CA1PN apical and basal dendrites.
Fig. 2. Effect of augmented ICR on somatic and dendritic spatial tuning properties in single CA1PNs.
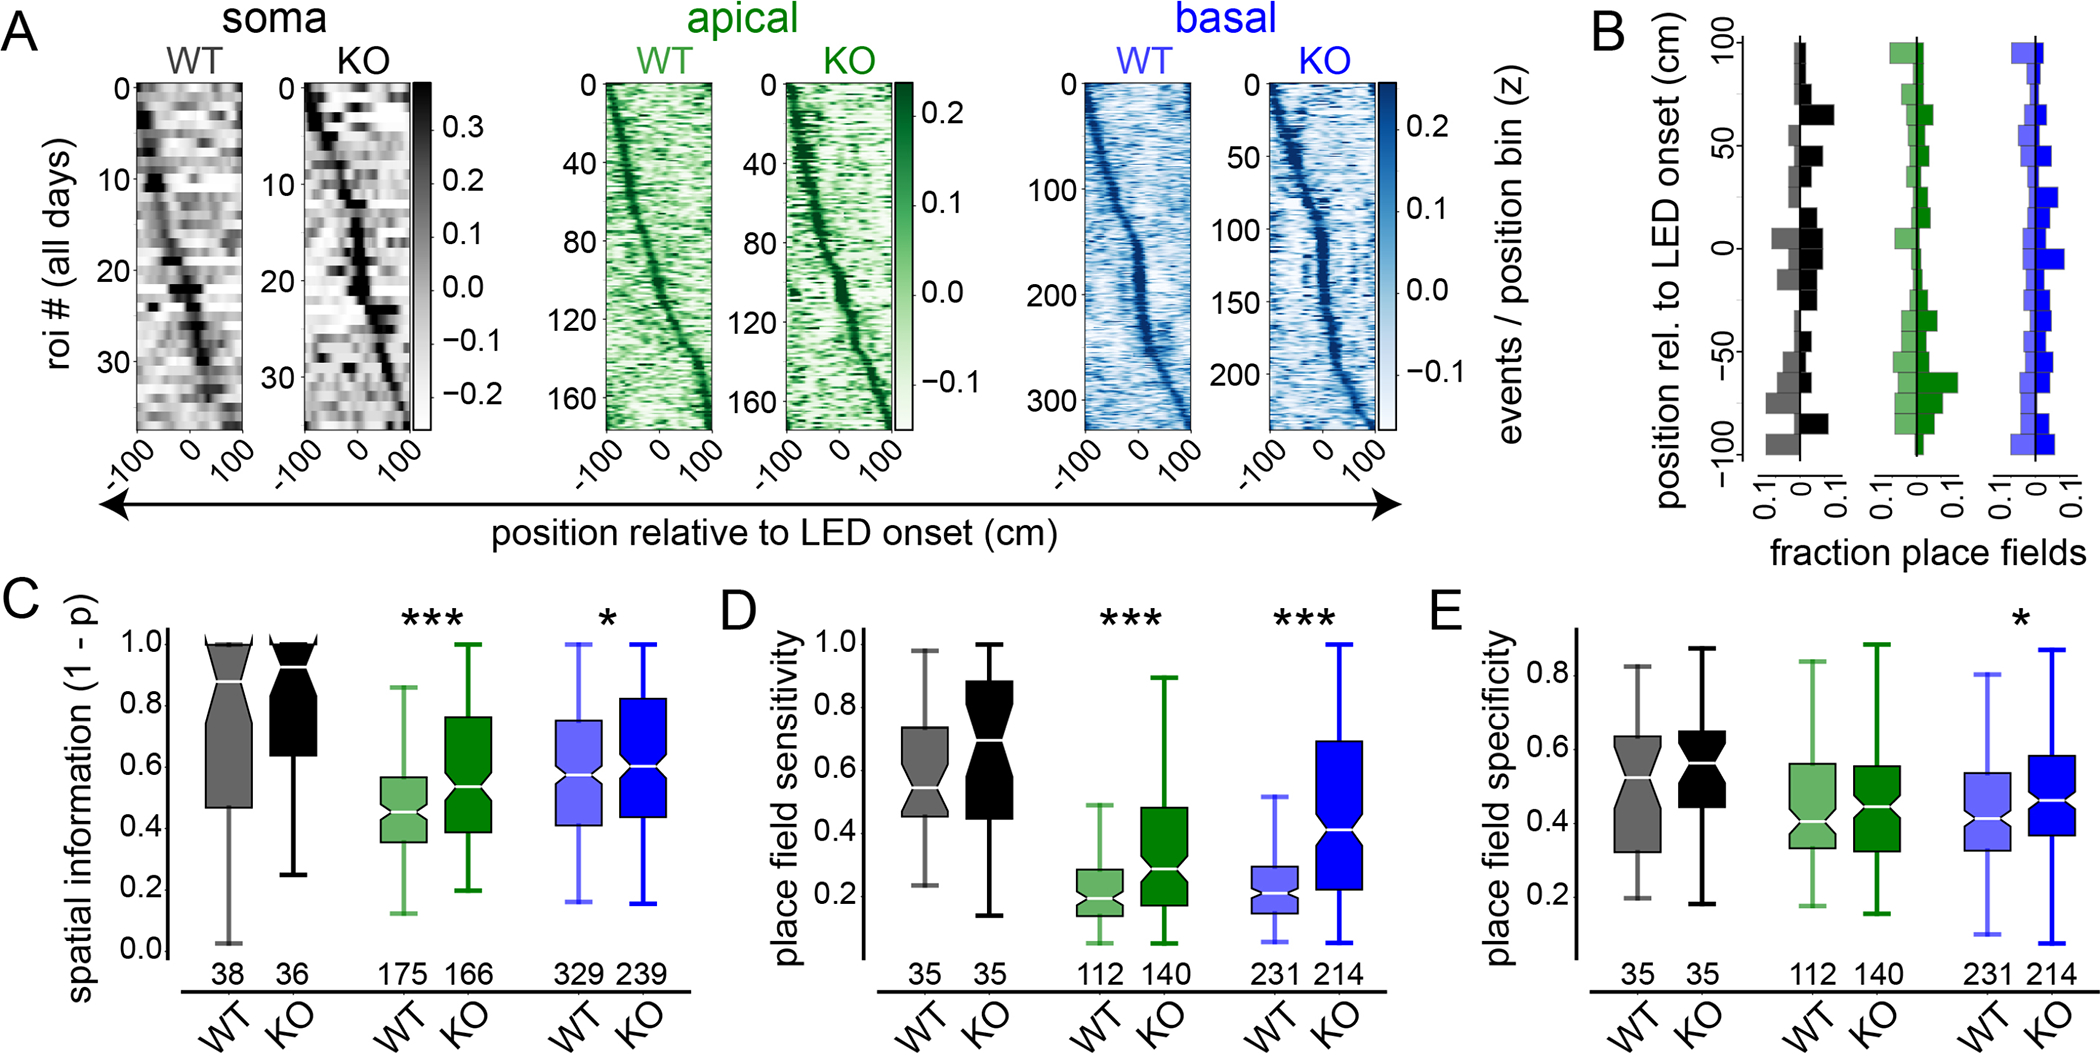
(A) Spatial activity heatmaps showing LED-centered spatial tuning curves for all Pdzd8 WT and WT somatic (greys), apical (greens), and basal (blues) ROIs imaged across all days, sorted by tuning curve peak location. (B) Mirrored vertical histograms showing distribution of place field (PF) center locations relative to LED onset for Pdzd8 WT (transparent; left of x-axis) and WT (opaque; right of x-axis) for somatic, apical, and basal ROIs color-coded as in (A). (C-E) PF metrics, including spatial information (C), PF sensitivity (D), and PF specificity (E), shown for all ROI type-genotype combinations. Boxes range from lower to upper quartiles with line at median; whiskers show range of data within 1.5 * (Q3 - Q1) of box boundaries. For panels (A-C), N represents total number of ROIs imaged across days (see Table S1 and Methods for details). For panels (D, E), N represents total number of ROIs with significant spatial tuning across days. Two-sided unpaired t-tests and Mann-Whitney U tests were used. p < 0.05*, 0.001***.
We next tested whether ICR influences the distribution of dendritic spatial tuning preferences (Fig. 3A). Augmenting ICR by Pdzd8 WT significantly increased the correlation of spatial tuning curves (TCs) among connected apical dendritic branches (Fig. 3B, see fig. S8 for illustration of analytic approach) as well as between apical dendrites and their soma (Fig. 3C). TC correlations were unaffected in basal dendrites, although we note that WT basal dendrites already displayed high dendrite-dendrite and dendrite-soma correlations which may have led to a ceiling effect (Fig. 3, B and C). To exclude dendrites that exhibited minimal spatial tuning to begin with, we next restricted our analysis to place dendrites that belonged to place cells and calculated the minimum circular distances along the cued belt that separated each dendritic PF from that of its soma. This analysis revealed a previously unappreciated degree of heterogeneity in spatial tuning preference among WT apical dendrites relative to their somata and, in contrast, a clear tendency toward somatic co-tuning in WT basal dendrites (Fig. 3D). Moreover, increased ICR was associated with a significant shift in apical dendritic PFs toward those of their soma; Pdzd8 WT apical dendrites were as co-tuned to their soma as were WT basal dendrites (Fig. 3D). Consistent with the observation that Pdzd8 KO selectively affected apical dendrite TC correlations (Fig. 3, B and C), Pdzd8 WT did not affect basal dendrite-soma co-tuning (Fig. 3D). Dendritic PF specificity did not attenuate with increasing soma-dendrite PF distance (fig. S9) and apical PFs in Pdzd8 WT CA1PNs displayed increasing specificity the more anti-tuned they were with their somatic PFs (fig. S9A, right). Additionally, neither branch order nor path length predicted dendrite-soma co-tuning (Fig. 3E). Finally, we formally tested the extent of dendrite-soma co-tuning by training a regularized linear model to predict somatic TCs based on those of connected dendrites (Fig. 3F, see Methods). This model revealed that apical dendrites with augmented ICR markedly outperformed WT apical dendrites in predicting their somatic TCs while the same manipulation caused basal dendrites to marginally underperform (Fig. 3G).
Fig. 3. Compartment-specific regulation of dendrite-dendrite and soma-dendrite co-tuning by ICR.
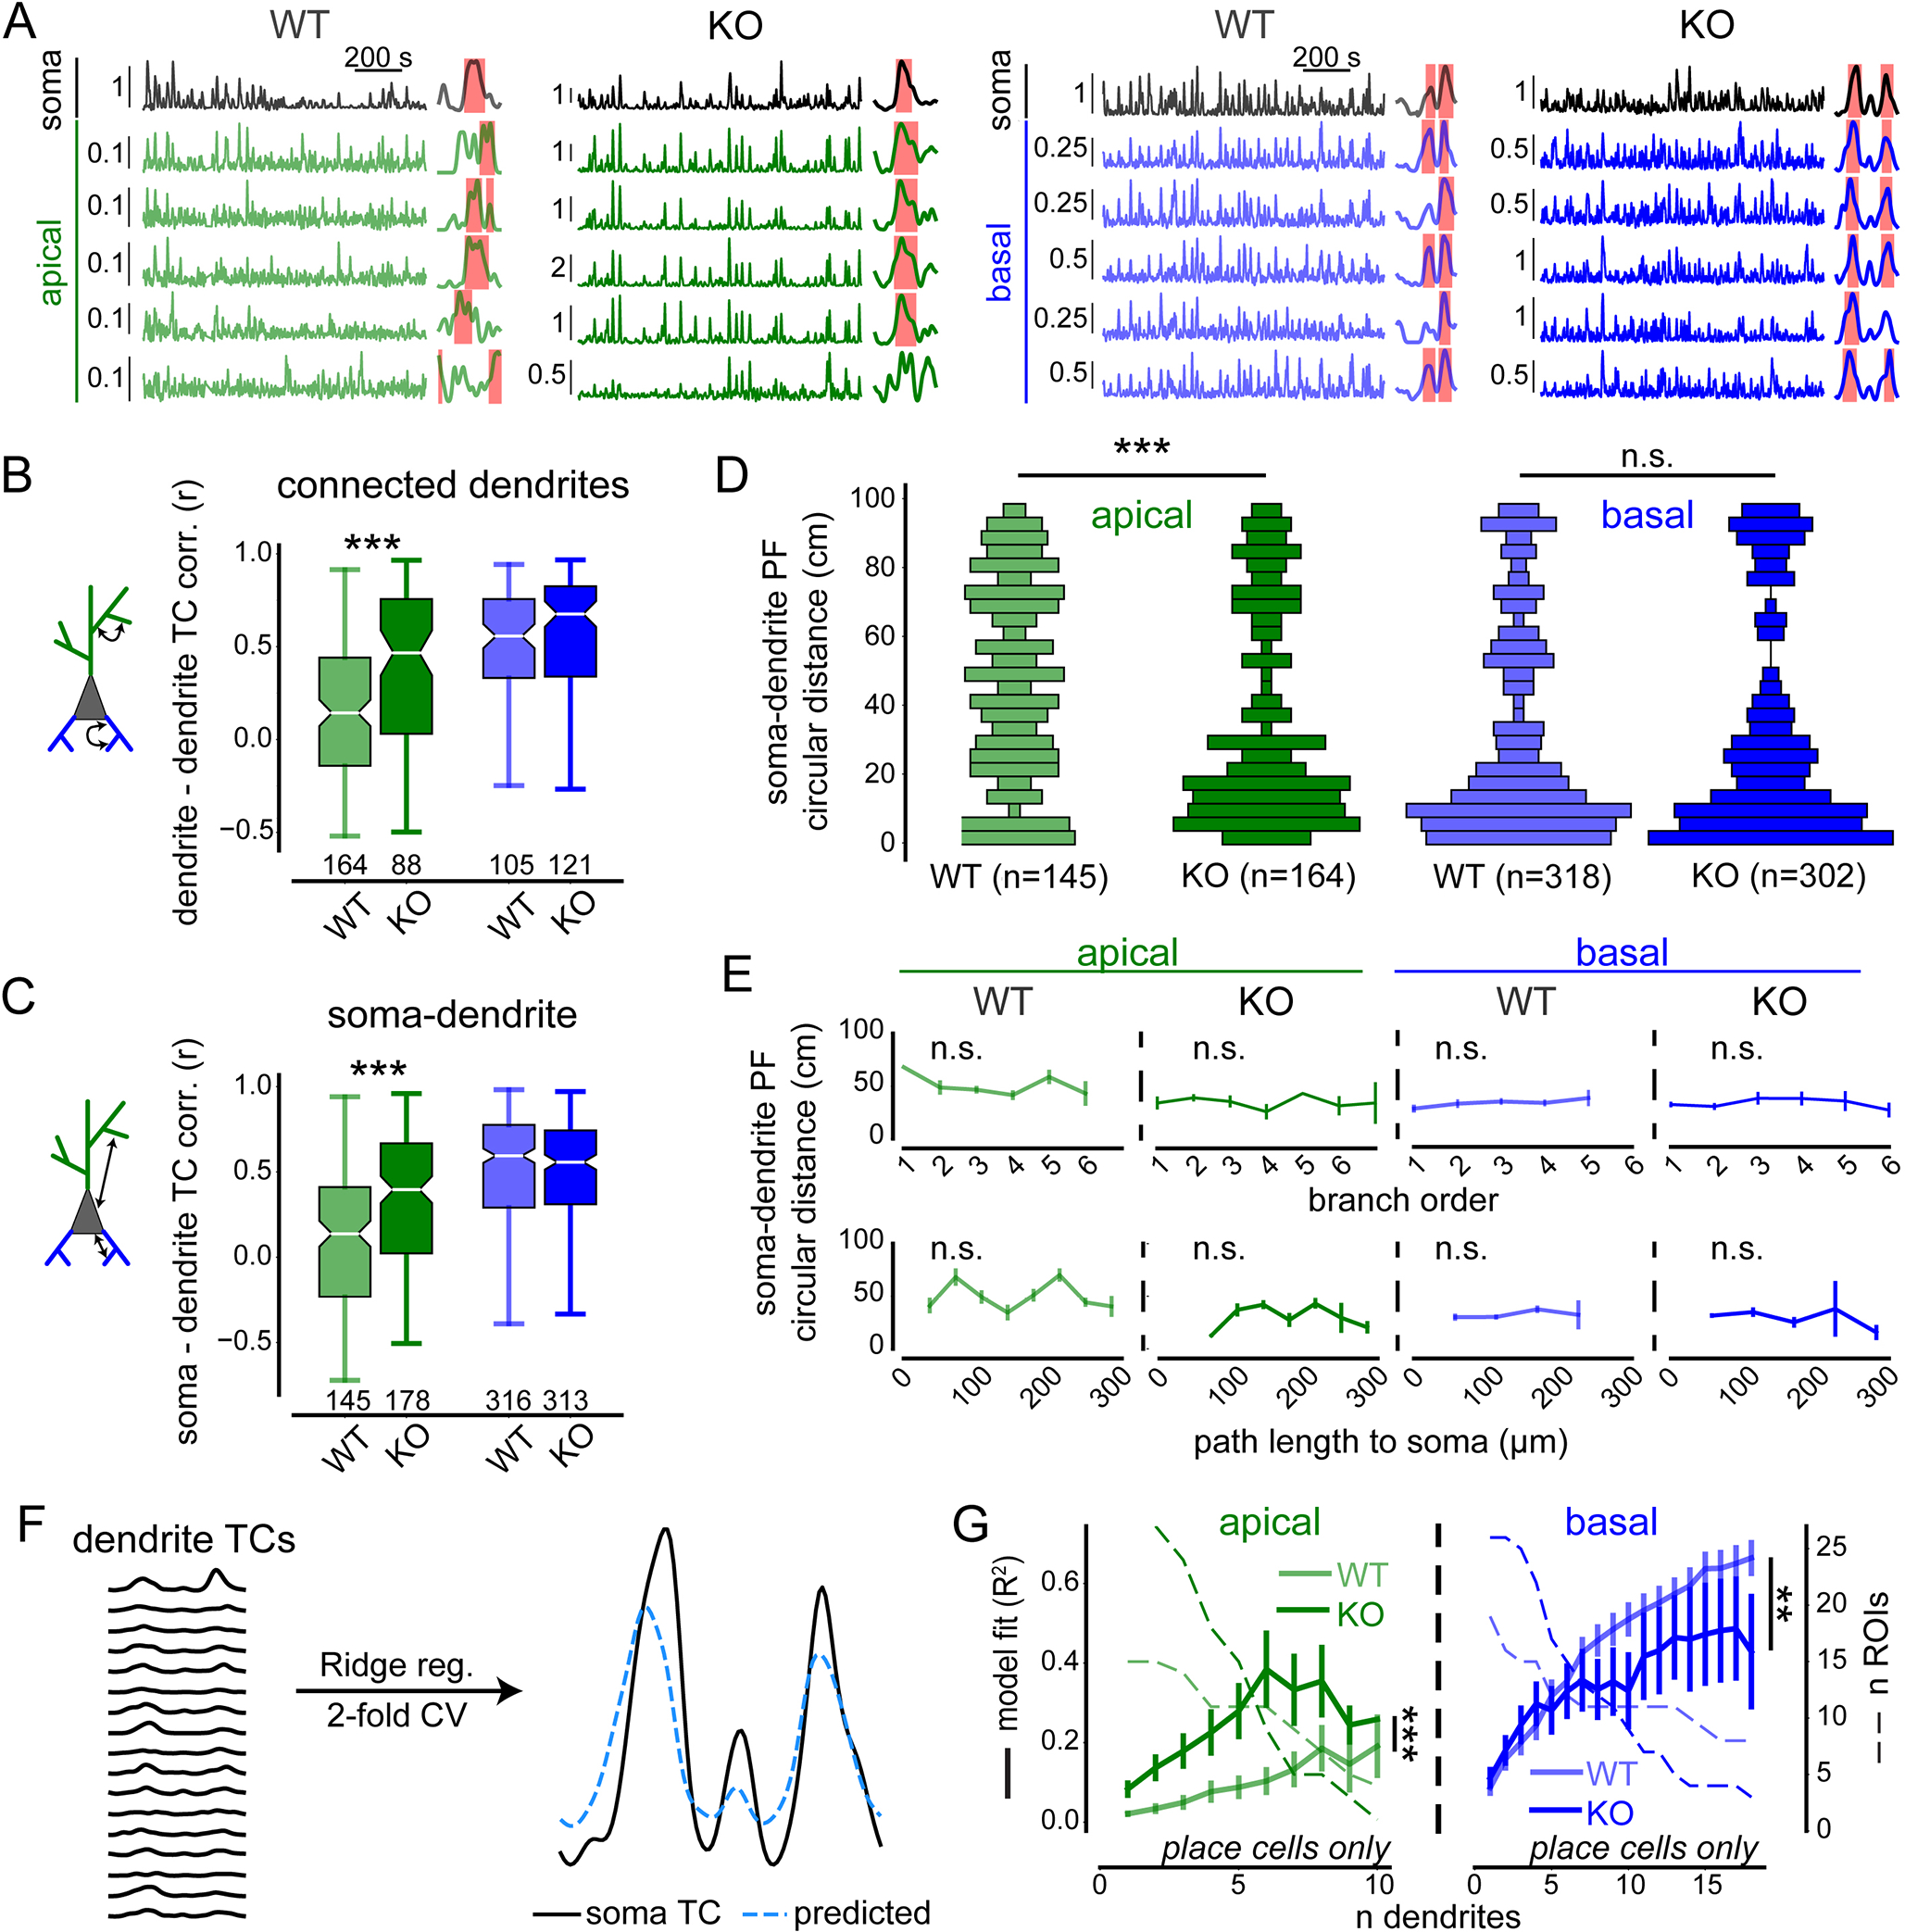
(A) Example dF/F0 traces and tuning curves (TCs) for all ROI type-genotype combinations. Vertical scale bars indicate dF/F0. Dendritic traces and TCs are grouped under corresponding somata. Detected PFs are denoted by pink shaded areas overlaid onto TCs. (B-C) TC correlations calculated exclusively between connected, co-imaged dendrites (B, see fig. S8) and between dendritic ROIs and their corresponding somata (C). Ns represent total number of ROIs imaged across days (Table S1). Boxes range from lower to upper quartiles with line at median; whiskers show range of data within 1.5 * (Q3 - Q1) of box boundaries. (D) Vertical histograms showing distributions of minimum circular distances between somatic and dendritic place field (PF) centers. Bar widths represent relative abundance of bin values. Ns represent total PFs from imaged dendrites belonging to place cells across days. (E) Circular distances in (D) plotted against branch order (top) and path length to soma binned every 40 μm (bottom). Spearman correlation analysis was used on non-binned data. (F) Schematic for predicting somatic TC based on TCs of connected dendrites (see Methods) with example performance shown at right. (G) Model performance (R2), plotted against the number of dendrites included in training data. Number of cell-sessions containing N dendrites shown in dashed lines on second y-axis. Note, measurement precision decreases with N. Apical 2-way ANOVA, genotype effect: F1,43 = 37.39, p < 0.001); n dendrites effect: F9,217 = 4.57, p < 0.001; interaction: F9,217 = 0.81, p > 0.05; n = 16 WT and 28 WT place cells. Basal 2-way ANOVA, genotype effect: F1,44 = 7.35, p < 0.01; n dendrites effect: F17,387 = 13.44, p < 0.001; interaction: F17,387 = 1.05, p > 0.05; n = 19 WT and 26 WT place cells. Error bars represent SEM. Distributions in (B-D) were compared using two-sided unpaired t-tests and Mann-Whitney U tests. p < 0.01**, 0.001***.
ICR differentially shapes the subcellular distribution of spatial tuning within single apical and basal dendritic segments
Our results show that the amount of Ca2+ released from ER into the cytosol influences CA1PN dendritic spatial tuning in vivo, but how does the extent of ICR fit into plasticity mechanisms underlying hippocampal feature selectivity? The presence of ER in dendritic spines positively predicts spine head size (8), suggesting a role for ICR in spine structural plasticity. In vitro experiments support such a role (44–46) and further suggest that the spread of ICR along a dendritic branch in part determines which spines will undergo synaptic plasticity (47, 48). Therefore, the spatial extent of ICR along a dendritic branch may ultimately influence local integrative properties underlying dendritic spatial receptive fields in vivo. We asked how increasing the cytosolic impact of ICR would influence activity and feature selectivity within single dendrites, i.e. across nearby dendritic spines. We subdivided dendritic ROIs into 2-micron segments (“subROIs”) and re-extracted, processed, and analyzed subROI signals (Fig. 4A). To account for within-dendrite differences in focality, we normalized activity measures to static mRuby3 signal intensity (see Methods). Variability in overall activity levels between subROIs was selectively reduced in Pdzd8 KO apical dendrites (Fig. 4B). Next, we asked whether increasing ICR alters spatial features of isolated Ca2+ transients along individual dendritic segments (Fig. 3C, see fig. S10A for additional examples). Indeed, genetic amplification of ICR increased the spread of isolated Ca2+ transients specifically in apical dendrites (Fig. 4D, fig. S10, B–E, see Methods).
Fig. 4. Intracellular Ca2+ release shapes activity dynamics and spatial feature selectivity within single dendritic branches of CA1 PNs.

(A) Approach to analyze intradendritic dynamics. Each ROI is segmented into 2-μm subROIs along its longest axis. Signals are then re-extracted from each subROI for further analysis. Heatmap shows activity distribution for each imaged apical dendrite from a single WT CA1PN. Activity is normalized within-ROI to static mRuby3 signal intensity (log2 ratio) to control for differences in focality (see Methods). (B) Within-dendrite variance of activity levels between WT and Pdzd8 WT apical and basal dendrites (log2 ratio of coefficients of variation for events and mRuby3 signal intensity). (C) Spatial spread of isolated Ca2+ transients within single dendrites. For each Ca2+ transient detected from a whole-dendrite ROI (red traces), corresponding dF/F0 signals are plotted from the first 6 subROIs (12 μm) of that dendrite. (D) Normalized intradendritic spread of isolated Ca2+ transients within WT and Pdzd8 WT apical and basal dendrites. A value of 1.0 indicates uniform subROI peak amplitudes (see Methods). (E) SubROI spatial tuning curves (TCs), color-coded as in (C). (F) Intradendritic TC correlations plotted as a function of distance separating two subROIs (see Methods). Spearman correlation coefficients are shown on plots. Distances were compared between genotypes using Mann-Whitney U tests. N = 110 WT and 100 WT place-apicals; 223 WT and 184 WT place-basals. Error bars represent SEM. Boxes range from lower to upper quartiles with line at median; whiskers show range of data within 1.5 * (Q3 - Q1) of box boundaries. Distributions in (B and D) were compared using two-sided unpaired t-tests. ***p < 0.001.
Finally, we calculated TC correlations between all possible combinations of subROIs and asked how co-tuning varied between subROIs as a function of the anatomical distance separating them along the dendritic arbor (Fig. 4E). Both apical and basal WT dendrites showed a monotonic decrease in intradendritic TC correlation with distance within single dendritic branches (Fig. 4F). It has been previously suggested (16, 49–52), and recently demonstrated (53), that feature-correlated inputs are spatially clustered along individual CA1PN dendrites. We note that the distance-dependent drop-off in TC correlations we observe in dendrites of WT CA1PNs corresponds with the reported distance along which presynaptic inputs were reported to cluster: ~10 μm (53). Given the relatively low sensitivity of genetically-encoded Ca2+ indicators (GECIs) such as jGCaMP7b (54), we took this correspondence to indicate that intradendritic GECI signals can provide meaningful insight into how spatially-modulated presynaptic inputs are integrated postsynaptically. Similarly analyzing spatial tuning within dendrites of Pdzd8 WT CA1PNs, we found that increasing ICR strengthened intradendritic TC correlations in both compartments and erased the distance-dependent drop-off in TC correlations specifically within apical dendrites (Fig. 4F).
ICR strengthens dendritic feature selectivity and stabilizes output-level receptive fields
CA1 place cells can gain, lose, remap, or retain their spatial tuning properties. Exposure to a new environment promotes PF formation and remapping (39, 55) while, upon repeated exposure to the same environment, subsets of cells stably represent specific locations (38, 56, 57). Given the role of ICR in controlling the spatial extent of feature selectivity within and across dendrites, and in promoting reliability in dendritic PFs, we tested how these input-level PF properties ultimately influence output-level, i.e. somatic, spatial tuning over days. To assess the relative stability of CA1PN spatial tuning over days, we restricted our analysis to activity dynamics within a nominal ‘LED zone’ centered around the location of LED onset during our optogenetic induction protocol (Fig. 5, A–C). We longitudinally tracked somatic activity in the same environment across 72 hours and assessed dendritic activity specifically on day 0 (see Methods). Since PF formation requires both pre- and postsynaptic activity and only a subset of synapses should receive excitatory presynaptic input at the time of postsynaptic optogenetic stimulation, we expected to induce a fraction of dendrites. Still, dendrites of CA1PNs with augmented ICR were more likely to display optogenetically-induced spatial tuning (fig. S11A), revealing a role for ICR in the establishment of dendritic feature selectivity. To measure the strength of induced spatial tuning, we focused specifically on ROIs that were successfully induced (see Methods). We first accounted for cell-to-cell differences in plasmid expression, excitability, and/or focality by normalizing dF/F0 from each ROI to its peak LED response. We then quantified induced PF strength based on post-induction activity near the location of LED onset relative to a baseline measurement (Fig. 5C).
Fig. 5. Dendritic strength and somatic stability of optogenetically-induced place fields in single WT and Pdzd8 KO CA1PNs.

(A) Paradigm for optogenetic place field (PF) induction as in Fig. 1D. (B) Traces showing LED-evoked and naturally-occurring activity in simultaneously acquired somatic, apical, and basal jGCaMP7b traces from a single CA1PN with relative animal position (rel. pos.) plotted below. LED stimulation during induction laps indicated by red ticks. (C) Quantifying strength of induced spatial tuning. Top: Mean somatic dF/F0 by position from baseline, induction (stim), and post laps for an induced cell with baseline and post activity shown as mean ± SEM and induction laps shown individually. Red dashed line indicates LED onset and green shaded area denotes “LED zone” used for quantifying induced activity. Bottom: Quantification of induced PF strength. Signals are normalized to max LED response to control for cell-to-cell variability in jGCaMP7b expression level, excitability, and/or focality. (D) Apical and basal induced PF strength for successfully induced dendrites of WT and Pdzd8 WT CA1PNs on day 0. Two-sided unpaired t-tests were used. (E) Somatic induced PF strength of successfully induced CA1PNs across days. Mixed effects model with post-hoc t tests, genotype effect: F1,16 = 7.80, p < 0.05; time effect: F3,46 = 10.85, p < 0.001; interaction: F3,46 = 0.32, p > 0.05. p < 0.05*, 0.01**, 0.001***. Error bars and shaded error bands indicate SEM.
Both apical and basal dendrites of Pdzd8 KO CA1PNs displayed stronger induced PFs on Day 0 (induction day, Fig. 5D). While Pdzd8 KO cell bodies did not show significantly stronger PFs on Day 0 relative to WT cells, consistent with our observation that increased dendritic spatial tuning did not significantly translate to output-level PFs (Fig. 2, C–E), induced somatic PFs were more stable over days (Fig. 5E). We considered that possibility that backpropagating action potentials (bAPs) might explain the appearance of strong dendritic PFs in Pdzd8 KO CA1PNs. If the soma of a Pdzd8 WT CA1PN fires more robustly near the LED zone, then somatic action potentials may more effectively invade the dendritic arbor and drive increased voltage-dependent Ca2+ influx from the extracellular space (58). However, dendritic place fields were stronger in Pdzd8 WT CA1PNs on Day 0, when somatic PF strengths were similar (Fig. 5, D and E). Additionally, dendritic proximity to soma does not predict soma-dendrite co-tuning (Fig. 3E). Therefore, we conclude that induced dendritic PF strength is not contaminated by bAPs in our measurements and reflects the degree of local spatial tuning.
ICR shapes place field formation and stabilizes population-level spatial representations
To more rigorously assess the impact of increasing ICR on output-level feature selectivity, and to do so in the context of naturally-occurring spatial tuning, we imaged large, intermingled populations of Pdzd8 KO and WT CA1PN cell bodies (Movie 2, see fig. S12D, Methods for classification strategy) as mice navigated a familiar cued treadmill belt over five consecutive days (Fig. 6, A–C). ROIs were registered across days for longitudinal monitoring of activity dynamics and spatial tuning (Fig. 6C, bottom; fig. S12). Across two signal extraction and neuropil decontamination approaches, Pdzd8 WT and WT CA1PNs did not consistently differ in basic Ca2+ transient properties or baseline GCaMP6f fluorescence levels (fig. S13). This large-scale, population-level analysis uncovered minor but significant changes in somatic PF properties (fig. S14, A–D) that were not detectable with soma sample sizes in single-cell experiments (Fig. 2, C–E). Consistent with optogenetic PF induction experiments (Fig. 5), somatic TCs of Pdzd8 WT place cells were more stable day-to-day relative to WT control place cells (fig. S14G).
Movie 2.
Population GCaMP6f dynamics in CA1 pyramidal layer during random foraging spatial navigation as in Fig. 6. Frames are motion-corrected and shown at actual speed. Data acquired using 2-photon microscopy with a 16X objective lens at 1.2X optical zoom.
Fig. 6. Large-scale, mixed population imaging of WT and Pdzd8 KO CA1PNs implicates intracellular Ca2+ release in formation and stability of output-level feature selectivity.

(A) Viral strategy. AAV encoding mCherry-Cre fusion protein is injected days before GECI-encoding AAV at low volume to allow for recombination/protein clearance and robust mCherry signal. (B) Signals are acquired at 16X (1.2 – 1.5X optical zoom) during a head-fixed spatial navigation paradigm with randomly located reward. Identical fields of view (FoVs) are imaged across 5 consecutive days (see fig. S12). N = 2,719 WT and 3,260 WT cells from 6 mice. (C) Top: FoVs showing GCaMP6f (left) and mCherry-Cre (middle) expression with overlay (right). Scale bar 100 μm. Bottom: GCaMP6f traces from the same Pdzd8 WT (magenta) and WT (green) ROIs imaged on separate days. Vertical scale bar represents dF/F0. (D) Plot showing automated detection of de novo PF formation event. Top: deconvolved events (black ticks) plotted by lap number and position along cued belt. Red dashed line and arrow indicate detected formation lap with PF bounds shaded in cyan. Bottom: TC for above raster plot with PF shaded in cyan. (E) Rates of de novo PF formation over days for all place cells. 2-way ANOVA with post-hoc t tests, genotype effect: F1,1808 = 0.72, p > 0.05; time effect: F4,7806 = 46.88, p < 0.001; interaction: F4,7806 = 3.16, p < 0.05. (F) Tuning curve correlations (TC corrs) over days from Pdzd8 WT and WT CA1PNs that displayed de novo place field formation events, relative to the day of formation. 2-way ANOVA with post-hoc t tests, genotype effect: F1,673 = 24.78, p < 0.001; time effect: F3,2016 = 3.36, p < 0.05; interaction: F3,2016 = 0.99, p > 0.05. (G) Mean, post-formation tuning curves from all detected de novo events, aligned to where place fields were initially formed (see Methods). (H) Left: Example Pdzd8 WT (green) and WT (magenta) post-formation tuning curves (solid line) overlaid onto tuning curve from formation lap (dashed line). Right: Quantification of peak shift, i.e. distance between peaks of formation and post-formation tuning curves. N = 350 & 369 formation events from Pdzd8 WT and WT CA1PNs, respectively. CA1PNs with multiple place fields were excluded from analysis. (I) Relationship between peri-formation velocity and resultant PF width for Pdzd8 WT (green, N = 366) and WT (magenta, N = 373) events across 6 mice. Left: Scatter plot of all events. Right: Least squares linear fits of data shown on left with corresponding slopes (m) (rWT = 0.33, p < 001; rKO = 0.41, p < 0.001). (J) Widths of all de novo place fields. Error bars represent SEM. Boxes range from lower to upper quartiles with line at median; whiskers show range of data within 1.5 * (Q3 - Q1) of box boundaries. Distributions were compared using two-sided unpaired t-tests and Mann-Whitney U tests. p < 0.05*, 0.01**, 0.001***.
One limitation of our single-cell imaging experiments is that their cross-subject design did not permit comparison of PF properties that closely correlate with animal behavior. PF width correlated with peri-formation velocity (fig. S4C) as previously reported (33) and the backward shift in PF peak activity (fig. S4D) that characterizes BTSP-mediated PF formation (33) covaried with these measures (fig. S11, B–E). Because imaging Pdzd8 WT and WT CA1PNs within-animal controlled for potential behavior-related biases, we sought to identify and compare naturally-occurring PF formation events from our mixed population data. To do this, we devised an automated PF formation detection approach specifically tailored to BTSP-like events (Fig. 6D and fig. S15A, see Methods). Augmenting ICR via Pdzd8 WT did not affect the rate of PF formation across days (Fig. 6E). By assessing place cell tuning curves relative to the date of PF formation, we again observed that Pdzd8 WT stabilized spatial tuning curves of newly-formed PFs over days (Fig. 6F). We next assessed PF peak shifts by aligning post-formation TCs to the location of PF formation (Fig. 6G, see Methods). In contrast to WT control CA1PNs, which displayed the backward shift previously established (33) and observed in single-cell optogenetic PF induction experiments (fig. S4D and fig. S11E), Pdzd8 KO CA1PNs with augmented ICR showed no discernable post-formation shift on average (Fig. 6H, see fig. S15B for additional examples). Finally, while PF width correlated with peri-formation velocity in both populations, Pdzd8 WT CA1PN PF widths increased more sharply with velocity and exceeded those of WT control CA1PNs on the whole (Fig. 6, I and J).
Discussion
We found that release of Ca2+ from the endoplasmic reticulum plays a key role in synaptic plasticity mechanisms underlying dendritic receptive field formation, regulating feature selectivity at multiple levels of organization; from intra- and inter-dendritic levels to dendrite-soma co-tuning. These dendritic functions coalesce to govern multiple properties of output-level spatial tuning. The combination of approaches we developed offers new insights into how ICR participates in PF formation. Based on the impact of increased ICR on two PF characteristics that are specifically influenced by animal behavior during plasticity induction, PF width and peak shift, we conclude that ICR plays a significant role in the emergence of cellular feature selectivity in the hippocampus. Consistent with its dependence on voltage-gated Ca2+ entry (59), ICR appears to operate downstream of plateau potential initiation: somatic PF stability was improved both in spontaneously-occurring as well as optogenetically-induced PFs in which plateau potentials and their associated global Ca2+ influx (32, 60) are obviated by direct optogenetic depolarization.
It may seem counterintuitive that the spread of ICR would be important if plateau potentials (or optogenetic stimulation) already involve global Ca2+ influx from the extracellular space. However, voltage-gated influx of extracellular Ca2+ associated even with high degrees of spiking exerts a minor impact on [Ca2+]i relative to ICR (10, 14). Consistent with the high threshold for ICR engagement (5, 10–13, 59), Pdzd8 deletion did not alter basic excitability or Ca2+ handling properties that might otherwise have obfuscated interpretation of GECI signals. Therefore, altered ICR alone is unlikely to account for our observations. Rather, we propose that augmented ICR lastingly modifies dendritic integrative properties and that we observe these effects using GCaMP to monitor voltage-dependent influx of extracellular Ca2+.
The widening of Pdzd8 WT PFs specifically in the forward direction suggests that a prolonged the ICR-driven Ca2+ signal potentiates more dendritic spines receiving input after plateau potential onset. Consistent with a broadening of potentiated inputs, we find that spatial tuning preferences are more uniform within single apical dendritic segments. It was recently established that feature-correlated presynaptic inputs are spatially clustered along CA1PN dendrites, i.e. that neighboring spines tend to receive input corresponding to similar sensory experiences (53). We observed a postsynaptic vestige of this phenomenon in WT dendritic segments: intradendritic TC correlations systematically decreased with intervening distance. This drop-off began after approximately 10 μm: the same distance across which correlated presynaptic inputs were found to cluster. The fact that augmenting ICR abrogated this distance-dependent decorrelation in apical dendrites and widened output-level PFs additionally suggests that the diffusion of ER-released Ca2+ along a dendritic shaft may influence the number of spines co-potentiated during plasticity induction. While previous in vitro studies directly support such a model (47, 48), ICR may also regulate intradendritic spatial tuning via branch-specific plasticity of dendritic excitability (61). In addition to broadening the anatomical distribution of dendritic feature selectivity, increasing ICR also strengthens spatial tuning: dendritic and somatic PFs are more specific and sensitive while somatic PFs are also more durable over time in the face of constant representational turnover within CA1 (38, 62). Finally, the dramatic impact of increasing ICR on dendrite-dendrite and soma-dendrite co-tuning, again specifically within the apical arbor, indicates that ICR operates on multiple spatial scales (12, 13, 19) to shape output-level receptive fields.
A role for ICR in the emergence of feature selectivity is further supported by the velocity-dependent nature in which augmenting ICR widened PFs. CA1PN synapses require temporally-correlated pre- and postsynaptic activity to undergo plasticity (33, 60, 63). Higher running speeds positively modulate the rate of presynaptic input onto CA1PNs (64, 65) and thus increase the pool of synapses eligible for potentiation during PF formation in vivo, hence the velocity-PF width relationship (33). Therefore, while unperturbed ICR may reach and potentiate most eligible inputs at lower velocities, increased ICR would be predicted to more comprehensively engage larger pools of eligible connections generated during bouts of increased running speed. We acknowledge that normative statements regarding ICR function are difficult to make based on a gain-of-function manipulation. However, our mild, ~50% augmentation (9) of intracellular Ca2+ concentrations ([Ca2+]i) associated with ICR may well fall within the range of physiological variability as the magnitude of individual ICR events is known to vary according to a number of factors (10, 12, 13, 16, 59, 66, 67). Therefore, while we acknowledge that our findings pertain to one specific plasticity mechanism underlying place field formation, we propose ICR magnitude, as regulated by ER-mitochondria contact sites (9), as a general mechanism influencing the distribution of synaptic plasticity induction in vivo.
Independent of ICR, we found that apical dendrites of CA1PNs possess a great deal of functional autonomy from the soma. Apical CA1PN dendrites have been the subject of extensive in vitro research due to their presumed central role in hippocampus-dependent learning but their in vivo activity had remained elusive. The broadly distributed tuning preferences observed across apical dendrites in single WT CA1PNs could not be explained by path length from soma or by branch order, nor did soma-basal dendritic co-tuning track with these morphological properties. This is consistent with a prior observation that co-firing between basal dendrites and their soma does not depend on intervening distance (41) and indicates that somatic AP backpropagation does not appreciably influence soma-dendrite co-tuning, at least across the relatively broad ranges of branch order and path length that we sampled. Nor were anti-tuned dendritic PFs of lesser quality: PF specificity did not track with the degree of soma-dendrite co-tuning. Therefore, similar to pyramidal neurons of various sensory cortices (59–61), CA1PNs are able to integrate diverse dendritic tuning preferences into single, clean receptive fields. How this aspect of feature selectivity emerges remains poorly understood.
In contrast, basal dendrites showed stronger correlation with somatic tuning. This may be due to a true biological difference between apical and basal dendrites of CA1PNs. Alternatively, somatic action potentials may invade basal dendrites more efficiently as their relatively closer proximity to the soma would mitigate distance-dependent attenuation of bAPs (58). In this case, correlated voltage-dependent Ca2+ influx from the extracellular space would indeed be expected. However, given that soma-dendrite co-tuning was predicted by neither branch order nor path length in either dendritic compartment, we propose that apical dendritic tuning is more decoupled from somatic tuning relative to basal and that ICR, as regulated by mitochondrial Ca2+ buffering, contributes to this functional compartmentalization. The compartment-specific nature of ICR’s role in plasticity intersects with the CA1PN input structure in a potentially powerful way. Given that apical and basal dendrites receive synaptic input from unique combinations of afferent circuits carrying distinct streams of information (68), compartment-specific action by ER may allow selected features of experience to preferentially influence learning.
Methods Summary
See Supplementary Materials for full materials and methods information.
Animals
All experiments were conducted in accordance with NIH guidelines and approval of the Columbia University Institutional Animal Care and Use Committee under protocols AC-AABF6554, AC-AAAX1460, and AC-AAAO0850. Animal health and welfare was supervised by a designated veterinarian. Columbia University animal facilities comply with all appropriate standards of care including cage conditions, space per animal, temperature, light, humidity, food, and water. Adult (≥ p60) male and female Pdzd8F/F and WT mice, fully backcrossed to C57Bl/6 genetic background, were used for all experiments. Authors are not aware of an influence of sex on the measures of interest to this study.
Plasmids
pCAG-Cre was generated in the Polleux lab as previously described (69). pAAV-CAG-FLEX-jGCaMP7b-WPRE was obtained from Addgene (#104497). pCAG-FLEX-eGFP was a gift from Anton Maximov (Scripps). pAAV-CaMKIIa-bReaChes-mRuby3 was subcloned from pAAV-CaMKIIa-bReaChes-EYFP (gift from Karl Deisseroth) by excising the EYFP sequence and replacing it with an mRuby3 fragment (cloned from pAAV-CAG-mRuby3-WPRE, Addgene #107744). pCAG-NES-jRGECO1a was generated by subcloning an NES-jRGECO1a insert (from pAAV-Syn-NES-jRGECO1a-WPRE, Addgene #100854) into a pCAG backbone. Subcloning was carried out using the In-Fusion cloning kit (Takara Bio).
Single-cell electroporation
To electroporate single CA1PNs with custom plasmid combinations, animals were head-fixed under a 2-photon microscope and anesthetized under a ketamine/xylazine mixture with continuous heat source. Sterile 1X PBS was used to make a grounded solution in the bowl-shaped dental acrylic cap atop the imaging implant. A pipette containing fluorescent plasmid solution was lowered at an angle using a motorized micromanipulator (Scientifica Ltd., UK) through the rectangular slit in the imaging coverslip and through the thin silicone protective layer while maintaining positive pipette pressure to avoid clogging. Once in the brain, the pipette was gradually lowered to the CA1 pyramidal layer (Fig. 1A, middle) while continuously expelling low amounts of fluorescent solution to aid visualization under 920 nm 2-photon excitation. As the pipette approached a putative CA1PN, tip resistance was used to monitor proximity. After a small deflection in resistance, and while maintaining positive pressure, a train of negative voltage pulses was delivered from a stimulus isolator (AMPI, Israel) to the amplifier headstage using a custom-made switch circuit. Successful electroporation was confirmed based on a cell filling with Alexa dye and retaining the dye after careful pipette retraction (Fig. 1A, middle). Plasmid DNA expression was checked 48 hours later. To ensure successful genetic knockout of Pdzd8 (fig. S1, A–F) and clearance of PDZD8 protein (fig. S1, G and H), imaging experiments were conducted no less than 7 days post-electroporation for either Pdzd8F/F or WT control mice. See Supplementary Materials and Methods for additional detail.
Animal behavior
Mice ran along a spatially-cued, 2-meter treadmill belt under ‘random foraging’ conditions in which water reward was delivered at a pseudorandom location once per lap. Initial delivery was non-operant and was followed by a 3-second period during which the animal could receive additional operant water reward by licking with a 50% reward rate. Mice were habituated on the same cued belts used for experiments for 1–2 days with training sessions under the in vivo imaging setup prior to data acquisition. For each mouse, the belt was never changed across days within a given experiment and was calibrated to the exact same length each day using a fixed landmark of blackout tape, an infrared beam, and custom software.
In vivo 2-photon Ca2+ imaging
All imaging experiments described in main figures were carried out using a 2-photon 8 kHz resonant scanning microscope (Bruker Corp, MA, US) equipped with a Chameleon Ultra II Ti:sapphire laser (Coherent Inc, CA, US), tuned to 920 nm for green wavelength excitation, and a Fidelity-2 (Coherent Inc) laser fixed at 1070 nm for red excitation. Excitation pathways were separately controlled and combined at the microscope. Green and red fluorescence were separated with an emission filter set (HQ525/70m-2p, HQ607/45m-2p, 575dcxr, Chroma Technology Corporation, VT, US) and collected using channel-dedicated GaAsP (7422P-40, Hamamatsu Photonics K.K., Japan) photomultiplier tubes (PMTs). A custom dual stage preamplifier (1.4 × 10⁵ dB, Bruker Corp) was used to amplify signals prior to digitization. For details on spine-level imaging experiments described in fig. S6, G–J and movie S1, see Supplementary Materials and Methods.
Single-cell optogenetic place field induction
Induction sessions constituted the first imaging day of each single-cell imaging experiment. Following a baseline period of 5 laps, a 1-second LED photostimulation was triggered at a fixed location along the treadmill belt for 5 consecutive laps. In the case where pre-existing somatic spatial tuning was evident (this was visually assessed offline prior to baseline periods), LED location was set to be as far away as possible from the existing putative place field (PF). To deliver LED photostimulation while simultaneously acquiring jGCaMP7b Ca2+ dynamics, 620 nm light from a C-mounted ultra-fast, ultra-high-powered LED (UHP-T-620-SR, Prizmatix Ltd., Israel) was passed through a dichroic mirror allowing red light to pass into the objective lens back aperture while deflecting emitted green photons to their dedicated PMT (Fig. 1B, left). The red channel used to acquire mRuby3 signals was manually switched off during photostimulation. LED was triggered by a custom “pockel-blanking” circuit that relayed an inverted Pockel cell blanking signal which was briefly activated during Y-galvonometer flyback periods and during toggling of the piezoelectric device. This approach allowed for high-powered (30 – 40mW at sample), pulsed LED stimulation during image acquisition while protecting PMTs from potentially saturating LED photons that might otherwise be incompletely deflected from the green collection channel given high LED power. Following optogenetic PF induction, the remainder of the 20-minute imaging session was used to acquire post-induction data. All cells were tracked for 72 hours except for two WT cells that died at the 72-hour mark (see Fig. 5E, table S1). Of the 16 induction experiments performed, all but 3 sessions involved one CA1PN. 2 WT experiments and 1 WT experiment involved two electroporated CA1PNs in the same field of view.
Detecting spontaneous place field formation events
To detect de novo PF formation events, we quantified the number of events falling within a search window (‘hits’) that corresponded to the PF bounds plus a forward extension of 20 cm to account for an expected backward shift in PF activity relative to formation location (33). We then used an N = 2 Gaussian mixture model (GMM) to initially differentiate between putative “PRE” and “POST” laps relative to PF formation. For each detected PF, the GMM was fit to a two-feature matrix with columns representing (1) a rolling average (weighted by Bartlett window) of hit counts by lap and (2) lap numbers multiplied by exponentially decaying weights. The GMM fit was randomly initiated 1,000 times for each PF and the best fit was taken. The PF was assumed to have existed prior to session start if (1) the model did not converge, (2) all laps were assigned to a single component, or (3) the mean hit/lap rate in PRE laps was greater than 1. These events were discarded. Next, we searched for a large Ca2+ transient (≥ 1 SD above mean amplitude) representing a putative PF-forming plateau potential. If a candidate transient was identified within 10 laps on either side of the first POST lap, the first such event was taken as the PF-forming event. If no such candidate event was identified, the putative de novo PF was discarded. To validate detected PF formation events, five conditions were imposed: (1) the same cell did not express an overlapping PF on the previous day, (2) the hits rates in PRE vs POST laps were significantly different by the Mann-Whitney U test, (3) the place cell fired within its PF on at least 1/3 POST laps, (4) place cell events showed at least 35% specificity to the PF after formation, and (5) the PF did not form earlier than lap 10 to further mitigate the possibility that it had formed prior to imaging. For each PF-forming Ca2+ transient, we documented the corresponding lap, 2-cm spatial bin, and the imaging frame at which the event reached peak amplitude for future analyses. See fig. S14A for example performance and Supplementary Materials and Methods for additional details and rationale.
Analyzing place field formation events
For optogenetically-induced PFs in single cells, an ‘LED zone’ was defined to operationalize what activity should be considered induced. The LED zone was defined as a symmetric window, with a 15 cm radius, centered on LED onset position (Fig. 5C, green shaded area) on a cued, 2-meter treadmill belt. For each induction experiment, spatial tuning heatmaps were calculated (as described in Supplementary Materials and Methods) based on pre-induction (baseline), peri-induction, and post-induction laps using dF/F0. Induction efficacy was calculated as the maximum difference between post-induction and baseline tuning curves within the LED zone. Baseline and post-induction tuning curves to the maximum observed LED response for a given ROI (Fig. 5C). An ROI was considered “induced” if its mean post-induction dF/F0 exceeded baseline dF/F0 in at least one position bin (50 4-cm bins were used) within the LED zone. Peri-formation velocity (figs. S4C; S11, B and D) was defined as the mean velocity observed from 1.5 s before and 1.0s after LED onset during the first induction lap. This temporal window was formulated to capture the bulk of the integral of the asymmetric plasticity kernel underlying BTSP (32). For spontaneously-occurring PF formation events in population imaging data, we adjusted our calculation of peri-formation velocity to accommodate the inherent uncertainty in estimating plateau potential onset times based on somatic GCaMP signals. Peri-formation velocity was calculated as the peak velocity within the spatial search window described above on the formation lap. See Supplementary Materials and Methods for additional details and rationale.
To calculate PF peak shifts, we increased the resolution of spatial bins to 0.5 cm (400 spatial bins per 2-m lap). Large, PF-forming Ca2+ transients were localized to the nearest 0.5 cm spatial bin based on the imaging frame corresponding to peak transient amplitude. Post-formation TCs were calculated from all laps subsequent to the formation lap within an imaging session. Peak shifts were defined as the distance between peaks of formation and post-formation TCs. Widths of de novo PFs were calculated using events from all laps.
Supplementary Material
Acknowledgments:
The authors thank Dr. S. Fusi for productive discussion regarding intradendritic dynamics, T. Tabachnik and Zuckerman Institute Advanced Instrumentation for design of a custom-threaded optics adaptor used to target virally-labeled cells for electrophysiological recordings, A. Villegas for assistance piloting an immunoassay to validate conditional knockout strategy, and Drs. A. Nelson and M. Rossi for their invaluable comments on the manuscript.
Funding:
National Institutes of Health grant R01MH100631 (AL)
National Institutes of Health grant R01NS094668 (AL)
National Institutes of Health grant U19NS104590 (AL)
National Institutes of Health grant R01NS067557 (FP)
National Institutes of Health grant R01NS094668 (FP)
National Institutes of Health grant F32MH118716 (JKO)
National Institutes of Health grant K00NS105187 (SAH)
National Institutes of Health grant F31MH117892 (SVR)
National Institutes of Health grant K99NS115984 (HB)
National Institutes of Health grant T32NS064928 (KCG)
JST, PRESTO grant JPMJPR16F7 (YH)
Zegar Family Foundation (AL)
Foundation Roger De Spoelberch (FP)
Footnotes
Data and materials availability:
All plasmid DNA constructs generated in the course of this study are publicly available at Addgene. Pdzd8F/F mice are available upon request for academic, non-commercial use. Data and code are available at https://github.com/JustinOHare/ICR_2022.
References and Notes
- 1.Greer PL, Greenberg ME, Neuron 59, 846–860 (2008). [DOI] [PubMed] [Google Scholar]
- 2.Stuart GJ, Spruston N, Nat Neurosci 18, 1713–1721 (2015). [DOI] [PubMed] [Google Scholar]
- 3.Häusser M, Spruston N, Stuart GJ, Science 290, 739–744 (2000). [DOI] [PubMed] [Google Scholar]
- 4.Nanou E, Catterall WA, Neuron 98, 466–481 (2018). [DOI] [PubMed] [Google Scholar]
- 5.Takechi H, Eilers J, Konnerth A, Nature 396, 757 (1998). [DOI] [PubMed] [Google Scholar]
- 6.Gray EG, Journal of anatomy 93, 420 (1959). [PMC free article] [PubMed] [Google Scholar]
- 7.Peters A, Neurons and their supporting cells, (1991). [Google Scholar]
- 8.Spacek J, Harris KM, Journal of Neuroscience 17, 190–203 (1997). [DOI] [PMC free article] [PubMed] [Google Scholar]
- 9.Hirabayashi Y et al. , Science 358, 623–630 (2017). [DOI] [PMC free article] [PubMed] [Google Scholar]
- 10.Nakamura T, Barbara J-G, Nakamura K, Ross WN, Neuron 24, 727–737 (1999). [DOI] [PubMed] [Google Scholar]
- 11.Nakamura T et al. , The Journal of Neuroscience 20, 8365–8376 (2000). [DOI] [PMC free article] [PubMed] [Google Scholar]
- 12.Nakamura T, Lasser-Ross N, Nakamura K, Ross WN, The Journal of Physiology 543, 465–480 (2002). [DOI] [PMC free article] [PubMed] [Google Scholar]
- 13.Larkum ME, Watanabe S, Nakamura T, Lasser-Ross N, Ross WN, The Journal of Physiology 549, 471–488 (2003). [DOI] [PMC free article] [PubMed] [Google Scholar]
- 14.Ross WN, Nakamura T, Watanabe S, Larkum M, Lasser-Ross N, Cellular and molecular neurobiology 25, 283–295 (2005). [DOI] [PMC free article] [PubMed] [Google Scholar]
- 15.Nishiyama M, Hong K, Mikoshiba K, Poo M-M, Kato K, Nature 408, 584–588 (2000). [DOI] [PubMed] [Google Scholar]
- 16.Lee KF, Soares C, Thivierge JP, Beique JC, Neuron 89, 784–799 (2016). [DOI] [PubMed] [Google Scholar]
- 17.Johenning FW et al. , PLoS biology 13, e1002181 (2015). [DOI] [PMC free article] [PubMed] [Google Scholar]
- 18.Bardo S, Cavazzini MG, Emptage N, Trends in pharmacological sciences 27, 78–84 (2006). [DOI] [PubMed] [Google Scholar]
- 19.Emptage N, Bliss TV, Fine A, Neuron 22, 115–124 (1999). [DOI] [PubMed] [Google Scholar]
- 20.Svoboda K, Mainen ZF, Neuron 22, 427–430 (1999). [DOI] [PubMed] [Google Scholar]
- 21.Rose CR, Konnerth A, Neuron 31, 519–522 (2001). [DOI] [PubMed] [Google Scholar]
- 22.Handler A et al. , Cell 178, 60–75.e19 (2019). [DOI] [PMC free article] [PubMed] [Google Scholar]
- 23.Sharp AH et al. , Journal of Neuroscience 13, 3051–3063 (1993). [DOI] [PMC free article] [PubMed] [Google Scholar]
- 24.Migliore M, Ferrante M, Ascoli GA, Journal of Neurophysiology 94, 4145–4155 (2005). [DOI] [PMC free article] [PubMed] [Google Scholar]
- 25.Andreasen M, Lambert JDC, The Journal of Physiology 507, 441–462 (1998). [DOI] [PMC free article] [PubMed] [Google Scholar]
- 26.Magee JC, The Journal of Neuroscience 18, 7613–7624 (1998). [DOI] [PMC free article] [PubMed] [Google Scholar]
- 27.Pyapali GK, Sik A, Penttonen M, Buzsaki G, Turner DA, Journal of Comparative Neurology 391, 335–352 (1998). [DOI] [PubMed] [Google Scholar]
- 28.Harnett MT, Makara JK, Spruston N, Kath WL, Magee JC, Nature 491, 599–602 (2012). [DOI] [PMC free article] [PubMed] [Google Scholar]
- 29.Spruston N, Nature Reviews Neuroscience 9, 206–221 (2008). [DOI] [PubMed] [Google Scholar]
- 30.O’Keefe J, Dostrovsky J, Brain research, (1971). [DOI] [PubMed] [Google Scholar]
- 31.O’keefe J, Nadel L, (Oxford: Clarendon Press, 1978). [Google Scholar]
- 32.Bittner KC et al. , Nat Neurosci 18, 1133–1142 (2015). [DOI] [PMC free article] [PubMed] [Google Scholar]
- 33.Bittner KC, Milstein AD, Grienberger C, Romani S, Magee JC, Science 357, 1033–1036 (2017). [DOI] [PMC free article] [PubMed] [Google Scholar]
- 34.Magee JC, Grienberger C, Annual review of neuroscience 43, 95–117 (2020). [DOI] [PubMed] [Google Scholar]
- 35.de Juan-Sanz J et al. , Neuron 93, 867–881.e866 (2017). [DOI] [PMC free article] [PubMed] [Google Scholar]
- 36.Danielson NB et al. , Neuron 91, 652–665 (2016). [DOI] [PMC free article] [PubMed] [Google Scholar]
- 37.Zaremba JD et al. , Nature neuroscience 20, 1612 (2017). [DOI] [PMC free article] [PubMed] [Google Scholar]
- 38.Ziv Y et al. , Nature neuroscience 16, 264–266 (2013). [DOI] [PMC free article] [PubMed] [Google Scholar]
- 39.Priestley JB, Bowler JC, Rolotti SV, Fusi S, Losonczy A, bioRxiv, 2021.2007.2002.450956 (2021). [Google Scholar]
- 40.Grienberger C, Magee JC, bioRxiv, (2021). [Google Scholar]
- 41.Sheffield ME, Dombeck DA, Nature 517, 200–204 (2015). [DOI] [PMC free article] [PubMed] [Google Scholar]
- 42.Sheffield MEJ, Adoff MD, Dombeck DA, Neuron 96, 490–504 e495 (2017). [DOI] [PMC free article] [PubMed] [Google Scholar]
- 43.Rolotti SV, Losonczy A, Cell Press Sneak Peak (under review). [Google Scholar]
- 44.Dittmer PJ, Wild AR, Dell’Acqua ML, Sather WA, Cell Reports 19, 321–334 (2017). [DOI] [PMC free article] [PubMed] [Google Scholar]
- 45.Holbro N, Grunditz Å, Oertner TG, Proceedings of the National Academy of Sciences 106, 15055–15060 (2009). [DOI] [PMC free article] [PubMed] [Google Scholar]
- 46.Dur-e-Ahmad M, Imran M, Gul A, Mathematical Biosciences 230, 55–66 (2011). [DOI] [PubMed] [Google Scholar]
- 47.Dittmer PJ, Dell’Acqua ML, Sather WA, Proceedings of the National Academy of Sciences 116, 13611–13620 (2019). [DOI] [PMC free article] [PubMed] [Google Scholar]
- 48.Finch EA, Augustine GJ, Nature 396, 753–756 (1998). [DOI] [PubMed] [Google Scholar]
- 49.Druckmann S et al. , Neuron 81, 629–640 (2014). [DOI] [PubMed] [Google Scholar]
- 50.Kleindienst T, Winnubst J, Roth-Alpermann C, Bonhoeffer T, Lohmann C, Neuron 72, 1012–1024 (2011). [DOI] [PubMed] [Google Scholar]
- 51.Kwon O, Feng L, Druckmann S, Kim J, The Journal of Neuroscience 38, 5140–5152 (2018). [DOI] [PMC free article] [PubMed] [Google Scholar]
- 52.Takahashi N et al. , Science 335, 353–356 (2012). [DOI] [PubMed] [Google Scholar]
- 53.Adoff MD et al. , Nature communications 12, 1–15 (2021). [DOI] [PMC free article] [PubMed] [Google Scholar]
- 54.Dana H et al. , Nature methods 16, 649–657 (2019). [DOI] [PubMed] [Google Scholar]
- 55.Dong C, Madar AD, Sheffield MEJ, Nature Communications 12, 2977 (2021). [DOI] [PMC free article] [PubMed] [Google Scholar]
- 56.Hainmueller T, Bartos M, Nature 558, 292–296 (2018). [DOI] [PMC free article] [PubMed] [Google Scholar]
- 57.Kinsky NR, Sullivan DW, Mau W, Hasselmo ME, Eichenbaum HB, Current Biology 28, 3578–3588.e3576 (2018). [DOI] [PMC free article] [PubMed] [Google Scholar]
- 58.Golding NL, Kath WL, Spruston N, Journal of neurophysiology 86, 2998–3010 (2001). [DOI] [PubMed] [Google Scholar]
- 59.Kano M, Garaschuk O, Verkhratsky A, Konnerth A, The Journal of Physiology 487, 1–16 (1995). [DOI] [PMC free article] [PubMed] [Google Scholar]
- 60.Takahashi H, Magee JC, Neuron 62, 102–111 (2009). [DOI] [PubMed] [Google Scholar]
- 61.Losonczy A, Makara JK, Magee JC, Nature 452, 436–441 (2008). [DOI] [PubMed] [Google Scholar]
- 62.Lee JS, Briguglio JJ, Cohen JD, Romani S, Lee AK, Cell 183, 620–635.e622 (2020). [DOI] [PubMed] [Google Scholar]
- 63.Campanac E, Debanne D, The Journal of Physiology 586, 779–793 (2008). [DOI] [PMC free article] [PubMed] [Google Scholar]
- 64.Diba K, Buzsáki G, The Journal of Neuroscience 28, 13448–13456 (2008). [DOI] [PMC free article] [PubMed] [Google Scholar]
- 65.Mizuseki K, Royer S, Diba K, Buzsáki G, Hippocampus 22, 1659–1680 (2012). [DOI] [PMC free article] [PubMed] [Google Scholar]
- 66.Garaschuk O, Yaari Y, Konnerth A, The Journal of Physiology 502, 13–30 (1997). [DOI] [PMC free article] [PubMed] [Google Scholar]
- 67.Neymotin SA et al. , Neural Computation 27, 898–924 (2015). [DOI] [PMC free article] [PubMed] [Google Scholar]
- 68.Sheffield ME, Dombeck DA, Nat Neurosci 18, 1060–1062 (2015). [DOI] [PubMed] [Google Scholar]
- 69.Courchet J et al. , Cell 153, 1510–1525 (2013). [DOI] [PMC free article] [PubMed] [Google Scholar]
- 70.Han X et al. , Neuron 62, 191–198 (2009). [DOI] [PMC free article] [PubMed] [Google Scholar]
- 71.Zhang S, Sodroski J, Virology 481, 73–78 (2015). [DOI] [PMC free article] [PubMed] [Google Scholar]
- 72.Turi GF et al. , Neuron 101, 1150–1165. e1158 (2019). [DOI] [PMC free article] [PubMed] [Google Scholar]
- 73.Stringer C, Wang T, Michaelos M, Pachitariu M, Nature Methods 18, 100–106 (2021). [DOI] [PubMed] [Google Scholar]
- 74.Kaifosh P, Zaremba JD, Danielson NB, Losonczy A, Frontiers in neuroinformatics 8, 80 (2014). [DOI] [PMC free article] [PubMed] [Google Scholar]
- 75.Evangelidis GD, Psarakis EZ, IEEE Transactions on Pattern Analysis and Machine Intelligence 30, 1858–1865 (2008). [DOI] [PubMed] [Google Scholar]
- 76.Pachitariu M et al. , BioRxiv, (2017). [Google Scholar]
- 77.O’Hare JK et al. , Elife 6, e26231 (2017).28871960 [Google Scholar]
- 78.Lovett-Barron M et al. , Science 343, 857–863 (2014). [DOI] [PMC free article] [PubMed] [Google Scholar]
- 79.Friedrich J, Paninski L, Advances In Neural Information Processing Systems 29, 1984–1992 (2016). [Google Scholar]
- 80.Keemink SW et al. , Scientific reports 8, 1–12 (2018). [DOI] [PMC free article] [PubMed] [Google Scholar]
- 81.Skaggs WE, McNaughton BL, Gothard KM. (1993), pp. 1030–1037. [Google Scholar]
- 82.Bannister N, Larkman A, Journal of Comparative Neurology 360, 161–171 (1995). [DOI] [PubMed] [Google Scholar]
- 83.Magee JC, Carruth M, Journal of neurophysiology 82, 1895–1901 (1999). [DOI] [PubMed] [Google Scholar]
- 84.Larkum ME, Zhu JJ, Sakmann B, Nature 398, 338–341 (1999). [DOI] [PubMed] [Google Scholar]
- 85.Goebbels S et al. , Genesis 44, 611–621 (2006). [DOI] [PubMed] [Google Scholar]
Associated Data
This section collects any data citations, data availability statements, or supplementary materials included in this article.
Supplementary Materials
Data Availability Statement
All plasmid DNA constructs generated in the course of this study are publicly available at Addgene. Pdzd8F/F mice are available upon request for academic, non-commercial use. Data and code are available at https://github.com/JustinOHare/ICR_2022.