

Abstract
Background:
Markers to differentiate depressions of bipolar disorder (BD-Dep) from depressions of major depressive disorder (MDD-Dep), and for more targeted treatments, are critically needed to decrease current high rates of misdiagnosis that can lead to ineffective or potentially deleterious treatments. Distinguishing, and specifically treating the depressions, during the adolescent/young adult epoch is especially important to decrease illness progression and improve prognosis, and suicide, as it is the epoch when suicide thoughts and behaviors often emerge. With differences in functional connectivity patterns reported when BD-Dep and MDD-Dep have been studied separately, this study used a graph theory approach aimed to identify functional connectivity differences in their direct comparison.
Methods:
Functional magnetic resonance imaging whole-brain functional connectivity (Intrinsic Connectivity Distribution, ICD) measures were compared across adolescents/young adults with BD-Dep (n=28), MDD-Dep (n=20) and HC (n=111). Follow-up seed-based connectivity was conducted on regions of significant ICD differences. Relationships with demographic and clinical measures were assessed.
Results:
Compared to the HC group, both the BD-Dep and MDD-Dep groups exhibited left-sided frontal, insular, and medial temporal ICD increases. The BD-Dep group had additional right-sided ICD increases in frontal, basal ganglia, and fusiform areas. In seed-based analyses, the BD-Dep group exhibited increased interhemispheric functional connectivity between frontal areas not seen in the MDD-Dep group.
Limitations:
Modest sample size; medications not studied systematically
Conclusions:
This study supports bilateral and interhemispheric functional dysconnectivity as features of BD-Dep that may differentiate it from MDD-Dep in adolescents/young adults and serve as a target for early diagnosis and treatment strategies.
Keywords: depression, adolescent, bipolar disorder, major depressive disorder, fMRI, functional connectivity
Introduction
There is critical need to better elucidate the neurobiology of depressions in bipolar disorder (BD) and major depressive disorder (MDD) as they are both associated with profound suffering and high suicide risk, yet current treatments, especially for bipolar depression (BD-Dep), have limited effectiveness and can have adverse effects. An especially pressing clinical issue is early identification of BD, as there is evidence that untreated episodes worsen prognosis (Aguirre, 2021; Diler et al., 2017; Duffy, Alda, Crawford, Milin, & Grof, 2007; Keener & Phillips, 2007; McIntyre & Calabrese, 2019). Misdiagnosis can be associated with worse prognosis, higher healthcare costs, inadequate or deleterious treatment, and increased suicide risk (Han, De Berardis, Fornaro, & Kim, 2019). One of the most substantial barriers to accurate early diagnoses and effective targeted treatments is the lack of methods to differentiate BD-Dep from depression in MDD (MDD-Dep). Differentiating the depressions of BD from those of MDD solely based on subjective clinical signs and symptoms has proven difficult in adolescents and in adults (Almeida et al., 2009; Diler et al., 2017; Han et al., 2019; Keener & Phillips, 2007; McIntyre & Calabrese, 2019; Mitchell, Goodwin, Johnson, & Hirschfeld, 2008; Perry, Roberts, Mitchell, & Breakspear, 2019), and the field lacks biomarkers to distinguish BD-Dep from MDD-Dep, especially needed to differentiate them during adolescence and early adulthood.
During the adolescent/young adult epoch, depression is typically the first fully syndromal episode of BD and the episode that most often presents to clinicians (Birmaher et al., 2009; Duffy et al., 2007). Without a current biomarker, or clinical features shown to reliably distinguish BD-Dep from MDD-Dep, BD-Dep is frequently misdiagnosed and treated as MDD-Dep (Almeida et al., 2009; Diler et al., 2017; Keener & Phillips, 2007; McIntyre & Calabrese, 2019; Perry et al., 2019). It is estimated that a meager 20% of patients actually suffering from BD presenting with a depressive episode are correctly diagnosed with BD in the first year of medical care (Goldberg, Harrow, & Whiteside, 2001), and that at least half of individuals later diagnosed with BD experienced a prior depressive episode many years before the onset of manic episodes (Duffy et al., 2007; Van Meter, Burke, Youngstrom, Faedda, & Correll, 2016), further supporting the relevance of study of depressive episodes during this epoch. Study is also crucial in adolescence/young adulthood as it is often the time of onset of suicidal thoughts and behaviors (STBs) and depression is a main risk factor for suicide (Roca et al., 2019). The majority of adolescents/young adults who died by suicide were depressed; suicide risk is especially high for BD with estimates that 15–20% of persons with BD die by suicide (Pompili et al., 2013; Lianne Schmaal et al., 2019).
Emerging evidence suggests that study of brain system connectivity with functional imaging (Jie et al., 2015) can be especially fruitful in identifying the developmental pathophysiology of mood disorders and has the potential to generate of biomarkers to distinguish them (Ellard et al., 2018; Perry et al., 2019; Siegel-Ramsay et al., 2022). Left lateralized frontal abnormalities have been repeatedly observed in association with depression across disorders (Jorge et al., 1993; Kerestes et al., 2012; Robinson & Starkstein, 1989). However, in BD, there have been long posited arguments for the relevance of bilateral frontal abnormalities and impaired interhemispheric communication between left and right frontal cortex. This dates back to early 1900s when BD-like depressed and manic states were observed in individuals with anterior callosal lesions (Blond, Fredericks, & Blumberg, 2012; Starr, 1903), and later in the century when the presence of right-sided frontal lesions and dysfunction observed with functional neuroimaging studies were suggested to be associated with propensity for mania (Robinson, Kubos, Starr, Rao, & Price, 1984). Our group’s prior functional magnetic resonance imaging (fMRI) demonstration of disturbances in interhemispheric functional connectivity between left and right frontal cortex in BD (Chepenik et al., 2010) as well as others’ study showing increased extent of functional dysconnectivity in BD compared to MDD in bilateral frontal cortices (Wei et al., 2018), taken together with multiple demonstrations of decreased structural integrity measured via diffusion-weighted MRI (DW-MRI) of anterior corpus callosum white matter (WM) in BD (Han et al., 2019; Leow et al., 2013; Wang et al., 2008; R. Zhang et al., 2019), suggests that pathology in interhemispheric frontal connections may be an important contributor to these hemispheric imbalances and thereby mood states of BD.
Much of prior neuroimaging work done on the brain systems involved in depressions in BD and MDD has been done in adults. FMRI studies of adults with either BD or MDD suggest that both have prominent prefrontal cortex (PFC) involvement and that for both left PFC is involved, while BD may have more pronounced and bilateral abnormalities and disturbances in interhemispheric connections (Almeida et al., 2009; Grotegerd et al., 2013; Han et al., 2019; Phillips & Swartz, 2014). Prior direct comparisons of functional neuroimaging data between BD and MDD in adults, though scarce, provide preliminary support for interhemispheric functional dysconnectivity as a feature differentiating BD (Almeida et al., 2009; Wei et al., 2018). Structural studies in adults provide further evidence in the form of WM structural integrity that provide evidence for decreased corpus callosum integrity specific to BD when compared to MDD and HC groups (Brambilla et al., 2004; Repple et al., 2017). This includes decreases in anterior regions of the corpus callosum, such as its genu, which provide interhemispheric frontal connections (Brambilla et al., 2004; Han et al., 2019; Kelberman et al., 2021; Serafini et al., 2014). In youths, direct comparison studies are gaining traction but have primarily relied on structural neuroimaging methods. Youth comparisons of WM structural integrity between BD and MDD suggest that in BD there are more prominent WM abnormalities, including in interhemispheric connections (Kelberman et al., 2021; Serafini et al., 2014). Taken together with the fMRI findings, these structural findings suggest that study of laterality and interhemispheric dysconnectivity, using functional neuroimaging, could be instrumental in further differentiating brain systems involved in BD from those in MDD in adolescents/young adults.
The scarce direct comparisons between the disorders in adolescents/young adults using functional imaging methods (Diler et al., 2014; Kelberman et al., 2021) have been primarily performed using methods in which few pre-specified regions of interest (ROIs) were studied and have resulted in findings that were inconsistent which may have related to different regions focused on. Others have solely looked at regional activation (Diler et al., 2013; Ford, Theberge, Neufeld, Williamson, & Osuch, 2013; Jiang et al., 2017), not disturbances to connectivity which shed light on impacted communication. Methods using pre-determined ROIs can hinder the identification of areas that, though they have been less well-studied to date, may be pertinent to being able to more reliably differentiate the disorders. Intrinsic connectivity distribution (ICD) holds promise in its lack of reliance on a priori ROIs, instead assessing the whole brain for “hubs” of dysconnectivity (Goldman et al., 2021; Sankar et al., 2022; Scheinost et al., 2012), a useful technique in this relatively nascent field of comparison study. ICD’s voxel-level specificity based on graph theory also allows for more precise localization of disturbances as it doesn’t depend delineations for areas where boundaries are less clear (Scheinost et al., 2012). Our group and others have found that ICD measures of fMRI data are especially robust when acquired while participants perform a task that engages behaviors and brain regions salient to the disorders of interest (Greene, Gao, Scheinost, & Constable, 2018; Noble, Scheinost, & Constable, 2019). Support for dysconnectivity “hubs” could identify them as potential targets to better characterize each disorder targets for specific treatments.
In a previously reported study, we compared ICD between 91 adolescents and young adults with BD and 111 healthy control (HC) participants, identifying increased frontolimbic interhemispheric connectivity in those with BD. Increased bilateral and interhemispheric connectivity was particularly prominent in the participants in a depressed mood state at time of scan (Goldman et al., 2021). This current study is aimed to investigate whether ICD findings differentiate BD-Dep from MDD-Dep in adolescents and young adults. Thus, whole brain ICD was assessed for differences across BD-Dep, MDD-Dep, and HC groups while participants performed an emotion face processing task. Based on our previous findings and the literature, we hypothesized that left-sided frontal system dysconnectivity would characterize both the MDD-Dep and BD-Dep groups compared to the HC group, whereas interhemispheric and additional right-sided frontal system dysconnectivity would be found in the BD-Dep group compared to HCs.
Methods
Participants
Participants were ages 16–24 years: 28 depressed with BD (BD-Dep, 75% female, mean age±standard deviation: 20.0±2.1 years) 20 depressed with MDD (MDD-Dep, 80% female, 19.3±2.6 years) and 111 HCs (53% female, 20.2±2.7 years). The race and ethnicity breakdown is as follows for the: BD-Dep (86% Caucasian, 7% African/African American/Black, 7% Asian, 7% more than 1 race/ethnicity; 11% Hispanic), MDD-Dep (85% Caucasian, 5% African/African American/Black, 5% Asian, 5% more than 1 race/ethnicity; 10% Hispanic), and HC (58% Caucasian, 31% African/African American/Black, 5% Asian, 6% more than 1 race/ethnicity; 3% Hispanic) groups. They were recruited from the Yale School of Medicine medical center and greater Connecticut community. Axis I diagnoses and current depressed episodes for both clinical groups were confirmed using the Structured Clinical Interview for DSM-IV (SCID) (First, Spitzer, Gibbon, & Williams, 1994) for participants ages ≥18 years and revised Schedule for Affective Disorders and Schizophrenia for School-Age Children-Present and Lifetime Version (K-SADS-PL) (Kaufman et al., 1997) for participants <18 years. Depression severity was assessed using the Hamilton Depression Rating Scale 29-item version (HDRS-29) (Williams, 1988). Elevated mood symptom severity was assessed using the Young Mania Rating Scale (YMRS) (Young, Biggs, Ziegler, & Meyer, 1978). Suicide attempt history and suicidal ideation severity were assessed using the Columbia Suicide History Form (Oquendo, Halberstam, & Mann, 2003) and the Beck Scale for Suicide Ideation (SSI), respectively (Beck, Kovacs, & Weissman, 1979). History of alcohol or substance abuse or dependence were not exclusionary criteria for the BD-Dep and MDD-Dep groups since these are highly comorbid with mood disorders (Swann, 2010). No participant met criteria for opiate, cocaine or polysubstance abuse or dependence for >6 months prior to scanning. Two BD and two MDD participants met criteria for alcohol abuse and one (MDD) for cannabis abuse within three months, and one (BD) for cannabis dependence within six months; all participants denied alcohol or substance use for ≥48 hours and had negative toxicology screens immediately prior to scanning. Exclusion criteria included history of medical/neurological disorders/conditions that could affect the brain, with the exception of hypothyroidism (1 BD-Dep participant). HCs did not have DSM-IV Axis I disorders, nor first-degree relatives with major mood, substance use or psychotic disorders (Lish, Weissman, Adams, Hoven, & Bird, 1995). The study was approved by the Yale School of Medicine Human Investigation Committee/Institutional Review Board. Participants ≥18 years of age provided written informed consent; participants <18 years provided written informed assent and their parent/guardian provided written informed permission.
Of the clinical groups, 36% of the BD-Dep and 35% of the MDD-Dep groups had a history of suicide attempts. Table 1 summarizes participants’ demographic and clinical characteristics.
Table 1.
Demographic and clinical information of participants
| BD-Dep | MDD-Dep | HC | p values | |
|---|---|---|---|---|
| Number | 28 | 20 | 111 | |
| Female (# / %) | 21 / 75 | 16 / 80 | 59 / 53 | 0.02* |
| Age (Mean ± SD) | 20.0 ± 2.1 | 19.3 ± 2.6 | 20.2 ± 2.7 | 0.29 |
| Right handedness (# / %) | 27 / 96 | 19 / 95 | 105 / 93 | 0.93 |
| History of suicide attempt (# / %) | 10 / 36 | 7 / 35 | 0.96 | |
| HDRS (Mean ± SE) | 22.4 ± 2.1a | 23.7 ± 3.3b | 1.0 ± 0.2c | <.0001* |
| YMRS (Mean ± SE) | 3.8 ± 1.2 | 2.7 ± 0.7 | 0.5 ± 0.1d | <.0001* |
| Current Comorbidities (# / %) | ||||
| ADHD | - | 1 / 5e | ||
| Anxiety Disorders | 7 / 25 | 8 / 40 | ||
| GAD | 3 / 11 | 2 / 10 | ||
| PTSD | 2 / 7 | 2 / 10 | ||
| Social Phobia | 2 / 7 | 2 / 10 | ||
| Panic Disorder | 1 / 4 | 2 / 10 | ||
| Specific Phobia | 1 / 4 | - | ||
| OCD | 1 / 4 | - | ||
| Eating Disorders | 1 / 4 | 2 / 10 | ||
| Dysthymia | - | 2 / 10 | ||
| Current Medications (# / %) | ||||
| Second Generation Antipsychotics | 8 / 29 | 5 / 25 | ||
| Anticonvulsants | 7 / 25 | 3 / 15 | ||
| Lithium | 5 / 18 | - | ||
| Antidepressants | 4 / 14 | 9 / 45 | ||
| Benzodiazepines | 6 / 21 | 2 / 10 | ||
| Stimulants | 3 / 11 | 2 / 10 | ||
| Levothyroxine | 1 / 4 | - | ||
| Unmedicated at Scan | 12 / 43 | 8 / 40 | 0.85 |
Abbreviations: BD, Bipolar Disorder; BD-Dep, Bipolar Depression; MDD-Dep, Major Depression; SD, Standard Deviation; SE, Standard Error; YMRS, Young Mania Rating Scale; HDRS-29, Hamilton Depression Rating Scale; ADHD, Attention Deficit and Hyperactivity Disorder; GAD, Generalized Anxiety Disorder; PTSD, Post-Traumatic Stress Disorder; OCD, Obsessive Compulsive Disorder.
Handedness of all participants was self-reported.
Ninety-five percent of HCs were right-handed; HCs had an average HDRS-29 score of 0.97±0.24 (mean±standard error) and YMRS score of 0.51±0.09.
Significant at p< 0.05.
n = 24;
n = 11;
n = 78;
n = 110;
This 1 participant was under 18 and was assessed by K-SADS-PL.
MRI Acquisition and Processing
MRI scans were obtained using a 3 Tesla Trio MR scanner (Siemens, Erlangen, Germany) with a software upgrade covaried for [without upgrade(a), with(b)] in imaging analyses. Three-dimensional magnetization-prepared rapid gradient-echo (MPRAGE) [repetition time(TR)=1500ms; echo time(TE)a=2.77ms; TEb=2.83ms; flip angle(FA)=15°; matrix=256×256; field of view(FOV)=256×256mm2; slice thickness=1.0mm without gap; 160 contiguous slices] images were non-linearly registered to an evolving group average template in an iterative fashion. T1 data were collected for registration to the MPRAGE then fMRI data: TR=300ms, TE=2.47ms, flip angle=60°, matrix=256×256, FOV=256×256mm2, 32 3mm contiguous slices aligned with the anterior commissure-posterior commissure plane. FMRI data were collected using a single-shot echo planar imaging sequence: TR=2000ms, TE=2.5ms, FA=80°, matrix=64×64, FOV=240×240mm2, 32 3mm contiguous slices, while participants performed a gender-labeling emotional face task reported previously (Johnston et al., 2017).
ICD Processing
ICD data processing is as reported previously (Goldman et al., 2021; Sankar et al., 2022). In brief, the first four volumes of a run were discarded for approach to hemodynamic steady-state. Motion correction was performed using Statistical Parametric Mapping version 12 (SPM12) (http://www.fil.ion.ucl.ac.uk/spm/). All scans had <0.2mm framewise displacement and there were no significant differences in movement among the groups. Images were warped into common space and iteratively smoothed to 6mm full-width at half-maximum using Analysis of Functional NeuroImage (AFNI)’s 3dFWHMx (http://afni.nimh.nih.gov/afni/) to further minimize motion confounds (Scheinost, Papademetris, & Constable, 2014). Task connectivity was calculated based on the raw task time courses, with no regression of task-evoked activity (Greene et al., 2018). After this processing was completed, ICD analysis was performed using BioImage Suite (Joshi et al., 2011).
ICD avoids the need for choosing an arbitrary connectivity threshold by modeling the entire distribution of correlation thresholds using a Weibull distribution to estimate distributions of connections to each individual voxel, giving a whole-brain parametric image. It encompasses correlating the time series for each voxel with every other time series of the brain. A summary statistic based on network theory measure degree was calculated and this process was repeated for all voxels in the brain (Scheinost et al., 2012).
Seed-based Functional Connectivity Processing
Seed regions to examine regional functional connectivity patterns contributing to the ICD results were created in the locations of clusters of significant group differences in ICD analyses for whole brain analyses. Seed masks were generated using MarsBaR toolbox for SPM (http://marsbar.sourceforge.ne) with methods reported previously as 10mm cubes, around peaks of significant ICD clusters, as previously reported (Garrison, Scheinost, Constable, & Brewer, 2014; Goldman et al., 2021). Each voxel’s timecourse was computed separately for each seed region for each individual participant. Correlations between these time courses with those of every other voxel in the whole-brain were computed to create maps of r-values, transformed to z-values using Fisher’s transform, resulting in one map for each participant for each seed representing the strength of correlations to the seed region.
Group Statistical Analyses
Demographic and Clinical Variables
Potential group differences (BD-dep, MDD-dep, HCs) in continuous variables (age, HDRS-29, and YMRS scores) were assessed by one-way analysis of variance (ANOVA). Chi-squared tests were conducted for dichotomous variables across all groups for gender and handedness, and across clinical groups (BD-Dep, MDD-Dep) for presence/absence of suicide attempts, substance abuse or dependence, and current medications overall and for subclasses. Comorbidity and medication analyses were conducted when there were ≥five participants each with or without. Differences in age and continuous clinical variables between each clinical group and HC participants were additionally examined using post-hoc t-tests, considered significant at p<0.05. All above analyses were conducted in R.
Neuroimaging
Group-level analyses were conducted utilizing SPM12. An ANCOVA was conducted on ICD maps comparing BD-Dep, MDD-Dep and HC groups, covarying for scanner software upgrade and gender (as it differed across groups), considered significant at p<0.05 Family-wise Error (FWE)-corrected as previously reported (Goldman et al., 2021; Sankar et al., 2022). The corrected significance threshold was determined by Monte Carlo simulations (3dClustSim) run with a smoothing kernel estimated from residuals using AFNI’s 3dFWHMx with the -acf option, a cluster-forming threshold of p=0.005, and 10,000 iterations.(Garrison et al., 2014) Post-hoc exploratory seed connectivity analyses were considered significant at p<0.005, cluster >20 voxels to balance for type I and II errors, as reported previously (Lieberman & Cunningham, 2009).
MarsBaR toolbox was utilized to obtain mean functional connectivity correlation coefficient values from seed regions. These correlation coefficient values were used as input for post-hoc t-tests, and post-hoc pairwise comparison results were adjusted using Tukey’s adjustment (ptukey<0.05).
To further assess differentiating factors by diagnosis, the ICD maps for the BD-depressed and MDD-depressed groups were directly compared in an exploratory t-test covarying for scanner software upgrade (not gender, as gender was not significantly different between clinical groups). Results were considered significant at p<0.005, cluster >20 voxels.
Associations Between Imaging with Demographic and Clinical Measures
ICD values extracted from the above analyses were explored for all participants for potential associations with age, and for BD-Dep and MDD-Dep participants for clinical factors at the time of scan including medication overall (yes/no) and medication subclasses including second-generation antipsychotics, anticonvulsants, lithium, antidepressants, benzodiazepines, and stimulants (yes/no), suicide attempts (yes/no), and current anxiety disorders (yes/no). Results were considered significant at p<0.05.
For BD-Dep and MDD-Dep participants, exploratory correlational analyses were performed between ICD values extracted from each cluster showing group differences in ICD and seed analyses with HDRS-29 and YMRS scores. Spearman (rs) correlations were used. Correlations were first conducted on extracted values from ICD clusters. If significant, correlations were conducted on clusters from post-hoc seed analyses. Correlations were exploratory and considered significant at p<0.05.
Results
Demographic and Clinical Variables
There was a main effect of group for gender across all groups (p=0.017). There were significantly more females in each of the clinical groups than HCs (p’s<0.03). Thus, gender was covaried for in all three group imaging analyses. Gender was not significantly different between clinical groups (p=0.69). Significant main effects of group across all participants for demographic or clinical variables existed for HDRS-29 and YMRS scores (p<0.001), as HDRS-29 and YMRS scores were higher in both BD-depressed and MDD-depressed groups than HCs, p’s<0.009. HDRS-29 and YMRS scores did not differ between clinical groups (p=0.42, p=0.11, respectively)
Neuroimaging
ICD
There were significant main effects of group bilaterally between BD-Dep, MDD-Dep and HC groups in ICD. In the left hemisphere, there were significant main effects in three clusters: Cluster A: peaks in rostral PFC [Brodmann Area (BA)10] and extends into dorsolateral PFC (BA46), referred to below as the “left r/dlPFC” cluster; Cluster B: peaks in anterior insula and extends into ventrolateral PFC (BA47), “left Ins/vlPFC” cluster; and Cluster C: peaks in parahippocampal gyrus and extends into BA20 and cerebellum, medial temporal lobe (MTL) “left MTL/Cerebel” cluster (Figure 1). In the right hemisphere, there were significant main effects in three clusters: Cluster D: peaks in rostral PFC (BA10) and extends into dlPFC (BA46), “right r/dlPFC”; Cluster E: peaks in putamen and extends into caudate and globus pallidus, basal ganglia “right BG”; and Cluster F: in the fusiform gyrus (BA37) “right fusiform” (Figure 1).
Figure 1.

Regions of increased intrinsic connectivity distribution (ICD) between participants with bipolar depression or major depression, and healthy controls. Axial-Oblique Images: (A-C) Regions of increased left-sided ICD (p<0.05, family-wise error corrected) in both clinical groups compared to controls (A) in left rostral PFC and extending into ventrolateral PFC, (B) in left insula and extending into ventrolateral PFC, and (C) in left medial temporal lobe and extending into cerebellum. (D-F) Additional regions of increased right-sided ICD in bipolar depression compared to controls (D) in right rostral PFC and extending into dorsolateral PFC, (E) in right putamen and extending into caudate and globus pallidus (basal ganglia), and (F) in right fusiform. The numbers at the lower left of each image are the level of the MNI z plane. The numbers at the lower left of each image are the level of the MNI z plane. The color bar represents the range of T values. The * denotes regions which also survived a t-test directly comparing the bipolar and major depressed groups.
Post-hoc analyses identified results differing based on lateralization. In the left hemisphere, compared to controls, both clinical groups had significantly higher ICD (ptukey<0.04) for clusters from the three group ANCOVA. Left r/dlPFC ICD was significantly higher, compared to HCs, in both the BD-Dep [t(156)=5.29; p<0.001] and MDD-Dep [t(156)=2.22; p=0.04] groups. Left-sided Ins/vlPFC ICD was also significantly higher in both clinical groups than HCs [t(156)=5.92; t(156)=2.88, for BD-Dep and MDD-Dep comparisons to HCs respectively; p’s<0.008] and left MTL/Cerebel [t(156)=3.31; t(156)=2.78, for BD-Dep and MDD-Dep comparisons to HCs respectively; p ‘s<0.01].
Additionally, in the right hemisphere, post-hoc analyses showed that compared to HCs, only the BD-Dep group had significantly higher ICD in clusters from the ANCOVA. Right r/dlPFC ICD was higher in the BD-Dep group than both the MDD-Dep [t(156)=2.73] and HC [t(156)=5.54] groups, significant for the comparison with the HC group (p<0.001). ICD was also only significantly higher for the BD-Dep group, compared to HCs, in the right BG [t(156)= 3.02; p=0.005] and right fusiform [t(156)= 6.66; p<0.001].
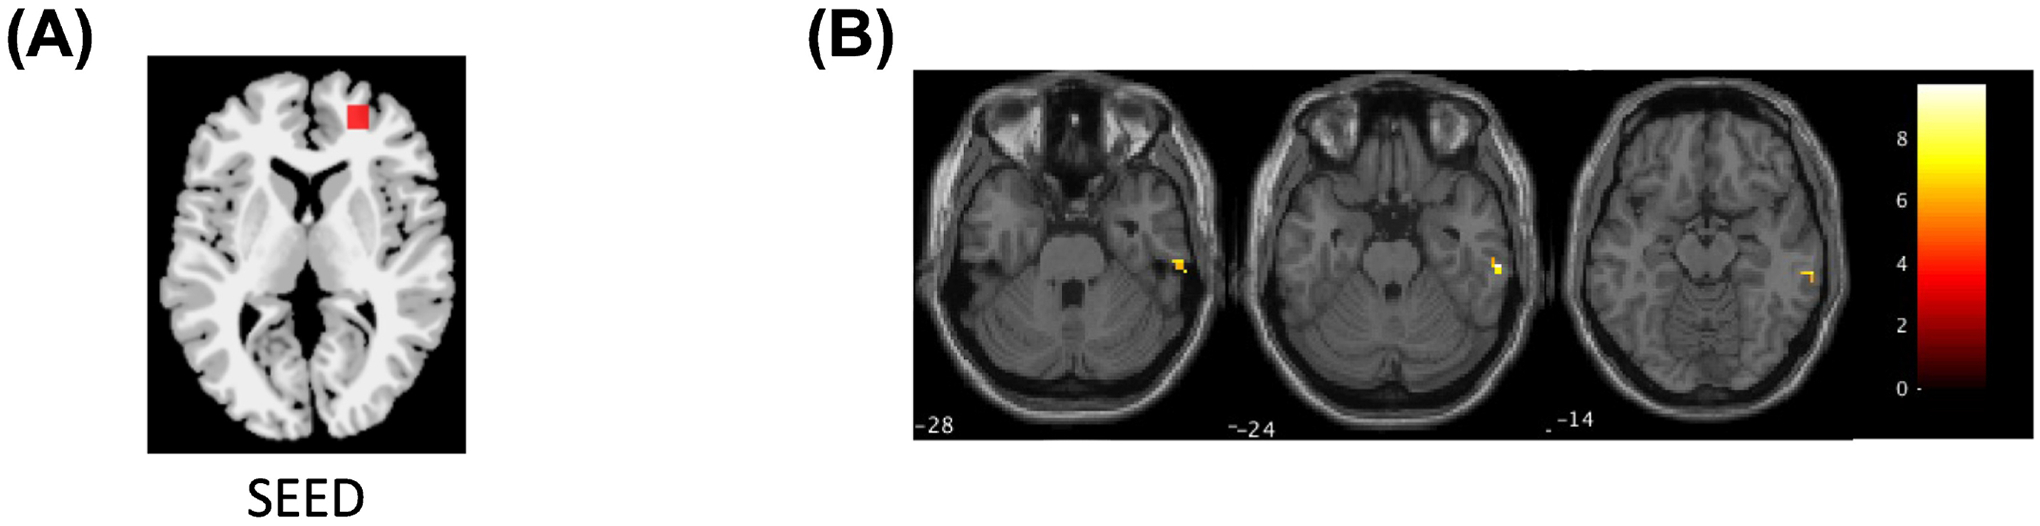
Seed-based FC
The left r/dlPFC ICD seed region showed a significant main effect of group in functional connectivity to a right r/dl/vlPFC region (peaks in BA10 and cluster extended into BA47,46). Post-hoc analyses showed the BD-Dep had significantly (ptukey<0.04) higher left-right PFC functional connectivity than the MDD-Dep [t(156)= 2.06] and HC groups [t(156)= 3.95] (Figure 2).
Figure 2.

Region of increased right prefrontal cortex (PFC) to left rostral/dorsolateral PFC (“r/dlPFC”) functional connectivity in bipolar depression compared to both major depressed and healthy controls. Images: (A) Location of left r/dlPFC seed. (B) The axial-oblique image shows the region of functional dysconnectivity to the left r/dlPFC seed in the right rostral PFC and extending into dorsolateral and ventrolateral PFC (p<0.005, cluster >20 voxels). The number at the lower left of the image is the level of the MNI z plane. The color bar represents the range of T values.
The left MTL/Cerebel ICD seed region showed a significant main effect of group in functional connectivity to a right rPFC region (in BA10) and bilateral fusiform regions (BA37). Post-hoc analyses showed the BD-Dep group had significantly (ptukey=0.001) more negative left MTL/Cerebel-right rPFC functional connectivity than the HC group [t(156)= 3.47] and the MDD-Dep group but this did not reach significance [t(156)= 1.70, ptukey=0.09]. The BD-Dep group had significantly (ptukey<0.02) higher left MTL/Cerebel-right fusiform functional connectivity than the MDD-Dep [t(156)=2.37] and HC [t(156)=4.39] groups. The BD-Dep and MDD-Dep groups both had significantly (ptukey<0.05) higher left MTL/Cerebel-left fusiform functional connectivity than the HC group [t(156)= 3.29; t(156)= 2.06, respectively] (Figure 3).
Figure 3.

Regions of greater negative right prefrontal cortex (PFC) and increased bilateral fusiform to left medial temporal lobe (MTL)/cerebellum (“MTL/Cerebel”) functional connectivity. Images: (A) Location of left MTL/Cerebel seed. (B) The axial-oblique image shows the region of functional dysconnectivity to the left MTL/Cerebel seed in the right rostral PFC region (p<0.005, cluster >20 voxels) in the bipolar depressed group compared to the major depressed and healthy controls. (C) The axial-oblique image shows the region of functional dysconnectivity to the left MTL/Cerebel seed in the right fusiform (p<0.005, cluster >20 voxels) in the bipolar depressed group compared to the major depressed and healthy controls. (D) The axial-oblique image shows the region of functional dysconnectivity to the left MTL/Cerebel seed in the left fusiform (p<0.005, cluster >20 voxels) in both clinical groups compared to controls. The numbers at the lower left of the images are the level of the MNI z plane. The color bar represents the range of T values.
The right r/dlPFC seed ICD region showed a significant main effect of group in functional connectivity to right inferior temporal gyrus (ITG; BA20). Post-hoc analyses showed the BD-Dep group had significantly (ptukey< 0.001) higher right PFC-right ITG functional connectivity than the HC [t(156)= 3.94] group (Figure 4).
Figure 4.
Region of increased right inferior temporal gyrus (ITG) to right rostral/dorsolateral prefrontal cortex (“r/dlPFC”) functional connectivity in bipolar depression compared to healthy controls. Images: (A) Location of right r/dlPFC seed. (B) The axial-oblique image shows the region of functional dysconnectivity to the right r/dlPFC seed in the right ITG (p<0.005, cluster >20 voxels). The number at the lower left of the image is the level of the MNI z plane. The color bar represents the range of T values.
The right fusiform ICD seed region showed a significant main effect of group in functional connectivity to right cerebellum, MTL (in parahippocampal gyrus) and dlPFC (peaks in BA46 and cluster extended into BA9). Post-hoc analyses showed the BD-Dep group had significantly (ptukey< 0.002) higher right fusiform-right cerebellum functional connectivity than the MDD-Dep [t(156)= 3.27] and HC [t(156)= 4.77] groups. The BD-Dep group had significantly (ptukey< 0.001) higher right fusiform-right MTL functional connectivity than the HC group [t(156)= 4.88]; the BD-Dep group also had higher functional connectivity than the MDD-Dep group, but the difference did not reach significance [t(156)= 1.91, ptukey= 0.06]. The BD-Dep group additionally had significantly (ptukey< 0.001) more negative right fusiform-right dlPFC functional connectivity than the HC group [t(156)= 4.17], as well as more negative than the MDD-Dep group but the difference did not reach significance [t(156)= 1.87, ptukey= 0.07] (Figure 5).
Figure 5.

Regions of increased right cerebellum and medial temporal lobe (MTL), and greater negative right dorsolateral prefrontal cortex (dlPFC) to right fusiform functional connectivity. Images: (A) Location of right fusiform seed. (B) The axial-oblique image shows the region of functional dysconnectivity to the right fusiform seed in the right cerebellum (p<0.005, cluster >20 voxels) in the bipolar depressed group compared to both other groups. (C) The axial-oblique image shows the region of functional dysconnectivity to the right fusiform seed in the right MTL (p<0.005, cluster >20 voxels) in the bipolar depressed group compared to both other groups. (D) The axial-oblique image shows the region of functional dysconnectivity to the right fusiform in the right dlPFC (p<0.005, cluster >20 voxels) in the bipolar depressed group compared to both other groups. The numbers at the lower left of the images are the level of the MNI z plane. The color bar represents the range of T values.
The left Ins/vlPFC and right BG ICD regions did not show a significant main effect of group in seed functional connectivity surviving the significance threshold.
The follow-up t-test comparing the BD-Dep and MDD-Dep ICD maps found results overlapping in the bilateral PFC and left insula clusters identified in the ANCOVA with the BD-Dep group having the most extreme dysconnectivity across all regions (p’s<0.005).
Associations Between Imaging with Demographic and Clinical Measures
None of the clusters of ICD group differences correlated significantly with age across all groups. Across both clinical groups, participants taking antidepressants had significantly lower left r/dlPFC, left MTL/Cerebel, and right r/dlPFC ICD than those not taking antidepressants (p‘s < 0.006). Additionally, participants taking second generation antipsychotics had significantly lower left MTL/Cerebel ICD than those not taking antipsychotics (p = 0.001).
ICD in the clusters of significance did not correlate significantly with total HDRS-29 scores. As the HDRS-29 assesses many differing behavioral domains affected in depression, exploratory correlational analyses were performed for individual items. Across both clinical groups, left Ins/vlPFC ICD correlated with scores on the social withdrawal (rs=0.34, p<0.05) and somatic symptoms (rs=0.44, p<0.01) items.
Discussion
Using graph theory-based ICD methodology, we demonstrated that the hemispheric laterality and presence of interhemispheric functional connectivity disturbances may play roles in differentiating the functional neuroanatomy of BD-Dep and MDD-Dep. Compared to the HC group, both clinical groups exhibited higher ICD in left-sided r/dlPFC, insula/vlPFC and MTL/Cerebel. The BD-Dep group had additional right-sided ICD disturbances in r/dlPFC, BG, and fusiform. When using these regions as seeds for localized functional connectivity analyses, right-sided and interhemispheric dysconnectivity was observed only in the BD-Dep group when compared to the HC group.
The use of ICD, for the first time in the direct comparison between MDD-Dep and BD-Dep, identified commonalities in left-sided functional dysconnectivity involving frontal, limbic, and cerebellar regions, a system involved in emotion processing and regulation across disorders (Jiang et al., 2017). ICD provides support for these components as “hubs” of dysconnectivity in adolescents and young adults suggesting they may relate to potential vulnerability to or early changes in depressive disorders. Left frontal and intrahemispheric dysconnectivity is a marked feature across disorders (Fu et al., 2021; Kelberman et al., 2021; Ross et al., 2021; Siegel-Ramsay et al., 2022; Son, Han, Kim, Min, & Renshaw, 2017; Tang et al., 2013). Frontal cortex has major projections to the MTL, together comprising major components of a frontotemporal system highly implicated in mood disorders (Blond & Blumberg, 2011). The MTL plays a role in associating stimuli with affective meaning (Blond & Blumberg, 2011); the parahippocampal gyrus in particular has direct connections to the frontal cortex and other subcortical regions (i.e. amygdala) which play a role in emotion processing. Our results are consistent with evidence of prefrontal-MTL intrahemispheric dysconnectivity seen across fMRI studies, seen when participants were scanned both in the presence and absence of emotionally-valenced stimuli (Johnston et al., 2017; Tang et al., 2018; Wegbreit et al., 2011). Further, functional and structural imaging work has been done to also suggest the MTL’s role in psychosis (Byun et al., 2012; DeLisi et al., 2006; Silbersweig et al., 1995), with longstanding evidence since the 1990s (Silbersweig et al., 1995), an interesting consideration given that participants in this study taking second generation antipsychotics had lower ICD in this area across clinical groups. The cerebellum also shares connections to PFC and MTL regions (Middleton & Strick, 2001; Schmahmann & Sherman, 1998), has been implicated in emotion regulation and mood disorders. Together with the findings of this study, this suggests further study of the cerebellum and its connectivity in mood disorders is warranted (Womer et al., 2009). Albeit a structural study, MTL and cerebellum disturbances were seen even in an at-risk group for mood disorders (Saricicek et al., 2015), highlighting their importance for follow-up study in relation to early detection for transdiagnostic depression prior to disease onset.
Additionally in this study’s transdiagnostic findings, left-sided insula/vlPFC ICD was shown to be disturbed across both clinical groups. Significant correlations were not detected with HDRS-29 total scores suggesting that the findings were not associated with the magnitude of the full extent of symptoms measured by the scale. However, in exploratory item-level analyses, left-sided insula/vlPFC ICD was shown to be correlated with social withdrawal and somatic symptom items. We conducted these post-hoc analyses given the heterogeneity of symptoms in mood disorders and increased interest in identifying potential biotypes of mood disorders relating functional connectivity to particular symptom clusters, rather than total HDRS scores (Drysdale et al., 2017). The findings herein are particularly of interest, as somatic depression has been shown to exhibit different underlying neurobiology than non-somatic depression (Yan et al., 2022). These findings are of particular interest as, despite the clinical importance of somatic symptoms (Quadt, Critchley, & Garfinkel, 2018), the brain underpinnings of these symptoms of depression have received relatively little prior study and the findings are consistent with the roles of the vlPFC and insula in social and interoceptive processes (Nelson & Guyer, 2011; L. Schmaal et al., 2020). The insula has recently been shown to exhibit dysconnectivity in relation to somatic depressive symptom severity (Yan et al., 2022; T. Zhang et al., 2021). Further, insula disturbances have been associated with STBs (L. Schmaal et al., 2020), which have been suggested to relate to somatic symptoms as well (Yoshimasu et al., 2009). The findings suggest that incorporating more extensive assessments to better characterize these behavioral domains may identify important transdiagnostic aspects of depression and potential brain targets relating to somatic symptoms, which cause a great deal of suffering as well as risk for suicide.
ICD also offers new insights into a long-posited hemispheric theories of disorder-related differences (Almeida et al., 2009; Chepenik et al., 2010; Grotegerd et al., 2013; Phillips & Swartz, 2014). The present study’s findings of right-sided prefrontal, BG, and fusiform regions as “hubs” of whole-brain dysconnectivity differentiate BD-Dep from that of MDD and may share insights into vulnerability to cycling evident in BD. This may be related to impacts across both hemispheres, and thus, an inability to compensate for disturbances in one hemisphere. Bilateral PFC whole-brain dysconnectivity was seen in BD-Dep and when using ICD regions as seeds in follow-up seed-based connectivity, the left r/dlPFC ICD region exhibited dysconnectivity to a right r/dl/vlPFC region that was not seen in the MDD-Dep group. This is consistent with our prior ICD study in a smaller sample of adolescents and young adults with BD-Dep identifying bilateral and interhemispheric dysconnectivity disturbances (Goldman et al., 2021). The involvement of right hemisphere dysfunction differentiating adolescents/young adults with BD from those with MDD also appears to be present even in the absence of stimuli; a rest-based amplitude of low-frequency fluctuations (ALFF) study of adolescents and young adults showed support for right-sided dysfunction, including in frontal and fusiform regions, only seen in BD, not MDD, when compared to controls (Jiang et al., 2017). Prior evidence has also appeared in the insula as right-sided insula dysfunction during emotional processing was seen in another study only in BD when compared to MDD and HC groups (Diler et al., 2013). Additionally, although structural in nature, prior studies of BD do support that bilateral disturbances are associated with worsening disease severity (Nobuhara et al., 2006; Winsberg et al., 2000). Together these findings suggest that right-sided, bilateral, and interhemispheric abnormalities may serve as differentiating features between BD and MDD as early as adolescence and young adulthood.
Another component of the right-sided system present in this study’s results, the basal ganglia is a component of basal ganglia-thalamocortical circuits (Alexander, DeLong, & Strick, 1986) subserving emotional, motor and cognitive functions implicated in BD. Our prior study in adolescents/young adults of BD-Dep compared to other mood states of BD identified disturbances in putamen ICD (Goldman et al., 2021). Prior studies in adolescents and adults with BD have provided support for dysfunction in the putamen, caudate, and globus pallidus during emotional processing tasks (Chang et al., 2004; Dickstein et al., 2007; Rich et al., 2006), including studies that showed BOLD signal changes in the striatum differentiating BD from MDD during emotion processing (Fournier, Chase, Almeida, & Phillips, 2016), reward processing (Wakatsuki et al., 2022), and rest (Sun et al., 2022). In a study directly comparing youth with BD to those with MDD, putamen activity correlated with bipolarity index, differentiating clinical diagnoses (Ford et al., 2013). Putamen, and dorsal striatum dysfunction has been seen in study of youth at risk for BD, differentiating from those at risk for developing MDD and HCs (Fischer et al., 2022; Nimarko et al., 2021). It is suggested that dysfunction in these regions could relate to abnormal motivated behaviors (Yip, Mackay, & Goodwin, 2014) or alterations in response tendencies (Blumberg et al., 2003) in BD. Disturbances in basal ganglia morphology and function have been reported in attention deficit hyperactivity disorder (ADHD) (Mills et al., 2012; Qiu et al., 2009; Sobel et al., 2010). Individuals with BD are often diagnosed with ADHD in youth (Chilakamarri, Filkowski, & Ghaemi, 2011; Marangoni, De Chiara, & Faedda, 2015). We speculate that BG disturbances are common to both disorders in youth and that the trajectory of additional brain differences and their associated symptoms differentiate the disorders over time.
In addition to the above areas which comprised the system differentiating BD, the right fusiform also arose as an area differentiating BD-Dep from MDD-Dep. The fusiform subserves face processing and plays a role in the emotional processing and regulation of responses to emotional faces with connections to other regions in emotion processing and regulation systems, including the PFC, MTL, and cerebellum (Blond & Blumberg, 2011; Rich et al., 2008; Womer et al., 2009). We found altered fusiform ICD, that on follow-up seed connectivity analyses, was contributed to by abnormal fusiform connectivity to PFC, MTL, and cerebellar regions. As a task that involved presentation of emotional faces was used in the present study, fusiform differences may reflect differences in performance of the task by the BD subjects. However, while the fusiform has infrequently been a region of focus in ROI studies of mood disorders (Perlman et al., 2013), fusiform disturbances have been seen in studies of children with BD during face processing (Passarotti, Sweeney, & Pavuluri, 2010; Pavuluri, Passarotti, Harral, & Sweeney, 2009) as well as in adolescents and young adults during the resting-state (Jiang et al., 2017), that include support for specifically right-sided dysfunction and dysconnectivity with limbic and prefrontal regions (Jiang et al., 2017; Pavuluri et al., 2009; Rich et al., 2008; Stoddard et al., 2016).
Limitations
Along with the limitations noted above, effects of gender were unable to be investigated due to both clinical groups having a higher proportion of females that differed relative to the HC group. This is representative of the population as MDD has been shown to affect more females than males (Salk, Hyde, & Abramson, 2017), and there is evidence that females are more likely to exhibit depressive polarity in BD (Dell’Osso, Cafaro, & Ketter, 2021). Nevertheless, it is important to investigate gender differences as should be done in better powered designs moving forward. Participants taking antidepressants had lower ICD in bilateral r/dlPFC and left MTL/Cerebel. This finding should be viewed cautiously as medication status was not systematically studied; future study in larger groups of participants with systematic treatment studies are needed. Given our findings of lateralized differences, it must be acknowledged that the majority of individuals in our sample are right-handed, and our findings may be applicable only to right-handed persons. In order to better assess the generalizability of these findings to the mood disorders population, future studies should incorporate larger samples of left-handed individuals to investigate if there are associations between these lateralized findings and handedness; although this has not been well-studied in the mood disorder literature, recent whole-brain functional connectivity studies have emphasized this importance (Tejavibulya et al., 2022). The mechanisms that underlie the functional connectivity disturbances cannot be concluded from this study; future studies that also incorporate structural analyses, in particular investigations of WM or neurochemical imaging could help to elucidate underlying mechanisms. As discussed above, prior studies of WM have identified disturbances to the corpus callosum in BD, as compared to MDD and HC groups (Brambilla et al., 2004; Han et al., 2019; Kelberman et al., 2021; Serafini et al., 2014); however, multimodal studies in adolescents and young adults are scarce (Kelberman et al., 2021). The assessment of WM of major interhemispheric tracts within the same participants where functional dysconnectivity is seen can begin to point towards pathophysiological mechanisms. As neuronal connections that cross hemispheres are largely glutamatergic, and increased glutamatergic activity could contribute to increased functional connectivity as observed herein, it is of interest that increased glutamate has been demonstrated by magnetic resonance spectroscopy in frontal areas, in BD (Gigante et al., 2012). Increased interhemispheric connectivity could also result from decreased inhibition. Future study of excitatory and inhibitory neurotransmitter systems in tandem with functional imaging connectivity measures could reveal underlying mechanisms.
In conclusion, this study was the first to use a whole-brain voxel-based graph theory-based functional connectivity approach, ICD, to directly compare adolescents and young adults across BD-Dep, MDD-Dep and HC groups. Both clinical groups exhibited left-sided whole-brain dysconnectivity when compared to HCs; the BD-Dep was differentiated from MDD-Dep by additional right-sided and interhemispheric dysconnectivity. These data are consistent with prior work suggesting disturbances in functional neuroanatomy, including in left intrahemispheric frontolimbic systems across disorders in adolescents and young adults; our work extends these interpretations by considering them as “hubs” of dysconnectivity to the whole brain, rather than singular regional findings using voxel-level specificity for more precise understandings across studies, that may serve as potential early intervention targets. Further, this study provides novel insights into the extent to which bilateral disturbances in functional connectivity and interhemispheric dysconnectivity in frontal regions, as well as disturbances in less-well-studied areas like the BG and fusiform, may serve as key discriminators between diagnostic depressions to serve for future diagnostic or treatment targets.
Highlights.
The depressions of bipolar disorder and major depressive disorder in adolescents and young adults were directly compared and distinguished by a recently developed graph theory-based neuroimaging method.
While both depressions showed elevations in areas of functional connectivity in the left brain hemisphere, only the depression of bipolar disorder exhibited increases bilaterally and in interhemispheric connections.
The findings suggest that the depression of bipolar disorder may be differentiated from the depression of major depressive disorder by the presence of interhemispheric pathology that appears relatively early in the disorder and may be important in early detection and as a treatment target.
Acknowledgments:
We appreciate the time and effort of the research participants who took part in this study.
Role of the Funding:
This publication was made possible by CTSA Grant Number TL1TR001864 from the National Center for Advancing Translational Science (NCATS), a component of the National Institutes of Health (NIH) (Ms. Goldman and Dr. Blumberg). Its contents are solely the responsibility of the authors and do not necessarily represent the official views of NIH. This work was additionally supported by grants from AIM for Youth Mental Health and Klingenstein Third Generation Foundation (Dr. Sankar), as well as the National Institute of Mental Health R61/UG3MH111929, American Foundation for Suicide Prevention, Brain and Behavior Foundation, For the Love of Travis Foundation, International Bipolar Foundation, the Boehm Family Foundation and the John and Hope Furth Endowment (Dr. Blumberg).
Footnotes
Publisher's Disclaimer: This is a PDF file of an unedited manuscript that has been accepted for publication. As a service to our customers we are providing this early version of the manuscript. The manuscript will undergo copyediting, typesetting, and review of the resulting proof before it is published in its final form. Please note that during the production process errors may be discovered which could affect the content, and all legal disclaimers that apply to the journal pertain.
Disclosures
Dr. Blumberg consulted for the Milken institute. All other authors report no financial relationships with commercial interests.
References
- Aguirre L (2021). Navigating the diagnostic challenges of bipolar disorder in youth. JAAPA, 34(8), 21–27. doi: 10.1097/01.JAA.0000758200.80004.87 [DOI] [PubMed] [Google Scholar]
- Alexander GE, DeLong MR, & Strick PL (1986). Parallel organization of functionally segregated circuits linking basal ganglia and cortex. Annu Rev Neurosci, 9, 357–381. doi: 10.1146/annurev.ne.09.030186.002041 [DOI] [PubMed] [Google Scholar]
- Almeida JR, Versace A, Mechelli A, Hassel S, Quevedo K, Kupfer DJ, & Phillips ML (2009). Abnormal amygdala-prefrontal effective connectivity to happy faces differentiates bipolar from major depression. Biol Psychiatry, 66(5), 451–459. doi: 10.1016/j.biopsych.2009.03.024 [DOI] [PMC free article] [PubMed] [Google Scholar]
- Beck AT, Kovacs M, & Weissman A (1979). Assessment of suicidal intention: the scale for suicide ideation. Journal of consulting and clinical psychology, 47, 343–352. [DOI] [PubMed] [Google Scholar]
- Birmaher B, Axelson D, Strober M, Gill MK, Yang M, Ryan N, … Leonard H (2009). Comparison of manic and depressive symptoms between children and adolescents with bipolar spectrum disorders. Bipolar Disord, 11(1), 52–62. doi: 10.1111/j.1399-5618.2008.00659.x [DOI] [PMC free article] [PubMed] [Google Scholar]
- Blond BN, & Blumberg HP (2011). Functional neuroimaging research in bipolar disorder. Curr Top Behav Neurosci, 5, 227–245. doi: 10.1007/7854_2010_67 [DOI] [PubMed] [Google Scholar]
- Blond BN, Fredericks CA, & Blumberg HP (2012). Functional neuroanatomy of bipolar disorder: structure, function, and connectivity in an amygdala-anterior paralimbic neural system. Bipolar Disord, 14(4), 340–355. doi: 10.1111/j.1399-5618.2012.01015.x [DOI] [PMC free article] [PubMed] [Google Scholar]
- Blumberg HP, Martin A, Kaufman J, Leung HC, Skudlarski P, Lacadie C, … Peterson BS (2003). Frontostriatal abnormalities in adolescents with bipolar disorder: preliminary observations from functional MRI. Am J Psychiatry, 160(7), 1345–1347. doi: 10.1176/appi.ajp.160.7.1345 [DOI] [PubMed] [Google Scholar]
- Brambilla P, Nicoletti M, Sassi RB, Mallinger AG, Frank E, Keshavan MS, & Soares JC (2004). Corpus callosum signal intensity in patients with bipolar and unipolar disorder. J Neurol Neurosurg Psychiatry, 75(2), 221–225. Retrieved from https://www.ncbi.nlm.nih.gov/pubmed/14742592 [PMC free article] [PubMed] [Google Scholar]
- Byun MS, Kim JS, Jung WH, Jang JH, Choi JS, Kim SN, … Kwon JS (2012). Regional cortical thinning in subjects with high genetic loading for schizophrenia. Schizophr Res, 141(2–3), 197–203. doi: 10.1016/j.schres.2012.08.028 [DOI] [PubMed] [Google Scholar]
- Chang K, Adleman NE, Dienes K, Simeonova DI, Menon V, & Reiss A (2004). Anomalous prefrontal-subcortical activation in familial pediatric bipolar disorder: a functional magnetic resonance imaging investigation. Archives of general psychiatry, 61(8), 781–792. doi: 10.1001/archpsyc.61.8.781 [DOI] [PubMed] [Google Scholar]
- Chepenik LG, Raffo M, Hampson M, Lacadie C, Wang F, Jones MM, … Blumberg HP (2010). Functional connectivity between ventral prefrontal cortex and amygdala at low frequency in the resting state in bipolar disorder. Psychiatry Res, 182(3), 207–210. doi: 10.1016/j.pscychresns.2010.04.002 [DOI] [PMC free article] [PubMed] [Google Scholar]
- Chilakamarri JK, Filkowski MM, & Ghaemi SN (2011). Misdiagnosis of bipolar disorder in children and adolescents: a comparison with ADHD and major depressive disorder. Ann Clin Psychiatry, 23(1), 25–29. Retrieved from https://www.ncbi.nlm.nih.gov/pubmed/21318193 [PubMed] [Google Scholar]
- DeLisi LE, Szulc KU, Bertisch H, Majcher M, Brown K, Bappal A, … Ardekani BA (2006). Early detection of schizophrenia by diffusion weighted imaging. Psychiatry Res, 148(1), 61–66. doi: 10.1016/j.pscychresns.2006.04.010 [DOI] [PMC free article] [PubMed] [Google Scholar]
- Dell’Osso B, Cafaro R, & Ketter TA (2021). Has Bipolar Disorder become a predominantly female gender related condition? Analysis of recently published large sample studies. Int J Bipolar Disord, 9(1), 3. doi: 10.1186/s40345-020-00207-z [DOI] [PMC free article] [PubMed] [Google Scholar]
- Dickstein DP, Rich BA, Roberson-Nay R, Berghorst L, Vinton D, Pine DS, & Leibenluft E (2007). Neural activation during encoding of emotional faces in pediatric bipolar disorder. Bipolar Disord, 9(7), 679–692. doi: 10.1111/j.1399-5618.2007.00418.x [DOI] [PMC free article] [PubMed] [Google Scholar]
- Diler RS, de Almeida JR, Ladouceur C, Birmaher B, Axelson D, & Phillips M (2013). Neural activity to intense positive versus negative stimuli can help differentiate bipolar disorder from unipolar major depressive disorder in depressed adolescents: a pilot fMRI study. Psychiatry Res, 214(3), 277–284. doi: 10.1016/j.pscychresns.2013.06.013 [DOI] [PMC free article] [PubMed] [Google Scholar]
- Diler RS, Goldstein TR, Hafeman D, Merranko J, Liao F, Goldstein BI, … Birmaher B (2017). Distinguishing Bipolar Depression from Unipolar Depression in Youth: Preliminary Findings. J Child Adolesc Psychopharmacol, 27(4), 310–319. doi: 10.1089/cap.2016.0154 [DOI] [PMC free article] [PubMed] [Google Scholar]
- Diler RS, Pan LA, Segreti A, Ladouceur CD, Forbes E, Cela SR, … Phillips ML (2014). Differential Anterior Cingulate Activity during Response Inhibition in Depressed Adolescents with Bipolar and Unipolar Major Depressive Disorder. J Can Acad Child Adolesc Psychiatry, 23(1), 10–19. Retrieved from https://www.ncbi.nlm.nih.gov/pubmed/24516473 [PMC free article] [PubMed] [Google Scholar]
- Drysdale AT, Grosenick L, Downar J, Dunlop K, Mansouri F, Meng Y, … Liston C (2017). Resting-state connectivity biomarkers define neurophysiological subtypes of depression. Nat Med, 23(1), 28–38. doi: 10.1038/nm.4246 [DOI] [PMC free article] [PubMed] [Google Scholar]
- Duffy A, Alda M, Crawford L, Milin R, & Grof P (2007). The early manifestations of bipolar disorder: a longitudinal prospective study of the offspring of bipolar parents. Bipolar Disord, 9(8), 828–838. doi: 10.1111/j.1399-5618.2007.00421.x [DOI] [PubMed] [Google Scholar]
- Ellard KK, Zimmerman JP, Kaur N, Van Dijk KRA, Roffman JL, Nierenberg AA, … Camprodon JA (2018). Functional Connectivity Between Anterior Insula and Key Nodes of Frontoparietal Executive Control and Salience Networks Distinguish Bipolar Depression From Unipolar Depression and Healthy Control Subjects. Biol Psychiatry Cogn Neurosci Neuroimaging, 3(5), 473–484. doi: 10.1016/j.bpsc.2018.01.013 [DOI] [PMC free article] [PubMed] [Google Scholar]
- First MB, Spitzer RL, Gibbon M, & Williams JBW (1994). Structured clinical interview for Axis I DSM-IV disorders. New York Biometrics Res. [Google Scholar]
- Fischer AS, Holt-Gosselin B, Hagan KE, Fleming SL, Nimarko AF, Gotlib IH, & Singh MK (2022). Intrinsic Connectivity and Family Dynamics: Striatolimbic Markers of Risk and Resilience in Youth at Familial Risk for Mood Disorders. Biol Psychiatry Cogn Neurosci Neuroimaging. doi: 10.1016/j.bpsc.2022.02.009 [DOI] [PMC free article] [PubMed] [Google Scholar]
- Ford KA, Theberge J, Neufeld RJ, Williamson PC, & Osuch EA (2013). Correlation of brain default mode network activation with bipolarity index in youth with mood disorders. J Affect Disord, 150(3), 1174–1178. doi: 10.1016/j.jad.2013.05.088 [DOI] [PubMed] [Google Scholar]
- Fournier JC, Chase HW, Almeida J, & Phillips ML (2016). Within- and Between-Session Changes in Neural Activity During Emotion Processing in Unipolar and Bipolar Depression. Biol Psychiatry Cogn Neurosci Neuroimaging, 1(6), 518–527. doi: 10.1016/j.bpsc.2016.03.005 [DOI] [PMC free article] [PubMed] [Google Scholar]
- Fu X, Ding Y, Chen J, Liu F, Li H, Zhao J, & Guo W (2021). Altered Brain Functional Asymmetry in Patients With Major Depressive Disorder Related to Gastrointestinal Symptoms. Front Neurosci, 15, 797598. doi: 10.3389/fnins.2021.797598 [DOI] [PMC free article] [PubMed] [Google Scholar]
- Garrison KA, Scheinost D, Constable RT, & Brewer JA (2014). BOLD signal and functional connectivity associated with loving kindness meditation. Brain Behav, 4(3), 337–347. doi: 10.1002/brb3.219 [DOI] [PMC free article] [PubMed] [Google Scholar]
- Gigante AD, Bond DJ, Lafer B, Lam RW, Young LT, & Yatham LN (2012). Brain glutamate levels measured by magnetic resonance spectroscopy in patients with bipolar disorder: a meta-analysis. Bipolar Disord, 14(5), 478–487. doi: 10.1111/j.1399-5618.2012.01033.x [DOI] [PubMed] [Google Scholar]
- Goldberg JF, Harrow M, & Whiteside JE (2001). Risk for bipolar illness in patients initially hospitalized for unipolar depression. Am J Psychiatry, 158(8), 1265–1270. doi: 10.1176/appi.ajp.158.8.1265 [DOI] [PubMed] [Google Scholar]
- Goldman DA, Sankar A, Colic L, Villa L, Kim JA, Pittman B, … Blumberg HP (2021). A graph theory-based whole brain approach to assess mood state differences in adolescents and young adults with bipolar disorder. Bipolar Disord. doi: 10.1111/bdi.13144 [DOI] [PMC free article] [PubMed] [Google Scholar]
- Greene AS, Gao S, Scheinost D, & Constable RT (2018). Task-induced brain state manipulation improves prediction of individual traits. Nat Commun, 9(1), 2807. doi: 10.1038/s41467-018-04920-3 [DOI] [PMC free article] [PubMed] [Google Scholar]
- Grotegerd D, Suslow T, Bauer J, Ohrmann P, Arolt V, Stuhrmann A, … Dannlowski U (2013). Discriminating unipolar and bipolar depression by means of fMRI and pattern classification: a pilot study. Eur Arch Psychiatry Clin Neurosci, 263(2), 119–131. doi: 10.1007/s00406-012-0329-4 [DOI] [PubMed] [Google Scholar]
- Han KM, De Berardis D, Fornaro M, & Kim YK (2019). Differentiating between bipolar and unipolar depression in functional and structural MRI studies. Prog Neuropsychopharmacol Biol Psychiatry, 91, 20–27. doi: 10.1016/j.pnpbp.2018.03.022 [DOI] [PubMed] [Google Scholar]
- Jiang X, Dai X, Kale Edmiston E, Zhou Q, Xu K, Zhou Y, … Tang Y (2017). Alteration of cortico-limbic-striatal neural system in major depressive disorder and bipolar disorder. J Affect Disord, 221, 297–303. doi: 10.1016/j.jad.2017.05.025 [DOI] [PubMed] [Google Scholar]
- Jie NF, Zhu MH, Ma XY, Osuch EA, Wammes M, Theberge J, … Calhoun VD (2015). Discriminating Bipolar Disorder From Major Depression Based on SVM-FoBa: Efficient Feature Selection With Multimodal Brain Imaging Data. IEEE Trans Auton Ment Dev, 7(4), 320–331. doi: 10.1109/TAMD.2015.2440298 [DOI] [PMC free article] [PubMed] [Google Scholar]
- Johnston JAY, Wang F, Liu J, Blond BN, Wallace A, Liu J, … Blumberg HP (2017). Multimodal Neuroimaging of Frontolimbic Structure and Function Associated With Suicide Attempts in Adolescents and Young Adults With Bipolar Disorder. Am J Psychiatry, 174(7), 667–675. doi: 10.1176/appi.ajp.2016.15050652 [DOI] [PMC free article] [PubMed] [Google Scholar]
- Jorge RE, Robinson RG, Arndt SV, Starkstein SE, Forrester AW, & Geisler F (1993). Depression following traumatic brain injury: a 1 year longitudinal study. J Affect Disord, 27(4), 233–243. doi: 10.1016/0165-0327(93)90047-n [DOI] [PubMed] [Google Scholar]
- Joshi A, Scheinost D, Okuda H, Belhachemi D, Murphy I, Staib LH, & Papademetris X (2011). Unified Framework for Development, Deployment and Robust Testing of Neuroimaging Algorithms. Neuroinformatics, 9(1), 69–84. doi: 10.1007/s12021-010-9092-8 [DOI] [PMC free article] [PubMed] [Google Scholar]
- Kaufman J, Birmaher B, Brent D, Rao U, Flynn C, Moreci P, … Ryan N (1997). Schedule for Affective Disorders and Schizophrenia for School-Age Children-Present and Lifetime Version (K-SADS-PL): initial reliability and validity data. J Am Acad Child Adolesc Psychiatry, 36(7), 980–988. doi: 10.1097/00004583-199707000-00021 [DOI] [PubMed] [Google Scholar]
- Keener MT, & Phillips ML (2007). Neuroimaging in bipolar disorder: a critical review of current findings. Curr Psychiatry Rep, 9(6), 512–520. doi: 10.1007/s11920-007-0070-2 [DOI] [PMC free article] [PubMed] [Google Scholar]
- Kelberman C, Biederman J, Green A, Spera V, Maiello M, & Uchida M (2021). Differentiating bipolar disorder from unipolar depression in youth: A systematic literature review of neuroimaging research studies. Psychiatry Res Neuroimaging, 307, 111201. doi: 10.1016/j.pscychresns.2020.111201 [DOI] [PMC free article] [PubMed] [Google Scholar]
- Kerestes R, Bhagwagar Z, Nathan PJ, Meda SA, Ladouceur CD, Maloney K, … Blumberg HP (2012). Prefrontal cortical response to emotional faces in individuals with major depressive disorder in remission. Psychiatry research, 202(1), 30–37. doi: 10.1016/j.pscychresns.2011.11.004 [DOI] [PMC free article] [PubMed] [Google Scholar]
- Leow A, Ajilore O, Zhan L, Arienzo D, GadElkarim J, Zhang A, … Altshuler L (2013). Impaired inter-hemispheric integration in bipolar disorder revealed with brain network analyses. Biol Psychiatry, 73(2), 183–193. doi: 10.1016/j.biopsych.2012.09.014 [DOI] [PMC free article] [PubMed] [Google Scholar]
- Lieberman MD, & Cunningham WA (2009). Type I and Type II error concerns in fMRI research: re-balancing the scale. Soc Cogn Affect Neurosci, 4(4), 423–428. doi: 10.1093/scan/nsp052 [DOI] [PMC free article] [PubMed] [Google Scholar]
- Lish JD, Weissman MM, Adams PB, Hoven CW, & Bird H (1995). Family psychiatric screening instruments for epidemiologic studies: pilot testing and validation. Psychiatry research, 57(2), 169–180. doi:0165178195026327 [pii] [DOI] [PubMed] [Google Scholar]
- Marangoni C, De Chiara L, & Faedda GL (2015). Bipolar disorder and ADHD: comorbidity and diagnostic distinctions. Curr Psychiatry Rep, 17(8), 604. doi: 10.1007/s11920-015-0604-y [DOI] [PubMed] [Google Scholar]
- McIntyre RS, & Calabrese JR (2019). Bipolar depression: the clinical characteristics and unmet needs of a complex disorder. Curr Med Res Opin, 35(11), 1993–2005. doi: 10.1080/03007995.2019.1636017 [DOI] [PubMed] [Google Scholar]
- Middleton FA, & Strick PL (2001). Cerebellar projections to the prefrontal cortex of the primate. J Neurosci, 21(2), 700–712. Retrieved from https://www.ncbi.nlm.nih.gov/pubmed/11160449 [DOI] [PMC free article] [PubMed] [Google Scholar]
- Mills KL, Bathula D, Dias TG, Iyer SP, Fenesy MC, Musser ED, … Fair DA (2012). Altered cortico-striatal-thalamic connectivity in relation to spatial working memory capacity in children with ADHD. Front Psychiatry, 3, 2. doi: 10.3389/fpsyt.2012.00002 [DOI] [PMC free article] [PubMed] [Google Scholar]
- Mitchell PB, Goodwin GM, Johnson GF, & Hirschfeld RM (2008). Diagnostic guidelines for bipolar depression: a probabilistic approach. Bipolar Disord, 10(1 Pt 2), 144–152. doi: 10.1111/j.1399-5618.2007.00559.x [DOI] [PubMed] [Google Scholar]
- Nelson EE, & Guyer AE (2011). The development of the ventral prefrontal cortex and social flexibility. Dev Cogn Neurosci, 1(3), 233–245. doi: 10.1016/j.dcn.2011.01.002 [DOI] [PMC free article] [PubMed] [Google Scholar]
- Nimarko AF, Fischer AS, Hagan KE, Gorelik AJ, Lu Y, Young CJ, & Singh MK (2021). Neural Correlates of Positive Emotion Processing That Distinguish Healthy Youths at Familial Risk for Bipolar Versus Major Depressive Disorder. J Am Acad Child Adolesc Psychiatry, 60(7), 887–901. doi: 10.1016/j.jaac.2020.07.890 [DOI] [PMC free article] [PubMed] [Google Scholar]
- Noble S, Scheinost D, & Constable RT (2019). A decade of test-retest reliability of functional connectivity: A systematic review and meta-analysis. Neuroimage, 203, 116157. doi: 10.1016/j.neuroimage.2019.116157 [DOI] [PMC free article] [PubMed] [Google Scholar]
- Nobuhara K, Okugawa G, Sugimoto T, Minami T, Tamagaki C, Takase K, … Kinoshita T (2006). Frontal white matter anisotropy and symptom severity of late-life depression: a magnetic resonance diffusion tensor imaging study. J Neurol Neurosurg Psychiatry, 77(1), 120–122. doi: 10.1136/jnnp.2004.055129 [DOI] [PMC free article] [PubMed] [Google Scholar]
- Oquendo MA, Halberstam B, & Mann JJ (2003). Risk factors for suicidal behavior. Stand Eval Clin Pract, 22, 103–129. [Google Scholar]
- Passarotti AM, Sweeney JA, & Pavuluri MN (2010). Emotion processing influences working memory circuits in pediatric bipolar disorder and attention-deficit/hyperactivity disorder. J Am Acad Child Adolesc Psychiatry, 49(10), 1064–1080. doi: 10.1016/j.jaac.2010.07.009 [DOI] [PMC free article] [PubMed] [Google Scholar]
- Pavuluri MN, Passarotti AM, Harral EM, & Sweeney JA (2009). An fMRI study of the neural correlates of incidental versus directed emotion processing in pediatric bipolar disorder. J Am Acad Child Adolesc Psychiatry, 48(3), 308–319. doi: 10.1097/CHI.0b013e3181948fc7 [DOI] [PMC free article] [PubMed] [Google Scholar]
- Perlman SB, Fournier JC, Bebko G, Bertocci MA, Hinze AK, Bonar L, … Phillips ML (2013). Emotional face processing in pediatric bipolar disorder: evidence for functional impairments in the fusiform gyrus. J Am Acad Child Adolesc Psychiatry, 52(12), 1314–1325 e1313. doi: 10.1016/j.jaac.2013.09.004 [DOI] [PMC free article] [PubMed] [Google Scholar]
- Perry A, Roberts G, Mitchell PB, & Breakspear M (2019). Connectomics of bipolar disorder: a critical review, and evidence for dynamic instabilities within interoceptive networks. Mol Psychiatry, 24(9), 1296–1318. doi: 10.1038/s41380-018-0267-2 [DOI] [PMC free article] [PubMed] [Google Scholar]
- Phillips ML, & Swartz HA (2014). A critical appraisal of neuroimaging studies of bipolar disorder: toward a new conceptualization of underlying neural circuitry and a road map for future research. Am J Psychiatry, 171(8), 829–843. doi: 10.1176/appi.ajp.2014.13081008 [DOI] [PMC free article] [PubMed] [Google Scholar]
- Pompili M, Gonda X, Serafini G, Innamorati M, Sher L, Amore M, … Girardi P (2013). Epidemiology of suicide in bipolar disorders: a systematic review of the literature. Bipolar Disord, 15(5), 457–490. doi: 10.1111/bdi.12087 [DOI] [PubMed] [Google Scholar]
- Qiu A, Crocetti D, Adler M, Mahone EM, Denckla MB, Miller MI, & Mostofsky SH (2009). Basal ganglia volume and shape in children with attention deficit hyperactivity disorder. Am J Psychiatry, 166(1), 74–82. doi: 10.1176/appi.ajp.2008.08030426 [DOI] [PMC free article] [PubMed] [Google Scholar]
- Quadt L, Critchley HD, & Garfinkel SN (2018). The neurobiology of interoception in health and disease. Ann N Y Acad Sci, 1428(1), 112–128. doi: 10.1111/nyas.13915 [DOI] [PubMed] [Google Scholar]
- Repple J, Meinert S, Grotegerd D, Kugel H, Redlich R, Dohm K, … Dannlowski U (2017). A voxel-based diffusion tensor imaging study in unipolar and bipolar depression. Bipolar Disord, 19(1), 23–31. doi: 10.1111/bdi.12465 [DOI] [PubMed] [Google Scholar]
- Rich BA, Fromm SJ, Berghorst LH, Dickstein DP, Brotman MA, Pine DS, & Leibenluft E (2008). Neural connectivity in children with bipolar disorder: impairment in the face emotion processing circuit. J Child Psychol Psychiatry, 49(1), 88–96. doi: 10.1111/j.1469-7610.2007.01819.x [DOI] [PMC free article] [PubMed] [Google Scholar]
- Rich BA, Vinton DT, Roberson-Nay R, Hommer RE, Berghorst LH, McClure EB, … Leibenluft E (2006). Limbic hyperactivation during processing of neutral facial expressions in children with bipolar disorder. Proc Natl Acad Sci U S A, 103(23), 8900–8905. doi: 10.1073/pnas.0603246103 [DOI] [PMC free article] [PubMed] [Google Scholar]
- Robinson RG, Kubos KL, Starr LB, Rao K, & Price TR (1984). Mood disorders in stroke patients. Importance of location of lesion. Brain, 107 (Pt 1), 81–93. doi: 10.1093/brain/107.1.81 [DOI] [PubMed] [Google Scholar]
- Robinson RG, & Starkstein SE (1989). Mood disorders following stroke: new findings and future directions. J Geriatr Psychiatry, 22(1), 1–15. Retrieved from https://www.ncbi.nlm.nih.gov/pubmed/2607085 [PubMed] [Google Scholar]
- Roca M, Del Amo AR, Riera-Serra P, Perez-Ara MA, Castro A, Roman Juan J, … Gili M (2019). Suicidal risk and executive functions in major depressive disorder: a study protocol. BMC Psychiatry, 19(1), 253. doi: 10.1186/s12888-019-2233-1 [DOI] [PMC free article] [PubMed] [Google Scholar]
- Ross AJ, Roule AL, Deveney CM, Towbin KE, Brotman MA, Leibenluft E, & Tseng WL (2021). A preliminary study on functional activation and connectivity during frustration in youths with bipolar disorder. Bipolar Disord, 23(3), 263–273. doi: 10.1111/bdi.12985 [DOI] [PMC free article] [PubMed] [Google Scholar]
- Salk RH, Hyde JS, & Abramson LY (2017). Gender differences in depression in representative national samples: Meta-analyses of diagnoses and symptoms. Psychol Bull, 143(8), 783–822. doi: 10.1037/bul0000102 [DOI] [PMC free article] [PubMed] [Google Scholar]
- Sankar A, Scheinost D, Goldman DA, Drachman R, Colic L, Villa LM, … Blumberg HP (2022). Graph theory analysis of whole brain functional connectivity to assess disturbances associated with suicide attempts in bipolar disorder. Transl Psychiatry, 12(1), 7. doi: 10.1038/s41398-021-01767-z [DOI] [PMC free article] [PubMed] [Google Scholar]
- Saricicek A, Yalin N, Hidiroglu C, Cavusoglu B, Tas C, Ceylan D, … Ozerdem A (2015). Neuroanatomical correlates of genetic risk for bipolar disorder: A voxel-based morphometry study in bipolar type I patients and healthy first degree relatives. J Affect Disord, 186, 110–118. doi: 10.1016/j.jad.2015.06.055 [DOI] [PubMed] [Google Scholar]
- Scheinost D, Benjamin J, Lacadie CM, Vohr B, Schneider KC, Ment LR, … Constable RT (2012). The intrinsic connectivity distribution: a novel contrast measure reflecting voxel level functional connectivity. Neuroimage, 62(3), 1510–1519. doi: 10.1016/j.neuroimage.2012.05.073 [DOI] [PMC free article] [PubMed] [Google Scholar]
- Scheinost D, Papademetris X, & Constable RT (2014). The impact of image smoothness on intrinsic functional connectivity and head motion confounds. Neuroimage, 95, 13–21. doi: 10.1016/j.neuroimage.2014.03.035 [DOI] [PMC free article] [PubMed] [Google Scholar]
- Schmaal L, van Harmelen A-L, Chatzi V, Lippard ET, Toenders YJ, Averill LA, … Blumberg HP (2019). Imaging suicidal thoughts and behaviors: a comprehensive review of 2 decades of neuroimaging studies. Molecular psychiatry, 1–20. [DOI] [PMC free article] [PubMed] [Google Scholar]
- Schmaal L, van Harmelen AL, Chatzi V, Lippard ETC, Toenders YJ, Averill LA, … Blumberg HP (2020). Imaging suicidal thoughts and behaviors: a comprehensive review of 2 decades of neuroimaging studies. Mol Psychiatry, 25(2), 408–427. doi: 10.1038/s41380-019-0587-x [DOI] [PMC free article] [PubMed] [Google Scholar]
- Schmahmann JD, & Sherman JC (1998). The cerebellar cognitive affective syndrome. Brain, 121 (Pt 4), 561–579. doi: 10.1093/brain/121.4.561 [DOI] [PubMed] [Google Scholar]
- Serafini G, Pompili M, Borgwardt S, Houenou J, Geoffroy PA, Jardri R, … Amore M (2014). Brain changes in early-onset bipolar and unipolar depressive disorders: a systematic review in children and adolescents. Eur Child Adolesc Psychiatry, 23(11), 1023–1041. doi: 10.1007/s00787-014-0614-z [DOI] [PubMed] [Google Scholar]
- Siegel-Ramsay JE, Bertocci MA, Wu B, Phillips ML, Strakowski SM, & Almeida JRC (2022). Distinguishing between depression in bipolar disorder and unipolar depression using magnetic resonance imaging: a systematic review. Bipolar Disorders. doi: 10.1111/bdi.13176 [DOI] [PubMed] [Google Scholar]
- Silbersweig DA, Stern E, Frith C, Cahill C, Holmes A, Grootoonk S, … et al. (1995). A functional neuroanatomy of hallucinations in schizophrenia. Nature, 378(6553), 176–179. doi: 10.1038/378176a0 [DOI] [PubMed] [Google Scholar]
- Sobel LJ, Bansal R, Maia TV, Sanchez J, Mazzone L, Durkin K, … Peterson BS (2010). Basal ganglia surface morphology and the effects of stimulant medications in youth with attention deficit hyperactivity disorder. Am J Psychiatry, 167(8), 977–986. doi: 10.1176/appi.ajp.2010.09091259 [DOI] [PMC free article] [PubMed] [Google Scholar]
- Son YD, Han DH, Kim SM, Min KJ, & Renshaw PF (2017). A functional connectivity comparison between attention deficit hyperactivity disorder and bipolar disorder in medication-naive adolescents with mood fluctuation and attention problems. Psychiatry Res Neuroimaging, 263, 1–7. doi: 10.1016/j.pscychresns.2017.02.006 [DOI] [PubMed] [Google Scholar]
- Starr MA (1903). Organic nervous diseases. New York and Philadelphia,: Lea Bros. & Co. [Google Scholar]
- Stoddard J, Gotts SJ, Brotman MA, Lever S, Hsu D, Zarate C, … Leibenluft E (2016). Aberrant intrinsic functional connectivity within and between corticostriatal and temporal-parietal networks in adults and youth with bipolar disorder. Psychol Med, 46(7), 1509–1522. doi: 10.1017/S0033291716000143 [DOI] [PMC free article] [PubMed] [Google Scholar]
- Sun F, Liu Z, Fan Z, Zuo J, Xi C, & Yang J (2022). Dynamical regional activity in putamen distinguishes bipolar type I depression and unipolar depression. J Affect Disord, 297, 94–101. doi: 10.1016/j.jad.2021.10.021 [DOI] [PubMed] [Google Scholar]
- Swann AC (2010). The strong relationship between bipolar and substance-use disorder. Ann N Y Acad Sci, 1187, 276–293. doi: 10.1111/j.1749-6632.2009.05146.x [DOI] [PubMed] [Google Scholar]
- Tang Y, Kong L, Wu F, Womer F, Jiang W, Cao Y, … Wang F (2013). Decreased functional connectivity between the amygdala and the left ventral prefrontal cortex in treatment-naive patients with major depressive disorder: a resting-state functional magnetic resonance imaging study. Psychol Med, 43(9), 1921–1927. doi: 10.1017/S0033291712002759 [DOI] [PubMed] [Google Scholar]
- Tang Y, Ma Y, Chen X, Fan X, Jiang X, Zhou Y, … Wei S (2018). Age-specific effects of structural and functional connectivity in prefrontal-amygdala circuitry in women with bipolar disorder. BMC Psychiatry, 18(1), 177. doi: 10.1186/s12888-018-1732-9 [DOI] [PMC free article] [PubMed] [Google Scholar]
- Tejavibulya L, Peterson H, Greene A, Gao S, Rolison M, Noble S, & Scheinost D (2022). Large-scale differences in functional organization of left- and right-handed individuals using whole-brain, data-driven analysis of connectivity. Neuroimage, 252, 119040. doi: 10.1016/j.neuroimage.2022.119040 [DOI] [PMC free article] [PubMed] [Google Scholar]
- Van Meter AR, Burke C, Youngstrom EA, Faedda GL, & Correll CU (2016). The Bipolar Prodrome: Meta-Analysis of Symptom Prevalence Prior to Initial or Recurrent Mood Episodes. J Am Acad Child Adolesc Psychiatry, 55(7), 543–555. doi: 10.1016/j.jaac.2016.04.017 [DOI] [PubMed] [Google Scholar]
- Wakatsuki Y, Ogura Y, Hashimoto N, Toyomaki A, Miyamoto T, Nakagawa S, … Kusumi I (2022). Subjects with bipolar disorder showed different reward system activation than subjects with major depressive disorder in the monetary incentive delay task. Psychiatry Clin Neurosci, 76(8), 393–400. doi: 10.1111/pcn.13429 [DOI] [PubMed] [Google Scholar]
- Wang F, Kalmar JH, Edmiston EK, Chepenik LG, Bhagwagar Z, Spencer L, … Blumberg HP (2008). Abnormal corpus callosum integrity in bipolar disorder: a diffusion tensor imaging study. Biol Psychiatry, 64(8), 730–733. doi: 10.1016/j.biopsych.2008.06.001 [DOI] [PMC free article] [PubMed] [Google Scholar]
- Wegbreit E, Ellis JA, Nandam A, Fitzgerald JM, Passarotti AM, Pavuluri MN, & Stevens MC (2011). Amygdala functional connectivity predicts pharmacotherapy outcome in pediatric bipolar disorder. Brain Connect, 1(5), 411–422. doi: 10.1089/brain.2011.0035 [DOI] [PMC free article] [PubMed] [Google Scholar]
- Wei Y, Chang M, Womer FY, Zhou Q, Yin Z, Wei S, … Wang F (2018). Local functional connectivity alterations in schizophrenia, bipolar disorder, and major depressive disorder. J Affect Disord, 236, 266–273. doi: 10.1016/j.jad.2018.04.069 [DOI] [PubMed] [Google Scholar]
- Williams JB (1988). A structured interview guide for the Hamilton Depression Rating Scale. Arch Gen Psychiatry, 45(8), 742–747. doi: 10.1001/archpsyc.1988.01800320058007 [DOI] [PubMed] [Google Scholar]
- Winsberg ME, Sachs N, Tate DL, Adalsteinsson E, Spielman D, & Ketter TA (2000). Decreased dorsolateral prefrontal N-acetyl aspartate in bipolar disorder. Biol Psychiatry, 47(6), 475–481. doi: 10.1016/s0006-3223(99)00183-3 [DOI] [PubMed] [Google Scholar]
- Womer FY, Wang F, Chepenik LG, Kalmar JH, Spencer L, Edmiston E, … Blumberg HP (2009). Sexually dimorphic features of vermis morphology in bipolar disorder. Bipolar Disord, 11(7), 753–758. doi: 10.1111/j.1399-5618.2009.00745.x [DOI] [PMC free article] [PubMed] [Google Scholar]
- Yan R, Geng JT, Huang YH, Zou HW, Wang XM, Xia Y, … Lu Q (2022). Aberrant functional connectivity in insular subregions in somatic depression: a resting-state fMRI study. BMC Psychiatry, 22(1), 146. doi: 10.1186/s12888-022-03795-5 [DOI] [PMC free article] [PubMed] [Google Scholar]
- Yip SW, Mackay CE, & Goodwin GM (2014). Increased temporo-insular engagement in unmedicated bipolar II disorder: an exploratory resting state study using independent component analysis. Bipolar Disord, 16(7), 748–755. doi: 10.1111/bdi.12206 [DOI] [PubMed] [Google Scholar]
- Yoshimasu K, Kondo T, Tokunaga S, Kanemitsu Y, Sugahara H, Akamine M, … Kubo C (2009). Mental and somatic symptoms related to suicidal ideation in patients visiting a psychosomatic clinic in Japan. Int J Gen Med, 2, 163–170. doi: 10.2147/ijgm.s6631 [DOI] [PMC free article] [PubMed] [Google Scholar]
- Young RC, Biggs JT, Ziegler VE, & Meyer DA (1978). A rating scale for mania: reliability, validity and sensitivity. Br J Psychiatry, 133, 429–435. doi: 10.1192/bjp.133.5.429 [DOI] [PubMed] [Google Scholar]
- Zhang R, Jiang X, Chang M, Wei S, Tang Y, & Wang F (2019). White matter abnormalities of corpus callosum in patients with bipolar disorder and suicidal ideation. Ann Gen Psychiatry, 18, 20. doi: 10.1186/s12991-019-0243-5 [DOI] [PMC free article] [PubMed] [Google Scholar]
- Zhang T, Bai T, Xie W, Wei Q, Lv H, Wang A, … Wang K (2021). Abnormal connectivity of anterior-insular subdivisions and relationship with somatic symptom in depressive patients. Brain Imaging Behav, 15(4), 1760–1768. doi: 10.1007/s11682-020-00371-x [DOI] [PubMed] [Google Scholar]