



Abstract
Background
Circular RNAs (circRNAs) have been implicated in the initiation and development of various cancers. This study explored the potential contribution of hsa_hsa_circ_0081069 in the progression of colorectal cancer (CRC).
Methods
The gene expression was analyzed by qRT‐PCR. Functional roles of hsa_circ_0081069 were examined by shRNA‐mediated silencing using CCK‐8 proliferation assay, Transwell migration and invasion assay, tube formation assay. The tumorigenesis and metastasis of CRC cells were assess in a xenograft mouse model.
Results
Hsa_circ_0081069 was significantly upregulated in CRC tissues and cells. Hsa_circ_0081069 knockdown suppressed the proliferation, migration and invasion in CRC cells, as well as the angiogenesis. Silencing hsa_circ_0081069 also impaired the tumorigenesis of CRC cells in a xenograft mouse model. Furthermore, miR‐665 was identified as an interacting partner of hsa_circ_0081069, which was negatively regulated by hsa_circ_0081069. miR‐665 targeted the mRNA of E2F3 to suppress its expression. We further demonsatred that miR‐665/E2F3 axis mediated the functional role of hsa_circ_0081069 in regulating the malignant phenotype of CRC cells.
Conclusions
Collectively, our study suggests that hsa_circ_0081069 could serve as a prognostic marker in progression of CRC. Targeting hsa_circ_0081069 and miR‐665/E2F3 axis could serve as potential therapeutic strategies for CRC treatment.
Keywords: colorectal cancer, E2F3, Hsa_circ_0081069, MiR‐665, progression
Circular RNAs (circRNAs) have been implicated tumor initiation and progression. This study explored the role of circ_0081069 in regulating the malignancy of colorectal cancer (CRC). Hsa_circ_0081069 is upregulated in CRC tissues and cell lines, and silencing has_circ_0081069 impairs the malignancy of CRC cells. A high level of has_circ_0081069 expression is correlated with a poor prognosis in CRC patients. Has_circ_0081069 regulates the malignancy of CRC cells by targeting miR‐665/E2F3 axis. Has_circ_0081069 silencing suppresses tumorigenesis and metastasis of CRC cells in a mouse model of CRC xenograft. Together, our data suggest that hsa_circ_0081069 functions as an oncogenic factor in CRC cellsby targeting miR‐665/E2F3 axis, which could serve as a potential therapeutic target for CRC treatment.

1. INTRODUCTION
Colorectal cancer (CRC) is ranked as the third most prevalent cancer worldwide, with a high incidence rate and mortality rate. 1 , 2 , 3 The alteration of the life style and the change of dietary composition have been considered as the fundamental factors contributing to the quick rise of CRC incidence. 4 , 5 At present, optimal surgical resection and chemotherapy remain as the primary treatment for early CRC. 6 , 7 Nevertheless, many patients who are diagnosed with advanced stage of CRC face the challenges of the heterogeneity of cancer cells, development of drug resistance and metastasis, which limit the treatment efficacy in spite of combined chemotherapy and radiotherapy. 8 , 9 , 10 , 11 Underatdinsing the molecular mechanisms of cancer progression could provide novel insights into targeted therapies for cancers with high level of maligancny.
Circular RNAs (circRNAs) are a class of covalently closed RNAs widely expressed in eukaryotic cells. 12 , 13 , 14 They are usually derived from reverse splicing of transcripts by a non‐classical splicing mechanism. 15 , 16 , 17 Although the majority of circRNAs do not code for proteins, some circRNAs were reported to be translated into protein products in cancer cells with unclear functions. 18 , 19 Compared to other non‐coding RNAs, circRNAs possess strong stability due to its closed‐loop structure and resistance to the digestion by RNase R exonuclease. 20 Recent studies identified multiple cicrRNAs and clarified their functions in CRC. For example, has_circ_0000372 was shown to promote CRC procession by upregulating IL6. 21 Has_circ_0001659 was found to be upregulated in CRC and was proposed as a novel diagnostic and prognostic biomarker for CRC. 22 Besides, a recent study showed that hsa_circ_0005615 functions as a ceRNA to promote colorectal cancer progression by upregulating poly [ADP‐Ribose] Polymerase Tankyrase‐1. 23
miRNAs (microRNAs) are endogenous non‐coding RNAs composed of 21–25 nucleotides. miRNAs are implicated in the regulation of tumor progression via translation and degradation of target mRNAs. 24 , 25 For instance, Ma et al. reported that miR‐665 negatively regulates Homolog 1 to suppress tumor cells growth in CRC. 26 Moreover, miR‐665 impaired the self‐renewal capability of tumor stem cells inn CRC by suppressing the expression of signal transducer and activator Of transcription 3 (STAT3). 27 Nevertheless, the regulatory mechanism for miR‐665 expression in CRC still needs to be clarified.
Hsa_circ_0081069 is a newly identified circRNA with little known in cancer biology. Analysis of non‐coding RNA profiling of CRC in GEO database (GSE197991) identified hsa_circ_0081069 as one of the upregulated circRNAs in CRC tissues in comparison to adjacent normal tissues. Hsa_circ_0081069 is formed from pre‐mRNA of COL1A2 (Collagen Type I Alpha 2 Chain) through backsplicing (Supplementary Figure S1A). As shown in Supplementary Figure S1B,C, COL1A2 is highly expressed in CRC tissues (Gepia: www.http://gepia.cancer‐pku.cn/) and is correlated with significantly lower survival of CRC patients (https://kmplot.com/analysis/). We therefore hypothesize that hsa_circ_0081069 might also play a crucial role in the regulation of CRC.
In this study, we found that hsa_circ_0081069 was upregulated in CRC tissue and cell lines. Silencing hsa_circ_0081069 suppressed the proliferation, migration, invasion of CRC cells and the angiogenic potential. We further identified the downstream factors miR‐665 and E2F3 (E2F Transcription Factor 3) which mediates the oncogenic role of hsa_circ_0081069 in CRC cells. These results indicate that targeting hsa_circ_0081069 and miR‐665/E2F3 axis could serve as potential therapeutic strategy for CRC treatment.
2. MATERIAL AND METHODS
2.1. Patient samples collection
A total number of 60 tumor samples and para‐cancerous normal tissues were collected from patients diagnosed with CRC in Taizhou Hospital of Zhejiang Province. All the patients who underwent surgical resection had not been treated with radiotherapy or chemotherapy. The tissues were instantly frozen in liquid nitrogen and conserved at −80°C until further experiment. All patients signed the informed consent. All operations and procedures were approved by the research ethics committee of Taizhou Hospital of Zhejiang Province.
2.2. Cell culture and transfection
CRC cell lines were acquired from Shanghai Fuxiang Biotechnology Co., Ltd, and cultivated in RPMI‐1640 medium supplemented with 10% fetal bovine serum (FBS, Hyclone) and 1% penicillin/streptomycin (Hyclone) in a humidified incubator at 37°C with 5% CO2. miR‐665 mimic/inhibitor and negative controls (miR‐NC or NC inhibitor), and pcDNA.3.1 vector and pcDNA3.1‐E2F3 expression vector were purchased from RiboBio Co. Ltd. Cell transfection was performed using Lipofectamine® 2000 reagent (Thermo Fisher Scientific). In 6‐well plates, 60% confluent cells were transfected with 50 nM of miRNA mimic or inhibitor or 6 μg of plasmid according to manufacturer's instruction. Transfected cells were subjected to subsequent analysis 48 h post‐transfection. To generate cells with stable hsa_circ_0081069 knockdown, pLKO.1‐Puro lentiviral vector was used for shRNA‐mediated gene silencing. Lentivirus with hsa_circ_0081069 shRNA or control shRNA (sh‐NC) were constructed by GenePharma Co. Ltd. 2 × 10⁵ cells were seeded in a 24‐well plates at 50%~60% confluence and the cells were infected with recombinant lentivirus at a MOI (multiplicity of infection) = 5, in the presence of 10 μg polybrene (Sigma, tr‐1003‐g). Infected cells were selected with 1.0 μg/mL puromycin for 2 week. qPCR was performed to confirm the efficiency of shRNA‐mediated knockdown.
2.3. qRT‐PCR analysis
Trizol reagent (Beyontime) was employed to extract total RNA from tissues and cell lines. The extracted total RNA was dissolved in DEPC water and its concentration was measured with NanoDrop. 5 μg of total RNA was used for reverse‐transcription into cDNA using RevertAid First Strand cDNA Synthesis Kit (Thermo Fisher Scientific). The diluted cDNA was then quantified by qPCR in a 7500 Real Time PCR System (Applied Biosystems) using SYBR premix EX TAQ II kit (Takara). The following PCR cycling conditions were used: 95°C 2 min, 40 cycles of 95°C 30 s, 60°C 30 s and 72°C 60 s,. The 2–∆∆Ct method was used to analyze the relative expression level and GAPDH was used as the internal reference. All primer sequences were synthesized by Sangon Biotechnology Co., Ltd.: hsa_circ_0081069 F 5′‐TCGGTCCGGATACCCATATGC‐3′, R 5′‐ATGCCCCAGGGGCAAGGTGC‐3′. miR‐665 5′‐GCGGCTAATACTGCCTGGTAA‐3′, R 5′‐GTGCAGGGTCCGAGGT‐3′ E2F3, F 5′‐TACGATACAAGGCTGTYAGA‐3′, R 5′‐CGTCCGCAATGTGTTAT‐3′ GAPDH F 5′‐AGGTCGGTGTGAACGGA‐3′, R 5′‐AGGGTTTGCCATCCACA‐3′.
2.4. CCK‐8 proliferation assay
48 h after transfection, HCT116 and LoVo cells were seeded in to a 96‐well plate at a density of 1500 cell/well and cultured in a humidified cell culture incubator for 0, 24, 48, 72 h, respectively. Subsequently, 10 μL CCK8 reaction solution (Solarbio) was added to the cell culture at indicated time point and incubated for 1 h in a humidified cell culture incubator. The light absorption value (OD value) in each condition was captured at 450 nm wavelength on a Bio‐Rad microplate reader (Biorad).
2.5. EdU incorporation assay
EdU incorporation assay was performed using Click‐iT™ EdU Cell Proliferation Kit for Imaging, Alexa Fluor™ 555 (Thermo Fisher Scietufic). Prewarmed the 2X EdU solution was mixed with an equal volume of culture medium in a 96‐well plate, and the cells were incubated for 2 h. The medium was discarded and cells were washed twice with PBS, followed by the fixation with 100 μL of 3.7% formaldehyde for 15 min. After the removal of fixative solution, cells were washed twice with 100 μL of PBS with 3% BSA. Then 100 μL of 0.5% Triton® X‐100 in PBS was added to each well for 20‐min incubation. After the removal of the solution, 1 x Click‐iT® reaction cocktail was prepared based on the manufacturer's instruction and added to cells for 30 min. After washing, cells were counter‐stained by 500 nM DAPI in PBS and the images were captured under Leica AM6000 microscope (Leica).
2.6. Transwell assay
The migration and invasion ability of cells were determined using Transwell assay. Cells with different treatments were collected and resuspended in serum‐free medium. The transwell upper chamber (Corning) without Matrigel (BD Biosciences) was used for migration assay, and the transwell upper chamber coated with Matrigel was used for invasion assay. About 5 × 10⁵ cells were inoculated into the upper chamber in serum‐free medium and 500 μL of 20% serum‐containing medium was added to the lower chamber. After 18 h, the cells were fixed with 4% paraformaldehyde at room temperature for 10 min and stained with 0.5% crystal violet (Sigma) for 20 min. Cells were photographed under Leica AM6000 microscope (Leica), and the number of migrating and invading cells were counted from 5 randomly selected fields in each samples.
2.7. RNase R and actinomycin D assay
Rnase R (TaKaRa) was used to degrade linear RNA. The RNA sample was divided equally into two portions: one was used for RNase R treatment (Rnase R+ group), and the other was used as control (Rnase R‐ group). The two portions of samples were incubated at 37°C for 25 min. The relative amount of linear mRNA and circRNA in each sample was detected by qRT‐PCR. For RNA stability assay, the transcription was blocked by 3 μg/mL actinomycin D (Sigma, Germany) for 12 h and RNA samples were collected by TRizol reagent (Beyontime). The stability of liner mRNA and circRNA was analyzed by qRT‐PCR by comparing to that in the samples before treatment (Control).
2.8. Dual‐luciferase reporter assay
To demonstrate the functional interaction between two molecules, the sequence containing the wild type binding sites (WT) or the sequence with mutated binding sites (MUT) were cloned into the PmirGLO firefly luciferase reporter vector (Promega). The reporter plasmid and Renilla luciferase (hRlucneo) control plasmid were co‐transfected into cells with either miRNA mimic or miR‐NC. 48 h after the transfection, the relative luciferase activities were measured using Dual‐Luciferase Reporter Assay Kit (Promega) on a luminescence microplate reader (Biorad).
2.9. RNA pull‐down assay
Cells lysates were collected by IP lysis buffer (Beyotime) and were incubated biotinylated has_circ_0081069 oligo and Control oligo. 10% of the lysates was saved as the input. The mixture was further incubated with M‐280 streptavidin magnetic beads (Sigma‐Aldrich, Germany) for 4 h at 4°C. The magnetic beads were precipitated using a magnetic bar, and washed 4 times with high salt wash buffer. Both the input and the samples on the beads were purified with Trizol reagent according to the manufacturer's protocol. The relative enrichment of miRNAs was quantified by qRT‐PCR.
2.10. RNA immunoprecipitation (RIP) assay
Cell lysates were incubated with with Pierce™ Protein A/G Magnetic Beads (Thermo Fisher Scientific) conjugated with a rabbit anti‐Ago2 (Abcam, ab32381) antibody or with a negative control normal rabbit anti‐IgG (Abcam, ab188776). The mixture was incubated at 4°C for 4 h and the magnetic beads were precipitated using a magnetic bar. Both the input and the samples on the beads were purified with Trizol reagent according to the manufacturer's protocol. The relative enrichment of miRNAs and circRNA was quantified by qRT‐PCR.
2.11. Western blot assay
RIPA lysis buffer containing protease inhibitor cocktail (Thermo Fisher Scientific) was used for protein sample extraction. The supernatant containing total protein lysate was quantified by a BCA Protein assay kit (Beyotime). 10 μg of protein sample was separated on a SDS‐PAGE gel and then transferred to PVDF membrane. After blocking with 5% skimmed milk, the membrane was incubated with primary antibodies at 4°C overnight: E2F3 (1: 2000, ab152126, Abcam), GAPDH (1: 5000, ab8245, Abcam). The membrane was further incubated with HRP‐linked secondary antibody (1:3000, ab97023, Abcam) at room temperature for 1 h. The protein bands were visualized using an enhanced chemiluminescence kit and photographed on a gel imager system (Bio‐Rad).
2.12. Tube formation assay
An in vitro angiogenesis assay kit (Abcam) was used to test the angiogenic potentials of CRC cells. In brief, 50 μL extracellular matrix (ECM) solution was added to a prechilled 96‐well culture plate and incubated at 37°C for 20 min. 2.0 × 10⁴ cells in 100 μL medium were added to each well and incubated for 18 h. Cell morphology was observed with a phase‐contrast microscope (Leica). The Image J Angiogenesis Analyzer [National Institutes of Health (NIH), Bethesda, MD, USA] was used for quantification of the network structure.
2.13. Tumor xenograft experiment
12 Male BALB/c mice (weighting 15 ~ 18 g, 12 weeks) were purchased from Vitalstar and maintained in a germ‐free animal mouse with a 12 h/12 h light and dark cycle. The mice were randomly divided into sh‐hsa_circ_0081069 group (injected with 1 × 10 6 HCT116 cells stably expressing sh‐hsa_circ_0081069), and sh‐NC group (injected with 1 × 10 6 HCT116 cells stably expressing sh‐NC). The tumor volume was measured every 7 days. After 35 days, the mice were sacrificed and the xenograft was collected for further analysis. Immunohistochemical staining (IHC) and Hematoxylin and Eosin (H&E) staining were performed on 5‐μm sections of formalin‐fixed paraffin‐embedded (FFPE) tumor tissues. The expression of Ki‐67 and E2F3 expression in the tumor sections were determined by IHC staining, and lung metastasis was assessed by histological H&E staining. The above animal procedures were approved by the animal use and care committee of Taizhou Hospital of Zhejiang Province.
2.14. Statistical analysis
Statistical analyses were carried out using SPSS 20.0 software (IBM SPSS). Figures and data presentation were prepared by GraphPad Prism 7.0. (GraphPad). Unpaired Student's t test or one‐way analysis of variance (ANOVA) was applied to determine the statistical significance between two groups or among multiples groups. Spearman correlation analysis was performed to determine the correlation between the expression levels of two molecules. Kaplan Meier Curve and log‐rank test were used to compare the cumulative survival rates in 120 CRC patients. Chi‐square test was employed to the association between hsa_circ_0081069 expression level and different clinopathologial parameters in CRC patients. p < 0.05 was deemed as statistically significant.
3. RESULTS
3.1. Hsa_circ_0081069 was upregulated in CRC tissues and cell lines
Through the curcRNA database (http://www.circbase.org/), hsa_circ_0081069 consists of 558 nt and is formed by circularization of exons 3–13 of pre‐mRNA of COL1A2 (Figure 1A). We examined the expression level of hsa_circ_0081069 between CRC cell lines (DLD1, HCT116, HCT8, LOVO, SW480, SW620, HT29), and normal intestine epithelial FHC cells. qRT‐PCR analysis showed that hsa_circ_0081069 expression level was significantly higher in CRC cell lines (Figure 1B). HCT116 and LOVO cells with highest hsa_circ_0081069 expression were selected for the further experiments. Actinomycin D treatment showed that after transcription blockage, linear COL1A2 mRNA level dereaced gradually, while the level of hsa_circ_0081069 remained stable (Figure 1C). RNase R digestion experiment further showed that hsa_circ_0081069 was resistant to the degradation by RNase R treatment. (Figure 1D). Besides, qRT‐PCR analysis demonstrated that hsa_circ_0081069 was upregulated in CRC tissues when compared to para‐cancerous normal tissues (Figure 1E). The patients were the divided into high‐ and low‐ expression groups based on the median level of hsa_circ_0081069. In CRC patients a high level of hsa_circ_0081069 expression was associated with a poor prognosis (Figure 1F). In addition, we explored the relationship between hsa_circ_0081069 expression level and the clinicopathological parameters in CRC patients. A high level of hsa_circ_0081069 expression was significantly associated with advanced tumor stage, a large tumor size, distal node metastasis, tumor invasion and lymph node metastasis (Table 1). Together, these results suggest that high hsa_circ_0081069 expression indicate a poor prognosis in CRC patients.
FIGURE 1.
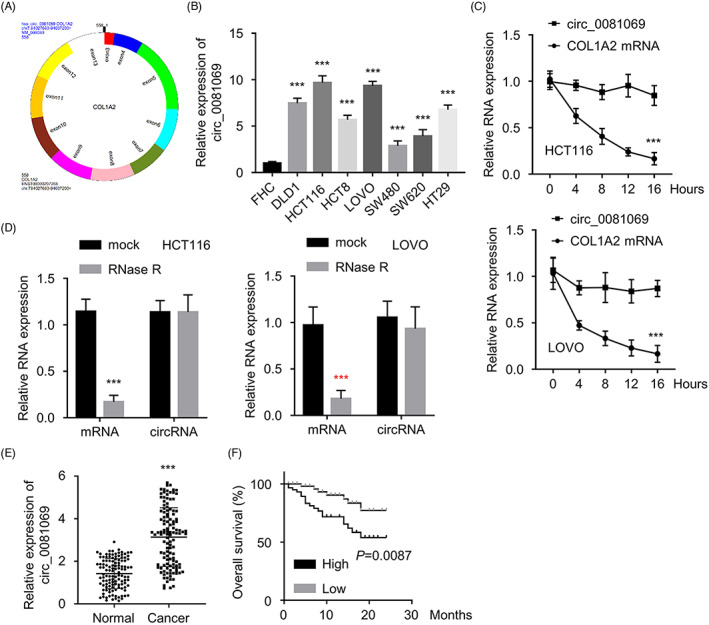
Hsa_circ_0081069 was upregulated in CRC tissues and cells. (A) Schematic illustration of Hsa_circ_0081069 structure. (B) qRT‐PCR analysis of hsa_circ_0081069 expression in CRC cell lines and FHC cells. (C) Cells were treated with Actinomycin D, and the level of Hsa_circ_0081069 and COL1A2 mRNA at different time points were determined by qRT‐PCR. (D) Expression level of hsa_circ_0081069 and COL1A2 mRNA after RNase R treatment was determined by qRT‐PCR. (E) Hsa_circ_0081069 expression was determined by qRT‐PCR in CRC tissues and para‐cancerous tissues. (F) KM‐plotter analysis of the overall survival of CRC patients in Hsa_circ_0081069 high and low expression group. ***p < 0.001
TABLE 1.
Relationship between hsa_circ_0081069 expression level and clinicopathological parameters in CRC patients
| Characteristics | circ_0081069 expression | p value | |
|---|---|---|---|
| Low (n = 60) | High (n = 60) | ||
| Age (years) | 0.2636 | ||
| <60 | 33 | 39 | |
| ≥60 | 27 | 21 | |
| Gender | 0.2709 | ||
| Male | 30 | 36 | |
| Female | 30 | 24 | |
| Tumor size | 0.0277 | ||
| ≤5 cm | 39 | 27 | |
| >5 cm | 21 | 33 | |
| Tumor invasion | 0.0061 | ||
| T1 + T2 | 36 | 21 | |
| T3 + T4 | 24 | 39 | |
| Lymph node metastasis | 0.0175 | ||
| Negative | 38 | 25 | |
| Positive | 22 | 35 | |
| Distant metastasis | 0.0229 | ||
| M0 | 57 | 49 | |
| M1 | 3 | 11 | |
| Clinical satge | 0.0446 | ||
| I + II | 35 | 24 | |
| III + IV | 25 | 36 | |
3.2. Silencing hsa_circ_0081069 suppressed the proliferation, migration, invasion of CRC cells and the angiogenic potential
To confirm the functional role of hsa_circ_0081069, we constructed cells stably expressing hsa_circ_0081069 shRNA (sh‐hsa_circ_0081069#1, sh‐hsa_circ_0081069#2, sh‐hsa_circ_0081069#3) or control shRNA (sh‐NC) by lentivirus. Among them, sh‐hsa_circ_0081069#1 showed the strongest knockout effect, which was used in the following study (Figure 2A). Importantly, we showed that sh‐hsa_circ_0081069#1 did not affect the level of COL1A2 mRNA (Figure 2B). CCK‐8 proliferation assay and EdU incorporation assay demonstrated that hsa_circ_0081069 silencing suppressed cell proliferation and DNA synthesis in both HCT116 and LOVO cells (Figure 2C,D). Transwell assays further showed that hsa_circ_0081069 silencing dampened the invasion and migration capability (Figure 2E,F). Similarly, hsa_circ_0081069 deficiency impaired the tube forming ability (Figure 2G). The above results implied that hsa_circ_0081069 is indispensable for maintaining the malignant phenotype of CRC cells.
FIGURE 2.
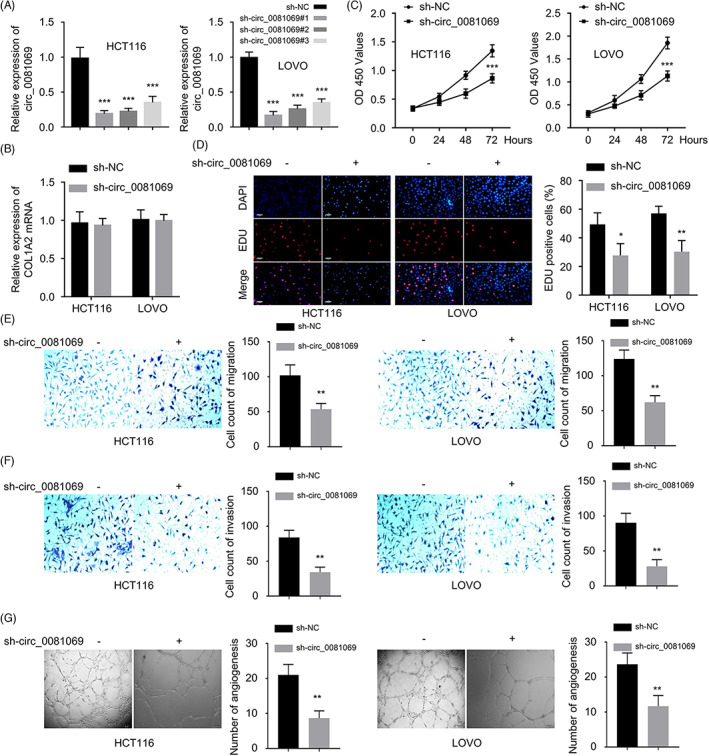
Knockdown of hsa_circ_0081069 suppressed the proliferation, migration, invasion and angiogenesis. (A) qRT‐PCR analysis of the knockdown efficiency of sh‐hsa_circ_0081069 #1, #2 and #3 in HCT116 and LoVo cells. (B) COL1A2 mRNA expression in sh‐NC and sh‐hsa_circ_0081069 was measured by qRT‐PCR. (C) CCK8 proliferation assay was performed upon hsa_circ_0081069 silencing. (D) EdU incorporation assay was performed upon hsa_circ_0081069 silencing. (E, F) Transwell migration and invasion assays were performed upon hsa_circ_0081069 silencing. (G) Tube formation assay in cells upon hsa_circ_0081069 silencing. *p < 0.05. **p < 0.01. ***p < 0.001
3.3. Hsa_circ_0081069 targeted miR‐665
We next carried out a nucleocytoplasmic fraction to determine the abundance of hsa_circ_0081069 between the cytoplasm nd the nucleus. It was found that hsa_circ_0081069 was mainly located in the cytoplasm (Figure 3A). Through the analysis of three databases, we identified 3 potential interacting miRNAs (hsa‐miR‐665, hsa‐miR‐487a‐3p, hsa‐miR‐1286) for hsa_circ_0081069 (Figure 3B). Moreover, RNA pull‐down assay demonsatred that biotinylaed‐hsa_circ_0081069 probe could enrich miR‐665, while the other two miRNAs were not enriched (Figure 3C). Moreover, RIP analysis showed that both hsa_circ_0081069 and miR‐665 could be enriched by anti‐Ago2 antibody, indicating they are interacting with miRNA processing complex (Figure 3D). In CRC cells, miR‐665 was downregulated compared to normal intestine epithelial FHC cells (Figure 3E), as well as in the CRC tissues (Figure 3F). In CRC tissues, hsa_circ_0081069 expression was negatively correlated with the miR‐665 expression (Figure 3G), and the dual luciferase reporter assay showed that miR‐665 mimic could suppress the luciferase activity in WT reporter but not the MUT reporter (Figure 3H). In the meanwhile, hsa_circ_0081069 depletion caused the upregulation of miR‐665 in CRC cells (Figure 3I). These data suggest that hsa_circ_0081069 interacts with miR‐665 and negatively regulates its expression.
FIGURE 3.
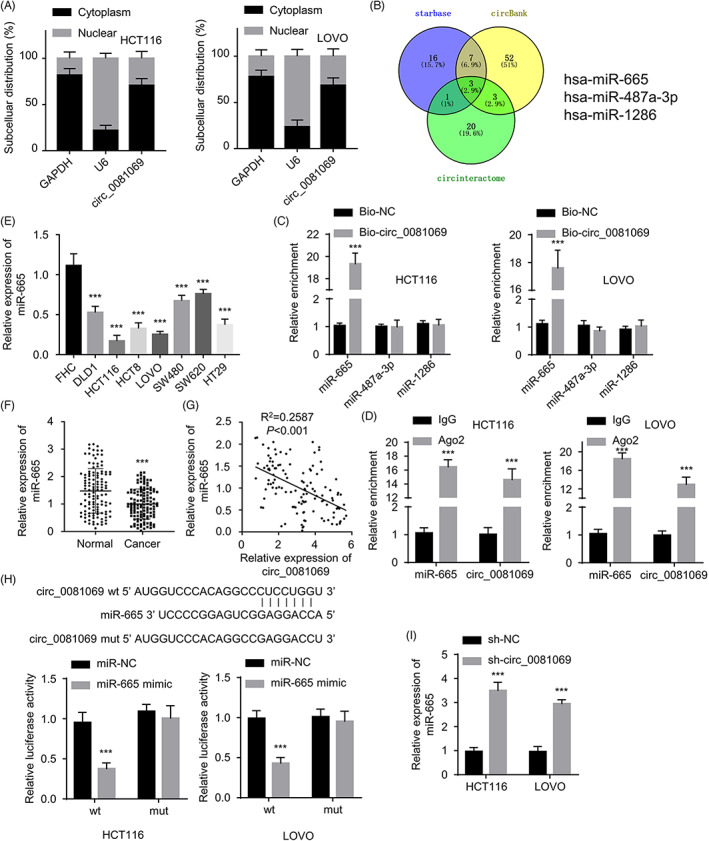
Hsa_circ_0081069 targeted miR‐665. (A) qRT‐PCR was used to quantify the relative abundance of hsa_circ_0081069 in the nucleus and cytoplasm. (B) The potential interacting miRNAs of hsa_circ_0081069 were predicted via Starbase, circBank, and circIntreactome. (C) RNA pull‐down analysis using biotinylated control oligo or hsa_circ_0081069 probe. (D) RIP assay using IgG or anti‐Ago2 antibody. (E) MiR‐665 expression was assessed in different cell lines by qRT‐PCR. (F) MiR‐665 expression was assessed in CRC tissue and para‐cancerous tissues by qRT‐PCR. (G) Pearson correlation analysis of the correlation between hsa_circ_0081069 and miR‐665 in CRC tissues. (H) Dual luciferase reporter assay using WT or MUT reporter, in the presence of miR‐665 mimic or miR‐NC. (I) miR‐665 expression level was assess by qRT‐PCR upon hsa_circ_0081069 knockdown. ***p < 0.001
3.4. miR‐665 negatively regulated E2F3 in CRC cells
In order to find the downstream target of miR‐665, we searched the Starbase and found that E2F3 mRNA 3’‐UTR contains potential binding sites for miR665, and the dual luciferase reporter assay showed that miR‐665 mimic could suppress the luciferase activity in WT reporter of E2F2, but showed no effect for the MUT reporter (Figure 4A). The expression level of E2F3 mRNA was significantly increased in CRC tissues compared to the para‐cancerous normal tissues (Figure 4B). Using pearson correlation analysis assays, we found that E2F3 expression was negatively correlated with miR‐665, but positively correlated with hsa_circ_0081069 level (Figure 4C,D). Consistently, the level of E2F3 mRNA was significantly higher in CRC cell lines (Figure 4E). The transfection of miR‐665 mimic dampened E2F3 expression at protein level (Figure 4F). There results indicate that E2F3 is a downstream target of miR‐665.
FIGURE 4.

MiR‐665 targeted E2F3. (A) Dual luciferase reporter assay using WT or MUT reporter, in the presence of miR‐665 mimic or miR‐NC. (B) E2F3 expression was determined via qRT‐PCR in CRC tissues and para‐cancerous tissues. (C‐D) Pearson correlation analyses of the correlations between E2F3 and hsa_circ_0081069, or between E2F3 and miR‐665. (E) E2F3 expression determined in different cell lines by qRT‐PCR. (F) E2F3 protein protein level was determined by Western blot upon the transfection of miR‐665 mimic. **/***p < 0.01/0.001
3.5. Hsa_circ_0081069 regulated the malignancy of CRC cells via miR‐665/E2F3 axis
In order to investigate whether miR‐665/E2F3 axis mediates the effect of hsa_circ_0081069 in CRC cells, we transfcted CRC cells with miR‐665 inhibitor or pcDNA3.1‐E2F3 expression vector to knockdown miR‐665 or overexpress E2F2 respetively (Figure 5A,B). Further, we showed that silencing hsa_circ_0081069 reduced E2F3 protein level, while the co‐transfection of miR‐665 inhibitor or pcDNA‐E2F3 could restore E2F3 expression (Figure 5C). Functional assays further showed that hsa_circ_0081069 knockdown suppressed cell proliferation, the migration and invasion ability, and the tube formation; while the co‐transfection of miR‐665 inhibitor or pcDNA‐E2F3 partially restore these cellular functions (Figure 5D–H). The above results indicate that hsa_circ_0081069 regulated the malignancy of CRC cells via miR‐665/E2F3 axis.
FIGURE 5.
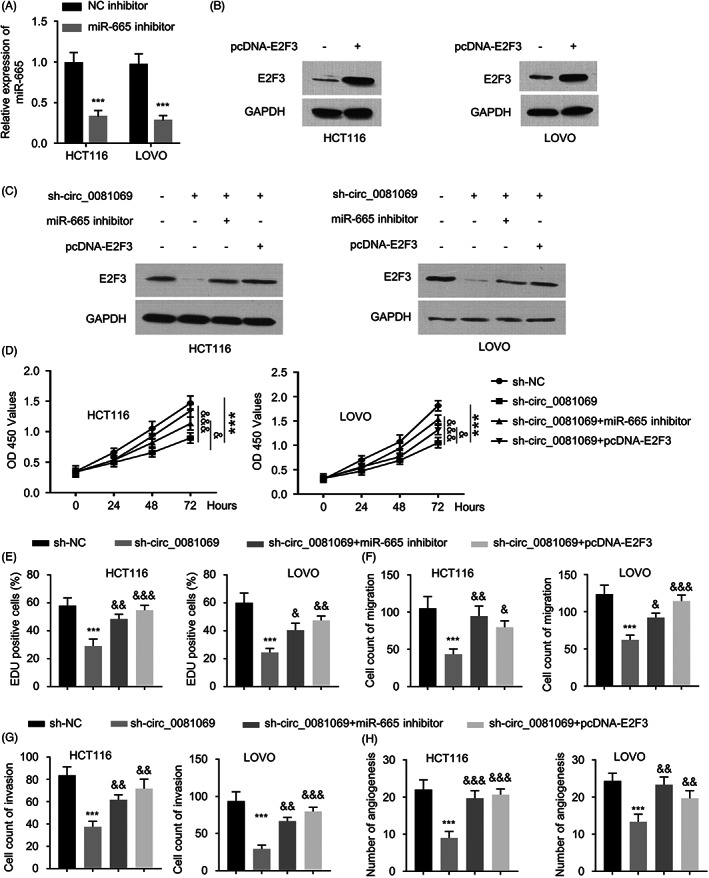
Hsa_circ_0081069 regulated the malignancy of CRC cells via miR‐665/E2F3 axis. (A) miR‐665 expression level was determined by qRT‐PCR upon miR‐665 inhibitor transfection. (B) E2F3 expression level was determined by Western blot upon the transfection of pcDNA3.1‐E2F3. (C) Western blot analysis of E2F3 expression in the following groups: control, sh‐hsa_circ_0081069, sh‐hsa_circ_0081069 + miR‐665 inhibitor, sh‐hsa_circ_0081069 + pcDNA‐E2F3. (D–H) Cell proliferation assay, EdU incorporation assay, transwell migration and invasion assay, and tube formation assay were performed in cells of different groups: control, sh‐hsa_circ_0081069, sh‐hsa_circ_0081069 + miR‐665 inhibitor, sh‐hsa_circ_0081069 + pcDNA‐E2F3 transfection. ***p < 0.001 compared with sh‐NC, &&/&&& p < 0.01/0.001 compared with sh‐hsa_circ_0081069
3.6. Hsa_circ_0081069 silencing impaired the tumorigenesis in xenograft mouse model
To further validate the oncogenic role of hsa_circ_0081069 in vivo, 12 Male BALB/c mice randomly divided into sh‐hsa_circ_0081069 group (injected with HCT116 cells stably expressing sh‐hsa_circ_0081069), and sh‐NC group (injected with HCT116 cells stably expressing sh‐NC). Cells with hsa_circ_0081069 knockdown showed a retarded tumor growth and reduced tumor weight (Figure 6A,B). IHC staining in the xenograft sections revealed a reduced level of Ki‐67 and E2F3 expression in the group of hsa_circ_0081069 knockdown (Figure 6C). In the xenograft tissues, silencing hsa_circ_0081069 caused the upregulation of miR‐665 and the downregulation of E2F3 expression at RNA level (Figure 6D). We also further H&E staining of the lung tissue to examine the lung metastasis. The results showed hsa_circ_0081069 silencing significantly suppressed the lung metastasis of HCT 116 cells (Figure 6E). Therefore, hsa_circ_0081069 is also required for the tumorigenesis and malignancy of CRC cells in vivo.
FIGURE 6.
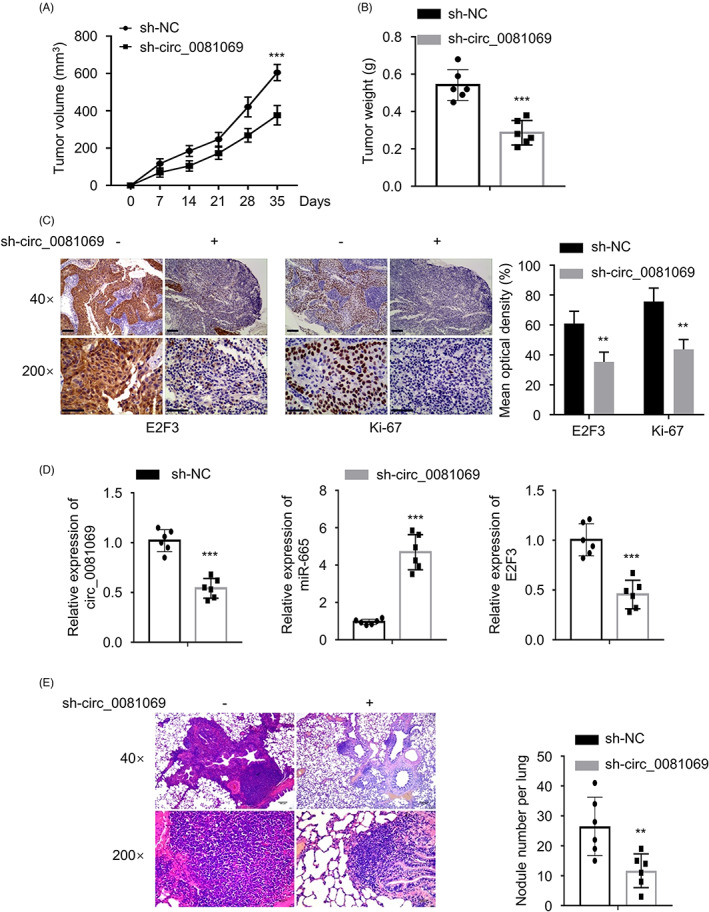
Hsa_circ_0081069 silencing suppressed tumorigenesis in vivo. 12 Male BALB/c mice randomly divided into sh‐hsa_circ_0081069 group (injected with HCT116 cells stably expressing sh‐hsa_circ_0081069), and sh‐NC group (injected with HCT116 cells stably expressing sh‐NC). (A) Tumor volume was measured every 7 days. (B) Tumor weight was determined at day 35. (C) IHC staining of Ki‐67 and E2F3 expression level in the xenograft tissue sections. (D) Hsa_circ_0081069, E2F3 and miR‐665 expression levels were determined by qRT‐PCR. (E) H&E staining of the lung tissue section to evaluate the metastases. **/***p < 0.01/0.001
4. DISCUSSION
CircRNAs are widely expressed in eukaryotic cells and implicated in the regulation of different biological processes. 28 , 29 , 30 Accumulating evidence indicate that the deregulation of circRNAs contributes to the tumor initiation and progression. 31 , 32 , 33 For example, Chen et al. showed that has_circ_101555 promotes the proliferation and progression of CRC via regulating miR‐597‐5p/CDK6 axis. 34 In addition, Xie et al. demonstrated that has_circ_001569 acts as a sponge of miR‐145 to suppress the progression of CRC in vivo. 35 The results of Yang et al. revealed that circPRMT5 promotes the proliferation of CRC cells through sponging miR‐377 and upregulating E2F3 expression. 36 Nevertheless, the functional role of hsa_circ_0081069 in CRC needs to be elucidated.
We found that hsa_circ_0081069 was upregulated in CRC tissues and cell lines. A high level of hsa_circ_0081069 expression was not only associated with advanced tumor stage, tumor invasion and lymph node metastasis, but also correlated with a poor prognosis in CRC patients. Additionally, functional assays demonstrated that hsa_circ_0081069 silencing impaired cell proliferation, migration and invasion, as well as the angiogenic potential of CRC cells, indicating that hsa_circ_0081069 serves as an indispensable oncogenic factor in CRC. Angiogenesis is an important process for tumor growth and metastasis. 37 , 38 The growth and survival of a rapidly‐growing tumor population depends on neovascularization to supply oxygen and nutrients. 39 As Qian et al. showed, miR‐143 suppresses the proliferation and angiogenesis in CRC, which promotes the chemosensitivity to oxaliplatin administration. 40 Our data further showed that silencing hsa_circ_0081069 not only retarded the tumorigenesis of CRC cells in vivo, but also suppressed the metastasis of CRC to lung tissues. Together, these data imply that hsa_circ_0081069 upregulation contributes to the malignant progression of CRC.
To further explore the molecular mechanism of hsa_circ_0081069 in CRC, we identified miR‐665 as a downstream target, which is negatively regulated by hsa_circ_0081069. Both dual luciferase reporter assay and RNA pull‐down analysis corroborated the physical and functional interaction between miR‐665 and hsa_circ_0081069. Furthermore, the expression level of miR‐665 was negatively correlated with hsa_circ_0081069 in CRC tissues and cells, suggesting that they play opposite roles in CRC. Ma et al. reported that miR‐665 negatively regulates Homolog 1 to suppress tumor cells growth in CRC. 26 Moreover, miR‐665 impaired the self‐renewal capability of tumor stem cells inn CRC by suppressing the expression of signal transducer and activator Of transcription 3 (STAT3). 27 Together, these data suggest that in CRC miR‐655 acts as a tumor‐suppressor and is downregulated in CRC.
E2F3 is an important positive regulator of cell cycle progression. 41 Hong et al. showed that E2F3 was upregulated in bladder cancer, and its silencing restrained the proliferation of bladder cancer cells. 42 E2F3 could also promote liver cancer progression and its expression is regulated by circ‐PRKAR1B. 43 Our results showed that E2F3 was upregulated in CRC in tissues and cells, which was positively correlated with sh‐hsa_circ_0081069 and negatively correlated with miR‐665. miR‐665 overexpression could directly decrease E2F3 protein level. Furthermore, our functional assays demonstrated that hsa_circ_0081069 regulates the malignancy of CRC cells by targeting miR‐665/E2F3 axis. Those data collectively highlighted the oncogenic role of E2F3 in CRC progression, and its regulation by hsa_circ_0081069 and miR‐665.
In summary, our study showed that the upregulation of hsa_circ_0081069 in CRC tissues and cells, and its oncogenic role in maintaining the malignancy of CRC cells. Hsa_circ_0081069 silencing suppresses tumorigenesis and metastasis in CRC via targeting miR‐665/E2F3 axis. Future work need to elucidate how hsa_circ_0081069 is upregulated in order to formulate strategy to dampen its expression in CRC. In addition, as little is known about the role of hsa_circ_0081069 in cancer biology, its potential implications in other types of cancers need to be studied in future work.
AUTHOR CONTRIBUTIONS
Jianying Jin, Jingjing Xie, Dan Jin conceived and designed the experiments, Jingjing Xie, Dan Jin, Jinyin Xu, Fei Yang, Jianying Jin, YL T, G Z, performed the experiments and wrote the paper, Jingjing Xie, Dan Jin1, Fei Yang analyzed the data. All authors approved the final version. All authors approved the final manuscript as submitted and agree to be accountable for all aspects of the work.
CONFLICT OF INTEREST
The authors declare that they have no conflict of interest.
PATENT CONSENT STATEMENT
All the patients signed the informed consent.
CONSENT FOR PUBLICATION
All cases provided the informed consent.
PERMISSION TO REPRODUCE MATERIAL FROM OTHER SOURCES
Not applicable.
Supporting information
Supplementary Figure S1
Xie J, Jin D, Xu J, Yang F, Jin J. Hsa_hsa_circ_0081069 promotes the progression of colorectal cancer through sponging miR‐665 and regulating E2F3 expression. J Clin Lab Anal. 2022;36:e24710. doi: 10.1002/jcla.24710
DATA AVAILABILITY STATEMENT
The data that support the findings of this study are available on request from the corresponding author. The data are not publicly available due to privacy or ethical restrictions.
REFERENCES
- 1. Callens C, De Cauwer H, Viaene M, Vanneste D, Eyben A, Coeman D. Sarcoidosis‐like disease with pulmonary infestation, meningoencephalitis and transverse myelitis after sigmoid cancer treatment. Acta Gastroenterol Belg. 2021;84(4):672‐674. [DOI] [PubMed] [Google Scholar]
- 2. Wang LL, Zou SM, Dong L, et al. Classification and genetic counselling for a novel splicing mutation of the MLH1 intron associated with lynch syndrome in colorectal cancer. Gastroenterol Rep (Oxf). 2021;9(6):552‐559. [DOI] [PMC free article] [PubMed] [Google Scholar]
- 3. Völkel V, Klinkhammer‐Schalke M, Fürst A. Falling mortality thanks to improved treatment for colorectal cancer. Dtsch Arztebl Int. 2021;118(39):664. [DOI] [PMC free article] [PubMed] [Google Scholar]
- 4. Włodarczyk J, Płoska M, Płoski K, Fichna J. The role of short‐chain fatty acids in inflammatory bowel diseases and colorectal cancer. Postepy Biochem. 2021;67(3):223‐230. [DOI] [PubMed] [Google Scholar]
- 5. Furman SA, Stern AM, Uttam S, Taylor DL, Pullara F, Chennubhotla SC. In situ functional cell phenotyping reveals microdomain networks in colorectal cancer recurrence. Cell rep. Methods. 2021;1(5):100072. [DOI] [PMC free article] [PubMed] [Google Scholar]
- 6. Tang J, Wang D, Shen Y, Xue F. ATG16L2 overexpression is associated with a good prognosis in colorectal cancer. J Gastrointest Oncol. 2021;12(5):2192‐2202. [DOI] [PMC free article] [PubMed] [Google Scholar]
- 7. Nagayama S, Low SK, Kiyotani K, Nakamura Y. Precision medicine for colorectal cancer with liquid biopsy and immunotherapy. Cancers (Basel). 2021;13(19):4803. [DOI] [PMC free article] [PubMed] [Google Scholar]
- 8. Byttner M, Wedin R, Bauer H, Tsagozis P. Outcome of surgical treatment for bone metastases caused by colorectal cancer. J Gastrointest Oncol. 2021;12(5):2150‐2156. [DOI] [PMC free article] [PubMed] [Google Scholar]
- 9. Chen YC, Chien CY, Hsu CC, et al. Obesity‐associated leptin promotes chemoresistance in colorectal cancer through YAP‐dependent AXL upregulation. Am J Cancer Res. 2021;11(9):4220‐4240. [PMC free article] [PubMed] [Google Scholar]
- 10. Jin M, Shang F, Wu J, et al. Tumor‐associated microbiota in proximal and distal colorectal cancer and their relationships with clinical outcomes. Front Microbiol. 2021;12:727937. [DOI] [PMC free article] [PubMed] [Google Scholar]
- 11. Abdelrahim M, Esmail A, Abudayyeh A, et al. Transplant oncology: an evolving field in cancer care. Cancers (Basel). 2021;13(19):4911. [DOI] [PMC free article] [PubMed] [Google Scholar]
- 12. Tan Q, Liu C, Shen Y, Huang T. Circular RNA circ_0000517 facilitates the growth and metastasis of non‐small cell lung cancer by sponging miR‐326/miR‐330‐5p. Cell J. 2021;23(5):552‐561. [DOI] [PMC free article] [PubMed] [Google Scholar]
- 13. Pan X, Cen X, Zhang B, et al. Circular RNAs as potential regulators in bone remodeling: a narrative review. Ann Transl Med. 2021;9(19):1505. [DOI] [PMC free article] [PubMed] [Google Scholar]
- 14. Fan X, Yin X, Zhao Q, Yang Y. Hsa_circRNA_0045861 promotes renal injury in ureteropelvic junction obstruction via the microRNA‐181d‐5p/sirtuin 1 signaling axis. Ann Transl Med. 2021;9(20):1571. [DOI] [PMC free article] [PubMed] [Google Scholar]
- 15. Bao L, Wang M, Fan Q. Hsa_circ_NOTCH3 regulates ZNF146 through sponge adsorption of miR‐875‐5p to promote tumorigenesis of hepatocellular carcinoma. J Gastrointest Oncol. 2021;12(5):2388‐2402. [DOI] [PMC free article] [PubMed] [Google Scholar]
- 16. Wang N, Zhou Y, Zuo Z, et al. Construction of a competing endogenous RNA network related to the prognosis of cholangiocarcinoma and comprehensive analysis of the immunological correlation. J Gastrointest Oncol. 2021;12(5):2287‐2309. [DOI] [PMC free article] [PubMed] [Google Scholar]
- 17. Fang Y, E C, Wu S, Meng Z, Qin G, Wang R. Circ‐IGF1R plays a significant role in psoriasis via regulation of a miR‐194‐5p/CDK1 axis. Cytotechnology. 2021;73(6):775‐785. [DOI] [PMC free article] [PubMed] [Google Scholar]
- 18. Li Z, Ruan Y, Zhang H, Shen Y, Li T, Xiao B. Tumor‐suppressive circular RNAs: mechanisms underlying their suppression of tumor occurrence and use as therapeutic targets. Cancer Sci. 2019;110:3630‐3638. [DOI] [PMC free article] [PubMed] [Google Scholar]
- 19. Lu Y, Li Z, Lin C, Zhang J, Shen Z. Translation role of circRNAs in cancers. J Clin Lab Anal. 2021;35(7):e23866. [DOI] [PMC free article] [PubMed] [Google Scholar]
- 20. Xu Y, Zhao R, Wang H, et al. Circular RNA PRMT5 knockdown enhances cisplatin sensitivity and immune response in non‐small cell lung cancer by regulating miR‐138‐5p/MYH9 axis. J BUON. 2021;26(5):1850‐1861. [PubMed] [Google Scholar]
- 21. Liu X, Qin Y, Tang X, Wang Y, Bian C, Zhong J. Circular RNA circ_0000372 contributes to the proliferation, migration and invasion of colorectal cancer by elevating IL6 expression via sponging miR‐495. Anticancer Drugs. 2021;32(3):296‐305. [DOI] [PubMed] [Google Scholar]
- 22. He B, Chao W, Huang Z, et al. Hsa_circ_001659 serves as a novel diagnostic and prognostic biomarker for colorectal cancer. Biochem Biophys Res Commun. 2021;551:100‐106. [DOI] [PubMed] [Google Scholar]
- 23. Ma Z, Han C, Xia W, et al. circ5615 functions as a ceRNA to promote colorectal cancer progression by upregulating TNKS. Cell Death Dis. 2020;11(5):356. [DOI] [PMC free article] [PubMed] [Google Scholar]
- 24. Talesh Sasani S, Soltani MB, Mehrabi R, Fereidoun Padasht‐Dehkaei HS. Expression alteration of candidate Rice MiRNAs in response to sheath blight disease. Iran. J Biotechnol. 2020;18(4):e2451. [DOI] [PMC free article] [PubMed] [Google Scholar]
- 25. Gholamrezaei M, Rouhani S, Mohebali M, et al. MicroRNAs expression induces apoptosis of macrophages in response to leishmania major (MRHO/IR/75/ER): an in‐vitro and in‐vivo study. Iran J Parasitol. 2020;15(4):475‐487. [DOI] [PMC free article] [PubMed] [Google Scholar]
- 26. Ma X, Deng C. Circ_0044556 promotes the progression of colorectal cancer via the miR‐665‐dependent expression regulation of diaphanous homolog 1. Dig Dis Sci. 2021;67:4458‐4470. [DOI] [PubMed] [Google Scholar]
- 27. Ouyang S, Zhou X, Chen Z, Wang M, Zheng X, Xie M. LncRNA BCAR4, targeting to miR‐665/STAT3 signaling, maintains cancer stem cells stemness and promotes tumorigenicity in colorectal cancer. Cancer Cell Int. 2019;19:72. [DOI] [PMC free article] [PubMed] [Google Scholar]
- 28. Wang Z, Li X, Xu Z, Liu H, Wang Y, Zheng F. First report of the complete mitochondrial genome and phylogenetic analysis of Aphrodita australis (Aphroditidae, Annelida). Mitochondrial DNA B Resour. 2019;4(2):4116‐4117. [DOI] [PMC free article] [PubMed] [Google Scholar]
- 29. Fan S, Zhao C, Wang P, Yan L, Qiu L. The complete mitochondrial genome and phylogenetic analysis of Cancer magister (Decapoda, Cancridae). Mitochondrial DNA B Resour. 2019;4(2):4107‐4108. [DOI] [PMC free article] [PubMed] [Google Scholar]
- 30. Fan S, Zhao C, Wang P, Yan L, Qiu L. The complete mitochondrial genome and phylogenetic analysis of Cancer pagurus (Decapoda, Cancridae). Mitochondrial DNA B Resour. 2019;4(2):4059‐4060. [DOI] [PMC free article] [PubMed] [Google Scholar]
- 31. Zhang Z, Ma P, Hu L, Liu Y, Wang H. The complete mitochondrial genome of a marine mussel, Modiolus comptus (Mollusca: Mytilidae), and its phylogenetic implication. Mitochondrial DNA B Resour. 2019;4(2):4057‐4058. [DOI] [PMC free article] [PubMed] [Google Scholar]
- 32. Liao Y, Xu M, Wang J. The complete mitochondria genome sequence of Heortia vitessoides Moore. Mitochondrial DNA B Resour. 2019;4(2):4014‐4015. [DOI] [PMC free article] [PubMed] [Google Scholar]
- 33. Wu Q, Lan Y, Xu H, Cao Y. Characterization of the complete mitochondrial genome and phylogenetic analysis of Prototheca stagnorum (chlorellales: Chlorellaceae). Mitochondrial DNA B Resour. 2019;4(2):4000‐4001. [DOI] [PMC free article] [PubMed] [Google Scholar]
- 34. Chen Z, Ren R, Wan D, et al. Hsa_circ_101555 functions as a competing endogenous RNA of miR‐597‐5p to promote colorectal cancer progression. Oncogene. 2019;38(32):6017‐6034. [DOI] [PubMed] [Google Scholar]
- 35. Xie H, Ren X, Xin S, et al. Emerging roles of circRNA_001569 targeting miR‐145 in the proliferation and invasion of colorectal cancer. Oncotarget. 2016;7(18):26680‐26691. [DOI] [PMC free article] [PubMed] [Google Scholar]
- 36. Yang B, Du K, Yang C, et al. CircPRMT5 circular RNA promotes proliferation of colorectal cancer through sponging miR‐377 to induce E2F3 expression. J Cell Mol Med. 2020;24(6):3431‐3437. [DOI] [PMC free article] [PubMed] [Google Scholar]
- 37. Issafras H, Fan S, Tseng CL, et al. Structural basis of HLX10 PD‐1 receptor recognition, a promising anti‐PD‐1 antibody clinical candidate for cancer immunotherapy. PLoS One. 2021;16(12):e0257972. [DOI] [PMC free article] [PubMed] [Google Scholar]
- 38. Ramírez‐Guerrero AA, González‐Villaseñor CO, Leal‐Ugarte E, et al. Association between genetic variant rs2267716 of CRHR2 gene with colorectal cancer. J Invest Med. 2021;70(4):947‐952. [DOI] [PubMed] [Google Scholar]
- 39. Abdulkadir S, Li C, Jiang W, et al. Modulating angiogenesis by proteomimetics of vascular endothelial growth factor. J Am Chem Soc. 2021;144(1):270‐281. [DOI] [PMC free article] [PubMed] [Google Scholar]
- 40. Qian X, Yu J, Yin Y, et al. MicroRNA‐143 inhibits tumor growth and angiogenesis and sensitizes chemosensitivity to oxaliplatin in colorectal cancers. Cell Cycle. 2013;12(9):1385‐1394. [DOI] [PMC free article] [PubMed] [Google Scholar]
- 41. Park MC, Kim H, Choi H, Chang MS, Lee SK. Epstein‐Barr virus miR‐BART1‐3p regulates the miR‐17‐92 cluster by targeting E2F3. Int J Mol Sci. 2021;22(20):10936. [DOI] [PMC free article] [PubMed] [Google Scholar]
- 42. Guo J, Zhang J, Yang T, Zhang W, Liu M. MiR‐22 suppresses the growth and metastasis of bladder cancer cells by targeting E2F3. Int J Clin Exp Pathol. 2020;13(3):587‐596. [PMC free article] [PubMed] [Google Scholar]
- 43. Liu G, Ouyang X, Gong L, et al. E2F3 promotes liver cancer progression under the regulation of circ‐PRKAR1B. Mol Ther Nucleic Acids. 2021;26:104‐113. [DOI] [PMC free article] [PubMed] [Google Scholar]
Associated Data
This section collects any data citations, data availability statements, or supplementary materials included in this article.
Supplementary Materials
Supplementary Figure S1
Data Availability Statement
The data that support the findings of this study are available on request from the corresponding author. The data are not publicly available due to privacy or ethical restrictions.