Abstract
Gasdermins, a family of five pore-forming proteins (GSDMA–GSDME) in humans expressed predominantly in the skin, mucosa and immune sentinel cells, are key executioners of inflammatory cell death (pyroptosis), which recruits immune cells to infection sites and promotes protective immunity1,2. Pore formation is triggered by gasdermin cleavage1,2. Although the proteases that activate GSDMB, C, D and E have been identified, how GSDMA—the dominant gasdermin in the skin—is activated, remains unknown. Streptococcus pyogenes, also known as group A Streptococcus (GAS), is a major skin pathogen that causes substantial morbidity and mortality worldwide3. Here we show that the GAS cysteine protease SpeB virulence factor triggers keratinocyte pyroptosis by cleaving GSDMA after Gln246, unleashing an active N-terminal fragment that triggers pyroptosis. Gsdma1 genetic deficiency blunts mouse immune responses to GAS, resulting in uncontrolled bacterial dissemination and death. GSDMA acts as both a sensor and substrate of GAS SpeB and as an effector to trigger pyroptosis, adding a simple one-molecule mechanism for host recognition and control of virulence of a dangerous microbial pathogen.
GAS causes a wide variety of acute infections ranging from local suppurative infections to severe, sometimes fatal, invasive diseases. Systemic dissemination is generally initiated by bacterial penetration of the epithelial barrier of the pharynx or damaged skin, leading to invasion in the bloodstream and soft tissues if not well controlled3. Superficial colonization and invasive infection by GAS are dependent on secreted GAS virulence factors, among which the cysteine protease streptococcal pyrogenic exotoxin B (SpeB) is key3. SpeB is synthesized as an inactive zymogen and is converted by proteolytic truncation into a mature, catalytically active enzyme4. SpeB contributes to GAS localization in the epidermis and systemic dissemination5–8, but the underlying mechanism is unknown.
Gasdermins are encoded by five paralogous genes in humans (GSDMA, GSDMB, GSDMC, GSDMD and GSDME) and are a family of pore-forming proteins that function as key executioners of pyroptosis1,2. Upon recognizing invasive bacteria or other danger signals, innate immune receptors assemble into large supramolecular complexes called inflammasomes that activate inflammatory caspases, which cleave GSDMD and liberate N-terminal (NT) fragments1,2 (GSDMD-NT). GSDMD-NT assemble in cell membranes, form pores and trigger pyroptosis9–12. Individual gasdermins are selectively expressed in specific mucosal sites, among which GSDMA is expressed mostly in the epithelial cells of the skin and upper gastrointestinal tract. How GSDMA is activated remains largely unknown, as are its physiological and pathological roles in host immunity.
SpeB induces skin epithelial lytic death
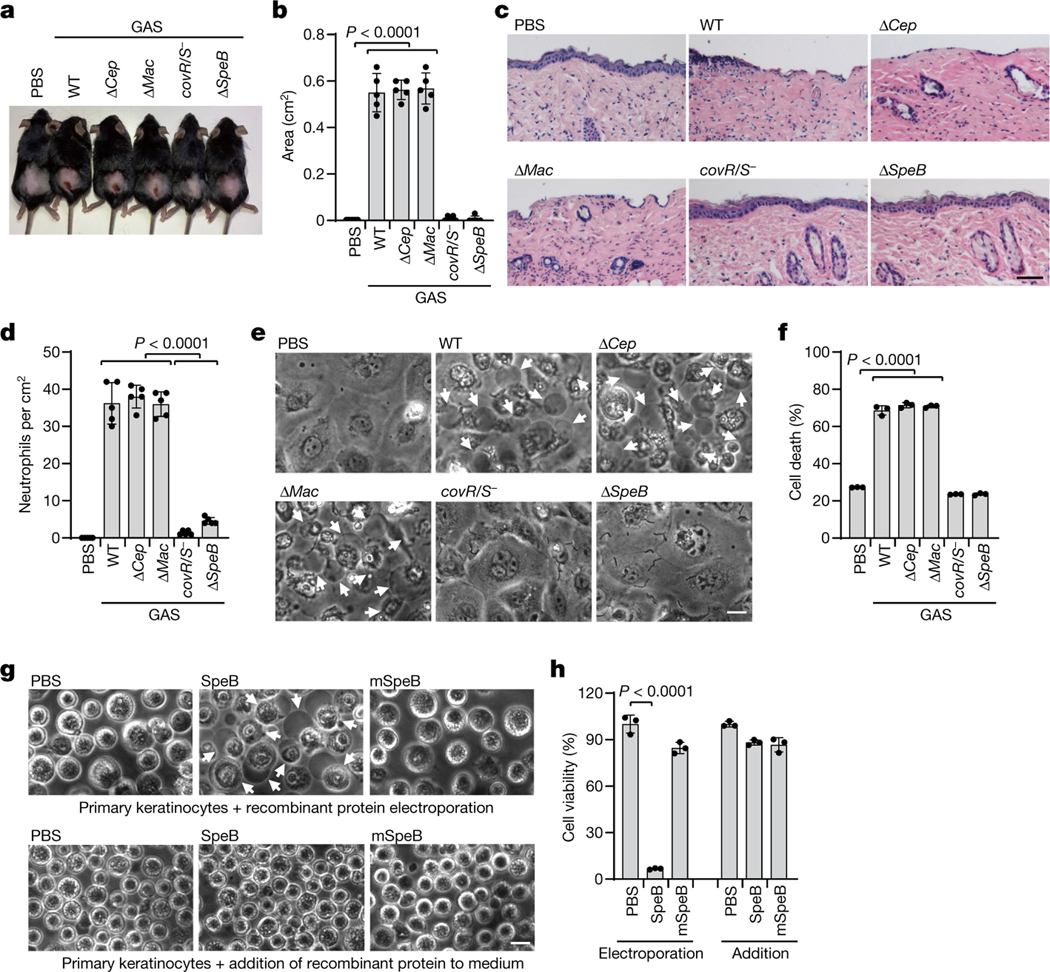
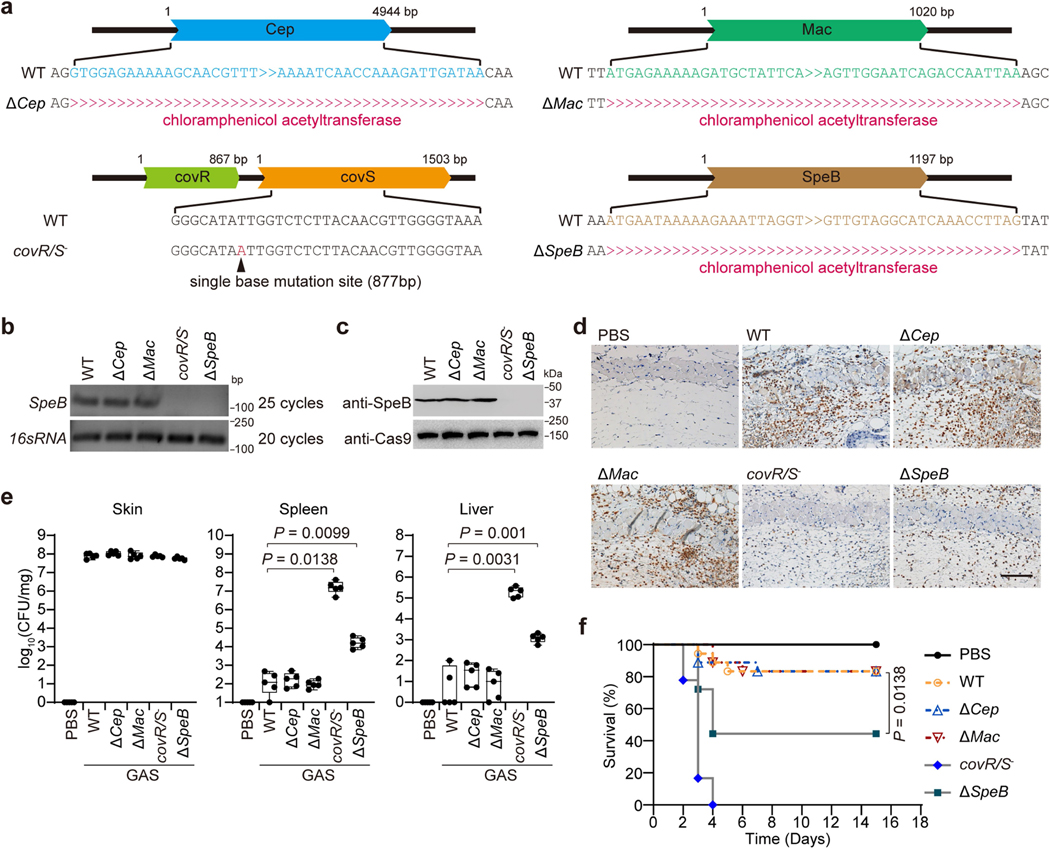
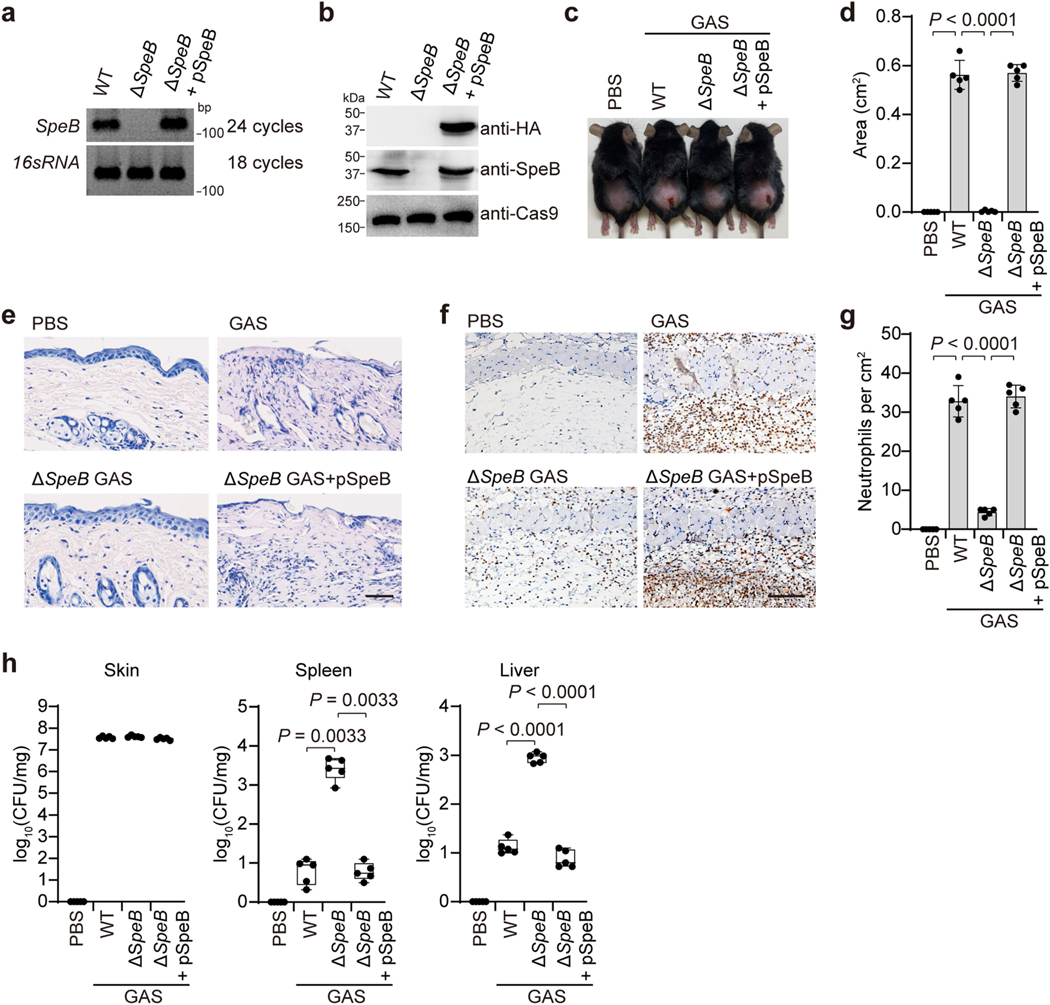
To study host cell responses to GAS infection, we infected mice with the wild-type (WT) GAS isolate M1T1 strain 5448 or its isogenic mutant strains (ΔcepA, Δmac or ΔspeB) and animal-passaged (AP) covR/S− strain, in which SpeB was silenced and inactivated owing to acquired mutations in covR/S during passaging (Extended Data Fig. 1a–c). SpeB-sufficient GAS WT, ΔcepA or Δmac variants caused severe pyogenic and necrotic lesions at the skin infection site, whereas the GAS SpeB-deficient covR/S− or ΔspeB strains did not (Fig. 1a, b). Epithelial integrity was disrupted and neutrophil infiltration increased at the infection site of mice challenged with GAS WT, ΔcepA or Δmac variants, but tissue damage and neutrophil infiltration were markedly reduced after infection with covR/S− or ΔspeB strains (Fig. 1c, d, Extended Data Fig. 1d), reproducing the in vivo phenotype of the GAS SpeB-deficient covR/S− or ΔspeB mutants reported previously13,14. However, despite reduced local tissue damage and no significant difference in skin bacterial burden (Extended Data Fig. 1e), mice infected with GAS covR/S− or ΔspeB developed more serious systemic infection, with significant increases in bacterial loads in spleen and liver, and these mice were more likely to die than mice infected with SpeB-sufficient strains (Extended Data Fig. 1e, f). Reintroduction of SpeB into the ΔspeB mutant isolate restored GAS-induced skin lesions with increased neutrophil infiltration and reduced systemic infection caused by GAS ΔspeB infection, confirming the role of SpeB in GAS M1T1 infection (Extended Data Fig. 2).
Fig. 1 |. The GAS virulence factor SpeB triggers lytic death of skin epithelial cells.
a–d, Mice were infected with GAS M1T1 strain 5448 (WT) or its isogenic mutant strains (ΔcepA, Δmac, covR/S− and ΔspeB). a, Representative image of skin lesions of mice challenged with indicated GAS variants. b, Quantification of skin lesion size. c, Histopathology of skin biopsies analysed by haematoxylin and eosin (H&E) staining. Scale bar, 100 μm. d, Quantification of neutrophil infiltration at skin lesion site. e, f, Primary mouse keratinocytes infected with indicated GAS strains for 2.5 h or not infected (PBS) were analysed by phase-contrast microscopy (e) and assayed for LDH release (f). g, h, Equal amounts of recombinant WT SpeB or the protease activity-deficient mutant mSpeB were electroporated into primary keratinocytes for 1 h, followed by observation of cell morphology by phase-contrast microscopy (g) and cell viability assessment by CellTiter-Glo luminescent assay (h). Keratinocytes displayed a rounded shape as they were resuspended before treatments. Arrows indicate pyroptotic cells. Scale bar, 10 μm. Data in b, d, are mean ± s.d. (n = 5 mice per group); data in f, h, are mean ± s.d. of triplicate wells. b, d, f, One-way analysis of variance (ANOVA). h, Two-tailed Student’s t-test. Data are representative of at least three independent experiments.
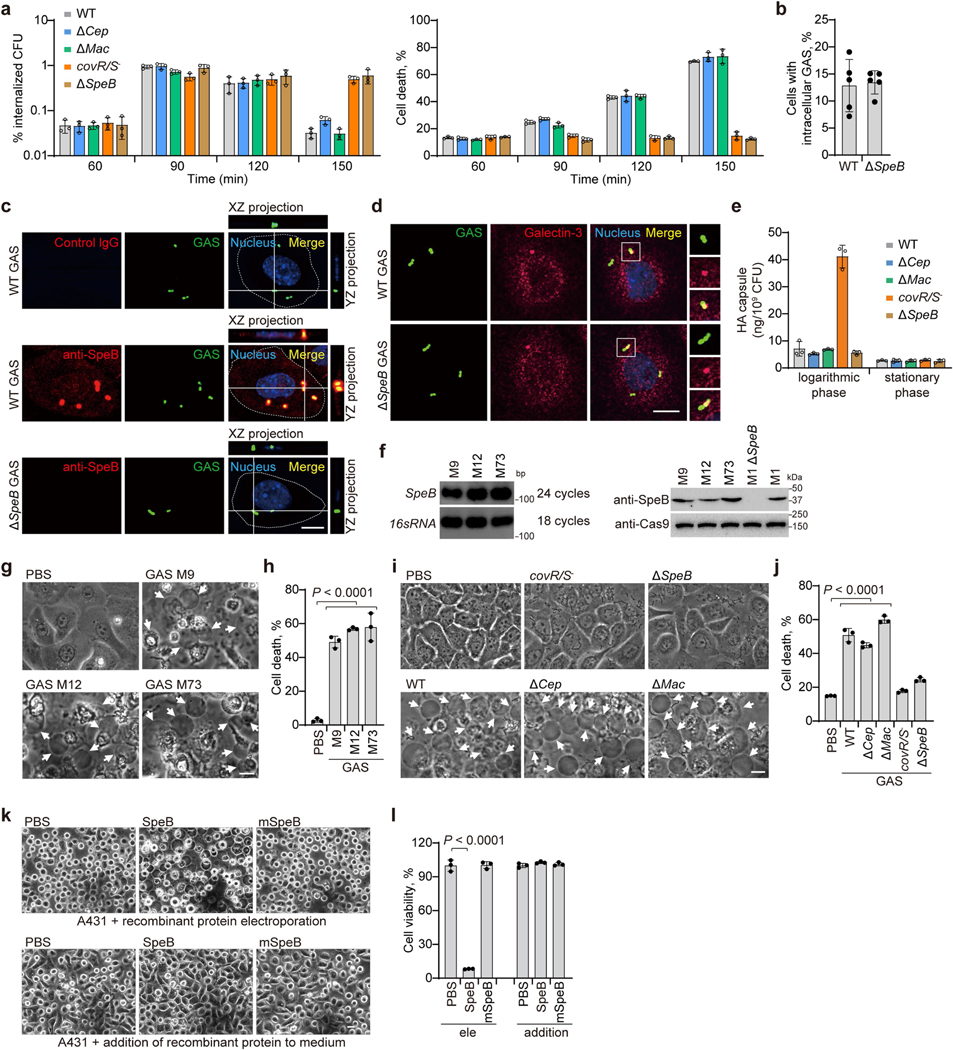
To dissect how SpeB exerts its function during GAS infection, we isolated primary mouse keratinocytes and infected them with the individual GAS strains. GAS WT, ΔcepA or Δmac variants caused massive keratinocyte cell death with typical pyroptotic ballooning morphology and release of lactate dehydrogenase (LDH), whereas GAS covR/S− or ΔspeB did not (Fig. 1e, f). Time-course experiments showed that GAS was internalized into keratinocytes within 1 h of infection (Extended Data Fig. 3a). Intracellular infection increased by 1.5 h to comprise about 1% of the initial inoculum and about 15% of keratinocytes were stained for intracellular GAS (Extended Data Fig. 3a, b). Keratinocytes infected with WT, Δcep or Δmac GAS began to die around 1.5 h after infection, whereas keratinocytes infected with SpeB-deficient covR/S− or ΔspeB GAS remained alive over the time course (Extended Data Fig. 3a). SpeB could be readily detected in the cytosol of cells infected with WT GAS, but not those infected with the ΔspeB mutant (Extended Data Fig. 3c). Co-staining of GAS with galectin-3, a marker for vacuole lysis by invasive pathogens15, showed that GAS could escape from the phagocytic vacuole to the keratinocyte cytosol (Extended Data Fig. 3d). GAS strains in stationary phase that have similarly low capsule contents were used in this study, ruling out differential capsule content as a factor in GAS-induced cell death (Extended Data Fig. 3e). Infection of keratinocytes with SpeB-sufficient M9, M12 or M73 GAS caused pyroptosis similar to GAS M1T1 5448 (Extended Data Fig. 3f–h). To assess the contribution of SpeB in cell death further, we introduce recombinant SpeB and its catalytically inactive mutant C192S (mSpeB)4 into mouse primary keratinocytes by electroporation. Electroporation of WT SpeB, but not mSpeB, potently caused cell death with the characteristics of pyroptosis–ballooning cell membranes and LDH release–but adding SpeB to the culture medium had no effect on morphology or viability of mouse primary keratinocytes (Fig. 1g, h). Similar results were obtained using the human epidermal cell line A431 (Extended Data Fig. 3i–l). Together, these data identify SpeB as a potential cytosolic trigger of lytic death of skin epithelial cells.
SpeB triggers GSDMA-dependent pyroptosis
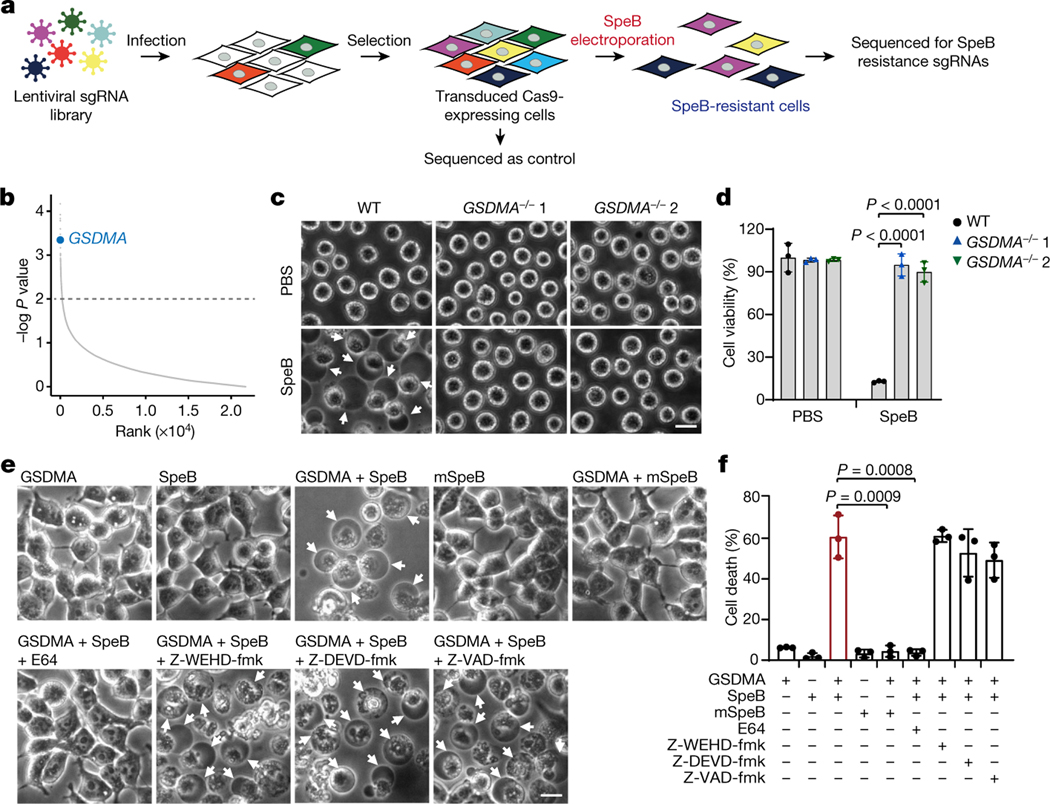
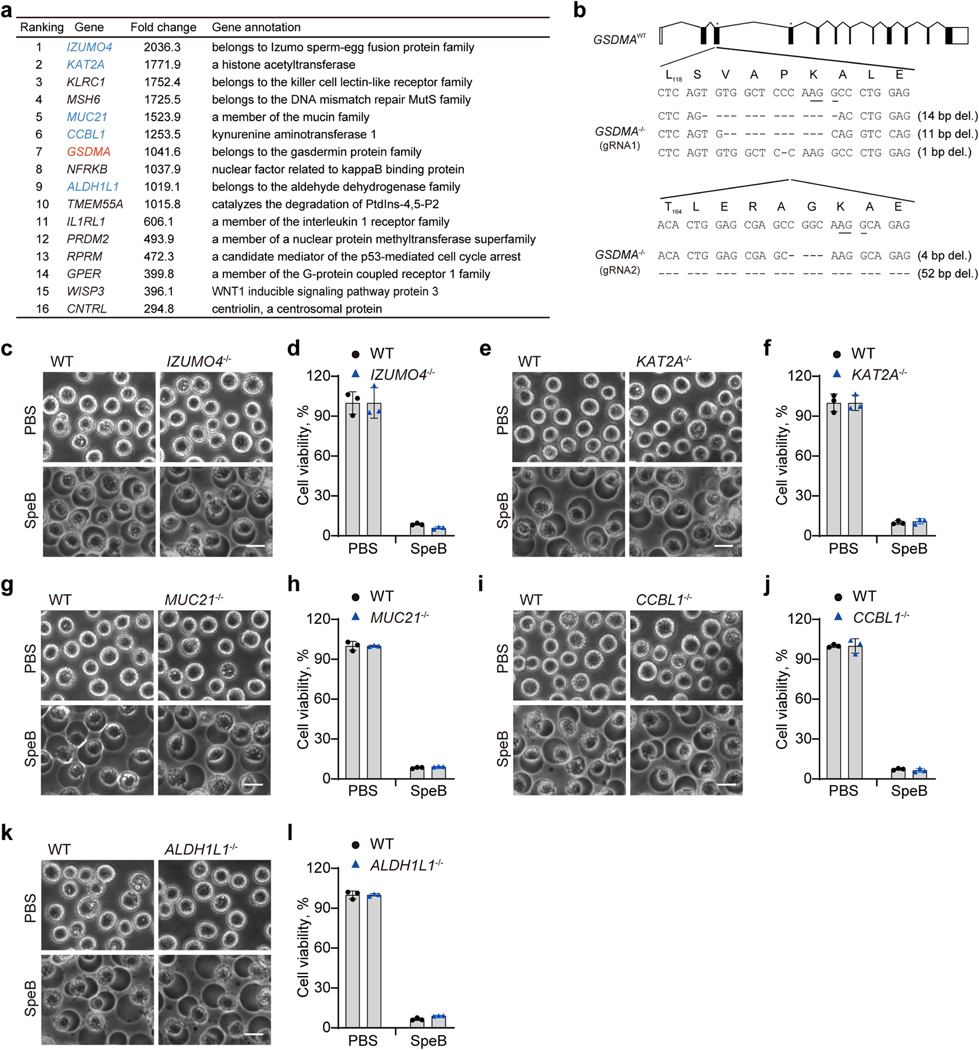
To identify in an unbiased manner host genes involved in cell death caused by SpeB, we performed a whole-genome CRISPR screen in Cas9-expressing A431 cells infected with a lentiviral genome-wide guide RNA library and electroporated with recombinant SpeB (Fig. 2a). Of note, single guide RNAs (sgRNAs) targeting GSDMA were highly enriched in SpeB-induced cell death-resistant cells (Fig. 2b, Extended Data Fig. 4a). To verify the role of GSDMA, we used CRISPR–Cas9-mediated gene editing to knock out GSDMA in A431 cells. In contrast to the massive cell death of WT cells induced by SpeB transfection, GSDMA-deficient cells were highly resistant to SpeB-triggered lytic cell death (Fig. 2c, d, Extended Data Fig. 4b). Consistently, neither GSDMA nor SpeB alone changed cell morphology or viability of 293T cells lacking endogenous GSDMA, whereas co-expression of GSDMA with SpeB caused extensive pyroptosis with ballooning morphology of dying cells and massive LDH release (Fig. 2e, f). Notably, co-transfection of mSpeB and GSDMA did not cause cell death (Fig. 2e, f). The cysteine protease inhibitor E64 also completely abrogated SpeB-triggered pyroptotic cell death, whereas the caspase inhibitors (Z-WEHD-fmk, Z-DEVD-fmk and Z-VAD-fmk) did not (Fig. 2e, f). In addition, ablation of several other genes identified from the screen did not affect the sensitivity of A431 cells to SpeB-induced pyroptosis (Extended Data Fig. 4c–l). Thus, catalytically active SpeB induces GSDMA-dependent, but caspase-independent, pyroptosis.
Fig. 2 |. SpeB triggers pyroptosis in a GSDMA-dependent manner.
a, Schematic workflow of the genome-wide CRISPR screening procedure. b, Genes were ranked according to their relative enrichment after treatment with SpeB electroporation relative to controls in positive selection, which was calculated using the MAGeCK RRA algorithm. The dotted line represents a P value of 0.01. c, d, WT and GSDMA-deficient A431 cells were transfected with recombinant SpeB by electroporation for 1 h, cell morphology was observed by phase-contrast microscopy (c) and cell viability was assessed by CellTiter-Glo luminescent assay (d). e, f, 293T cells transfected with the indicated plasmids were treated with E-64 (broad spectrum cysteine protease inhibitor, 50 μM), Z-WEHD-fmk (caspase-1/5 inhibitor, 10 μM), Z-DEVD-fmk (caspase-3/6/7/8/10 inhibitor, 10 μM) or Z-VAD-fmk (pan-caspase inhibitor, 10 μM) at 4 h after transfection. Cell morphology was observed by phase-contrast microscopy (e) and cell death was assessed by LDH release assay (f) 12 h later. Arrows indicate pyroptotic cells. Scale bar, 10 μm. Data in d, f are mean ± s.d. of triplicate wells. d, f, Two-tailed Student’s t-test. Data are representative of at least three independent experiments.
SpeB cleaves GSDMA after Gln246
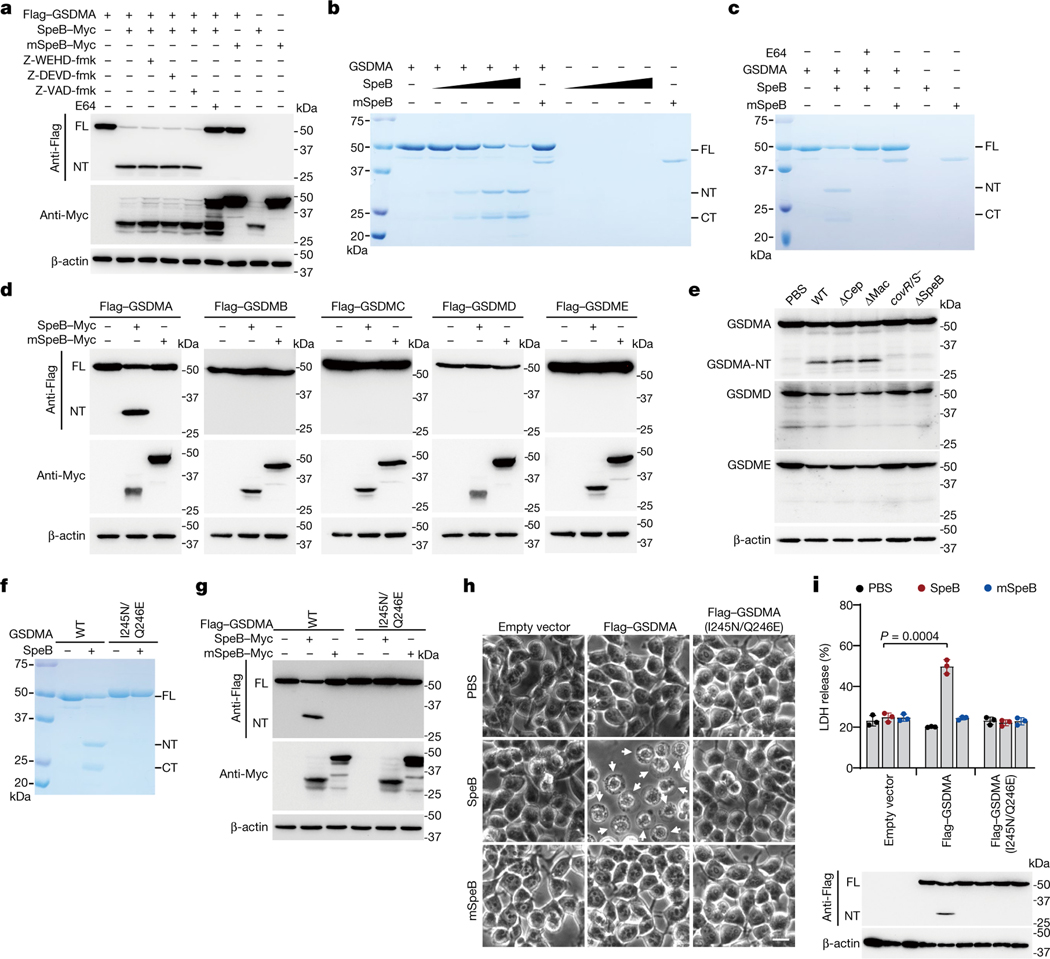
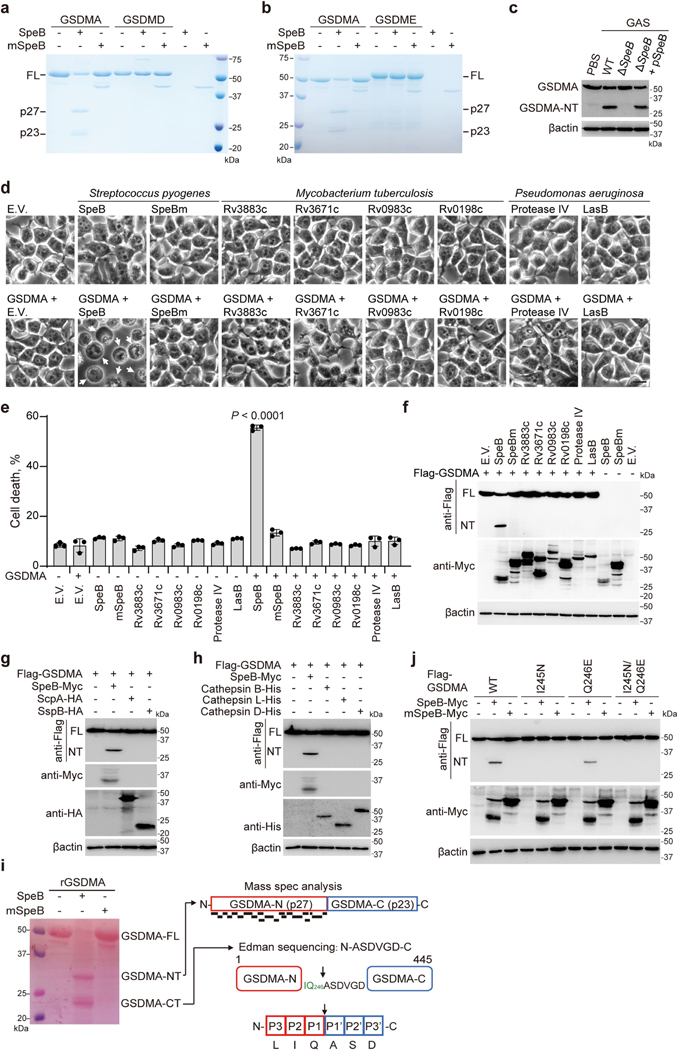
We hypothesized that the SpeB protease might trigger pyroptosis by cleaving and activating GSDMA directly. Co-expression of GSDMA with WT SpeB, but not with mSpeB, produced a cleaved N-terminal fragment (GSDMA-NT), which was not detected in the presence of E64 but was detected in the presence of caspase inhibitors (Fig. 3a). An in vitro cleavage assay showed that recombinant GSDMA was processed by WT SpeB, but not by mSpeB, in a dose-dependent manner, producing GSDMA N-terminal p27 and C-terminal p23 fragments (Fig. 3b). E64 abolished GSDMA cleavage by SpeB (Fig. 3c). SpeB did not cleave recombinant GSDMD or GSDME, even at the highest concentration tested (Extended Data Fig. 5a, b). Co-expression of SpeB and gasdermins in 293T cells indicated that SpeB specifically cuts GSDMA, since GSDMB, GSDMC, GSDMD and GSDME were not cleaved (Fig. 3d). Infection of A431 cells with WT, ΔcepA or Δmac GAS led to cleavage of GSDMA, but not GSDMD or GSDME, and no cleaved gasdermin was detected after infection with SpeB-deficient covR/S− or ΔspeB GAS (Fig. 3e). Reintroduction of SpeB into ΔspeB GAS restored GAS-induced GSDMA cleavage (Extended Data Fig. 5c), confirming that SpeB specifically cleaves GSDMA during infection. To examine whether other bacterial proteases can also activate GSDMA, we tested whether Mycobacterium tuberculosis, Pseudomonas aeruginosa and Staphylococcus aureus proteases cut GSDMA and cause pyroptosis. None of these proteases triggered GSDMA cleavage and pyroptosis (Extended Data Fig. 5d–g). GSDMA was also not a substrate of lysosomal cathepsins (Extended Data Fig. 5h). Together, these data show that GSDMA shows some specificity for sensing SpeB and is not indiscriminately cleaved by other proteases.
Fig. 3 |. SpeB directly cleaves GSDMA after Gln246.
a, 293T cells transfected with the indicated plasmids were treated with or without the indicated inhibitors, before the whole cell lysates were analysed by western blot. SpeB is autocatalysed and the molecular weights of SpeB and its active autocatalysed fragment are approximately 42 kDa and 28 kDa, respectively. b, c, Coomassie blue-stained SDS–PAGE showing in vitro cleavage of recombinant GSDMA (1 μM) incubated with increasing concentrations of recombinant SpeB (12.5, 25, 50 and 100 nM, wedges) or mSpeB (250 nM) in the absence (b) or presence (c) of E64 (2 μM). WT SpeB was not detected, partially owing to the autocatalytic cleavage and reduced stability of active SpeB. d, Whole-cell lysates of 293T cells transfected with Flag-tagged gasdermins together with WT SpeB or mSpeB were immunoblotted with the indicated antibodies. e, Whole-cell lysates of A431 cells infected with GAS M1T1 strain 5448 (WT) or its isogenic mutant strains were analysed by western blot. f, Coomassie blue-stained SDS–PAGE showing in vitro cleavage of recombinant WT GSDMA or mutant GSDMA(I245N/Q246E) (1 μM) incubated with or without recombinant SpeB (100 nM). g, Whole-cell lysates of 293T cells transfected with the indicated plasmids were analysed by western blot. h, i, 293T cells stably expressing WT GSDMA or GSDMA(I245N/Q246E) were transfected by electroporation with recombinant SpeB or mSpeB and analysed by phase-contrast microscopy (h), for LDH release (i, top) and by western blot of whole-cell lysates with indicated antibodies (i, bottom). Cells exhibiting ballooning morphology (indicated by white arrows) are undergoing pyroptosis. Scale bar, 10 μm. Data in i are mean ± s.d. of triplicate wells. i, Two-tailed Student’s t-test. Data are representative of at least three independent experiments. CT, C terminal; FL, full-length; NT, N terminal. For gel source data, see Supplementary Fig. 1.
Edman sequencing of the C-terminal GSDMA fragment identified the N-terminal sequence A247SDVGD252 (Extended Data Fig. 5i). Mass spectrometry of digested N-terminal GSDMA detected 21 distinct peptides, with residue 246 being the most C-terminal amino acid of peptide SGEEKVILIQ (Extended Data Fig. 5i). These data indicate that SpeB cleaves GSDMA after Q246 in the GSDMA linker region. This assignment of the cleavage site is consistent with previous reports which show that SpeB prefers a hydrophobic residue, especially isoleucine or valine, at the P2 position of the cleavage site, while the P1 residue is less important16–19. To confirm I245/Q246 as the cleavage site, we generated I245N, Q246E and I245N/Q246E GSDMA mutants and tested their sensitivity to SpeB (Fig. 3f, g, Extended Data Fig. 5j). Both I245N and I245N/Q246E mutant GSDMA were completely resistant to SpeB-mediated cleavage, whereas the Q246E mutant was still cleaved, although less efficiently than WT GSDMA. Thus, SpeB directly and selectively cleaves GSDMA in the linker region after Gln246.
SpeB-cleaved GSDMA-NT causes pyroptosis
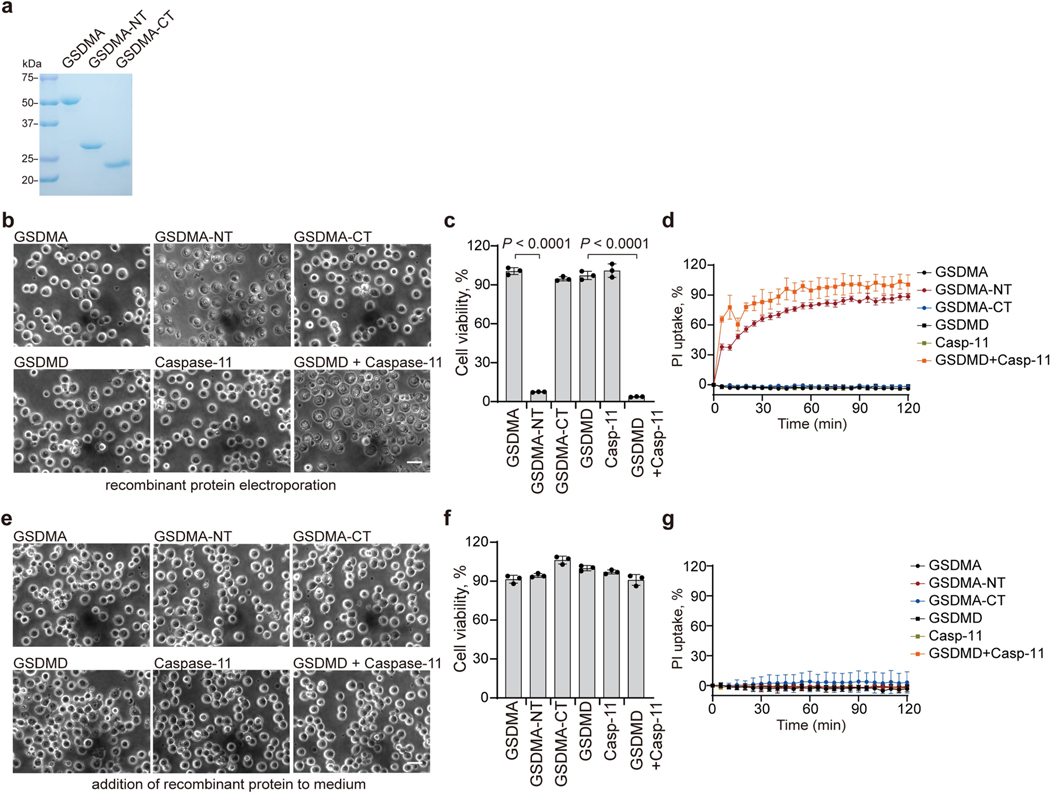
To further probe the role of GSDMA cleavage in SpeB-triggered pyroptosis, we introduced WT or catalytically dead SpeB into 293T cells expressing WT GSDMA or GSDMA(I245N/Q246E), which is not cleaved by SpeB, and assessed pyroptosis and GSDMA cleavage. Pyroptotic morphology, LDH release and GSDMA cleavage were induced only in cells transfected with WT SpeB and WT GSDMA (Fig. 3h, i), indicating that SpeB-mediated cleavage of GSDMA is necessary and sufficient for SpeB-induced pyroptosis. Overexpression of GSDMA residues 1–251 in 293T cells induces pyroptosis10. To determine the contribution of SpeB-cleaved products of GSDMA in SpeB-induced pyroptosis, we treated recombinant full-length GSDMA with SpeB and electroporated the purified GSDMA-NT and C-terminal (GSDMA-CT) reaction products into 293T cells (Extended Data Fig. 6a). Recombinant GSDMD and caspase-11, which cause pyroptosis when co-transfected9, were used as a positive control. Electroporation of purified GSDMA-NT or GSDMD and caspase-11 caused severe pyroptosis, as assessed by cell morphology, cell viability and membrane permeabilization (Extended Data Fig. 6b–d). By contrast, electroporation of full-length GSDMA or GSDMA-CT had no effect on cell viability (Extended Data Fig. 6b–d). None of the recombinant proteins were cytotoxic when added to the culture medium (Extended Data Fig. 6e–g). Thus, SpeB-cleaved GSDMA-NT induces pyroptosis only when it is intracellular.
GSDMA-NT disrupts acidic lipid membranes
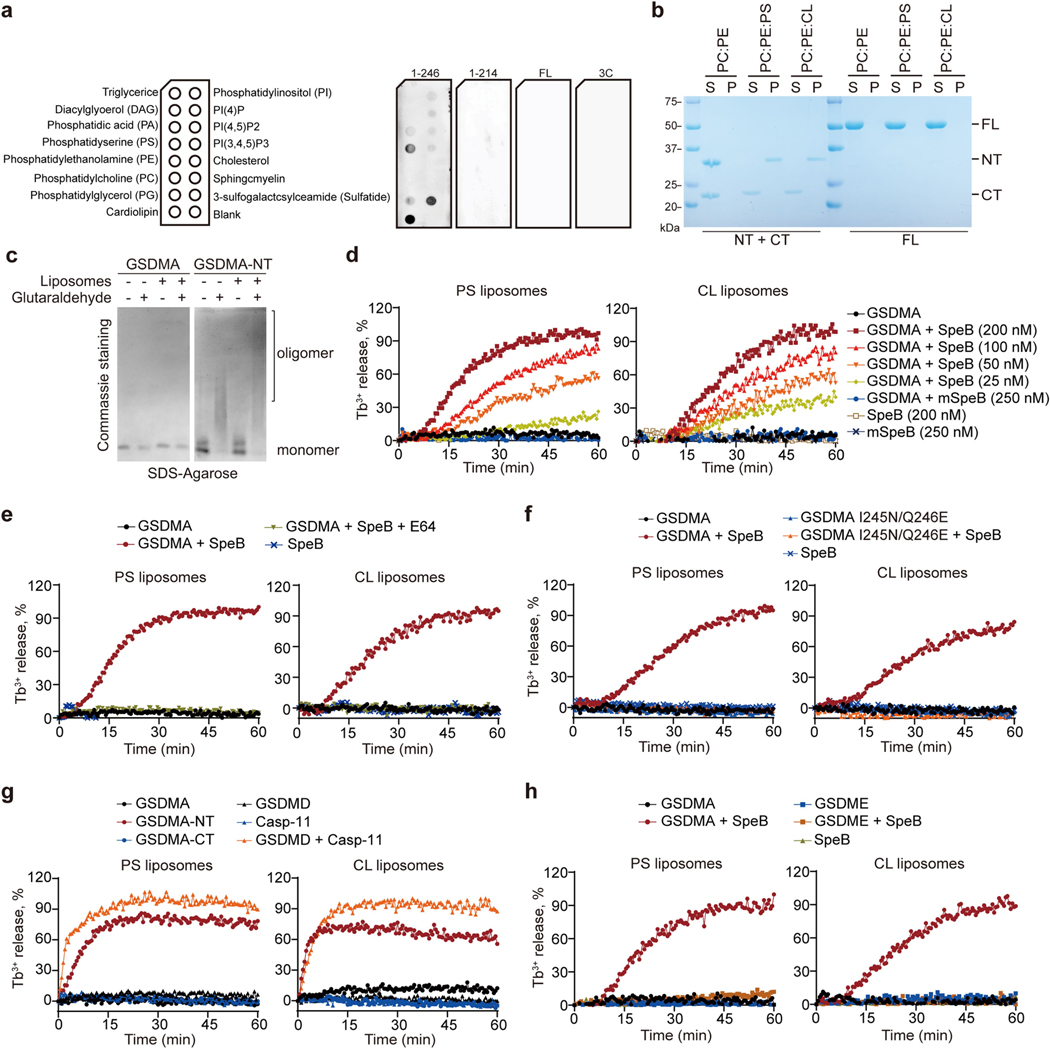
To understand better how GSDMA-NT causes pyroptosis, we generated GSDMA fragments comprising residues 1–214 (GSDMA1–214) or 1–246 (GSDMA1–246) with a Flag tag (Extended Data Fig. 7a). GSDMA1–214, which did not induce pyroptosis, was used as a negative control (Extended Data Fig. 7b–d). Protein–lipid overlay assay showed that GSDMA1–246 bound strongly to phosphatidylserine (PS), 3-O-sulfogalactosylceramide and cardiolipin (CL) (Extended Data Fig. 8a). By contrast, full-length GSDMA and GSDMA1–214 did not bind to any lipids on the strip (Extended Data Fig. 8a). GSDMA1–246 also bound to phosphatidylethanolamine (PE)–phosphatidylcholine (PC) liposomes containing PS or CL but not to liposomes containing PE and PC only (Extended Data Fig. 8b). When incubated with a crosslinking reagent or liposomes, full-length GSDMA existed as a monomer, whereas GSDMA1–246 formed oligomers (Extended Data Fig. 8c). GSDMA incubated with SpeB, but not with mSpeB, permeabilized both PS- and CL-containing liposomes in a SpeB-concentration-dependent manner (Extended Data Fig. 8d). E64 blocked liposome leakage (Extended Data Fig. 8e), and SpeB-treated GSDMA I245N/Q246E mutants did not lyse liposomes (Extended Data Fig. 8f). In addition, recombinant GSDMA1–246, but not full-length GSDMA or GSDMA-CT, caused liposome leakage (Extended Data Fig. 8g). By contrast, liposomes were not permeabilized by SpeB-treated GSDME (Extended Data Fig. 8h). Thus, GSDMA1–246 generated by SpeB cleavage binds to and disrupts certain acidic lipid-containing membranes.
Loss of Gsdma1 blunts anti-GAS immunity
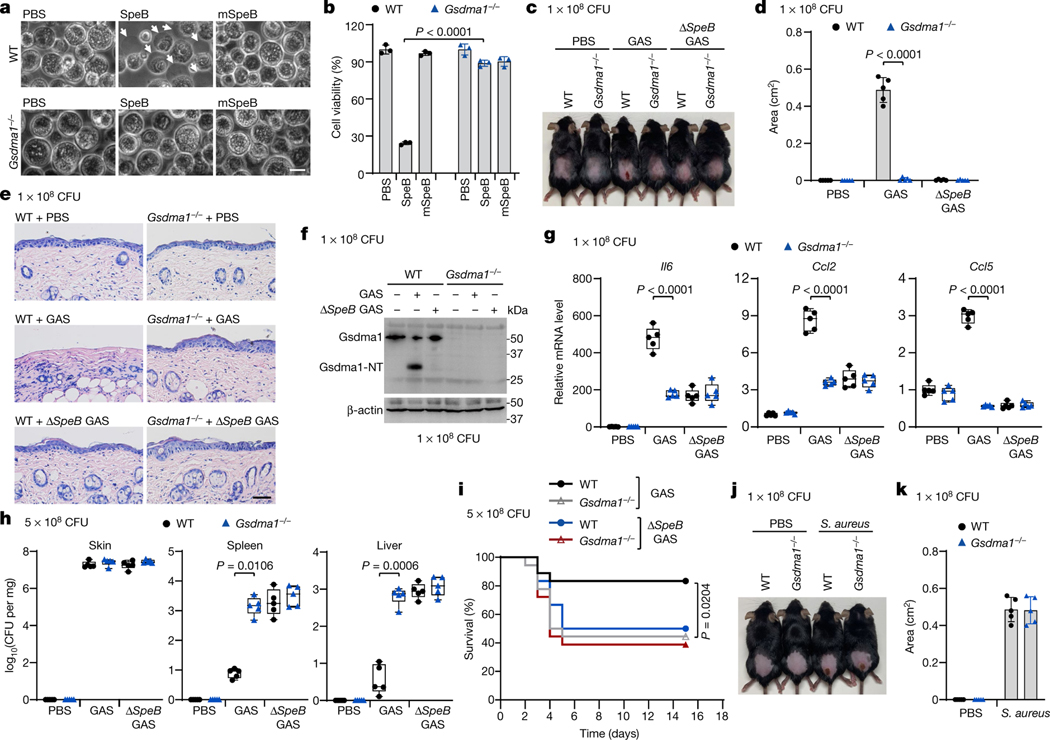
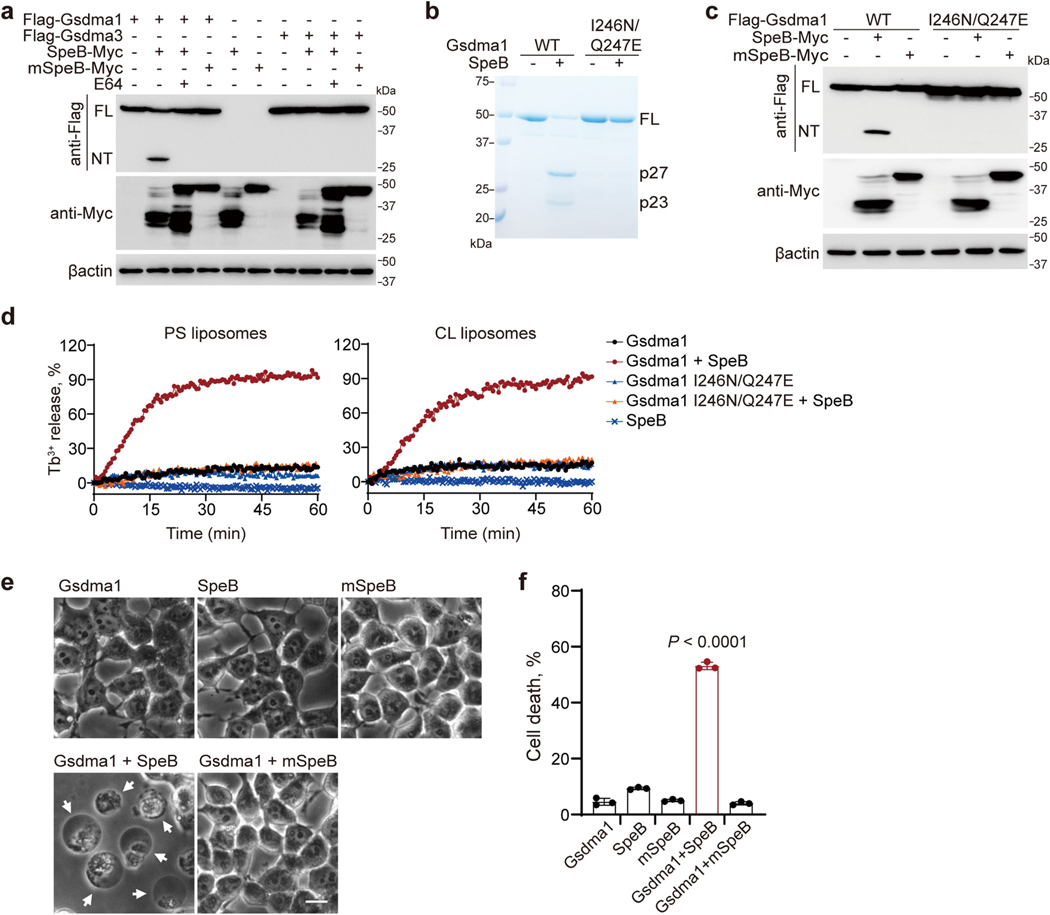
The mouse genome contains three GSDMA homologues, Gsdma1, Gsdma2 and Gsdma3; Gsdma1 and Gsdma3 are selectively expressed in skin2. The SpeB cleavage site of human GSDMA is conserved in mouse Gsdma1 but not in Gsdma3 (Extended Data Fig. 9). Co-expression of Gsdma1 with SpeB, but not with mSpeB, generated Gsdma1-NT, whereas SpeB did not cleave Gsdma3 (Extended Data Fig. 10a). I246N/Q247E mutations of Gsdma1 abrogated its SpeB-mediated cleavage (Extended Data Fig. 10b, c). In the presence of SpeB, WT Gsdma1–but not Gsdma1(I246N/Q247E)–triggered leakage of PS and CL liposomes (Extended Data Fig. 10d). Similar to human GSDMA, SpeB cleavage of Gsdma1 resulted in pyroptosis (Extended Data Fig. 10e, f). Electroporation of recombinant SpeB into keratinocytes from Gsdma1−/− mice did not trigger pyroptosis as it did in keratinocytes from WT mice (Fig. 4a, b), confirming that Gsdma1 is the SpeB substrate responsible for pyroptosis in mouse.
Fig. 4 |. Gsdma1 deficiency blunts host anti-GAS immunity.
a, b, Primary keratinocytes isolated from WT or Gsdma1−/− mice were electroporated with recombinant SpeB. Cell morphology was observed by phase-contrast microscopy (a) and cell viability was assessed by CellTiter-Glo luminescent assay (b). Arrows indicate pyroptotic cells. Scale bar, 10 μm. c–i, WT and Gsdma1−/− mice were infected with GAS M1T1 strain 5448, ΔspeB GAS or PBS control. c, Representative image of skin lesions of mice challenged for 1 day. d, Quantification of skin lesion size. e, Histopathology of skin biopsies analysed by H&E staining. Scale bar, 100 μm. f, Skin biopsies from WT or Gsdma1−/− mice infected with WT or ΔspeB mutant GAS were analysed by western blot. g, The induction of Il6, Ccl2 and Ccl5 expression in skin biopsy was examined. h, Bacteria load measured from skin lesions, spleens and livers of mice infected with GAS. i, Survival rate of mice challenged with the indicated GAS variants (n = 18 mice per group). j, k, WT and Gsdma1−/− mice were subcutaneously injected with S. aureus or PBS for 3 days. j, Representative image of skin lesions of mice. k, Quantification of skin lesion size. b, Data are mean ± s.d. of triplicate wells. d, k, Data are mean ± s.d. (n = 5 mice per group). g, h, Box plots show all data points, whiskers extend from minimum to maximum values (n = 5 mice per group), and the centre line, upper limit and lower limit of the box denote median, 25th and 75th percentiles, respectively. b, d, g, h, Two-tailed Student’s t-test. i, Mantel–Cox log-rank test. Data are representative of at least three independent experiments. CFU, colony-forming units. For gel source data, see Supplementary Fig. 1.
Next, we assessed the in vivo role of GSDMA in host defence against GAS infection. Unlike in WT mice, we did not observe severe dermonecrotic lesions, the epithelium was intact and there were few infiltrating neutrophils at the infection sites of Gsdma1−/− mice (Fig. 4c–e, Extended Data Fig. 11a, b). Gsdma1 cleavage was detected in skin lesions of WT mice infected with WT GAS, but not those of mice infected with ΔspeB GAS (Fig. 4f). We visualized GAS in keratinocytes in Gsdma1−/− mice (Extended Data Fig. 11c). Significantly lower mRNA levels of Il6, Ccl2 and Ccl5 (which encode cytokines that are secreted by keratinocytes to mediate immune cell recruitment20–22), were detected at the infection sites of Gsdma1−/− mice than those of WT mice (Fig. 4g). Notably, even though the skin lesions were much less severe in Gsdma1−/− mice, Gsdma1-deficient mice developed more severe systemic infection. Bacterial loads in spleen and liver were several logs higher (Fig. 4h). More than half of Gsdma1−/− mice died within 5 days, whereas most (15 out of 18) WT mice survived WT GAS challenge (Fig. 4i). Dermonecrotic lesions did not develop in Gsdma1−/− mice, even when higher numbers of GAS were used. No covR/S mutation or other regulatory gene (Rgg1-4 and RocA) mutations were detected in bacteria isolated from the spleens of WT and Gsdma1−/− mice, ruling out a role of these potential mutations in bacterial dissemination or systemic pathogenesis. Notably, WT and Gsdma1−/− mice were similarly susceptible to subcutaneous ΔspeB GAS infection (Fig. 4c–e, g–i, Extended Data Fig. 11a, b), subcutaneous S. aureus infection or intraperitoneal WT GAS infection (Fig. 4j, k, Extended Data Fig. 11d). Collectively, these data demonstrate an important role of SpeB-mediated GSDMA cleavage in host defence against GAS M1T1 infection.
Discussion
In this study, we identified epithelial GSDMA as a molecule that both senses cytosolic invasion of the GAS virulence factor SpeB and acts as an effector of epithelial pyroptosis (Extended Data Fig. 11e). Although known primarily as an extracellular protease, SpeB has been reported to enter the cytosol of infected cells to access its intracellular substrates to exert some of its functions. SpeB degrades cytosolic key factors involved in autophagy and facilitates the escape of GAS from host autophagy-mediated defence23. SpeB also colocalizes with interleukin-1β (IL-1β) and processes the IL-1β zymogen to its active form within macrophages24. Additional studies will be needed to understand how SpeB enters the host cell cytosol; SpeB may be carried into the cytosol during GAS invasion of infected cells23,25,26. Upon cleavage by SpeB, GSDMA forms pores on the cell membrane, which could act as a conduit for extracellular SpeB to diffuse into cells, resulting in a positive feedback loop. Alternatively, extracellular SpeB may be injected into the host cell cytoplasm by a GAS secretion system or with the assistance of other GAS effector proteins such as streptolysin O, which forms pores on the cell membrane and drives release of cytoplasmic IL-1β3,27–30.
The host pyroptotic response turns the SpeB virulence factor, which is known to promote bacterial invasion and adhesion31, into an agent that guards against the more dangerous consequences of systemic dissemination. This potentially provides a mechanism by which GAS carrying the covR/S mutation become more virulent by switching off SpeB. In addition, SpeB has been reported to be essential for GAS colonization and competition over other microorganisms for colonization32. Given the wide conservation of GSDMA in mammals2, GAS may provide selective pressure in mammals to maintain GSDMA to control systemic infection. Other examples of how pathogens shape host innate immunity have been reported in the host–pathogen arms race33,34. It will be interesting to investigate whether people who have genetic variations in GSDMA may be more vulnerable to GAS infection.
Our findings identify GSDMA as both a sensor and effector of pyroptosis, adding a new mechanism of host immune recognition and response to pathogenic microbial infection. Notably, IL-1β, a key proinflammatory cytokine in innate immunity, has been reported to sense infection by binding to GAS SpeB, serving as both a substrate and its own effector by engaging with IL-1R24,35. SpeB directly cleaves IL-1β, generating a mature, inflammatory cytokine that triggers a hyperinflammatory state to restrict GAS invasion24. SpeB cleaves IL-1β at a site different from the one cleaved by caspase-1 and induces extracellular release of cleaved IL-1β in a caspase-1-independent manner, suggesting a functionally non-redundant role of IL-1β and inflammasome signalling24. Identification of components in innate immune system as both a sensor of infection and an effector to induce inflammation illustrates the concept of a one-protein signalling pathway as the simplest innate immune signalling mechanism35. The pathway described here is also reminiscent of how another bacterial virulence factor and protease, anthrax lethal toxin, cleaves and activates NLRP1b to trigger inflammasome assembly upstream of GSDMD activation36. It will be worthwhile to continue to look for other ways that pathogen proteases trigger inflammatory cell death, since different mechanisms are likely to be found for other pathogens.
Online content
Any methods, additional references, Nature Research reporting summaries, source data, extended data, supplementary information, acknowledgements, peer review information; details of author contributions and competing interests; and statements of data and code availability are available at https://doi.org/10.1038/s41586-021-04384-4.
Methods
Bacterial strains and plasmids
The invasive S. pyogenes isolate M1T1 strain 5448 and its isogenic mutant strains (ΔspeB, covR/S−, ΔcepA and Δmac variants) were provided by V. Nizet. S. pyogenes M9, M12 and M73 strains were provided by Z. Zhang. These GAS strains were grown at 37 °C in Todd Hewitt broth supplemented with 1% yeast extract (THY broth). S. aureus USA300 and Escherichia coli strains (DH5α and Rosetta), described previously, were grown in trypticase soy broth (TSB) and Luria–Bertani (LB) broth, respectively.
cDNAs encoding human gasdermins (GSDMA, GSDMB, GSDMC, GSDMD and GSDME), mouse Gsdma1, Gsdma3 and caspase-11 were amplified by PCR from human or mouse cDNA libraries. Human codon-optimized cDNAs for SpeB and catalytically inactive mutant SpeB(C192S) were shared by V. Nizet. For complementation studies, speB DNA was cloned from GAS M1T1 strain 5448 and inserted into pDL278 vector (Addgene, #46882). Human codon-optimized cDNAs for S. aureus-encoded protease proScpA (residues 26–388) with autocatalytic activation and mature SspB (residues 220–393) were amplified from S. aureus USA300. For mammalian cells expression, the corresponding cDNAs were subcloned into pFlag-CMV4 with an N-terminal Flag tag, pcDNA3 with a C-terminal Myc tag or HA tag, or a modified Phage-Flag vector (a gift from C. Wang) harbouring the blasticidin-resistance gene fused with a C-terminal eGFP tag. For recombinant protein expression in E. coli, cDNAs were inserted into a pET28a or a modified pET vector with an N-terminal 6×His–SUMO tag (a gift from Y. Chen). Truncated mutants and point mutations were generated using the overlapping PCR method. All plasmids were verified by DNA sequencing.
Sequence analysis of GAS genome locus
Bacterial genomic DNA was extracted from individual GAS strain as previously described37. DNA fragments harbouring cepA, mac, covR/S, speB, emm, Rgg and RocA genes were amplified from genomic DNA template using Phusion high-fidelity Hot Start Flex 2X Master Mix (New England BioLabs, M0536), with primers listed in the Supplementary Table 1. The amplified products were then subjected to sequence alignment analysis.
Antibodies and reagents
Antibodies used in this study include mouse monoclonal anti-Flag M2 (Sigma-Aldrich, F1804), mouse monoclonal anti-β-actin (Sigma-Aldrich, A1978), mouse monoclonal anti-Myc (Cell Signaling Technology, 2276), rabbit polyclonal anti-GSDMA (Cell Signaling Technology, 49307), Rabbit polyclonal anti-HA (Cell Signaling Technology, 3724), Rabbit polyclonal anti-His (Cell Signaling Technology, 2365), mouse monoclonal anti-Cas9 (Santa Cruz Biotechnology, sc-517386), mouse monoclonal anti-GSDMD (Santa Cruz Biotechnology, sc-81868), rabbit lgG control antibody (Vector Laboratories, I-1000–5), rabbit monoclonal anti-GSDME (Abcam, ab215191), rabbit polyclonal anti-SpeB (Abcam, ab225941), rabbit polyclonal anti-myeloperoxidase (Abcam, ab139748), rabbit monoclonal anti-Galectin 3 (Abcam, ab76245), mouse monoclonal anti-cytokeratin 14 (Abcam, ab7800) and rabbit polyclonal anti-GSDMA (Invitrogen, PA5–24813). Lipids (1-palmitoyl-2-oleoyl-sn-glycero-3-phosphocholine (POPC), 1,2-dioleoyl-sn-glycero-3-phosphoethanolamine (DOPE), 1,2-dioleoyl-sn-glycero-3-phospho-l-serine (DOPS) and 1′,3′-bis(1,2-dioleoyl-sn-glycero-3-phospho)-sn-glycerol (CL)) used for liposome preparation were purchased from Avanti Polar Lipids. Cell culture reagents including Dulbecco’s Modified Eagle Medium (DMEM), penicillin-streptomycin solution, GlutaMAX, fetal bovine serum (FBS) were from Thermo Fisher Scientific. Dimethylsulfoxide (DMSO), β-mercaptoethanol (2-ME), dithiothreitol (DTT), terbium (III) chloride (TbCl3), dipicolinic acid (DPA), cysteine protease inhibitor E-64 and gentamicin sulfate were purchased from Sigma-Aldrich. The caspase-1/5 inhibitor Z-WEHD-fmk, caspase-3/6/7/8/10 inhibitor Z-DEVD-fmk, and pan-caspase inhibitor Z-VAD-fmk, and recombinant human cathepsin B (953-CY-010), cathepsin L (952-CY-010), cathepsin D (1014-AS-010) were from R&D Systems. Blasticidin (anti-bl) and puromycin (anti-pr) were purchased from Invivogen. The protease inhibitor cocktail tablets were from Roche.
Cell culture and transfection
HEK 293T and A431 cells were obtained from ATCC and cultured in DMEM supplemented with 10% FBS, 1×GlutaMAX, 100 U ml−1 penicillin G and 100 μg ml−1 streptomycin. Cells were kept at 37 °C in a humidified 5% CO2 atmosphere and verified to be free of mycoplasma contamination. For transient transfection of HEK 293T cells, the calcium phosphate method or Lipofectamine 3000 (Invitrogen) were used according to the manufacturer’s instructions. For stable expression, the lentiviral vectors (Phage-BSD containing the indicated gene, lentiCas9-Blast) were co-transfected with the packing plasmids pMD2.G and psPAX2 at a ratio of 5:2:3 into 293T cells to produce lentivirus particles for subsequent infection. Seventy-two hours after transfection, cell culture medium containing released infectious lentivirus was collected and filtered through a 0.45-μm membrane to remove cell debris, before added to A431 cells or 293T for 72 h. Afterwards, cells were kept in the medium supplemented with puromycin or blasticidin to obtain stably transfected cells expressing indicated genes. Cells deficient in specific genes were generated using the CRISPR–Cas9 method as previously described38. sgRNA sequences used for targeting the genes of interest were as follows: GSDMA (gRNA1: 5′-GACACTCAGTGTGGCTCCCA-3′, gRNA2: 5′-CACACTGGAGCGAGCCGGCA-3′), IZUMO4 (5′-GGTACACTGCTGTCGCCACT-3′), KAT2A (5′-TTTCCAGCCATTACACTTAC-3′), MUC21 (5′-GCAATAGTAGACCAAACATA-3′), CCBL1 (5′-AGTCGATCCCGTCTAGCCTT-3′), ALDH1L1 (5′-GGAGACGCTTTGCCCATCCC-3′). Bright-field cell images were captured using Olympus CKX41 with MShot Image analysis system.
Measurement of hyaluronic acid capsule production
To quantify hyaluronic acid capsules produced by GAS, bacteria were collected at logarithmic or stationary growth. Then GAS was washed twice and resuspended in ddH2O. Hyaluronic acid capsule was extracted by shaking GAS suspension mixed with chloroform. The amount of hyaluronic acid in aqueous phase was determined using a hyaluronic acid ELISA kit (LifeSpan BioSciences, LS-F24989) according to the manufacturer’s instructions.
Primary mouse keratinocytes isolation and culture
The whole skin was peeled off from post-natal C57BL6 mice, rinsed with sterile PBS, and digested in 2 ml dispase digestion buffer (2 mg ml−1 dispase (Sigma-Aldrich, D4693) and penicillin-streptomycin (Thermo Fisher scientific, 15140122) in keratinocyte basal medium (Invitrogen, MEPI500CA) with defined growth supplement (Invitrogen, S0125)) on a rotator at 4 °C overnight. Then the skin was washed with PBS and digested in trypsin digestion buffer (Invitrogen, 12604021) on a horizontal shaker at room temperature for 20 min. Dermis was disposed and single cells were released by rubbing the left epidermis in 2 ml supplemented keratinocyte basal medium. After passing a 40 μm cell strainer (Corning, 352340), keratinocytes were seeded in culture dishes pre-coated with gelatin-based coating material, and cultured in keratinocyte growth medium (keratinocyte basal medium with defined growth supplement and penicillin-streptomycin) in a 5% CO2 incubator at 37 °C.
PCR with reverse transcription
GAS strains were cultured in THY into stationary phase (OD600~1.5). The total RNA from the indicated strains was collected and extracted with TRIzol reagent (Thermo Fisher Scientific,15596018) according to the manufacturer’s instructions. cDNA was subsequently synthesized using the iScript cDNA Synthesis Kit (Biorad,170–8891). The semi-quantification of SpeB expression was performed by PCR and the level of 16sRNA serves as a loading control. The primers used as follows, 16s RNA-s: 5′-AGCGTTGTCCGGATTTATTG-3′, 16s RNA-as: 5′-CATTTCACCGCTACACATGG-3′; SpeB-s: 5′-ACTCTACCAGCGGATCATTTG-3′; SpeB-as: 5′-CAGCGGTACCAGCATAAGTAG-3′.
Genome-wide CRISPR–Cas9 screen
The human CRISPR knockout pooled two half-libraries (A and B, GeCKO v2) obtained from Addgene (#1000000049) contain 122,411 unique sgRNAs targeting 19,050 coding genes and 1,864 miRNAs. For lentivirus production, plasmids from libraries A and B were mixed equally and transfected into HEK 293T cells together with the packing plasmids psPAX2 and pMD2.G. 3 days later, lentivirus was collected and the viral titre was measured by using QuickTiter Lentivirus Titer kit (Cell Biolabs, VPK-107) according to the manufacturer’s instructions. For the subsequent genome-wide screen, Cas9 stably expressing A431 cells seeded in 10-cm dishes (2 × 10⁶ cells per dish and a total number of 7 × 10⁷ cells) were infected with the lentivirus containing sgRNA library at MOI of 0.3, and uninfected cells were removed via selection with puromycin treatment 2 days post lentiviral infection. 6 days later, the transduced cells (5 × 10⁸ cells) were transfected by electroporation with recombinant SpeB. Survival cells and untreated transduced cells (as the control sample) were collected for subsequent genomic DNA extraction and amplification of sgRNA sequences by two-step PCR as previously described38. The sgRNA amplicons were quantified and sequenced on a Hiseq2500 (Illumina) by the GENEWIZ company. Sequencing data were further processed and analysed using the MAGeCK algorithm39. MAGeCK built a linear model to estimate the variance of guide RNA read counts, evaluated the guide RNA abundance changes between control and treatment conditions, and assigned P value for positive and negative selection.
Recombinant protein purification
For expression and purification of recombinant full-length gasdermins (GSDMA, GSDMD, GSDME, Gsdma1), SpeB and its catalytic mutant SpeB(C192S) proteins, E. coli Rosetta cells harbouring pET28a-His6-SUMO-gasdermin plasmid or pET28a-SpeB-His6, were grown in LB media containing 50 μg ml−1 kanamycin. Protein expression was induced overnight at 16 °C with 0.2 mM isopropyl-β-D-thiogalactopyranoside (IPTG) after optical density at 600 nm reached 0.8. Cells were collected, resuspended in lysis buffer (50 mM Tris-HCl pH 8.0, 150 mM NaCl and 20 mM imidazole) and homogenized by ultrasonication. The cell lysates were clarified by centrifugation and the supernatants were incubated with Ni-NTA resin (Qiagen) at 4 °C before extensively washed with lysis buffer. The target protein was eluted with elution buffer (50 mM Tris-HCl pH 8.0, 150 mM NaCl and 500 mM imidazole) and further purified by HiTrap Q ion-exchange and Superdex 200 gel-filtration chromatography (GE Healthcare Life Sciences). The His6-SUMO tag was removed by overnight digestion with SUMO protease ULP1 (ubiquitin-like-specific protease 1) at 4 °C. The tag removed proteins were further purified by HiTrap Q ion-exchange and Superdex 200 gel-filtration chromatography. Engineered recombinant GSDMA proteins containing a human rhinovirus 3C protease recognition sequence (LEVLFQGP) immediately after residue G214 or Q246, with or without Flag-tag right before the 3C recognition sequence, were expressed and purified following the same procedure as described above. For purification of noncovalent complex of gasdermins (NT + CT), proteins engineered with 3C cleavage site were digested with 3C proteinase overnight at 4 °C and the cleaved proteins were further purified by Superdex 200 gel-filtration chromatography. To obtain the NT domain of gasdermins, the noncovalent complex was further applied to HiTrap Q ion-exchange. All purified recombinant proteins kept in the storage buffer (50 mM Tris pH 8.0, 150 mM NaCl and 5 mM DTT) were stored at −80 °C for long-term use.
Recombinant caspase-11 was expressed using the Bac-to-Bac baculovirus expression system (Thermo Fisher Scientific) according to the manufacturer’s instructions. In brief, Sf9 insect cells were transfected with the bacmid harbouring caspase-11 coding sequence using ExpiFectamine Sf Transfection Reagent (Thermo Fisher scientific, A38915) to obtain the P0 recombinant baculovirus. The P0 baculovirus were then applied to amplification procedure for high-titre baculovirus stock (P3) production. Subsequently, Hi5 cells were infected with the P3 baculovirus and cultured for 48 h before collection for caspase-11 purification by affinity chromatography and gel filtration as described above. Aggregated fractions, which were active caspase-11, were collected for use in the subsequent assay.
Lipid strip assay
Protein-lipid binding assay was performed using lipid strips (Echelon Biosciences Inc.) according to the manufacturer’s instructions with minor modifications. In brief, lipid strips were pre-incubated with binding buffer (PBS + 0.1% Tween20 (PBS-T) + 3% fatty acid-free BSA) for overnight at 4 °C to block non-specific binding. Then, lipid strips were incubated with noncovalent GSDMA (NT+CT) complex diluted in PBS-T + 3% BSA overnight at 4 °C with gentle agitation before extensively washed three times with PBS-T. Membrane-bounded proteins were probed with an anti-Flag antibody and visualized using enhanced chemiluminescence (ECL) kit (Thermo Fisher Scientific).
Liposome preparation
Liposomes of the indicated phospholipids composition were prepared for liposome binding, gasdermin pore reconstitution, and liposome leakage assay. Phospholipids dissolved in chloroform were mixed together in the indicated molar ratio and then the organic solvent was evaporated using N2 stream before hydration of dry lipid film with buffer B (20 mM HEPES pH 7.4, 150 mM NaCl). Lipid suspension was then extruded with 30 passes through a mini-extruder device (Avanti) with 100 nm Whatman Nuclepore Track-Etched Membrane to obtain unilamellar liposome vesicles. For Tb3+ entrapped liposome, dry lipid film was hydrated with buffer A (20 mM HEPES pH 7.4, 150 mM NaCl, 50 mM sodium citrate and 15 mM TbCl3) before extrusion. Liposome suspensions were subjected to Superose 6 size-exclusion chromatography (GE Healthcare Life Sciences) to remove unincorporated Tb3+. Void fractions were collected and pooled.
Liposome binding assay and leakage assay
For liposome binding assay, recombinant proteins were incubated with liposomes in buffer B at room temperature for 0.5 h. Liposome-free supernatants and liposome-containing pellets were separated by ultracentrifugation at 100,000g for 20 min at 4 °C and liposome-containing pellets were washed twice with buffer B before resuspended in an equal volume of buffer B as supernatants. Proteins in both liposome-free supernatant and liposome-containing pellet were analysed by SDS–PAGE.
Tb3+ entrapped liposome leakage was determined by an increase in fluorescence intensity when released Tb3+ was bound to DPA outside liposome. Liposomes encapsulated with Tb3+ were diluted into buffer C (20 mM HEPES pH 7.4, 150 mM NaCl and 50 μM DPA) (50 μM liposome lipids) and aliquoted into a 96-well plate (90 μl each well) before addition of 10 μl recombinant proteins of indicated concentration. Fluorescence (excitation: 270 nm, emission: 490 nm) was continuously recorded as Ft every 30 s using a BioTek Synergy H1 plate reader with Gene5 software. At the end of incubation, 10 μl of 1% Triton X-100 was added to each well to completely release the Tb3+ inside the liposome and the emission fluorescence was measured and the mean of the top three reads was regarded as Ft100. The percentage of liposome leakage at each time point is calculated as ((Ft – Ft0)/(Ft100 – Ft0)) × 100, where Ft0 is the initial fluorescence intensity of Tb3+ entrapped liposome in buffer C when recombinant proteins were added.
Cell viability and cytotoxicity assays
Cell viability was determined by measuring ATP levels using the CellTiter-Glo Luminescent Cell Viability Assay (Promega). Cell cytotoxicity of all the cells in a well was measured by the LDH release assay using CytoTox 96 Non-Radioactive Cytotoxicity Assay kit (Promega). Absorbance and luminescence were measured on a BioTek Synergy H1 plate reader with Gene5 software. To assess the loss of plasma membrane permeability–integrity via propidium iodide uptake, cells were cultured in buffer B (25 mM HEPES pH 7.4, 120 mM NaCl, 4 mM KCl, 1.5 mM CaCl2, 1 mM MgCl2, 5 mM glucose, 0.1% BSA) supplemented with 2 μg ml−1 propidium iodide (Invitrogen), and fluorescence (excitation: 535 nm, emission: 617 nm) was continuously recorded upon the relevant treatment for 2 h at 5 min intervals using a BioTek Synergy H1 plate reader with Gene5 software.
Protein electroporation
Recombinant full-length GSDMA, N-terminal GSDMA (1–246), or C-terminal GSDMA (247–445) were separately electroporated into 293T cells to test their pore-forming and pyroptosis-inducing activities. For assessing the catalytic effect of SpeB on GSDMA cleavage and subsequent activation, recombinant SpeB or its protease-inactive mutant was electroporated into 293T cells expressing human GSDMA (WT or I245N/Q246E mutant). Protein electroporation was performed using the Neon Transfection System (Life technologies). In brief, 2 × 10⁶ cells were suspended in 10 μl of PBS with the indicated concentrations of recombinant proteins, and electroporated using the following parameters (1120 V, 20 ms and 2 pulses). Cell viability was measured by CellTiter-Glo 1 h after electroporation.
In vitro biochemical assay
To examine direct cleavage of gasdermins by S. pyogenes SpeB, 1 μM of indicated recombinant substrates were incubated with recombinant SpeB or catalytic mutant SpeB(C192S) in 50 μl reaction buffer (50 mM Tris-HCl pH 8.0 and 150 mM NaCl) for 30 min at 37 °C. The samples were subjected to SDS–PAGE and Coomassie brilliant blue staining. The cleavage site of GSDMA by SpeB was determined by Edman sequencing of GSDMA C-terminal cleavage product and mass spectrometry analysis of GSDMA N-terminal cleavage product.
Liquid chromatography–tandem mass spectrometry analysis
SpeB-catalysed GSDMA cleavage products were separated by SDS–PAGE. N-terminal GSDMA (p27) spots were picked from the gel and digested with trypsin, chymotrypsin, pepsin, Glu-C and Asp-N (Promega). The peptides mixture was desalted and then completely dried using vacuum centrifugation (Concentrator Plus, Eppendorf) before reconstituted and separated by an Acclaim 300 C18 HPLC column with Ultimate 3000 system (Thermo Fisher Scientific). The eluted peptides were subjected MS analysis using Q Exactive Hybrid Quadrupole-Orbitrap Mass Spectrometer (Thermo Fisher Scientific). MS/MS data were analysed using the Byonic software for peptide identification.
GSDMA-NT oligomerization assay
To verify the oligomerization of GSDMA-NT, recombinant full-length GSDMA and GSDMA-NT were incubated or not with CL liposomes in buffer B (20 mM HEPES pH 7.4, 150 mM NaCl) at 37 °C for 30 min, then cross-linked with 5 mM glutaraldehyde at room temperature for 30 min. Samples were prepared by adding SDS loading buffer and resolved by SDS agarose gel electrophoresis as previously described40. The proteins were visualized by Coomassie brilliant blue staining.
Mice
Gsdma1-deficient mice were purchased from Cyagen Biosciences and maintained at the specific pathogen-free facility at Institut Pasteur of Shanghai (IPS) under standard conditions (12 h light :12 h dark cycle, ambient temperature of 20–26 °C, humidity of 30–70% and ad libitum access to food and water). Female littermates (C57BL/6 background) at the age of 7–8 weeks were used for all the experiments in this study. Mice were randomly allocated to each experimental group according to the genotype. No blinding was performed, because data were collected by objective and unbiased means. All mouse experiments were conducted in accordance with the national animal research guidelines, using protocols approved by the Institutional Animal Care and Use Committee of IPS.
Bacterial infection
Cells cultured in medium without antibiotics were used for bacterial infection. Overnight cultures of bacteria were inoculated into fresh media at the ratio of 1:50 and bacterial growth was monitored by measuring the absorbance at 600 nm (OD600). Early stationary-phase bacteria (OD600 = 1.5) were collected and washed with DPBS. Primary mouse keratinocytes or A431 were infected with GAS at a multiplicity of infection (MOI) of 10. The whole cell lysis was collected and subjected to immunoblot analysis for probing GSDMA cleavage. For intracellular bacterial enumeration, the infected cells were washed with PBS and incubated in medium containing gentamicin (200 μg ml−1) to kill the remaining extracellular bacteria. Then, intracellular bacteria were released by treating cells with 0.05% Triton X-100 before lysates were serially diluted in PBS and plated on BD Columbia agar with 5% sheep blood. To enumerate extracellular bacteria, a 100 μl aliquot of cell culture medium was collected for subsequent serial dilution and CFU assay.
For mouse skin infection model, 7- to 8-week-old female C57BL/6 mice were infected with early stationary-phase bacteria by subcutaneous injection into the shaved back skin of mice. Inoculum concentration of bacteria were verified by tenfold serial dilutions plating onto BD Columbia agar with 5% sheep blood after 24 h incubation at 37 °C. Mice were infected with 1 × 10⁸ CFU GAS for 1 day before skin lesions were processed and quantified. Skin biopsies were analysed for epithelial cell integrity and Gsdma1 processing by H&E staining and immunoblot, respectively. Neutrophil infiltration was quantified through immunohistochemistry and inflammatory cytokine induction was measured using quantitative PCR with reverse transcription (RT–PCR). The presence of GAS in the keratinocytes of mice was detected by fluorescent immunohistochemistry staining. For survival experiments, mice were administrated with GAS at a dose of 5 × 10⁸ CFU. The bacterial load was measured at 3 days post infection and mice survival rate was monitored for the following consecutive 15 days. In addition, 1 × 10⁸ CFU S. aureus were injected subcutaneously and mice skin lesions were processed and quantified at 3 days post infection.
For mouse intraperitoneal infection model, 7- to 8-week-old female C57BL/6 mice were intraperitoneally injected with early stationary-phase GAS (1 × 10⁸ CFU) and mice survival was monitored for 96 h.
Immunostaining and confocal microscopy
Cells infected with FITC (Sigma-Aldrich, F7250)-labelled GAS strains were washed with PBS, fixed for 15 min with 4% paraformaldehyde in PBS, permeabilized for 5 min in 0.2% Triton X-100 in PBS and blocked using 5% BSA for 1 h at room temperature. Then, cells were stained with indicated primary antibodies at 4 °C for overnight, followed by incubation with fluorescent-conjugated secondary antibodies (Jackson ImmunoResearch). Nuclei were counterstained with DAPI (4,6-diamidino-2-phenylindole) (Cell Signaling Technology, #4083). Slides were mounted using Aqua-Poly/Mount (Dako). Images were captured using a laser scanning confocal microscope (Olympus SpinSR10 Confocal System) with OLYMPUS cellSens Dimension. Z-stack images (optical slice 0.5 μm, 12 slices per 5.5-μm stack) were captured using a Zeiss 880 laser scanning confocal microscope (Zeiss LSM880) at 63× magnification and analyzed using Zeiss Zen software Blue edition.
Histological analysis
Tissues were fixed in 4% paraformaldehyde, embedded in paraffin, cut into sections, and placed on adhesion microscope slides. Sections were subjected to H&E and immunohistochemical staining according to standard procedures. Stained tissue sections were imaged by light microscopy (Olympus BX53) with CellSens software. Neutrophils infiltrated into the epidermis and dermis were enumerated in a blinded fashion according to neutrophils-specific anti-myeloperoxidase immunohistochistry staining (ten images per mouse, five mice per group) using Image J software. For fluorescence microscopy, skin tissues from Gsdma1−/− mice infected with FITC-labelled GAS were embedded with Tissue Tek OCT compound (Sakura Finetech) and snap-frozen in liquid nitrogen. Tissue sections were then stained with the indicated primary antibodies and DAPI using standard methods. Images were captured using a laser scanning confocal microscope (Olympus SpinSR10 Confocal System) with OLYMPUS cellSens Dimension.
Statistics
No statistical methods were used to predetermine sample sizes. Comparisons for two groups were calculated using Student’s t-test (two tailed). One-way ANOVA was used for comparison for more than two groups relative to a single factor. Mouse survival curves and statistics were analysed using the Mantel-Cox log-rank test. P values below 0.05 were considered significant.
Reporting summary
Further information on research design is available in the Nature Research Reporting Summary linked to this paper.
Extended Data
Extended Data Fig. 1 |. SpeB-deficient GAS triggers systemic infection.
a, DNA sequence comparison of GAS isolate M1T1 strain 5448 and its isogenic mutant strains (ΔcepA, Δmac, covR/S− and ΔspeB variants). b, c, RT-PCR (b) and immunoblot analysis (c) of the expression of SpeB in the indicated GAS strains. d–f, mice were infected or not with the indicated GAS strains. d, IHC analysis of neutrophil infiltration at infection site on day 1. Scale bar: 100 μm. e, Bacteria load measured from skin lesions, spleens and livers of mice infected or not with GAS. f, Survival rate of mice challenged or not with the indicated GAS (n = 18 mice per group). e, box plots show all points, min to max (n = 5 mice per group). The center line, upper limit and lower limit of the box denote median, 25th and 75th percentiles and the whiskers denote the minimum and maximum values of data. e, Two-tailed Student’s t-test; f, Mantel-Cox log-rank test. Data are representative of at least three independent experiments. For gel source data, see Supplementary Fig. 1.
Extended Data Fig. 2 |. SpeB contributes to local tissue destruction.
a, b, The re-expression of SpeB in ΔspeB GAS was confirmed by both RT-PCR (a) and immunoblot analysis (b). c–h, mice were infected or not with the indicated GAS strains. c, Representative image of skin lesions of mice challenged with GAS or not for 1 day. d, Quantification of skin lesion size. e, Histopathology of skin biopsies analysed by H&E staining. f, g, IHC analysis and quantification of neutrophil infiltration at infection site. h, Bacteria load measured from skin lesions, spleens and livers of mice infected or not with GAS. Scale bar: 100 μm. d, g, show mean ± s.d. (n = 5 mice per group); h, box plots show all points, min to max (n = 5 mice per group). The center line, upper limit and lower limit of the box denote median, 25th and 75th percentiles and the whiskers denote the minimum and maximum values of data. d, g, h, Two-tailed Student’s t-test. Data are representative of at least three independent experiments. For gel source data, see Supplementary Fig. 1.
Extended Data Fig. 3 |. SpeB triggers lytic death of primary mouse keratinocytes and A431 cells.
a, Primary mouse keratinocytes were infected with GAS isolate M1T1 strain 5448 or its isogenic mutant strains for the indicated times. Percentage of internalized GAS was shown by counting intracellular CFUs relative to the inoculum (left panel). Cell cytotoxicity of all the cells in a well was measured by LDH release assay (right panel). b–d, Primary keratinocytes infected with FITC-labeled GAS strains were washed with PBS before cells were stained and analyzed by confocal fluorescence imaging. Cell borders are outlined with dashed lines. Cells with intracellular GAS were quantified from 700 cells (n = 5, mean ± s.d.) (b). e, Levels of hyaluronic acid capsule at logarithmic and stationary growth phases. f, RT-PCR (left panel) and immunoblot analysis (right panel) of the expression of SpeB in the indicated GAS strains. g, h Primary keratinocytes infected or not with the indicated GAS strains for 2.5 h were analysed by phase-contrast microscopy (g), LDH release (h). i, j, A431 cells infected or not with GAS isolate M1T1 strain 5448 or its isogenic mutant strains for 2.5 h were analysed by phase-contrast microscopy (i) and LDH release (j). k, l, Equal amounts of recombinant of WT SpeB or protease activity-deficient mutant mSpeB were respectively electroporated into A431 cells for 1 h or directly added into cell culture medium for 2.5 h, followed by cell morphology observation by phase-contrast microscopy (k), cell viability assessment by CellTiter-Glo luminescent assay (l). g, i, Arrowheads indicate pyroptotic cells. c, d, g, i, k, scale bar: 10 μm. Graphs show mean ± s.d. of triplicate wells. h, j, One-way ANOVA; l, Two-tailed Student’s t-test. Data are representative of at least three independent experiments. For gel source data, see Supplementary Fig. 1.
Extended Data Fig. 4 |. Validation of additional hits identified from CRISPR screen of SpeB-triggered lytic cell death.
a, List of top hits from CRISPR screen of SpeB-triggered lytic cell death. b, GSDMA-knockout cells used in this study. Gene coding sequences were present as black boxes. Top sequence track is the gene wild-type allele. Location of gRNAs is indicated with blue bars and PAM sequences were underscored. c–l, WT and the indicated gene knockout A431 cells were transfected or not with recombinant SpeB by electroporation, followed by cell morphology observation by phase-contrast microscopy (c, e, g, i, k), cell viability assessment by CellTiter-Glo luminescent assay (d, f, h, j, l). Scale bar: 10 μm. Graphs show mean ± s.d. of triplicate wells. Data are representative of at least three independent experiments.
Extended Data Fig. 5 |. SpeB specifically targets and cleaves GSDMA.
a, b, In vitro cleavage assay of recombinant GSDMA, GSDMD (a) or GSDME (b) by incubation with recombinant WT SpeB (100 nM) or mSpeB (250 nM) for 0.5 h. c, Whole cell lysates of A431 cells infected or not with the indicated GAS strains were subjected to immunoblot analysis for the indicated proteins. d–f, 293T cells were transfected with the indicated plasmids (Flag-tagged GSDMA, Myc-tagged bacterial proteases) before analysed by phase-contrast microscopy (d), LDH release (e) and immunoblot of whole cell lysates with the indicated antibodies (f). g, h, Flag-tagged GSDMA was treated or not with SpeB, staphopains (ScpA, SspB), or cathepsins (Cathepsin B, L, D) before subjected to immunoblot analysis with the indicated antibodies. i, GSDMA N-terminal and C-terminal cleavage products (p27 and p23) were analysed by mass spectrometry (MS) and Edman sequencing, respectively. Individual peptides identified by MS and shown in black bars were mapped against N-terminal GSDMA (upper right panel). Middle right panel shows the N-terminal sequence of p23 determined by Edman sequencing, the diagram of GSDMA two-domain architecture, and SpeB cleavage site Gln246 highlighted in green. Bottom panel shows the positions (P) on the substrate of SpeB (GSDMA) which are counted and numbered (P3-P2-P1-P1’-P2’-P3’) from the point of cleavage. j, Whole cell lysates of 293T cells transfected with the indicated plasmids were collected and subjected to immunoblot analysis. Scale bar: 10 μm. Data are representative of at least three independent experiments. Graphs show mean ± s.d. of triplicate wells. e, One-way ANOVA. Data are representative of at least three independent experiments. For gel source data, see Supplementary Fig. 1.
Extended Data Fig. 6 |. GSDMA-NT produced by SpeB cleavage is sufficient to initiate pyroptosis, but does not injure bystander cells.
a, Coomassie Blue-stained SDS-PAGE gel showing purified recombinant GSDMA, GSDMA-NT and GSDMA-CT. b–d, Equal amounts of recombinant full-length GSDMA, GSDMA-NT (1–246aa), GSDMA-CT, full-length GSDMD, Caspase-11 or full-length GSDMD plus Caspase-11 were electroporated into 293T cells respectively, followed by cell morphology observation by phase-contrast microscopy (b), cell viability analysis by CellTiter-Glo luminescent assay (c), and cell death assessment by PI uptake (d). e–g, Equal amounts of recombinant of full-length GSDMA, GSDMA-NT (1–246aa), GSDMA-CT, full-length GSDMD, Caspase-11 or full-length GSDMD plus Caspase-11 were respectively added directly into cell culture medium, followed by cell morphology observation by phase-contrast microscopy (e), cell viability analysis by CellTiter-Glo luminescent assay (f), and cell death assessment by PI uptake (g). Pyroptotic cells form large ballooning bubbles; Scale bar: 20 μm. Graphs show mean ± s.d. of triplicate wells (c, f) or mean ± s.e.m. of quadruplicate wells (d, g). c, Two-tailed Student’s t-test. Data are representative of at least three independent experiments. For gel source data, see Supplementary Fig. 1.
Extended Data Fig. 7 |. GSDMA 1–246aa, but not 1–214aa possesses pyroptosis-inducing activity.
a, Coomassie Blue-stained SDS-PAGE gel showing recombinant engineered GSDMA with Flag tag-3C protease cleavage sequence inserted immediately after residue G214, Q246, treated with 3C protease. b–d, 293T cells were transfected with the indicated plasmids (Empty vector or Flag-tagged Gasdermin) before cell death was observed by phase-contrast microscopy (b) and determined by LDH release assay (c), whole cell lysates were collected for immunoblot analysis (d). Arrowheads indicate pyroptotic cells; Scale bar: 10 μm. Graphs show mean ± s.d. of triplicate wells. c, Two-tailed Student’s t-test. Data are representative of at least three independent experiments. For gel source data, see Supplementary Fig. 1.
Extended Data Fig. 8 |. Phospholipid binding property and liposome-disrupting activity of GSDMA-NT.
a, Lipid strips dotted with indicated phospholipids (left panel) were incubated with noncovalent complex of cleaved GSDMA with a Flag-tag inserted right before the cleavage site, unprocessed full-length GSDMA, or 3C protease, followed by immunoblot analysis with an anti-Flag antibody (right panel). b, Indicated liposomes incubated with noncovalent complex of cleaved GSDMA (NT + CT) and full-length GSDMA (FL) were subjected to sedimentation by ultracentrifugation. Proteins in both liposome-free supernatant (S) and liposome-containing pellet (P) were analysed by SDS-PAGE. c, Indicated recombinant proteins incubated or not with CL liposomes and glutaraldehyde were analyzed by SDS-agarose gel electrophoresis and subsequent Coomassie Blue staining. d–h, Leakage of PC-PE liposomes containing additional PS or CL was monitored in real-time by terbium (Tb3+) fluorescence after incubation with recombinant gasdermins proteins in the presence or absence of recombinant SpeB or enzymatically inactive SpeB C192S (mSpeB) as indicated, or cysteine protease inhibitor E64 if necessary. Data are representative of at least three independent experiments. For gel source data, see Supplementary Fig. 1.
Extended Data Fig. 9 |. GSDMA proteins in different species.
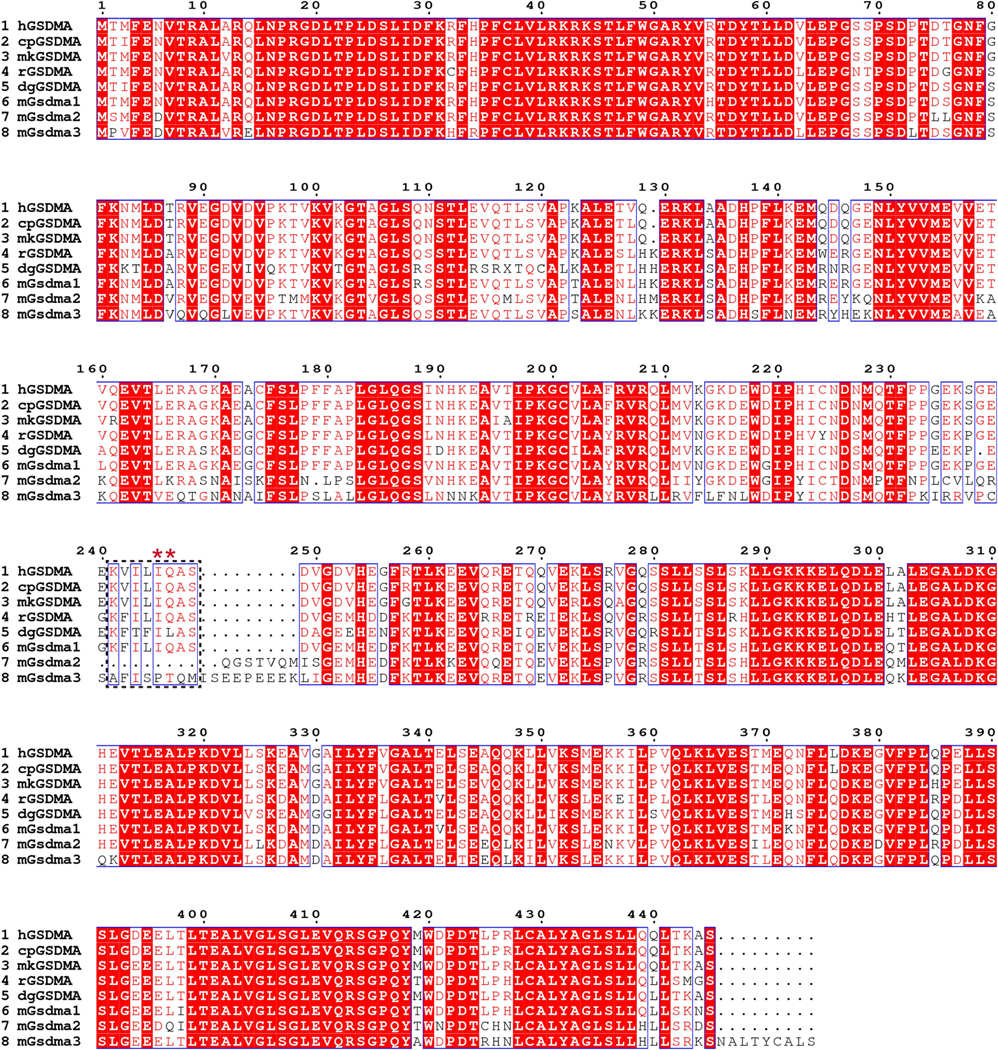
Multiple sequences alignment of human (h), chimpanzee (cp), monkey (mk), rat (r), dog (dg) GSDMA and mouse Gsdma1, Gsdma2 and Gsdma3 was performed using the ClustalW2 algorithm and plotted by ESPript program. Identical residues are highlighted by red background, and similar residues are indicated in red. Ile 245 and Gln246 (*) in human GSDMA are highly conserved in chimpanzee, monkey, rat, dog GSDMA as well as mouse Gsdma1.
Extended Data Fig. 10 |. SpeB cleaves mouse Gsdma1 and releases its N-terminal pyroptosis-inducing activity.
a, Whole cell lysates of 293T cells transfected with the indicated plasmids were collected and subjected to immunoblot analysis with the indicated antibodies. b, Coomassie Blue-stained SDS-PAGE gel showing in vitro cleavage of recombinant WT Gsdma1 or mutant Gsdma1 I246N/Q247E (1 μM) incubated with or without recombinant WT SpeB (100 nM) for 0.5 h. c, Whole cell lysates of 293T cells transfected with the indicated plasmids were collected and subjected to immunoblot analysis. d, Leakage of PC-PE liposomes containing additional PS or CL was monitored in real-time by terbium (Tb3+) fluorescence after incubation with recombinant gasdermins proteins in the presence or absence of recombinant SpeB as indicated. e, f, 293T cells transfected with the indicated plasmids were analysed by phase-contrast microscopy (e), LDH release (f). Arrowheads indicate pyroptotic cells; Scale bar: 10 μm. Graphs show mean ± s.d. of triplicate wells. f, One-way ANOVA. Data are representative of at least three independent experiments. For gel source data, see Supplementary Fig. 1.
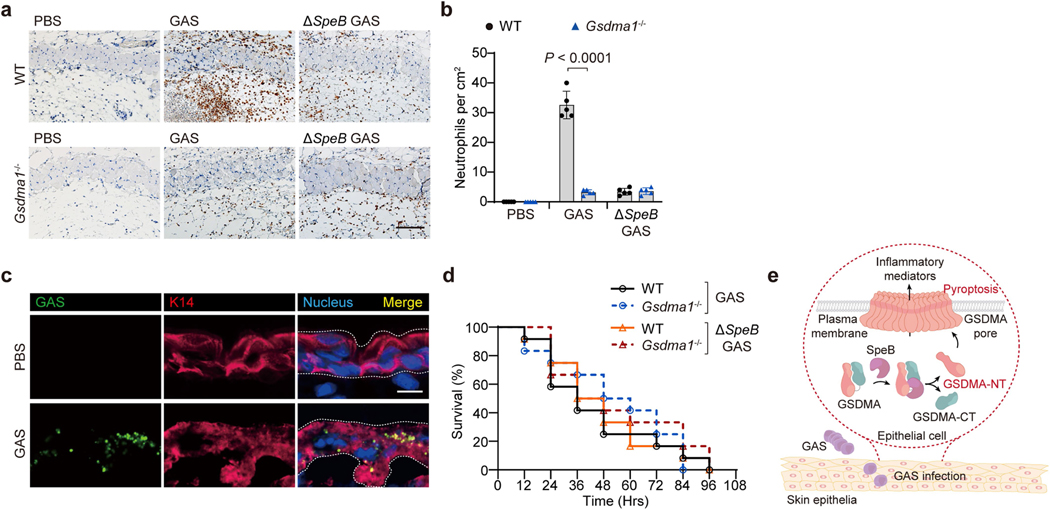
Extended Data Fig. 11 |. Gsdma1 deficiency affects host immune responses against subcutaneous but not intraperitoneal infection of GAS WT.
a, WT and Gsdma1−/− mice were subcutaneously infected or not with GAS isolate M1T1 strain 5448 or its isogenic mutant strain (ΔspeB variant). IHC analysis of neutrophil infiltration at infection site on day 1. Scale bar: 100 μm. b, Quantification of neutrophil infiltration at infection site. c, Cutaneous sections from Gsdma1−/− mice infected or not for 18 h with FITC-labelled GAS WT were subjected to immunofluorescence staining with anti-keratin 14. Nucleus was stained with DAPI. Dashed lines delineate the boundaries of epidermis. Scale bar: 10 μm. d, Survival rate of mice intraperitoneally administrated with the indicated GAS (n = 12 mice per group). e, Model of SpeB-triggered GSDMA activation and subsequent pyroptosis of skin epithelial cells during GAS infection. b, show mean ± s.d. (n = 5 mice per group); Two-tailed Student’s t-test. Data are representative of at least three independent experiments.
Supplementary Material
Acknowledgements
We thank V. Nizet for sharing S. pyogenes isolate M1T1 strain 5448 and its isogenic mutant strains (ΔspeB, covR/S−, ΔcepA and Δmac variants) as well as SpeB constructs, Z. Zhang for providing S. pyogenes M9, M12 amd M73 strains, C. Wang for providing Phage-Flag vector, and Y. Chen for providing a modified pET vector with an N-terminal 6×His-SUMO tag. This work was supported by National Key R&D Program of China (2020YFA0509600), National Natural Science Foundation of China (32122034, 31972897), Key Research Program of the Chinese Academy of Sciences (ZDBS-LY-SM008), Shanghai Pilot Program for Basic Research-Chinese Academy of Sciences, Shanghai Branch (JCYJ-SHFY-2021-009), Strategic Priority Research Program of Chinese Academy of Sciences (XDB29030300), Shanghai Municipal Science and Technology Major Project (2019SHZDZX02) (X.L.), NIH R01CA240955 and R01AI39914 (J.L.), NIH R01AI127654 (T.S.K.) and China Postdoctoral Science Foundation (2019M650193), Guangzhou Science and Technology Project (202102020093) (W.D.).
Footnotes
Supplementary information The online version contains supplementary material available at https://doi.org/10.1038/s41586-021-04384-4.
Peer review information Nature thanks Dario Zamboni and the other, anonymous, reviewer(s) for their contribution to the peer review of this work.
Competing interests The authors declare no competing interests.
Data availability
All data supporting the findings of this study are included in this manuscript and its supplementary information. Source data are provided with this paper.
References
- 1.Broz P, Pelegrin P. & Shao F. The gasdermins, a protein family executing cell death and inflammation. Nat. Rev. Immunol 20, 143–157 (2020). [DOI] [PubMed] [Google Scholar]
- 2.Liu X, Xia S, Zhang Z, Wu H. & Lieberman J. Channelling inflammation: gasdermins in physiology and disease. Nat. Rev. Drug Discov 20, 384–405 (2021). [DOI] [PMC free article] [PubMed] [Google Scholar]
- 3.Cole JN, Barnett TC, Nizet V. & Walker MJ Molecular insight into invasive group A streptococcal disease. Nat. Rev. Microbiol 9, 724–736 (2011). [DOI] [PubMed] [Google Scholar]
- 4.Musser JM, Stockbauer K, Kapur V. & Rudgers GW Substitution of cysteine 192 in a highly conserved Streptococcus pyogenes extracellular cysteine protease (interleukin 1beta convertase) alters proteolytic activity and ablates zymogen processing. Infect. Immun 64, 1913–1917 (1996). [DOI] [PMC free article] [PubMed] [Google Scholar]
- 5.Svensson MD et al. Role for a secreted cysteine proteinase in the establishment of host tissue tropism by group A streptococci. Mol. Microbiol 38, 242–253 (2000). [DOI] [PubMed] [Google Scholar]
- 6.Cole JN et al. Trigger for group A streptococcal M1T1 invasive disease. FASEB J. 20, 1745–1747 (2006). [DOI] [PubMed] [Google Scholar]
- 7.Shelburne SA 3rd et al. Growth characteristics of and virulence factor production by group A Streptococcus during cultivation in human saliva. Infect. Immun 73, 4723–4731 (2005). [DOI] [PMC free article] [PubMed] [Google Scholar]
- 8.Aziz RK et al. Invasive M1T1 group A Streptococcus undergoes a phase-shift in vivo to prevent proteolytic degradation of multiple virulence factors by SpeB. Mol. Microbiol 51, 123–134 (2004). [DOI] [PubMed] [Google Scholar]
- 9.Liu X. et al. Inflammasome-activated gasdermin D causes pyroptosis by forming membrane pores. Nature 535, 153–158 (2016). [DOI] [PMC free article] [PubMed] [Google Scholar]
- 10.Ding J. et al. Pore-forming activity and structural autoinhibition of the gasdermin family. Nature 535, 111–116 (2016). [DOI] [PubMed] [Google Scholar]
- 11.Aglietti RA et al. GsdmD p30 elicited by caspase-11 during pyroptosis forms pores in membranes. Proc. Natl Acad. Sci. USA 113, 7858–7863 (2016). [DOI] [PMC free article] [PubMed] [Google Scholar]
- 12.Sborgi L. et al. GSDMD membrane pore formation constitutes the mechanism of pyroptotic cell death. EMBO J. 35, 1766–1778 (2016). [DOI] [PMC free article] [PubMed] [Google Scholar]
- 13.Sumitomo T. et al. Streptococcal cysteine protease-mediated cleavage of desmogleins is involved in the pathogenesis of cutaneous infection. Front. Cell Infect. Microbiol 8, 10 (2018). [DOI] [PMC free article] [PubMed] [Google Scholar]
- 14.Saouda M, Wu W, Conran P. & Boyle MD Streptococcal pyrogenic exotoxin B enhances tissue damage initiated by other Streptococcus pyogenes products. J. Infect. Dis 184, 723–731 (2001). [DOI] [PubMed] [Google Scholar]
- 15.Paz I. et al. Galectin-3, a marker for vacuole lysis by invasive pathogens. Cell Microbiol. 12, 530–544 (2010). [DOI] [PubMed] [Google Scholar]
- 16.Doran JD et al. Autocatalytic processing of the streptococcal cysteine protease zymogen: processing mechanism and characterization of the autoproteolytic cleavage sites. Eur. J. Biochem 263, 145–151 (1999). [DOI] [PubMed] [Google Scholar]
- 17.Gerwin BI, Stein WH & Moore S. On the specificity of streptococcal proteinase. J. Biol. Chem 241, 3331–3339 (1966). [PubMed] [Google Scholar]
- 18.Nomizu M. et al. Substrate specificity of the streptococcal cysteine protease. J. Biol. Chem 276, 44551–44556 (2001). [DOI] [PubMed] [Google Scholar]
- 19.Carroll RK & Musser JM From transcription to activation: how group A Streptococcus, the flesh-eating pathogen, regulates SpeB cysteine protease production. Mol. Microbiol 81, 588–601 (2011). [DOI] [PubMed] [Google Scholar]
- 20.Lichtenberger BM et al. Epidermal EGFR controls cutaneous host defense and prevents inflammation. Sci. Transl. Med 5, 199ra111 (2013). [DOI] [PubMed] [Google Scholar]
- 21.Sawada Y. et al. Cutaneous innate immune tolerance is mediated by epigenetic control of MAP2K3 by HDAC8/9. Sci. Immunol 6, eabe1935 (2021). [DOI] [PMC free article] [PubMed] [Google Scholar]
- 22.Kolaczkowska E. & Kubes P. Neutrophil recruitment and function in health and inflammation. Nat. Rev. Immunol 13, 159–175 (2013). [DOI] [PubMed] [Google Scholar]
- 23.Barnett TC et al. The globally disseminated M1T1 clone of group A Streptococcus evades autophagy for intracellular replication. Cell Host Microbe 14, 675–682 (2013). [DOI] [PMC free article] [PubMed] [Google Scholar]
- 24.LaRock CN et al. IL-1β is an innate immune sensor of microbial proteolysis. Sci. Immunol 1, eaah3539 (2016). [DOI] [PMC free article] [PubMed] [Google Scholar]
- 25.Nitsche-Schmitz DP, Rohde M. & Chhatwal GS Invasion mechanisms of Gram-positive pathogenic cocci. Thromb. Haemost 98, 488–496 (2007). [PubMed] [Google Scholar]
- 26.Rohde M. & Chhatwal GS Adherence and invasion of streptococci to eukaryotic cells and their role in disease pathogenesis. Curr. Top. Microbiol. Immunol 368, 83–110 (2013). [DOI] [PubMed] [Google Scholar]
- 27.Hynes W. & Sloan M. in Streptococcus pyogenes: Basic Biology to Clinical Manifestations (eds Ferretti JJ et al.) (2016). [PubMed] [Google Scholar]
- 28.Zhang W, Rong C, Chen C. & Gao GF Type-IVC secretion system: a novel subclass of type IV secretion system (T4SS) common existing in gram-positive genus Streptococcus. PLoS ONE 7, e46390 (2012). [DOI] [PMC free article] [PubMed] [Google Scholar]
- 29.Richter J. et al. Streptolysins are the primary inflammasome activators in macrophages during Streptococcus pyogenes infection. Immunol. Cell Biol 99, 1040–1052(2021). [DOI] [PubMed] [Google Scholar]
- 30.Richter J., Brouwer S., Schroder K. & Walker MJ. Inflammasome activation and IL-1β signalling in group A Streptococcus disease. Cell Microbiol. 23, e13373 (2021). [DOI] [PubMed] [Google Scholar]
- 31.Brouwer S, Barnett TC, Rivera-Hernandez T, Rohde M. & Walker MJ Streptococcus pyogenes adhesion and colonization. FEBS Lett. 590, 3739–3757 (2016). [DOI] [PubMed] [Google Scholar]
- 32.Carothers KE et al. The streptococcal protease SpeB antagonizes the biofilms of the human pathogen Staphylococcus aureus USA300 through cleavage of the staphylococcal SdrC protein. J. Bacteriol 202, e00008-e00020 (2020). [DOI] [PMC free article] [PubMed] [Google Scholar]
- 33.Zhou W. et al. Structure of the human cGAS–DNA complex reveals enhanced control of immune surveillance. Cell 174, 300–311.e311, (2018). [DOI] [PMC free article] [PubMed] [Google Scholar]
- 34.Kranzusch PJ et al. Ancient origin of cGAS–STING reveals mechanism of universal 2′,3′ cGAMP signaling. Mol. Cell 59, 891–903 (2015). [DOI] [PMC free article] [PubMed] [Google Scholar]
- 35.Orzalli MH & Kagan JC A one-protein signaling pathway in the innate immune system. Sci. Immunol 1, eaah6184 (2016). [DOI] [PMC free article] [PubMed] [Google Scholar]
- 36.Mitchell PS, Sandstrom A. & Vance RE The NLRP1 inflammasome: new mechanistic insights and unresolved mysteries. Curr. Opin. Immunol 60, 37–45 (2019). [DOI] [PMC free article] [PubMed] [Google Scholar]
- 37.Whatmore AM & Kehoe MA Horizontal gene transfer in the evolution of group A streptococcal emm-like genes: gene mosaics and variation in Vir regulons. Mol. Microbiol 11, 363–374 (1994). [DOI] [PubMed] [Google Scholar]
- 38.Zheng ZZ et al. The lysosomal Rag–Ragulator complex licenses RIPK1-and caspase-8-mediated pyroptosis by Yersinia. Science 372, eabg0269(2021). [DOI] [PMC free article] [PubMed] [Google Scholar]
- 39.Li W. et al. Quality control, modeling, and visualization of CRISPR screens with MAGeCK-VISPR. Genome Biol. 16, 281, (2015). [DOI] [PMC free article] [PubMed] [Google Scholar]
- 40.Shepard LA, Shatursky O, Johnson AE & Tweten RK The mechanism of pore assembly for a cholesterol-dependent cytolysin: formation of a large prepore complex precedes the insertion of the transmembrane β-hairpins. Biochemistry 39, 10284–10293 (2000). [DOI] [PubMed] [Google Scholar]
Associated Data
This section collects any data citations, data availability statements, or supplementary materials included in this article.
Supplementary Materials
Data Availability Statement
All data supporting the findings of this study are included in this manuscript and its supplementary information. Source data are provided with this paper.


