Abstract
Objective:
Imaging evaluation of the cerebral ventricles is important for clinical decision-making in pediatric hydrocephalus. While quantitative measurements of ventricular size, over time, can facilitate objective comparison, automated tools for calculating ventricular volume are not structured for clinical use. We aimed to develop a fully automated deep learning (DL) model for pediatric cerebral ventricle segmentation and volume calculation for widespread clinical implementation across multiple hospitals.
Methods:
The study cohort consisted of 200 children with obstructive hydrocephalus from four pediatric hospitals and 199 controls. Manual ventricle segmentation and volume calculation served as ground truth. An encoder-decoder convolutional neural network (CNN) architecture, using T2-weighted MRIs as input, automatically delineated the ventricles and output volumetric measurements. On a held-out test set, segmentation accuracy was assessed using Dice similarity coefficient (0 to 1) and volume calculation using linear regression. Model generalizability was evaluated on an external MRI dataset from a fifth hospital. DL model performance was compared against FreeSurfer (FS), research segmentation software.
Results:
Model segmentation performed with an overall Dice score of 0.901 (0.946 in hydrocephalus, 0.856 in controls). The model generalized to external MRIs from a fifth pediatric hospital with a Dice score of 0.926. The model was more accurate than FS, with faster operating times (1.48 seconds per scan).
Conclusions:
We present a DL model for automatic ventricle segmentation and volume calculation that is more accurate and rapid than current available methods. With near immediate volumetric output and reliable performance across institutional scanner types, our model can be adapted to the real-time, clinical evaluation of hydrocephalus and improve clinician workflow.
Keywords: Cerebral ventricles, ventricular volume, hydrocephalus, artificial intelligence, machine learning, deep learning
Introduction:
Over 100 years ago, Walter Dandy reported the first technique for visualizing the cerebral ventricles in his seminal paper on pneumoencephalography1. Since then, imaging of the ventricles on computed tomography (CT) or magnetic resonance imaging (MRI) has become routine in caring for patients with hydrocephalus and other cerebrospinal fluid (CSF) abnormalities2. Ventricular access procedures, from placement of external ventricular drains to insertion of ventricular shunts, are some of the most common and critical neurosurgical interventions3,4. Changes in ventricular size and shape can help clarify a patient’s clinical status and thus guide neurosurgical decision-making. However, radiologists and neurosurgeons typically assess ventricular size by visual inspection alone. The evaluation of ventricular size, over time, is also complicated by differences in slice thickness, head angulation, and sequence type between different scans, which often limit direct comparison. Furthermore, linear estimates, such as frontal-occipital horn ratio, can be used to assess ventricle size but do not fully capture changes in ventricular volume5–7. Volume calculations, in turn, depend on segmentation of the cerebral ventricles, which is time-consuming and labor-intensive when manually performed. Nevertheless, consistently and accurately tracking ventricle volumes would significantly improve and standardize the life-long clinical management of patients with hydrocephalus.
Limited automated tools for ventricular segmentation exist, but they are primarily research software that is not well suited for real-time clinical use. They require volumetric 3D T1-scans with lengthier acquisition times, time-consuming image processing, and manual quality control8–11. Additionally, most are tailored to healthy adult brains, and do not have high fidelity in pediatric brains or in brains with distortion, such as from an underlying tumor. Automated methods for evaluating pediatric brain substructures have also been limited to small cohorts8,12,13.
To address the clinical need for an efficient, reliable, and quantitative method to evaluate the cerebral ventricles, we developed a clinical tool to consistently evaluate ventricular volume, over time, for patients with hydrocephalus. We developed deep learning (DL) model using T2-weighted MRIs (T2-scans) because they are routinely obtained within many pediatric imaging protocols. We leverage a state-of-the-art 2D convolutional neural network (CNN) architecture, and trained the model on a multi-institutional dataset of patients across all pediatric ages, with anatomically normal brains as well as brains with obstructive hydrocephalus. Our results generalized to an external dataset not seen during model development. Finally, the DL model was faster and more accurate than FreeSurfer v.5.0 (FS), a publicly available research software that can be used for subcortical segmentation.
Methods:
Cohort selection and study design
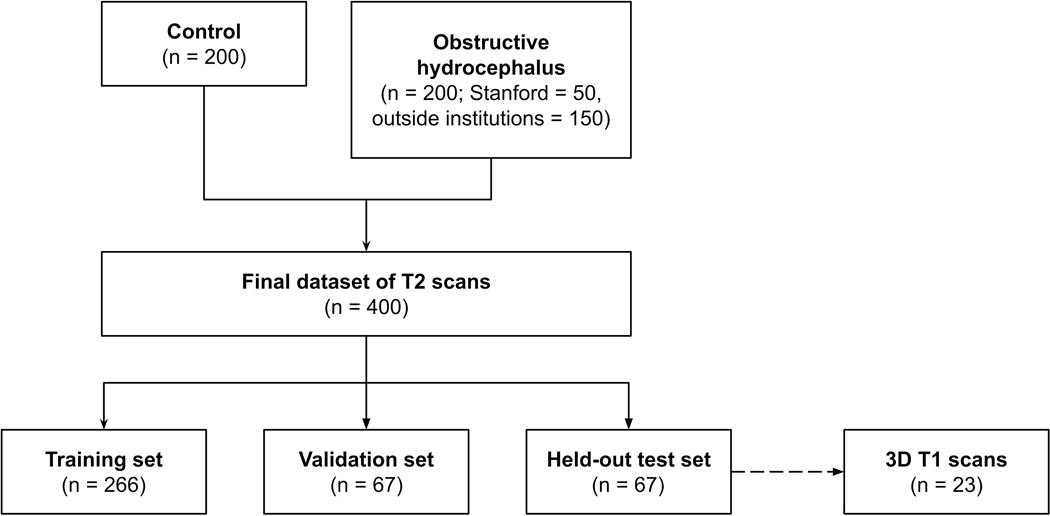
After Institutional Review Board approval at each institution, data use agreements were developed between the host institution (Stanford Lucile Packard Children’s Hospital) and four pediatric hospitals for this multi-center study. A retrospective review of patients with brain MRIs between 2002 and 2018 was used to identify patients less than 22-years old with posterior fossa (PF) brain tumors (Figure 1). The primary hydrocephalus cohort comprised of 200 patients with PF tumors causing obstructive hydrocephalus [host institution, n = 50; Seattle Children’s Hospital, n = 75; The Hospital for Sick Children, n = 60; and Dayton Children’s, n = 15]. All patients were clinically symptomatic (headache, nausea or vomiting) with MRIs prior to tumor treatment. We included patients who had emergent external ventricular drain placement, but excluded patients who had undergone permanent shunting, third ventriculostomy, or tumor debulking prior to their first available MRI. From our database of neurologically normal children with negative MRIs, 200 scans from 199 control patients were selected using random stratified sampling by age14. All patients had T2-scans. All controls and a subset of the hydrocephalus patients obtained 3D T1-weighted SPGR, MPRAGE, or BRAVO images (T1-scans). A board-certified neuroradiologist (KY, over 11 years’ experience) performed image quality control.
Figure 1.
Flow diagram demonstrating patient selection
The study cohort (400 T2-scans) was divided into: training (266; 125 controls and 141 hydrocephalus) and validation (67; 34 controls and 33 hydrocephalus) sets for model development and optimization, and a held-out test set (67; 29 controls, 38 hydrocephalus) for final evaluation of model performance. To further evaluate model generalizability, performance was prospectively tested on T2-scans from patients with hydrocephalus from a fifth institution (Utah Primary Children’s Hospital, n = 9). Scans from this independent institution were not used for model development.
MRI acquisition
Across the five institutions, MRI was performed at either 1.5 or 3T using the following magnets: GE (GE Healthcare, Waukesha, WI); Siemens (Siemens AG, Erlangen, Germany); Philips (Philips Healthcare, Andover, MA); and Toshiba (Canon Medical Systems USA Inc., Tustin, CA). The T2-scans were: T2 TSE clear/sense, T2 FSE, T2 propeller, T2 blade, T2 drive sense (TR/TE 2475.6-9622.24/80-146.048); slice thickness 1–5 mm with 0.5 or 1mm skip; matrix ranges of 224-1024 × 256-1024. The T1-scan protocol comprised: T1-SGPR, T1-BRAVO, or T1-MPRAGE, TR/TE 6.94-8.536/3.02-3.824, slice thickness 0.8–1.2 mm, matrix (256-512) x (256-512).
Ground truth labels
Manually segmentation of ventricles was performed on all axial slices by a neurosurgery resident (JQ) and a medical student (LK). Segmentations were reviewed by a board-certified pediatric neuroradiologist (KY). Ventricle segmentations began superiorly at the first axial slice with visible lateral ventricles and continued inferiorly to the foramina of Magendie and Luschka. The lateral, third, and fourth ventricles were segmented, including the choroid plexus. When visible, the subarachnoid cisterns and cavum pellucidum were excluded. For the hydrocephalus cohort, the visible ventricular system (including the fourth ventricle) not obliterated by the PF tumor was segmented. Manual segmentations were performed using ITK-SNAP software15.
Image processing and data augmentation
Axial DICOM images were pre-processed using the Python programming language. Skull stripping was not performed. Axial slices were resampled to 256 × 256 pixels. Data augmentation was performed by incorporating random rotations and flips.
Deep learning model architecture and training
We adapted a 2D U-net16, a state-of-the-art CNN architecture, to automatically segment the cerebral ventricles using T2-scans as input. Our model consisted of an encoder-decoder structure: an encoder maps a volume to an abstract low-resolution encoding, and a decoder expands this encoding back to a full-resolution segmentation image, which specifies the probability that each pixel in a slice is ventricle or not ventricle (Supplementary Figure 1). The encoder weights were adapted from a visual geometry group (VGG-11) architecture pre-trained on the ImageNet dataset, a consortium of over 1.2 million 2D images17. The model was trained to minimize Dice loss18 of the segmentation output. Training was carried out on four Titan Xp graphics processing units (NVIDIA Corp, CA).
FreeSurfer
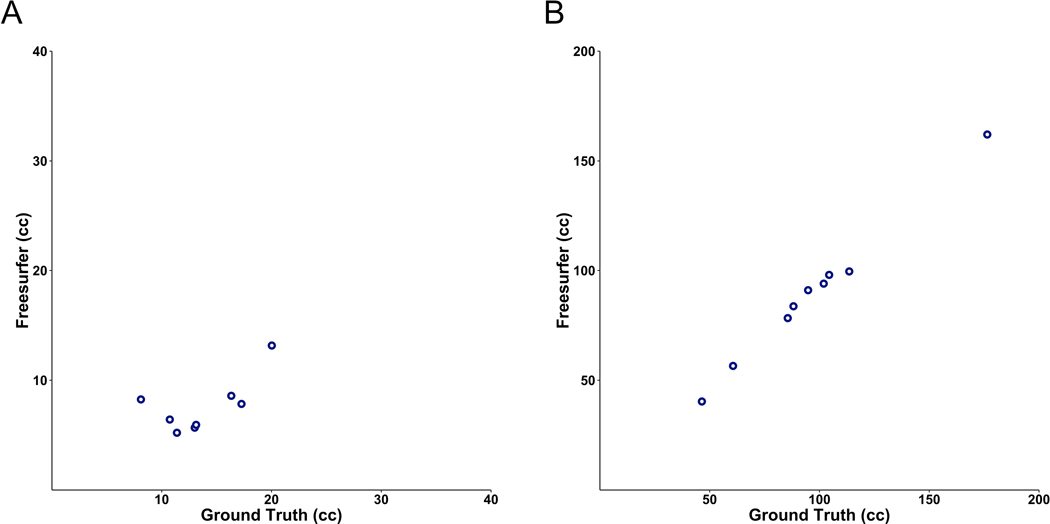
After visual inspection of 3D T1-scans to parcellate the brain into tissue classes and derive quantitative estimates of volume, an automated, non-biased atlas-based Bayesian segmentation procedure, was applied in FreeSurfer (FS) v.5.0 (http://surfer.nmr.mgh.harvard.edu/)19. FS preprocessing was performed using a previously published methodology19,20. Quantitative estimates of volume were derived for spatially distinct region of interests (ROIs), as specified in the Desikan-Killiany Atlas21. FS was run using a central processing unit due to the lack of active support for graphics processing unit use.
Ventricular volume calculation
Ground truth volumes were derived from manual segmentations of the ventricles, whereas model predicted ventricular volume was calculated using the predicted ventricle segmentation mask. Ventricle volume was calculated by multiplying the segmentation area of each axial slice by the slice thickness and summing the contribution from all slices. Volume calculations included “skip” in scans of non-contiguous slices. For FS, ventricular volume was automatically calculated by the software using the FS-derived ventricle segmentation mask.
Statistical Analyses
Predicted ventricle segmentations were compared to ground truth using Dice similarity coefficient ([2 x true positives/(2 x true positives + false positives + false negatives)])18. Linear regression was used to evaluate volume calculations derived from T2-scans versus 3D T1-scans, as well as predicted versus ground truth segmentations. Analysis of variance (ANOVA) was performed on a multiple regression of Dice score with cohort group, ventricular volume, and age as independent variables. Dice coefficients from FS and the DL model were compared using a paired two tailed t-test. Statistics calculations were performed using R version 3.5.1.
Results:
Study cohort
The control cohort (199 patients, 200 scans) ranged from 0 to 19-years old (median = 8), with 48.5% (n = 97) males. We visualized the ventricular volumes across ages to get an approximation of a normal population curve. In our cohort, dramatic increases in volume occurred during the first 50 months of life, with a plateau between four and eight years, after which volume increased until approximately 14-years old (Supplementary Figure 2).
The obstructive hydrocephalus cohort (n = 200) ranged from 0 to 22-years old (median = 5) with 56% (n = 112) males. Twenty-seven hydrocephalus patients had emergent external ventricular drain placement prior to MRI due to clinical instability but continued to have imaging findings of hydrocephalus.
Calculation of ventricular volume on 3D-T1 is comparable to T2-scans
Three-dimensional T1-scans, with thinner slices and greater anatomic detail, have commonly been chosen for volumetric analysis. Given that T2-scans have wider clinical use, we demonstrate that ventricle volumes manually determined using T2-scans are comparable to manual calculations based on 3D T1-scans (Supplementary Figure 3). Despite the larger, and more variable slice thickness for T2-scans (2–6 mm) compared to 3D T1-scans (1 mm), volume calculations derived from the two sequences correlated closely (r2 coefficient = 0.76).
DL model performance
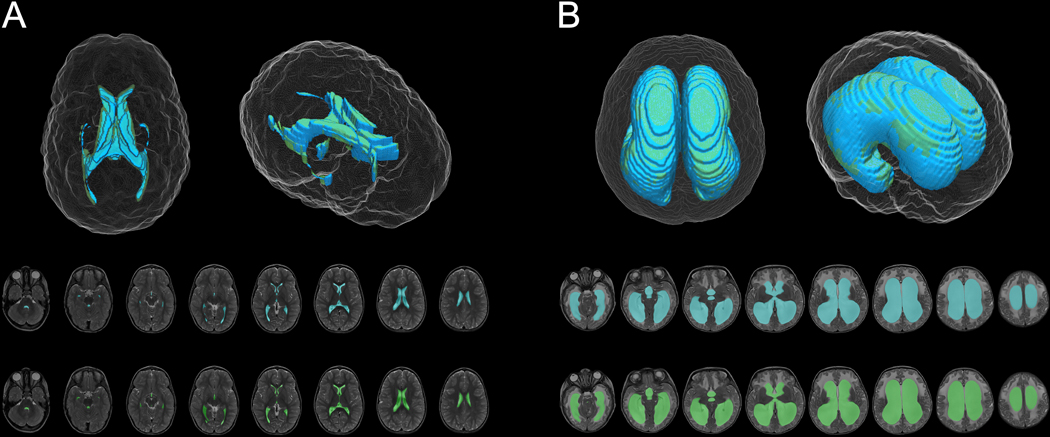
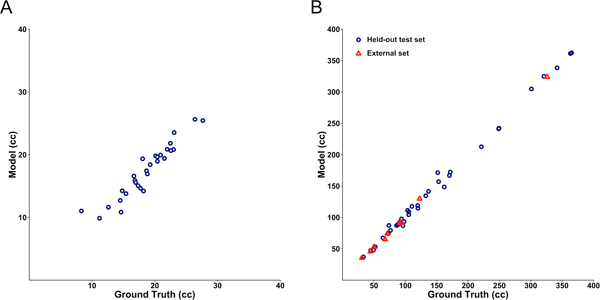
On a held-out test set of T2-scans, model segmentation was very accurate with an overall Dice score of 0.901. Segmentation and volume calculation was more accurate in hydrocephalus (Dice coefficient 0.946) versus control patients (Dice coefficient 0.856) (F = 375.4, p < 2.2 × 10⁻¹⁶) (Figure 2, Figure 3, videos 1 and 2). Within each group, model performance was better in patients with higher ventricle volumes (control: r = 0.39, p = 7.3 × 10⁻⁹; hydrocephalus: r = 0.59, p < 2.2 × 10⁻¹⁶). Segmentation accuracy did not vary with age (F = 1.39, p = 0.24).
Figure 2.
DL model (blue) and ground truth manual (green) segmentation of representative control (A) and hydrocephalus (B) T2-weighted MRIs.
Figure 3.
Correlation between the DL model and manually derived ventricular volume for control (A) (r2 = 0.90) and hydrocephalus (B) (r2 = 0.997) T2-weighted MRIs from the held-out test set. Blue circles denote MRIs from the held-out test set. Red triangles denote external MRIs from the fifth instution, not used for model development.
Video 1.
DL model (blue) and ground truth manual (green) segmentation of representative control T2-weighted MRI.
Video 2.
DL model (blue) and ground truth manual (green) segmentation of representative obstructive hydrocephalus T2-weighted MRI.
To further test the generalizability of our model, we evaluated segmentation accuracy on nine hydrocephalus patients from a fifth institution that was not used for initial model development. Accuracy was maintained even on this completely external test set (Dice coefficient 0.926, Figure 3). Model evaluation took 1.48 seconds per scan at the graphics processing unit level (projected to 25 minutes at the central processing unit level).
Comparison to FS
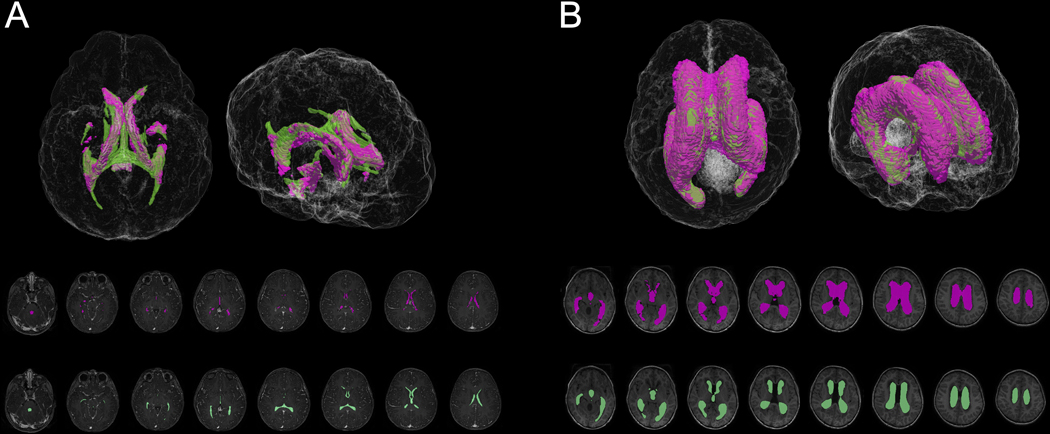
FS22 was used for ventricular segmentation and volume calculation on a subset of the held-out test set with available 3D T1-scans. Given only 12 hydrocephalus patients from the held-out test set had 3D T1-scans, we selected 11 age-matched controls to evaluate with FS. Ages ranged from several months to 13-years old for both groups (median = 7 in controls; 6.5 in hydrocephalus patients). FS was only able to segment eight out of eleven control and nine out of twelve hydrocephalus 3D T1-scans, with processing errors generated on the remaining scans. Of scans that FS successfully processed, the Dice coefficients were 0.55 for control and 0.86 for hydrocephalus 3D T1-scans (Figure 4, Figure 5). The DL model was more accurate for the exact same patients (Dice coefficients of 0.83 for controls (p = 6.4 × 10⁻⁵) and 0.94 for hydrocephalus (p = 8.5 × 10⁻⁵)). Per scan, FS took 8.2 to 207.3 hours (median = 20.3) for ventricular segmentation and volume output, compared to 1.48 seconds per scan for the DL model.
Figure 4.
FS (purple) and ground truth manual (green) segmentation of representative control (A) and hydrocephalus (B) 3D T1-weighted MRIs.
Figure 5.
Correlation between the FS and manually derived ventricular volume for a sub-cohort of control (A) (r2= 0.44) and hydrocephalus (B) (r2 = 0.994) 3D T1-weighted MRIs.
Discussion:
In this study, we present a DL model to calculate ventricular volume for pediatric patients with and without obstructive hydrocephalus using T2-weighted MRIs. We trained and tested a state-of-the-art DL architecture on a large cohort of 400 patients from four different hospitals, representing the largest study of its kind to date. Our heterogeneous imaging dataset consisted of scans from geographically distinct institutions, as well as multiple scanner vendors and magnet strengths. To simulate clinical implementation and evaluate model performance at an entirely new venue, we prospectively applied our model to a fifth institution that made no contributions to model development. Our model could therefore be reliably implemented across MRI scanners without degradation of its performance.
Pediatric hydrocephalus has a prevalence of approximately 6 in 10,000 live births, and up to half of shunted patients experience shunt malfunction within the first year of placement23,24. Children with shunted hydrocephalus therefore undergo numerous imaging studies for routine surveillance and clinical evaluation, but these are not always directly comparable depending on the slice thickness, head angulation or rotation, and sequence type of each scan. For patients with shunts, ventricular monitoring would undoubtedly benefit from an objective, consistent, quantitative method for gauging ventricular volume change or stability over time25. Yet, manual ventricle segmentation is cumbersome, and current automated methods are time-consuming and require significant oversight8–10,26–28. These methods have included explicit handcrafted feature extraction to segment specific tissue types, with additional human input for regions of interest, coregistration of reference atlases, thresholding, or further parameter modifications8–10,26–28. Other research segmentation tools, including FS, have been applied mostly to small cohorts of healthy adult volunteers, and have not been validated for use in children7,22,27–31. Additionally, these approaches have relied on volumetric 3D T1-scans, which take more time to acquire and are not routinely collected in the clinical setting.
While there have been reports of pediatric brain segmentation, particularly in neonates, these studies have also been limited to small cohorts of healthy subjects8,12,26,32. Most have also required significant manual input, relied on predetermined intensity and spatial information, used tissue probability mapping, or atlas-based approaches8,12,13,26,32. These methods limit their applicability across institutions, where variations in magnet field strength and imaging protocols can create bias in volume measurements33. Their fidelity is also largely unknown in cases where brain pathology causes significant deformation and limits spatial registration, such as in patients with tumors or ventricular shunts. Additionally, changes in T1 and T2 signal that accompany brain development and myelination from infancy to adolescence31 have posed unique challenges to existing segmentation methods8,34, which have not been developed using pediatric patients of all ages.
In contrast, by using DL, which does not depend on extraction of hand-crafted features, our model requires minimal preprocessing and human oversight after training is complete. Although one prior study has demonstrated the feasibility of DL for classifying brain tissue subtypes in a small cohort of normal infants35, our dataset is much larger and consisted of scans from infants, children, and adolescents with and without hydrocephalus. Despite age-related white matter T2 signal changes, our model’s accuracy did not vary with age, suggesting that the DL model is agnostic to myelination status. Importantly, head angulation and rotation, often an issue for neonates and smaller children in the scanner, did not degrade the ability to measure ventricular volume. Despite the presence of ventricular catheters in 27 patients, the DL model still reliably calculated ventricular volume, suggesting it would be able to do so even after permanent ventricular shunt placement.
Interestingly, our model showed better performance in the hydrocephalus cohort compared to controls. This is possibly attributable to larger ventricle sizes in patients with hydrocephalus, which was shown to improve segmentation accuracy within each cohort. However, this higher accuracy also implies that the model learned to reliably distinguish ventricular CSF from periventricular edema in patients with PF tumors. It is possible that the larger ventricles in the setting of PF tumors provided richer information for higher dimensional inferences by the DL model.
Our model has several limitations. Because our training data did not distinguish between the different ventricular compartments, our model does not identify compartment-specific volumes, which would be useful in cases of ventricular entrapment. Trapped cystic pockets or other CSF abnormalities such as porencephalic and arachnoid cysts would not necessarily be parcellated from the remainder of the ventricular system. We also did not train our model to determine the presence or absence of hydrocephalus, since this determination often requires additional clinical correlation. Therefore, this technique would still need to be associated with the clinical status of the patient, in order to make the best decisions. In addition, our training data only included children with normal ventricular anatomy and those with symptomatic obstructive hydrocephalus from PF tumors causing obvious ventriculomegaly. Nevertheless, we recognize that many etiologies and manifestations of hydrocephalus exist, such as normal pressure hydrocephalus, hydrocephalus ex vacuo, slit ventricles, aqueductal stenosis, communicating hydrocephalus and more. Thus, while our model would likely be able to calculate ventricular volume in these cases, its performance accuracy needs to be validated in the context of these other etiologies. Notably, the model was trained to include the visible fourth ventricular volume using images from the control cohort. In cases of PF tumors obliterating the fourth ventricle, the model was trained to include the volume of the visible fourth ventricle, and exclude tumor tissue from the ventricular volume calculation. While fourth ventricle volume would likely be included in the overall ventricular volume calculation of other hydrocephalus etiologies, performance would again need to be validated in those cohorts. Our DL model nonetheless lays the groundwork for more widespread applications and could be used to pre-train future model iterations. Future studies could also examine model performance using other T2-derivatives, such as single shot spin echo or various T2-weighted imaging used for fast MRI for even more widespread applicability.
Despite its limitations, our model quickly and accurately segments the ventricles in commonly acquired T2-scans, across a wide range of ventricle sizes, regardless of differences in myelination, degrees of brain deformation, or the presence of periventricular edema. Questions often arise regarding generalizability of AI models derived from a single institution. In this study, we aimed at creating a generalizable model using data from various hospitals and geographic regions that use different MRI vendors, magnet strengths, and imaging parameters. While our results suggest model generalizability, additional prospective investigations are nevertheless needed to further validate model performance across global centers.
Conclusions:
We developed an artificial intelligence-based clinical tool to automatically segment the cerebral ventricles and calculate ventricular volume such that ventricular volume can be consistently measured in pediatric patients with obstructive hydrocephalus. Clinical deployment would facilitate neurosurgical decision-making and be reliable across different institutional scanners. While its use in various clinical scenarios still requires correlation with symptomatology, and even brain volume, our model automatically provides useful volumetric data for the ventricles. Future directions involve evaluating model performance in the context of other hydrocephalus etiologies and CSF compartments as well as further evaluation of prospective performance.
Supplementary Material
Supplementary Figure 3. Model architecture consists of a 2D U-net CNN with an encoder-decoder structure.
Supplementary Figure 2. Scatter Plot of ventricular volume versus age in the control cohort. Individual points correspond to ventricular volume in cubic centimeters (cc), plotted against patients’ ages (years). Curve represents a smooth local regression summarizing the relationship between volume and age. Colored bands signify the 95% confidence interval of the regression model.
Supplementary Figure 1. Correlation between manually derived 3D T1- and T2-derived ventricular volume (r2 = 0.76).
Footnotes
We have no disclosures or conflicts of interest. No sources of funding were used for the implementation or execution of this study.
References:
- 1.Dandy WE. Rontgenography of the Brain after the Injection of Air into the Spinal Canal. Annals of surgery. 1919;70(4):397–403. [DOI] [PMC free article] [PubMed] [Google Scholar]
- 2.McInerny TK, Adam HM, Campbell DE, Foy JM, Kamat DM. AAP textbook of pediatric care. Am Acad Pediatrics; 2016. [Google Scholar]
- 3.Patwardhan RV, Nanda A. Implanted ventricular shunts in the United States: the billion-dollar-a-year cost of hydrocephalus treatment. Neurosurgery. 2005;56(1):139–144; discussion 144–135. [DOI] [PubMed] [Google Scholar]
- 4.Pereira S, Pinto A, Oliveira J, Mendrik AM, Correia JH, Silva CA. Automatic brain tissue segmentation in MR images using Random Forests and Conditional Random Fields. J Neurosci Methods. 2016;270:111–123. [DOI] [PubMed] [Google Scholar]
- 5.O’Hayon BB, Drake JM, Ossip MG, Tuli S, Clarke M. Frontal and Occipital Horn Ratio: A Linear Estimate of Ventricular Size for Multiple Imaging Modalities in Pediatric Hydrocephalus Pediatric neurosurgery. 1998;29:245–249. [DOI] [PubMed] [Google Scholar]
- 6.Kulkarni AV, Drake JM, Armstrong DC, Dirks PB. Imaging correlates of successful endoscopic third ventriculostomy. Journal of neurosurgery. 2000;92(6):915–919. [DOI] [PubMed] [Google Scholar]
- 7.Multani JS, Oermann EK, Titano J, et al. Quantitative Computed Tomography Ventriculography for Assessment and Monitoring of Hydrocephalus: A Pilot Study and Description of Method in Subarachnoid Hemorrhage. World Neurosurg. 2017;104:136–141. [DOI] [PubMed] [Google Scholar]
- 8.Wang L, Gao Y, Shi F, et al. LINKS: learning-based multi-source IntegratioN frameworK for Segmentation of infant brain images. Neuroimage. 2015;108:160–172. [DOI] [PMC free article] [PubMed] [Google Scholar]
- 9.Adams CM, Wilson TD. Virtual cerebral ventricular system: an MR-based three-dimensional computer model. Anat Sci Educ. 2011;4(6):340–347. [DOI] [PubMed] [Google Scholar]
- 10.Ishii K, Soma T, Shimada K, Oda H, Terashima A, Kawasaki R. Automatic volumetry of the cerebrospinal fluid space in idiopathic normal pressure hydrocephalus. Dement Geriatr Cogn Dis Extra. 2013;3(1):489–496. [DOI] [PMC free article] [PubMed] [Google Scholar]
- 11.Schnack HG, Hulshoff Pol HE, Baaré WFC, Viergever MA, Kahn RS. Automatic Segmentation of the Ventricular System from MR Images of the Human Brain. NeuroImage. 2001;14(1):95–104. [DOI] [PubMed] [Google Scholar]
- 12.Anbeek P, Isgum I, van Kooij BJ, et al. Automatic segmentation of eight tissue classes in neonatal brain MRI. PLoS One. 2013;8(12):e81895. [DOI] [PMC free article] [PubMed] [Google Scholar]
- 13.Qiu W, Yuan J, Rajchl M, et al. 3D MR ventricle segmentation in pre-term infants with post-hemorrhagic ventricle dilatation (PHVD) using multi-phase geodesic level-sets. Neuroimage. 2015;118:13–25. [DOI] [PubMed] [Google Scholar]
- 14.Forkert ND, Li MD, Lober RM, Yeom KW. Gray Matter Growth Is Accompanied by Increasing Blood Flow and Decreasing Apparent Diffusion Coefficient during Childhood. AJNR Am J Neuroradiol. 2016;37(9):1738–1744. [DOI] [PMC free article] [PubMed] [Google Scholar]
- 15.Yushkevich PA, Piven J, Hazlett HC, et al. User-guided 3D active contour segmentation of anatomical structures: significantly improved efficiency and reliability. Neuroimage. 2006;31(3):1116–1128. [DOI] [PubMed] [Google Scholar]
- 16.Ronneberger O, Fischer P, Brox T. U-net: Convolutional networks for biomedical image segmentation. Paper presented at: International Conference on Medical image computing and computer-assisted intervention 2015. [Google Scholar]
- 17.Deng J, Dong W, Socher R, Li L-J, Li K, Fei-Fei L. Imagenet: A large-scale hierarchical image database. Paper presented at: 2009 IEEE conference on computer vision and pattern recognition 2009. [Google Scholar]
- 18.Dice LR. Measures of the amount of ecologic association between species. Ecology. 1945;26(3):297–302. [Google Scholar]
- 19.Dale A, Fischl B, Sereno MI. Cortical Surface-Based Analysis Neuroimage. 1999;9:179–194. [DOI] [PubMed] [Google Scholar]
- 20.Segonne F, Pacheco J, Fischl B. Geometrically accurate topology-correction of cortical surfaces using nonseparating loops. IEEE transactions on medical imaging. 2007;26(4):518–529. [DOI] [PubMed] [Google Scholar]
- 21.Desikan RS, Segonne F, Fischl B, et al. An automated labeling system for subdividing the human cerebral cortex on MRI scans into gyral based regions of interest. Neuroimage. 2006;31(3):968–980. [DOI] [PubMed] [Google Scholar]
- 22.Fischl B, Salat D, Busa E, et al. Whole Brain Segmentation: Automated Labeling of Neuroanatomical Structures in the Human Brain. Neuron. 2002;33(341–355). [DOI] [PubMed] [Google Scholar]
- 23.DeFlorio RM, Shah CC. Techniques that decrease or eliminate ionizing radiation for evaluation of ventricular shunts in children with hydrocephalus. Semin Ultrasound CT MR. 2014;35(4):365–373. [DOI] [PubMed] [Google Scholar]
- 24.Wright Z, Larrew TW, Eskandari R. Pediatric Hydrocephalus: Current State of Diagnosis and Treatment. Pediatrics in review. 2016;37(11):478–490. [DOI] [PubMed] [Google Scholar]
- 25.Drake JM. The surgical management of pediatric hydrocephalus. Neurosurgery. 2008;62(suppl_2):SHC633-SHC642. [DOI] [PubMed] [Google Scholar]
- 26.Ourselin S, Styner MA, Moeskops P, Viergever MA, Benders MJNL, Išgum I Evaluation of an automatic brain segmentation method developed for neonates on adult MR brain images. 2015;9413:941315. [Google Scholar]
- 27.Lemieux L, Hammers A, Mackinnon T, Liu RS. Automatic segmentation of the brain and intracranial cerebrospinal fluid in T1-weighted volume MRI scans of the head, and its application to serial cerebral and intracranial volumetry. Magn Reson Med. 2003;49(5):872–884. [DOI] [PubMed] [Google Scholar]
- 28.Chen H, Dou Q, Yu L, Qin J, Heng PA. VoxResNet: Deep voxelwise residual networks for brain segmentation from 3D MR images. Neuroimage. 2018;170:446–455. [DOI] [PubMed] [Google Scholar]
- 29.Gonzalez-Villa S, Oliver A, Valverde S, Wang L, Zwiggelaar R, Llado X. A review on brain structures segmentation in magnetic resonance imaging. Artif Intell Med. 2016;73:45–69. [DOI] [PubMed] [Google Scholar]
- 30.Holden M, Schnabel JA, Hill DL. Quantification of small cerebral ventricular volume changes in treated growth hormone patients using nonrigid registration. IEEE transactions on medical imaging. 2002;21(10):1292–1301. [DOI] [PubMed] [Google Scholar]
- 31.Moeskops P, de Bresser J, Kuijf HJ, et al. Evaluation of a deep learning approach for the segmentation of brain tissues and white matter hyperintensities of presumed vascular origin in MRI. Neuroimage Clin. 2018;17:251–262. [DOI] [PMC free article] [PubMed] [Google Scholar]
- 32.Beare RJ, Chen J, Kelly CE, et al. Neonatal Brain Tissue Classification with Morphological Adaptation and Unified Segmentation. Front Neuroinform. 2016;10:12. [DOI] [PMC free article] [PubMed] [Google Scholar]
- 33.Jovicich J, Czanner S, Han X, et al. MRI-derived measurements of human subcortical, ventricular and intracranial brain volumes: Reliability effects of scan sessions, acquisition sequences, data analyses, scanner upgrade, scanner vendors and field strengths. Neuroimage. 2009;46(1):177–192. [DOI] [PMC free article] [PubMed] [Google Scholar]
- 34.McGraw P, Liang L, Provenzale JM. Evaluation of normal age-related changes in anisotropy during infancy and childhood as shown by diffusion tensor imaging. American Journal of Roentgenology. 2002;179(6):1515–1522. [DOI] [PubMed] [Google Scholar]
- 35.Zhang W, Li R, Deng H, et al. Deep convolutional neural networks for multi-modality isointense infant brain image segmentation. Neuroimage. 2015;108:214–224. [DOI] [PMC free article] [PubMed] [Google Scholar]
Associated Data
This section collects any data citations, data availability statements, or supplementary materials included in this article.
Supplementary Materials
Supplementary Figure 3. Model architecture consists of a 2D U-net CNN with an encoder-decoder structure.
Supplementary Figure 2. Scatter Plot of ventricular volume versus age in the control cohort. Individual points correspond to ventricular volume in cubic centimeters (cc), plotted against patients’ ages (years). Curve represents a smooth local regression summarizing the relationship between volume and age. Colored bands signify the 95% confidence interval of the regression model.
Supplementary Figure 1. Correlation between manually derived 3D T1- and T2-derived ventricular volume (r2 = 0.76).


