Abstract
Resistance to cancer treatment remains a major clinical hurdle. Here, we demonstrate that the CoREST complex is a key determinant for endocrine resistance and ER+ breast cancer plasticity. In endocrine sensitive cells, CoREST is recruited to ERα/FOXA1 co-bound regulatory regions to regulate the estrogen pathway. In contrast, during temporal reprogramming towards a resistant state, CoREST is recruited to AP-1 sites. In reprogrammed cells, CoREST favors chromatin opening, cJUN binding to chromatin, and gene activation by controlling SWI/SNF recruitment independently of the demethylase activity of the CoREST subunit, LSD1. Genetic and pharmacological CoREST inhibition reduce tumorigenesis and metastasis of endocrine sensitive and resistant xenografts models. Consistently, CoREST controls a gene signature in clinical breast tumors resistant to endocrine therapies involved in invasiveness. Our studies reveal CoREST functions that are co-opted to drive cellular plasticity and resistance to endocrine therapies and tumorigenesis, thus establishing CoREST as a potential therapeutic target for the treatment of advanced breast cancer.
Breast cancer is the most commonly diagnosed type of cancer in women, with the second highest mortality1. The majority of breast cancers express the estrogen and progesterone receptors (ERα and PR) and account for roughly 80% of all cases2. Agents targeting the estrogen pathway represent the primary treatment modality which can be classified into three main categories: aromatase inhibitors (AIs) and selective estrogen receptor modulators (SERMs) and degraders (SERDs)3. Despite the success of endocrine therapy, resistance arises in about 40% of cases after 5 years of treatment, leading to incurable metastatic disease4.
Therapeutic response is coordinated by transcriptional programs that integrate signaling pathways, epigenetic mechanisms, and chromatin organization5-8. Unfortunately, treatment-induced selective pressure promotes genetic and epigenetic changes favoring survival of cells resistant to therapy9,10. A combination of genetic mutations and epigenetic alterations shape this evolution to metastatic disease, with the most common mutations found in the gene encoding ERα (ESR1), effectors of mitogenic signaling pathways, transcription factors (MYC, CTCF, FOXA1), and epigenetic machineries (SWI/SNF, BAF)11. Moreover, TP53 mutations, which reflect poor prognosis, are highly enriched in metastatic samples of endocrine therapy patients accompanied by loss of ERα and PR expression11-19. Notably, this loss induces a switch from endocrine therapy sensitive luminal (ER+/PR+) breast cancer to a basal-like subtype (ER-/PR-/HER2-) insensitive to hormone treatment. Although this breast cancer subtype conversion is well recognized, to our knowledge, gene expression profiles of ER- metastatic lesions derived from ER+ tumors that escape endocrine treatment are not available. Moreover, current pre-clinical models fail to identify the mechanisms of resistance in such cases.
CoREST is a chromatin-modifying complex with core subunits including the scaffold proteins RCOR1/2/3, histone deacetylases HDAC1/2, and LSD120. LSD1 (encoded by KDM1A) is a mono-amine oxidase that primarily demethylates lysine 4 of histone H320,21. It regulates stemness, angiogenesis, cell motility, differentiation and senescence22, and it is overexpressed in hematological23 and solid malignancies24. However, its distinct role in breast cancer is controversial as it was proposed to function as both a tumor suppressor25 and oncogene in basal-like and luminal breast cancer26, respectively. Nonetheless, the role of CoREST in resistance to current breast cancer treatments is not known.
Here, we identified CoREST as a key driver of endocrine therapy sensitivity and resistance independently of LSD1 enzymatic activity. By analyzing expression of epigenetic complexes in breast cancer patients, we found CoREST subunits were overexpressed in TP53 mutant breast cancer. Because TP53 mutations correlate to poor prognosis after endocrine therapy, we sought to determine the role of this CoREST in regulating endocrine resistance in TP53 mutant breast cancers. By modeling endocrine resistance in vitro and in vivo, we found that chemical inhibition and genetic loss of CoREST have profound effects on cell proliferation, tumorigenesis, and metastasis in endocrine resistant xenografts. Mechanistically, independently of LSD1 enzymatic activity, CoREST associates with the SWI/SNF (BAF) complex to regulate chromatin accessibility and cJUN recruitment to activate pro-metastatic genes. Notably, CoREST directly regulates a set of genes specifically expressed in patients with endocrine resistant tumors, suggesting that a CoREST gene signature could be exploited for therapeutic interventions.
Results
Conversion from luminal to basal-like breast cancer cells and CoREST expression.
TP53 is the most frequently mutated gene in breast cancer27 and is associated with poor prognosis (Extended Data Fig. 1a). To define new epigenetic dependencies in breast cancers with TP53 mutations (TP53mut), we interrogated the expression of epigenetic machineries in ER+ and ER- breast cancer patient samples segregated by TP53 status. Unsupervised clustering analysis of RNA-seq data from 1,483 patient samples revealed that components of SWI/SNF (ARID1A, SMARCC1) and CoREST (KDM1A, RCOR2, HDAC2) complexes were overexpressed in ER-/TP53mut breast cancer (Fig. 1a). Since the genes responsible for the dual enzymatic activities of CoREST were overexpressed, we reasoned that this complex may have important functions in TP53mut breast cancers. Notably, KDM1A, RCOR2, HDAC2 were also overexpressed in ER+/TP53mut, albeit with the highest expression levels in ER-/TP53mut breast cancers (Fig. 1b). Irrespective of ERα status, high expression of CoREST subunits was associated with poor prognosis (Fig. 1c).
Fig. 1: Endocrine resistant breast cancer cells are sensitive to CoREST inhibition.
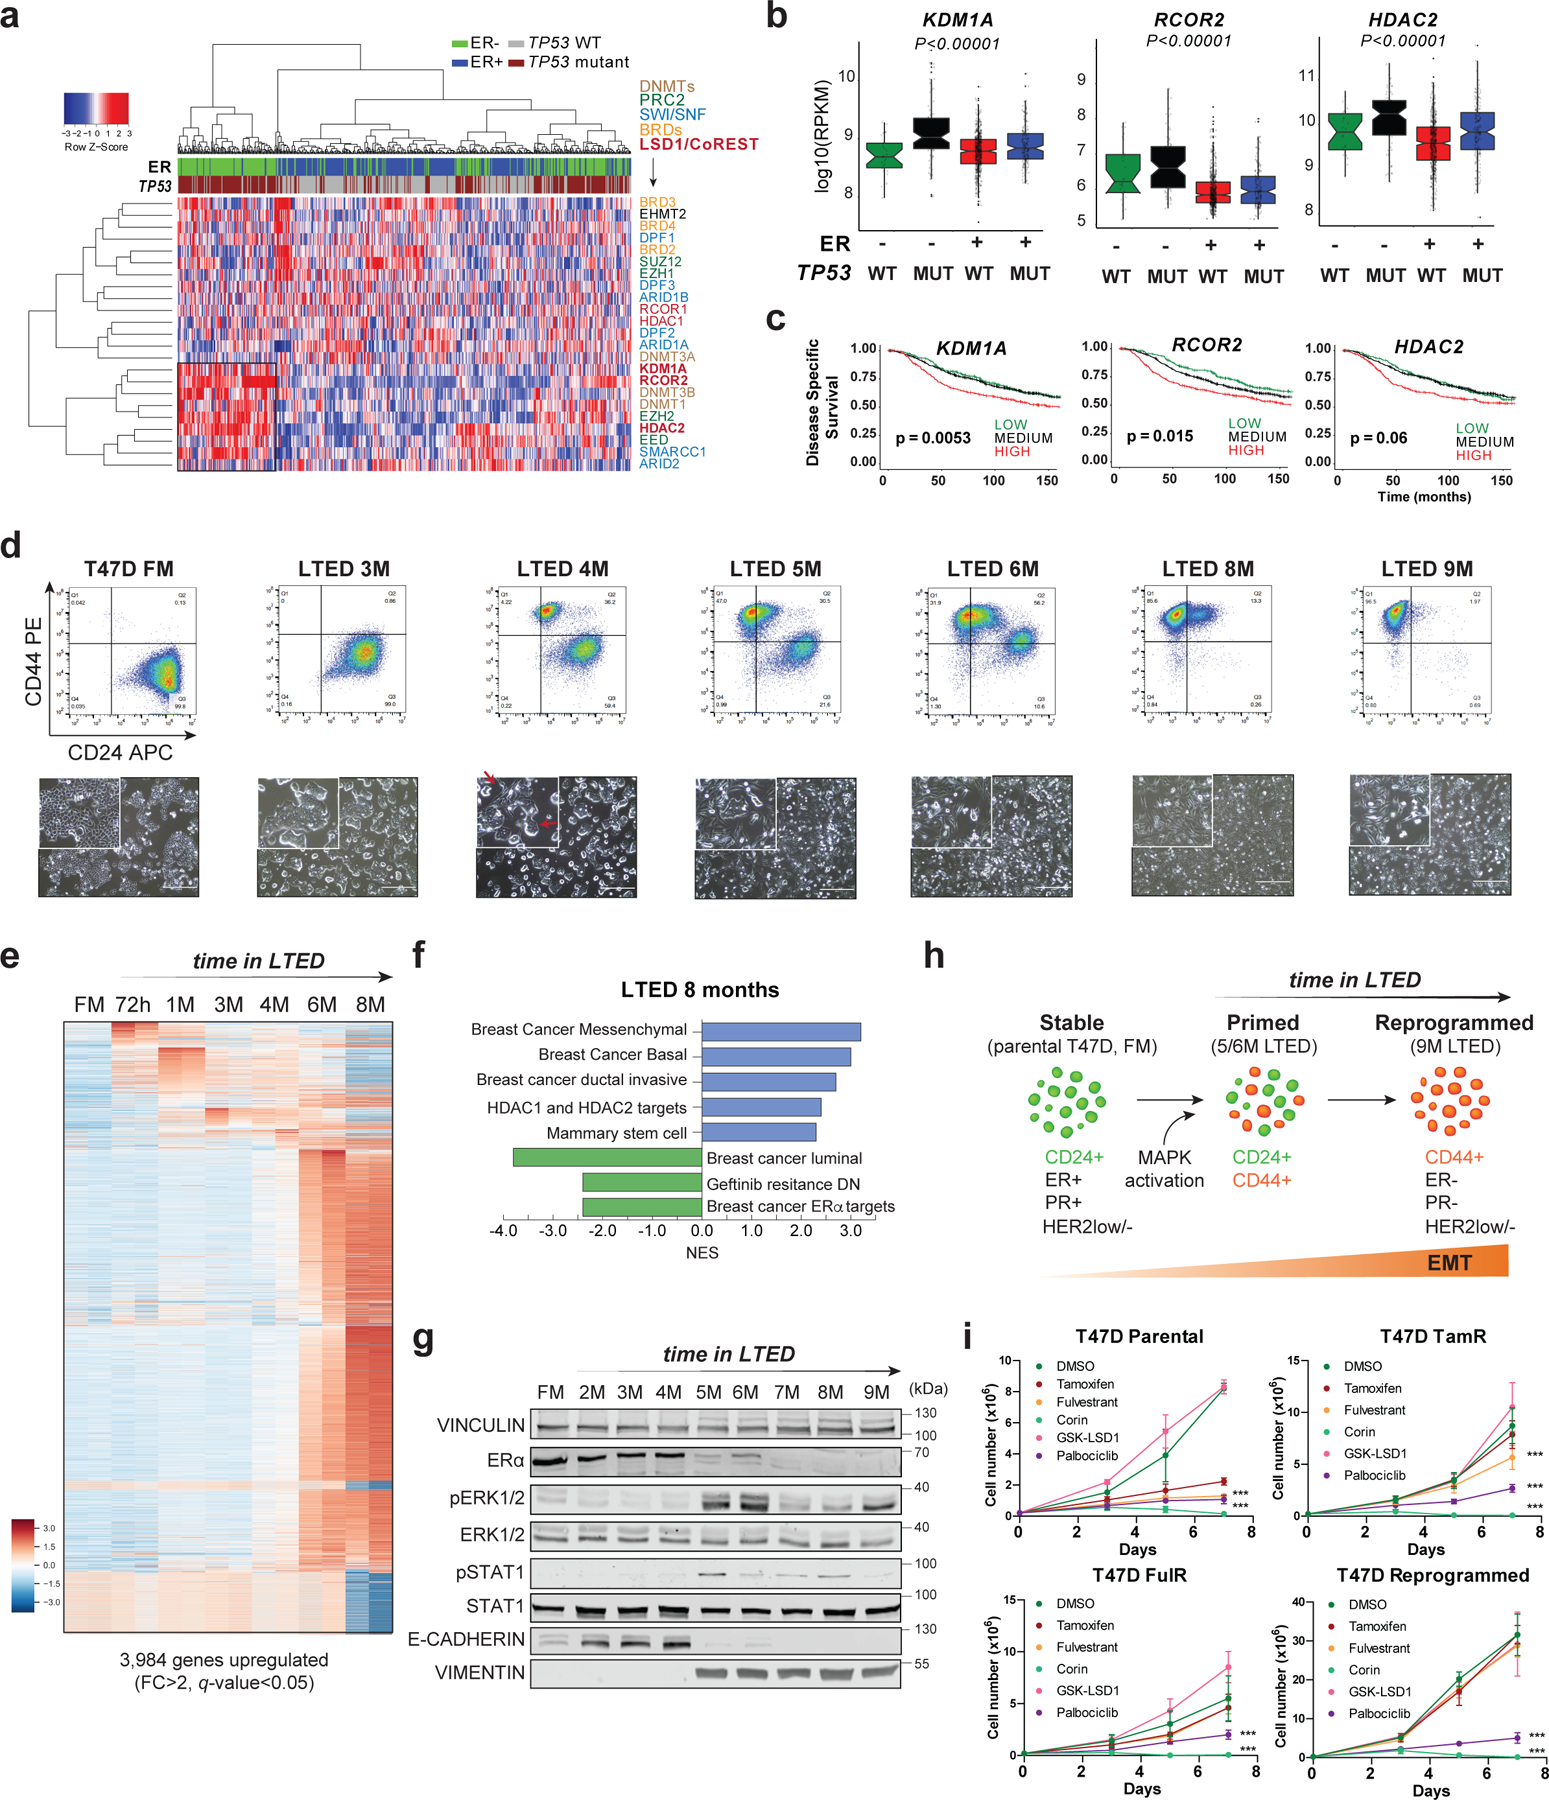
a, Expression of selected epigenetic genes in 1,483 patient samples (METABRIC dataset) classified by ER status and TP53 mutation. Unsupervised clustering revealed a cohort of ER-/TP53mut samples with high expression of CoREST subunits (KDM1A, RCOR2, HDAC2) and components of the SWI/SNF complex. b, KDM1A, HDAC2, and RCOR2 mRNA expression in 1,423 breast cancer samples grouped by ER expression and TP53 status. The box plots span from the 25th to 75th percentiles, expression is represented as log10 (RPKM) with the median (midline of box plots) and maximum/minimum (upper and lower bounds of whiskers) values depicted. Significance was determined by a non-parametric Wilcox test (two-sided) and p-values correspond to the comparison between ER-/TP53mut (MUT) with other subgroups. c, Kaplan–Meier survival curves segregated by KDM1A, RCOR2, and HDAC2 expression. Disease-specific survival is significantly diminished for patients (METABRIC dataset) with high KDM1A, RCOR2, and HDAC2. P value was calculated using a log-rank (Mantel–Cox) test. d, Representative FACS of CD24 and CD44 of T47D parental (full media, FM) and 9-month LTED (M, months). CD24 and CD44 expression was monitored every two weeks for over a year (top). Representative images (bottom) of cells from top panel. Red arrows depict cells with mixed epithelial and mesenchymal morphology. n = 3 biological independent replicates. e, Heatmap of significantly upregulated genes (FC > 2, q-value < 0.05) during acquisition of resistance in T47D. f, GSEA of 8M T47D-LTED cells. g, Western blot (WB) of T47D FM and LTED whole cell lysates for the proteins indicated with VINCULIN as a loading control. h, Model of evolution of resistance. We defined 5M and 6M LTED cells as primed and >9M as reprogrammed. EMT, epithelial-to-mesenchymal transition. i, Proliferation of parental, tamoxifen resistant (TamR), fulvestrant resistant (FulR), and LTED T47D treated with 1µm of DMSO (vehicle), tamoxifen, fulvestrant, corin, GSK-LSD1, or palbociclib for 7 days, n = 3 biological independent replicates. Data are presented as mean values + SD (p-value < 0.001, two-way ANOVA). Uncropped images for g are available as source data.
Patients harbouring TP53 mutations who are treated with chemotherapy and received hormone therapy have poorer prognosis compared to patients treated with only chemotherapy27. Around 30% of patients treated with hormone therapy develop resistance and relapse, therefore, we sought to determine if CoREST is a key determinant of endocrine resistance in ER+/TP53mut breast cancer. To this end, we first generated ER+/TP53mut breast cancer cells resistant to the SERM tamoxifen (TamR), and the SERD fulvestrant (FulR), as previously described28-30. To our knowledge, ER+/TP53mut breast cancer cells cultured in long-term estrogen deprivation conditions (hereafter referred to as LTED), which mimic AI treatment, have not been fully characterized31,32. Thus, we cultured the ER+/TP53mut T47D cell line for over a year in LTED conditions and monitored changes in transcriptome, morphology, and cell surface markers CD24 (luminal)33 and CD44 (basal-like)34,35. These cells progressively acquired basal-like morphological features and CD44 expression over time. After 5–6 months, two distinct CD44+ and CD24+ populations emerged and, after 9 months, all cells were CD44+ and remained CD44+ for over a year (Fig. 1d and Extended Data Fig. 1b-c). The timing of this transition from CD24+/CD44- to CD24-/CD44+ was only observed in T47D-LTED but not in TamR and FulR T47D cells (Extended Data Fig. 1d). To determine if endocrine resistant ER+/TP53wt cells can also undergo reprogramming, we generated LTED, TamR, and FulR MCF7 cells. Notably, we only observed partial reprogramming of MCF7-LTED (Extended Data Fig. 1e), suggesting that TP53 status influences breast cancer cell plasticity. Importantly, T47D-LTED cells gradually acquired tamoxifen and fulvestrant resistance and proliferated significantly faster than parental T47D cultured under normal conditions which contain estrogen (full media, FM) (Extended Data Fig. 1f). During the transition to endocrine resistance, 3,984 and 3,206 genes were upregulated and downregulated, respectively, with the most profound expression changes after 6 months (Fig. 1e, Extended Data Fig. 1g and Supplementary Table 1). Gene set enrichment analysis (GSEA) revealed that T47D in LTED for 6–8 months upregulated signatures indicative of a more aggressive breast cancer phenotype including basal breast cancer and HRAS oncogenic pathways, and downregulated ERα transcriptional programs (Fig. 1f and Extended Data Fig. 1h). These results suggested a phenotypic switch from luminal to basal-like, similar to what can be observed clinically during acquisition of resistance. Western blotting (WB) confirmed hyperactivation of the MAPK pathway and epithelial-to-mesenchymal transition (EMT) after 5–6 months in LTED. Notably, ERα expression was not detected after 7 months (Fig. 1g). Furthermore, single-cell single-nucleotide variant (SNV) analysis revealed novel mutations in BRAF (G464V) and KRAS (G13D) following 6 months of LTED (Extended Data Fig. 1i), with complete loss of ESR1 and PGR transcription by 9 months (Extended Data Fig. 1j). We then queried whether ESR1 was silenced by epigenetic mechanisms by treating cells with inhibitors of PRC2, G9A/GLP, HDACs, and DNMTs (Extended Data Fig. 2a-d). We did not detect reactivation of ESR1, suggesting that ERα loss was not due to epigenetic silencing. Using a temporal model system, we hypothesized a dynamic evolution of endocrine resistance in vitro that emerges at ~6 months after estrogen deprivation with acquisition of BRAF and KRAS mutations, followed by establishment of a basal-like ER-/CD44+ phenotype (Fig. 1h). This model of resistance demonstrates the plasticity of breast cancer cells from a primed to a resistant state by undergoing full cellular reprogramming.
As expected, all three T47D endocrine resistant models were resistant to endocrine treatment and relatively sensitive to palbociclib, a CDK4/6 inhibitor used as a clinical standard of care for breast cancer (Fig. 1i). We then determined whether chemical inhibition of LSD1 or CoREST would impair proliferation. The irreversible compounds inhibiting LSD1 enzymatic activity such as GSK-LSD136 (an analog of TCP, tranylcypromine), and its analogs MCC2580 and DPP3800337, had no effect on proliferation (Fig. 1i and Extended Data Fig. 2e). However, the CoREST inhibitor, corin, a dual LSD1/HDAC compound shown to be effective in pre-clinical models of melanoma and brain tumors38,39, reduced proliferation of all T47D and MCF7 models (Fig. 1i and Extended Data Fig. 2f), suggesting that survival of endocrine resistant cells depends on CoREST independently of LSD1 activity.
CoREST controls proliferation of endocrine sensitive and resistant cells.
Our LTED model system successfully recapitulated the clinical evolution of resistance from ER+ to ER- in vitro. To confirm that CoREST is a key determinant of both sensitivity and resistance to endocrine therapies, we depleted LSD1 by CRISPR/Cas9 and siRNA mediated knock-down and found that LSD1 deficiency reduced proliferation and cell fitness of parental, primed, and reprogrammed cells (Fig. 2a-b and Extended Data Fig. 3a-f). We observed reduced RCOR1 following LSD1 KO or transient depletion (Extended Data Fig. 3b-d), suggesting that CoREST was disassembled40. Depletion of RCOR1 by shRNA also reduced proliferation of parental and reprogrammed T47D, further confirming that CoREST regulates proliferation of ER+ breast cancer cells (Extended Data Fig. 3g).
Fig. 2: The CoREST complex is essential for endocrine sensitive and resistant breast cancer cell proliferation and survival.
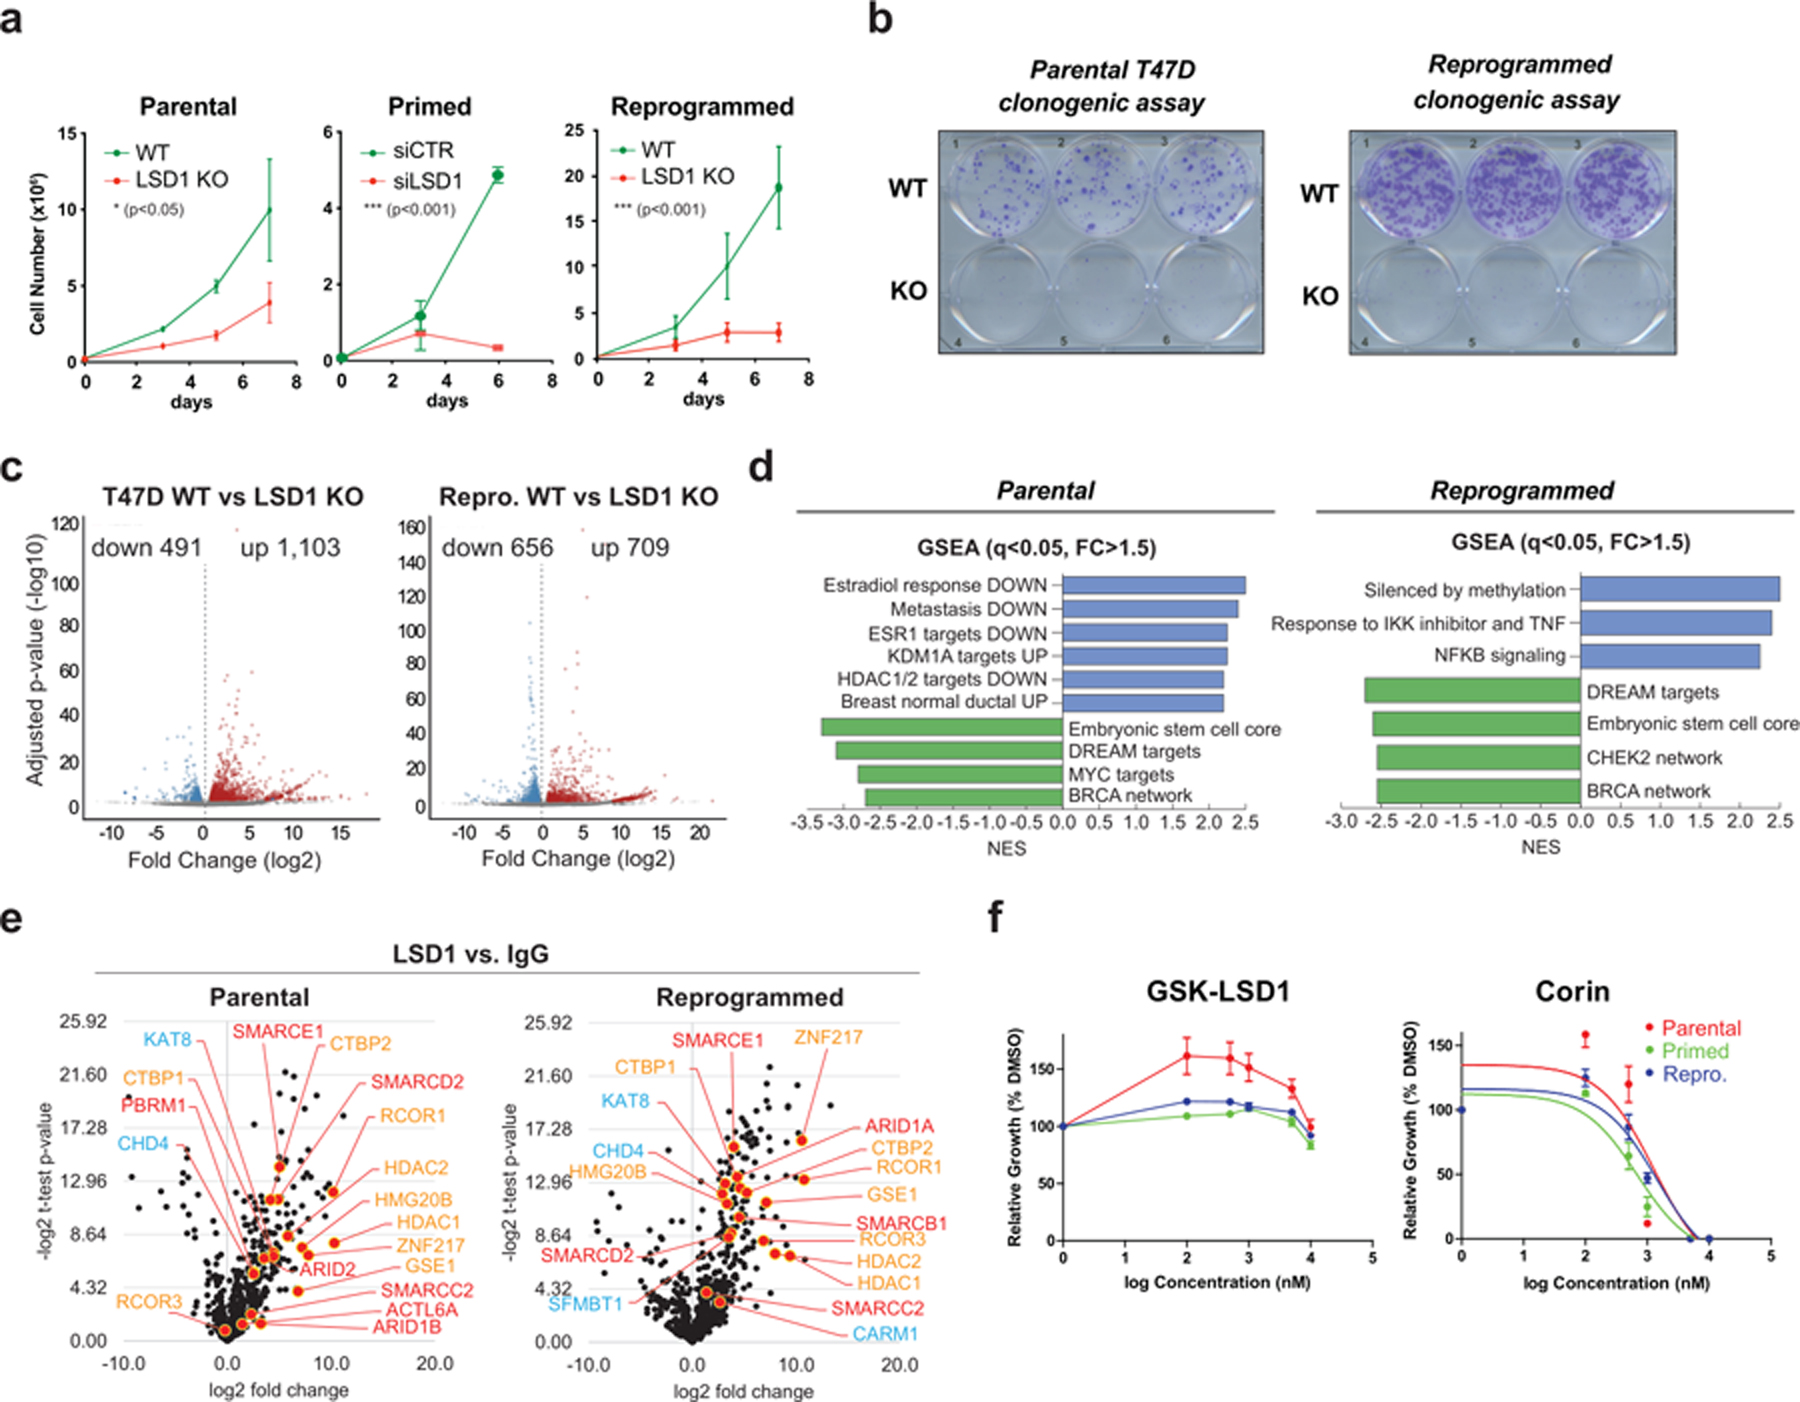
a, Impaired proliferation of parental and reprogrammed LSD1 KO and primed siLSD1 T47D, n = 3. n = 3 biological independent replicates. Data are presented as mean values + SEM. Significance determined by two-way ANOVA, p-value < 0.05. b, Clonogenic assay of parental and reprogrammed LSD1 KO cells. c, Volcano plots of DEGs (FC > 1.5, adjusted p-value < 0.05). d, GSEA suggests a downregulation of metastatic potential and estrogen response following LSD1 loss. e, Significant LSD1 interactions assayed by endogenous immunoprecipitation followed by LC-MS/MS (orange = LSD1/CoREST subunits, blue = other known LSD1 interactors, red = BAF subunits), n = 3 biological independent replicates. f, GSK-LSD1 and corin IC50 curves, n = 3 biological independent replicates. GSK-LSD1 exhibited no inhibitory activity. Corin IC50 values: parental = 1.191µM, primed = 0.6877µM, reprogrammed = 1.071µM. Data are presented as mean values + SEM.
We then profiled the gene expression changes following LSD1 KO. Notably, LSD1 loss resulted in 1,594 and 1,365 differentially expressed genes (DEGs) in parental and reprogrammed T47D, respectively (Fig. 2c and Supplementary Table 2). As expected, there was low overlap of DEGs across cellular states (Extended Data Fig. 3h), indicating that LSD1 regulates specific transcriptional programs in sensitive and resistant cells. Indeed, GSEA confirmed that estrogen signaling, and metastasis signatures were downregulated and LSD1 targets were upregulated following LSD1 KO in parental cells. The embryonic stem cell core signature was also downregulated in reprogrammed cells (Fig. 2d), suggesting a role of LSD1 in breast cancer progression. Overall, these results suggest that CoREST loss reduces the proliferative and tumorigenic potential of both endocrine sensitive and resistant breast cancer cells by discrete mechanisms.
We then assayed the LSD1 endogenous protein interactome by liquid chromatography with tandem mass spectrometry (LC-MS/MS) and found that LSD1 interacted with all other known CoREST subunits as well as with other previously reported LSD1-interacting proteins in parental, primed, and reprogrammed T47D (Fig. 2e, Extended Data Fig. 3i and Supplementary Table 3)41-43. Surprisingly, we also found several members of the SWI/SNF (BAF) complex associated with LSD1 (Fig. 2e, red and Extended Data Fig. 3j-k), a finding further confirmed by gel filtration and co-immunoprecipitation assays (Extended Data Fig. 4a-c). This association between CoREST and BAF does not appear to be mediated by DNA (Extended Data Fig. 4d). Importantly, parental, primed, and reprogrammed cells were all sensitive to corin with an IC50 ~1µM. As expected, these cells were completely resistant to GSK-LSD1 (Fig. 2f and Extended Data Fig. 4e) and sensitive to the class I HDACs inhibitors TSA and SAHA (Extended Data Fig. 4f). Notably, LSD1 KO cell further reduced cell proliferation when treated with TSA and SAHA (Extended Data Fig. 4g), suggesting other HDAC-containing multiprotein complexes (e.g., NuRD, MiDAC) may play significant functions regulating cell proliferation. To assess the role of corin in other endocrine resistant models we performed synergy assays using increasing concentrations of corin and either tamoxifen or fulvestrant. Both drug combinations had a synergistic effect in parental T47D and an additive effect in T47D TamR cells (Extended Data Fig. 4h-i).
Both parental and reprogrammed T47D treated with corin exhibited a clear decrease in S phase (Extended Data Fig. 5a) that was not due increased genomic instability, assessed by γH2AX staining (Extended Data Fig. 5b-d). In parental cells, LSD1 depletion or corin treatment increased expression of β-galactosidase whereas in reprogrammed cells, there was increased cell death via apoptosis (Extended Data Fig. 5e-f). These differential cellular responses between parental and reprogrammed cells are, at least in part, likely due to the loss of CDKN2A in reprogrammed cells (Extended Data Fig. 5g). We also found that the CoREST complex is disassembled by corin, resulting in LSD1 and RCOR1 chromatin displacement after 24h, and degradation after 5 days of treatment, concomitantly with reduced ERα levels in parental cells (Extended Data Fig. 5h-j).
CoREST chromatin binding dynamics.
The CoREST target genes in sensitive and resistant breast cancer are unknown. To address this, we first performed LSD1 ChIP-seq in parental and reprogrammed T47D cells. We found that LSD1 binding is highly dynamic and reprogrammed cells have discrete LSD1 binding sites. LSD1 ChIP-seq peaks in both cells were mainly located at intergenic regions (Fig. 3a, Extended Data Fig. 6a-c and Supplementary Table 4). Transcription factor binding site (TFBS) analysis revealed a predominant FOXA1 binding motif at LSD1 peaks in parental cells that changed to AP-1 motifs (cJUN, FOS) during reprogramming, suggesting an LSD1 functional switch during evolution to an endocrine resistant state (Fig. 3a-b). Indeed, we observed loss of FOXA1 with concomitant increase in cJUN expression in the reprogrammed cells (Fig. 3c). Furthermore, cJUN and FOXA1 ChIP-seq confirmed their specific expression profiles, with only 427 cJUN ChIP peaks in parental and no FOXA1 ChIP-seq signal in reprogrammed cells (Fig. 3d-e).
Fig. 3: CoREST chromatin dynamics during resistance evolution and functional switch from FOXA1/ERα to cJUN in reprogrammed cells.
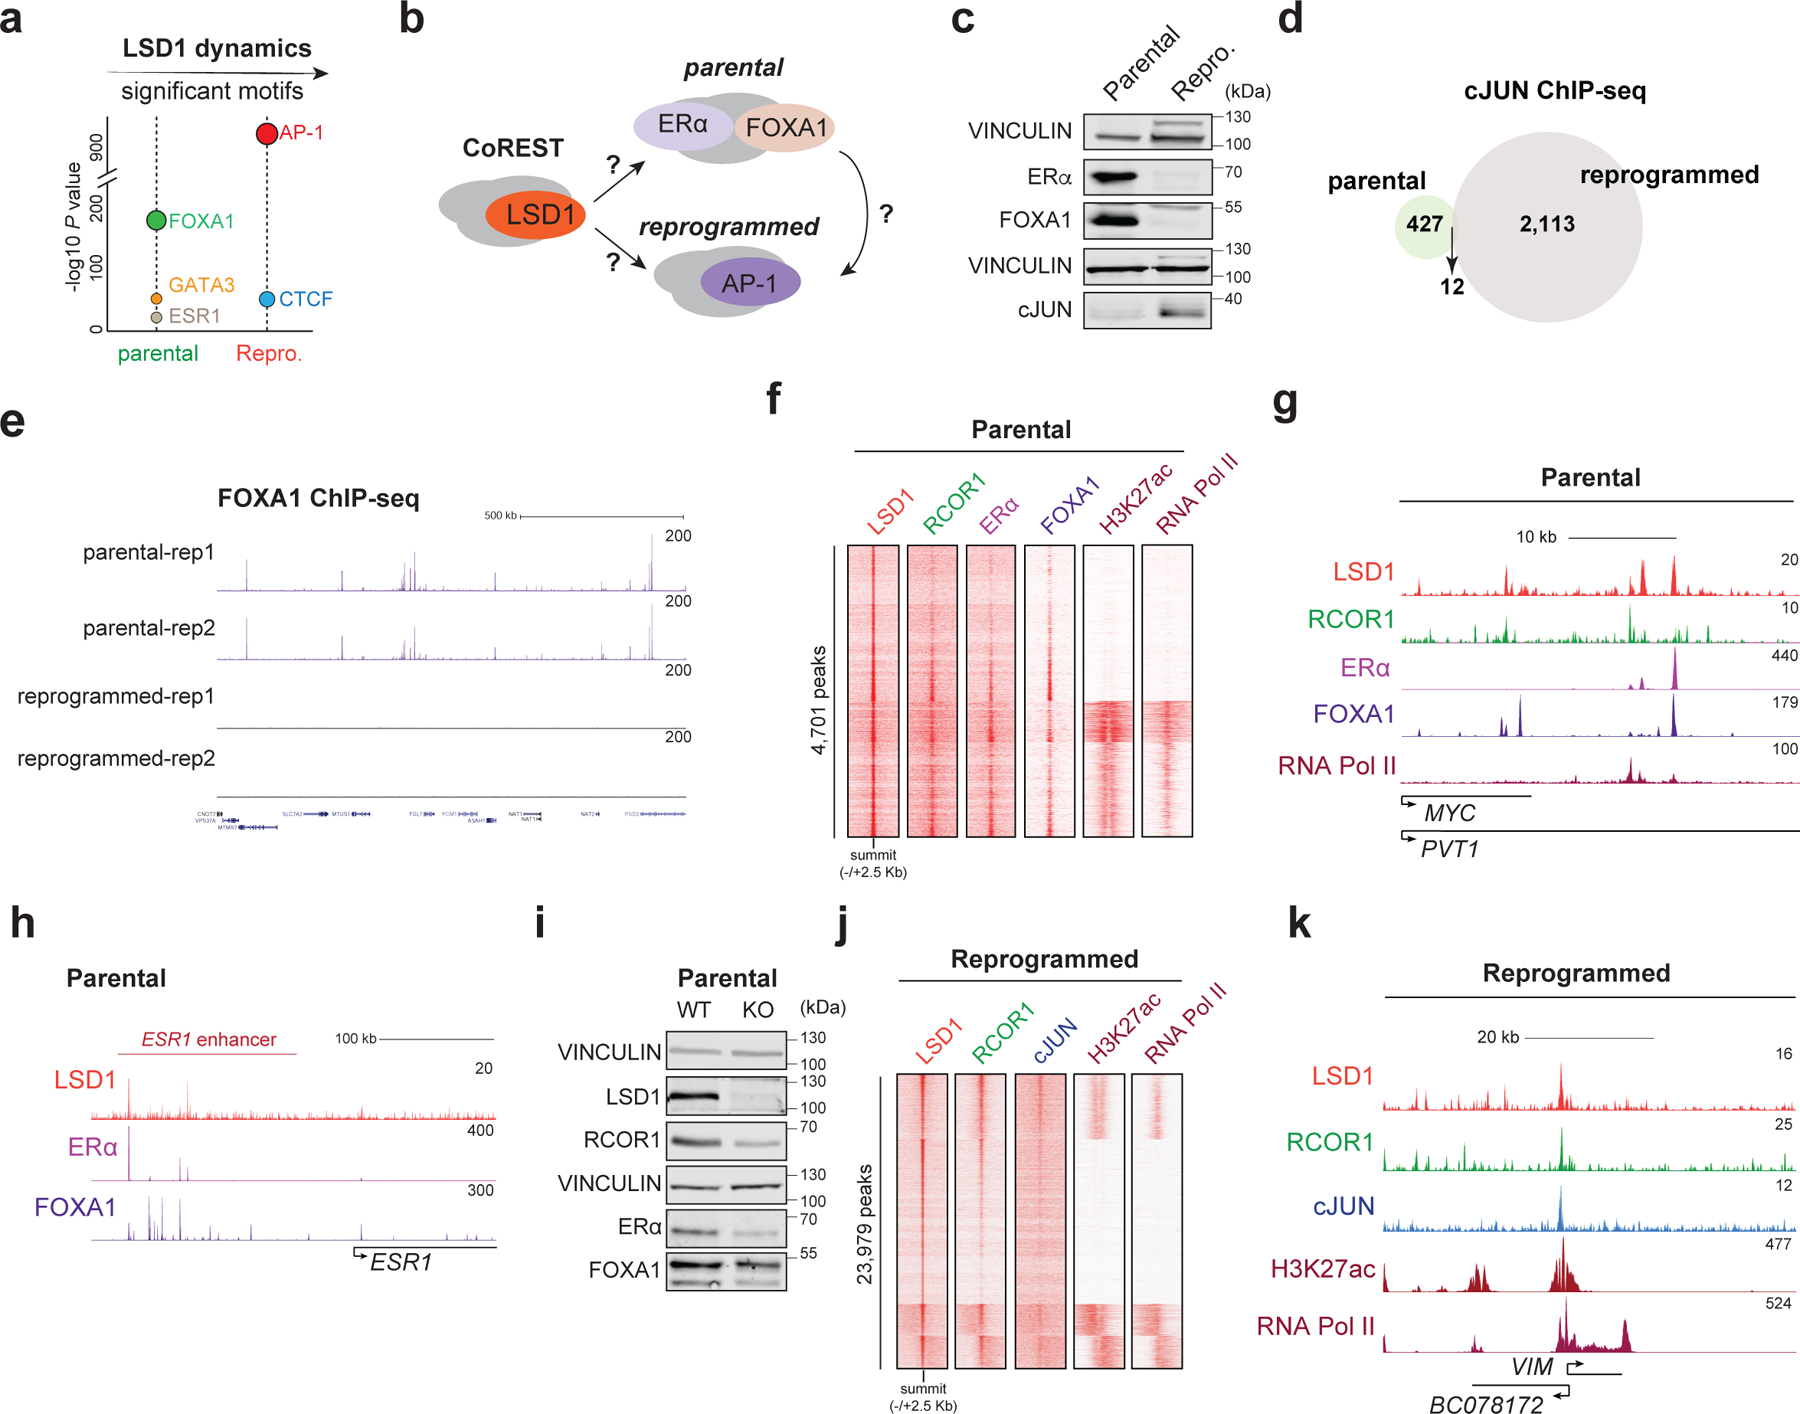
a, Enriched TF motifs at LSD1 peaks in parental and reprogrammed cells. b, Model of a functional CoREST switch in sensitive and resistant cells. c, WB of parental and reprogrammed whole cell lysates for the proteins indicated with VINCULIN as a loading control. d, Overlap of cJUN targets (common between replicates) in parental and reprogrammed T47D, n = 2. e, FOXA1 ChIP-seq signal in parental and reprogrammed cells, n = 2. f-g, LSD1, RCOR1, ERα, FOXA1, H3K27ac, and RNA Pol II ChIP-seq heatmap (4,701 total peaks) (f) and signal at the MYC enhancer (g) in parental T47D. h, ChIP-seq signal of LSD1, ERα, and FOXA1 at the ESR1 enhancer in parental T47D. i, WB of proteins indicated, with VINCULIN as the loading control, in WT and LSD1 KO parental cells. j-k, LSD1, RCOR1, cJUN, H3K27ac, and RNA Pol II ChIP-seq signal (23,979 total peaks) (j) and at the VIM promoter (k) in reprogrammed cells. Uncropped images for c and i are available as source data.
In parental and reprogrammed cells, RCOR1 was recruited to ~85% of LSD1 sites, further indicating that LSD1 at chromatin associated with the CoREST complex. Notably, CoREST (defined by LSD1 and RCOR1 co-occupancy) was co-recruited to ERα/FOXA1 co-bound regions and to cJUN sites in parental and reprogrammed cells, respectively (Fig. 3f-i and Extended Data Fig. 6e-f). Interestingly, in parental cells, LSD1 was recruited to the enhancer that regulates ESR1 (Fig. 3h), an ERα protein levels were reduced upon LSD1 loss (Fig. 3i), indicating that LSD1 regulates the estrogen pathway and further supporting the gene expression signature in LSD1 KO parental T47D cells and the effect of corin in parental cells (Fig. 2d and Extended Data Fig. 5h-j). CoREST was recruited to active sites containing RNA-Pol II and H3K27ac in addition to repressed regions (Fig. 3f, 3j and Extended Data Fig. 6e-f), suggesting that CoREST might positively and negatively regulate gene transcription.
To determine if the LSD1 redeployment from ERα/FOXA1 sites to AP-1 sites was due to the loss of ERα in the reprogrammed cells, we used an isogenic T47D line with heterozygous Y537S mutation at ESR1 (T47D-ERαY537S) generated by CRISPS/Cas944 and found in ~20% of patients with endocrine resistant breast cancer. As expected, T47D-ERαY537S cells continued to proliferate in the presence of tamoxifen and have a more profound metastatic phenotype in vivo than parental cells (Extended Data Fig. 7a-b). In this model, LSD1 still interacted with other CoREST subunits (Extended Data Fig. 7c) and cells were resistant to GSK-LSD1 but sensitive to corin. Also, similarly to parental and TamR 47D cells, corin synergized with tamoxifen and fulvestrant (Extended Data Fig. 7d-e). Finally, ChIP-seq revealed that LSD1 still binds to ERα/FOXA1 co-bound sites, and loss of ERα/FOXA1 binding regulates LSD1 recruitment (Extended Data Fig. 7f).
LSD1 activity is not required for cell proliferation and H3K4me2 demethylation.
So far, our results suggest that 1) the scaffolding function of LSD1, not its enzymatic activity, is essential for proliferation and, 2) LSD1 loss may not result in global accumulation of H3K4me2. To test these hypotheses, we first assessed global H3K4me1/2 levels in WT and KO parental and reprogrammed histones and did not detect major changes (Fig. 4a). LC-MS/MS in these samples and H3K4me2 ChIP-seq from WT and KO cells further confirmed that H3K4me2 levels remained largely unaffected upon LSD1 loss (Fig. 4b-d). Indeed, LSD1 was recruited to sites with high levels of H3K4me2 and consequently only ~2% of sites gained H3K4me2 upon LSD1 loss, and only 152 of 5,159 CoREST targets accumulated H3K4me2 (Fig. 4f-g). Surprisingly, LSD1 loss resulted in accumulation of low levels of H3K4me2 at sites with no detectable levels of LSD1, suggesting a “hit and run” mechanism of LSD1 that will require further investigation (Fig. 4e). To determine the impact of corin on H3K4me2 and LSD1 targets, we performed RNA-seq and H3K4me2 ChIP-seq in cells treated with 500nM of corin for 72h. ~600 and ~2,000 LSD1 target genes in parental and reprogrammed cells, respectively, were deregulated (FC > 2, adjusted p-value < 0.05) upon corin administration (Extended Data Fig. 7g-h). Comparable to the effects of LSD1 loss on H3K4me2 levels, there were no major changes to H3K4me2 levels at LSD1 targets following corin treatment (Extended Data Fig. 7i) and only ~2% of LSD1 sites decorated with H3K4me2 gained H3K4me2 (Fig. 4h).
Fig. 4: The CoREST oncogenic program is independent of LSD1 enzymatic activity.
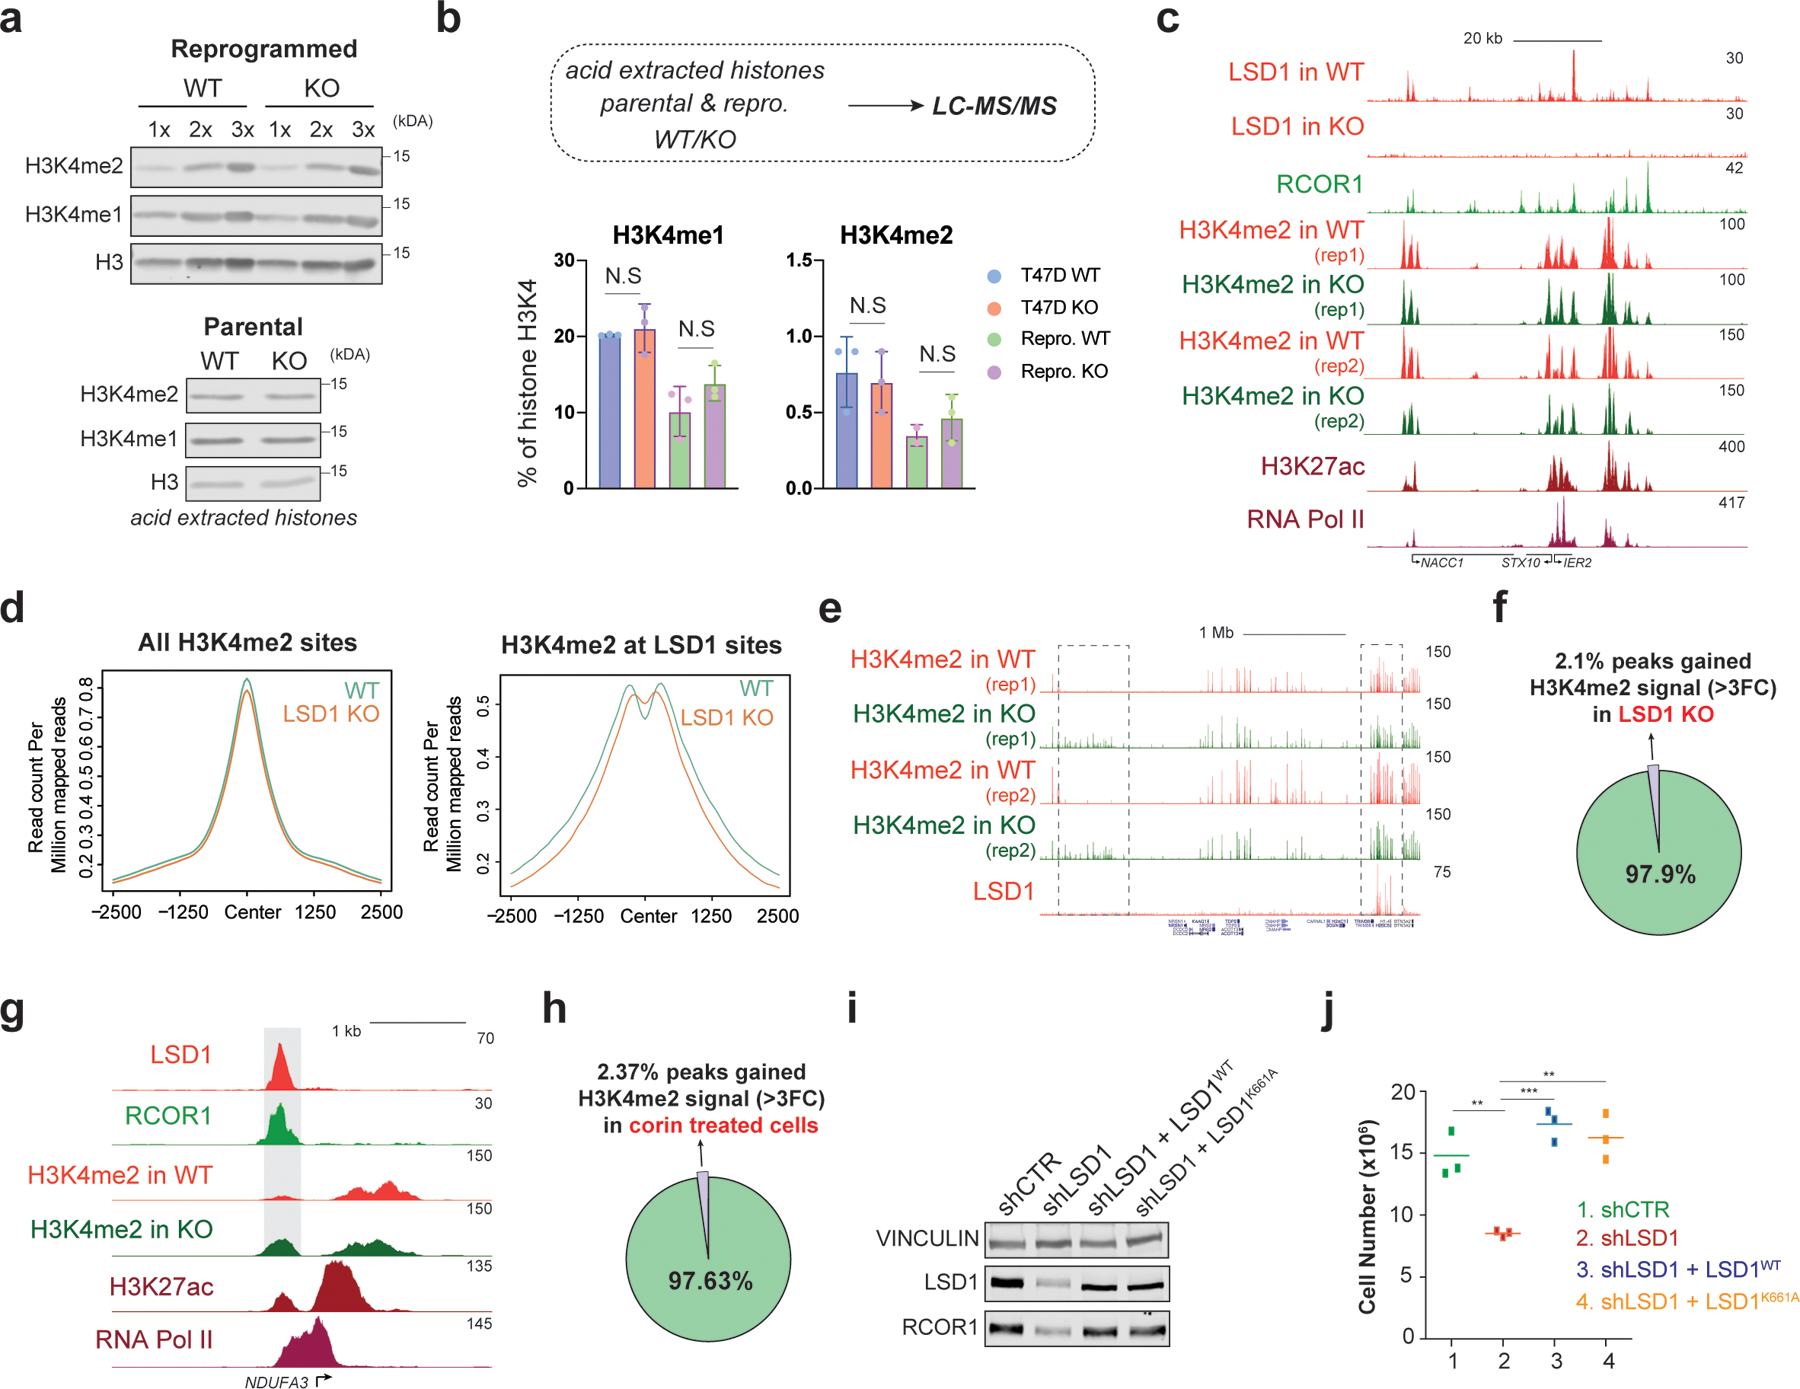
a, H3K4me1/2 WB (loaded in increasing concentrations) of reprogrammed T47D WT and LSD1 KO histone extracts with H3 as a loading control (top) and parental cells (bottom). b, H3K4me1/2 abundance in parental and reprogrammed LSD1 KO T47D by mass spectrometry (N.S., not significant). N = 3 biological independent replicates. Data are presented as mean values + SEM. two-way ANOVA. c, ChIP-seq signal at selected region in reprogrammed cells. d, H3K4me2 ChIP-seq signal at H3K4me2 (left) or LSD1 peaks (right) in reprogrammed WT and LSDI KO T47D. e, H3K4me2 and LSD1 ChIP-seq signal at selected region in WT and LSD1 KO reprogrammed cells. Note that H3K4me2 levels increased at sites without LSD1 (left box) and no changes in H3K4me2 at LSD1 targets (right box). f, Percentage of H3K4me2 peaks that gain signal (>3FC) in reprogrammed T47D following LSD1 KO compared to WT. g, LSD1, RCOR1, H3K4me2, H3K27ac, and RNA-Pol II ChIP-seq signal at the NDUFA3 promoter in reprogrammed cells. Shaded region H3K4me2 signal that is greater in LSD1 KO compared to WT. h, Percentage of H3K4me2 peaks at LSD1 targets that gain signal (>3FC) following 72h of 500nM corin treatment compared to DMSO. i, WB of proteins indicated from cells expressing WT LSD1 (LSD1WT) or a catalytically dead mutant (LSD1K661A). j, Proliferation of shLSD1 cells was restored after expressing either LSD1WT (p-value = 0.0003) or LSD1K661A (p-value = 0.0020), n = 3 biological independent replicates (two-tailed unpaired t-test). Uncropped images for a and i are available as source data.
Although LSD2 can also demethylate H3K4me245,46, global H3K4me2 levels also remained unchanged following LSD2 depletion. Instead, LSD2 depletion following LSD1 KO further reduced FOXA1 and ERα expression in parental T47D (Extended Data Fig. 7j-k), suggesting a functional cooperation between LSD1 and LSD2 in regulating the estrogen pathway. Finally, we determined whether LSD1 enzymatic activity was responsible for the proliferation defect in LSD1 depleted cells by reintroducing WT (LSD1WT) or a catalytically dead (LSD1K661A)37,47 LSD1 in shLSD1 reprogrammed cells. Both WT and mutant LSD1 rescued the proliferative defects (Fig. 4i-j), indicating that LSD1 enzymatic activity is dispensable for proliferation in reprogrammed cells.
A CoREST-cJUN-BAF axis in reprogrammed cells.
Considering the key role of cJUN in breast cancer metastasis48-51 and resistance to hormone therapy52,53, and its co-occupancy with CoREST in reprogrammed cells (Fig. 3), we hypothesized a CoREST-cJUN signaling axis in endocrine resistant cells. cJUN (encoded by JUN) is a CoREST target and is upregulated in reprogrammed cells but unaffected by LSD1 loss (Fig. 5a-b and Extended Data Fig. 8a). In cells lacking LSD1 or treated with corin, however, cJUN chromatin recruitment was abolished (Fig. 5c-e and Extended Data Fig. 8b-d), indicating that CoREST is required for cJUN recruitment. LSD1 levels were not affected upon cJUN depletion (Extended Data Fig. 8e). Notably, while LSD1 recruitment was overall diminished ~50% in cJUN-depleted cells (Fig. 5f and Extended Data Fig. 8f), LSD1 recruitment was completely dependent on cJUN at prominent genes involved in metastasis (Fig. 5g and Extended Data Fig. 8b-c).
Fig. 5: The CoREST-cJUN axis in the reprogrammed cells.
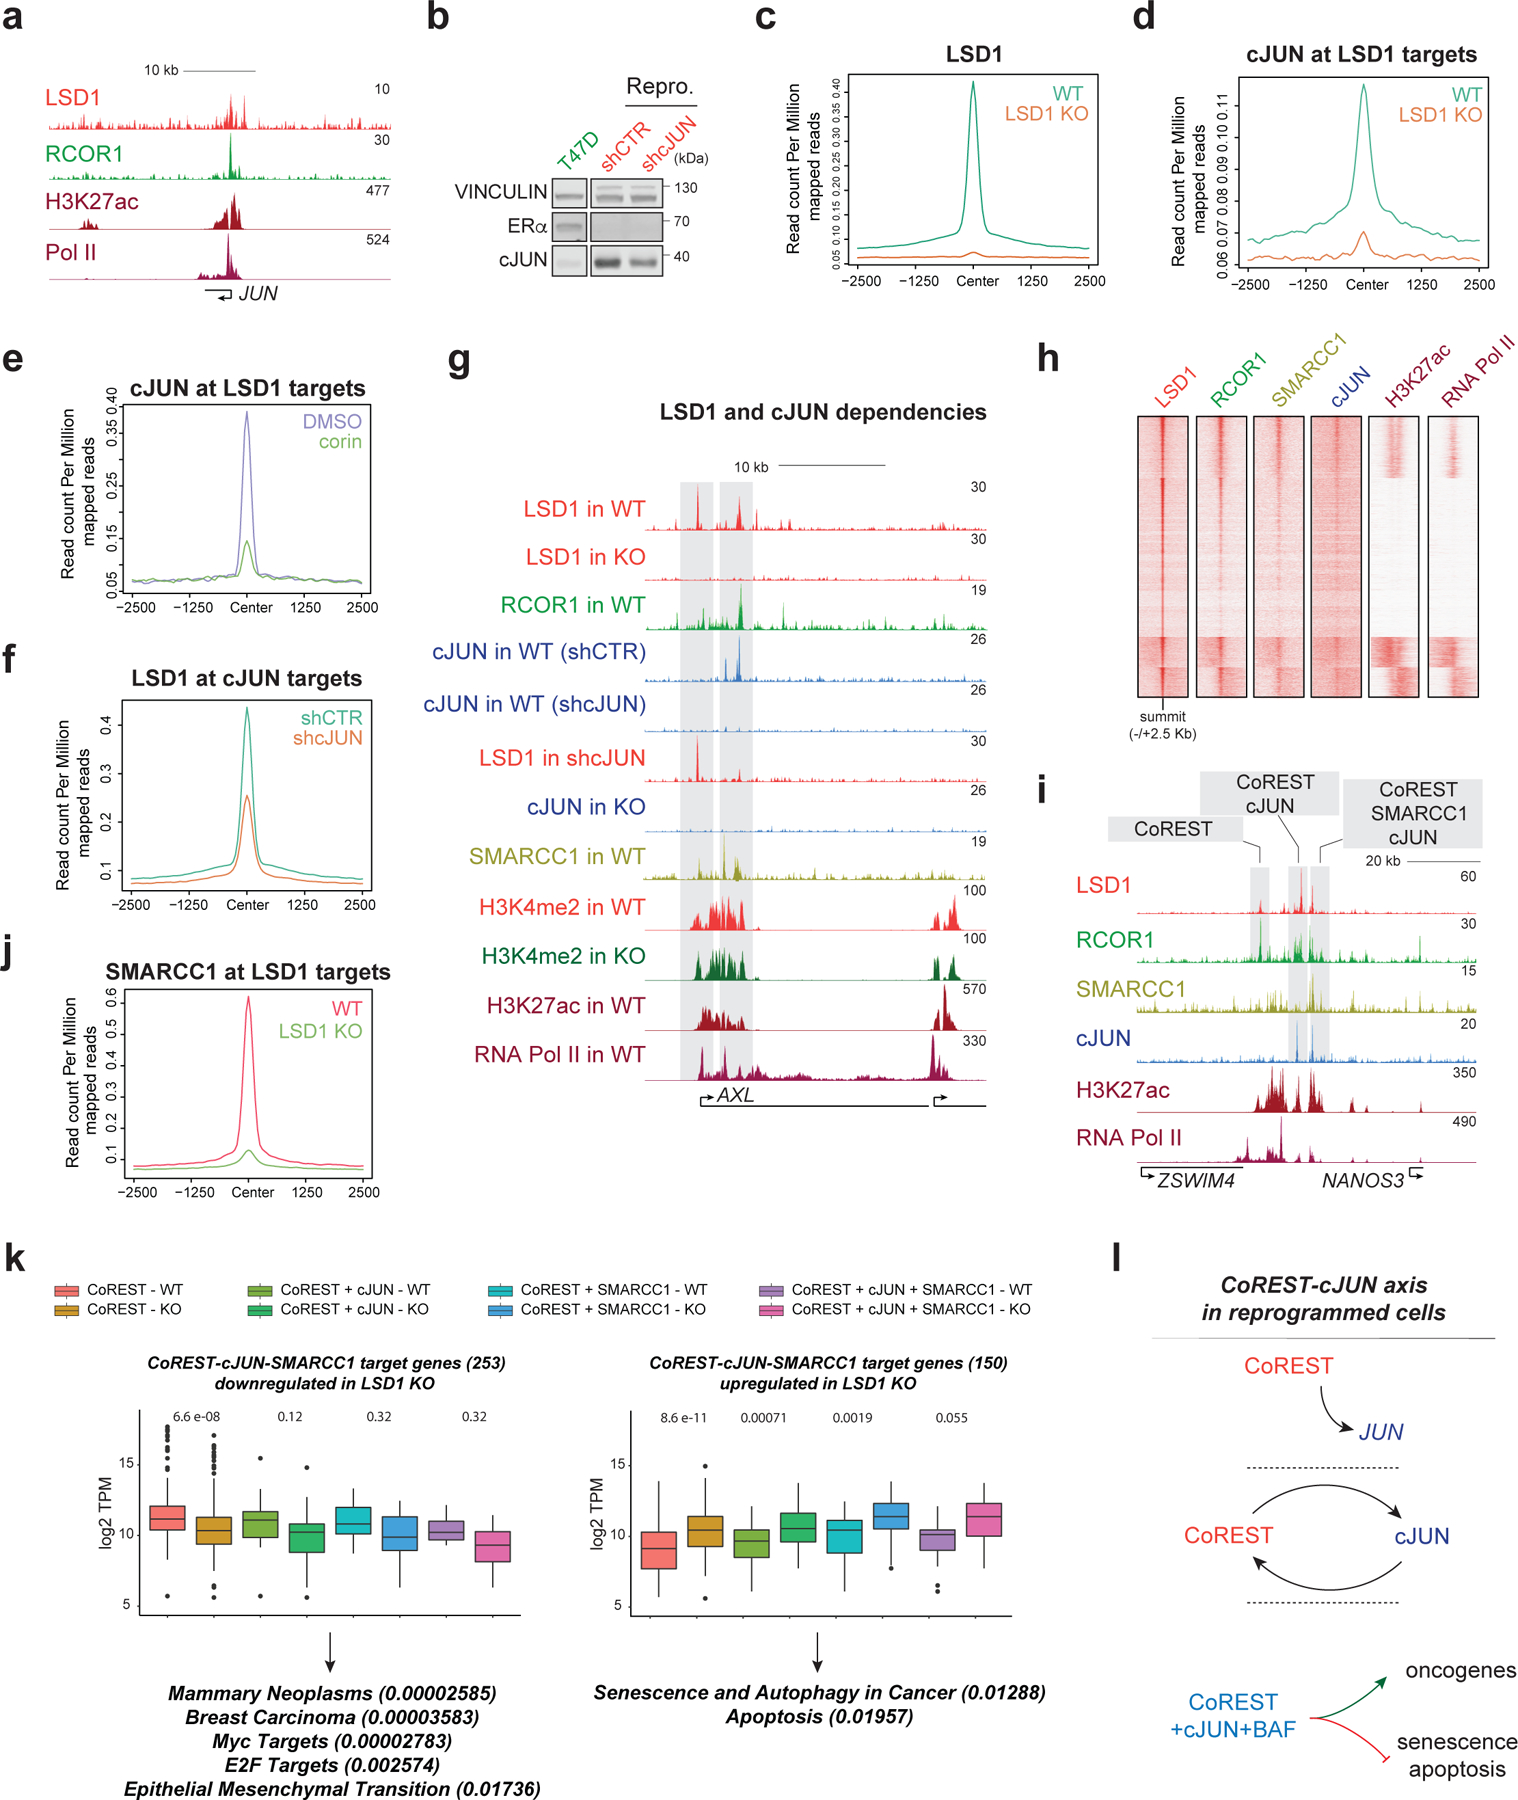
a, LSD1, RCOR1, H3K27ac, and RNA-Pol II ChIP-seq signal at the JUN promoter in reprogrammed cells. b, cJUN WB in parental and reprogrammed shCTR and shcJUN cells. c, LSD1 ChIP-seq signal in reprogrammed WT and LSD1 KO cells. d, cJUN ChIP-seq signal in reprogrammed WT and LSD1 KO cells. e, cJUN ChIP-seq signal at LSD1 targets in reprogrammed cells treated for 72h with 500nM corin. f, LSD1 ChIP-seq signal at cJUN targets in shCTR and shcJUN reprogrammed cells. g, ChIP-seq signal of factors indicated in WT and LSD1 KO reprogrammed cells and in shCTR and shcJUN cells at the AXL gene. h, ChIP-seq heatmap of factors indicated (23,979 peaks total) in reprogrammed cells. i, Co-occupancy profiles at the NANOS3 enhancer in reprogrammed cells. j, SMARCC1 ChIP-seq signal in reprogrammed WT and LSD1 KO cells. k, Downregulated (left) or upregulated (right) expression of CoREST target genes in reprogrammed WT and LSD1 KO cells. n=2 biologically independent samples. Downregulated genes were involved in EMT and more aggressive phenotypes while upregulated genes were associated with cell death, The box plots span from the 25th to 75th percentiles, the center line shows the median and whiskers show maximum and minimum values, p-values indicated in parentheses (Mann-Whitney two-sided test). l, Schematic of the CoREST-cJUN axis in reprogrammed cells. CoREST binds to the JUN promoter (top), CoREST-cJUN are recruited to chromatin in a co-dependent manner (middle), and CoREST-cJUN cooperate to activate genes (bottom). Uncropped images for b are available as source data.
In agreement with the overexpression of CoREST and SWI/SNF in ER-/TP53mut tumors (Fig. 1) and their physical interaction (Fig. 2), SMARCC1 co-occupied ~50% of transcriptionally active CoREST and cJUN co-targets (Fig. 5g-h). Moreover, we identified four types of co-occupancy profiles: CoREST only, CoREST + cJUN, CoREST + SMARCC1, and CoREST + cJUN + SMARCC1 (Fig. 5i), with the latter located at genes with a higher number of transcripts (Extended Data Fig. 8g), suggesting these genes were more highly expressed than those of other occupancy profiles. Interestingly, SMARCC1 recruitment at LSD1 sites was impaired upon LSD1 loss (Fig. 5j and Extended Data Fig. 8h).
Importantly, this recruitment co-dependency revealed a key role of CoREST, in conjunction with cJUN and SMARCC1, to repress expression of genes associated with senescence, autophagy, and apoptosis pathways while ensuring expression of MYC and E2F targets as well as genes involved in breast cancer progression (Fig. 5k). Similar to our observations for LSD1, cJUN and SMARCC1 loss also resulted in cell proliferation and fitness defects (Extended Data Fig. 8i-k). Since SMARCC1 depletion strongly reduced LSD1 protein levels in reprogrammed cells (Extended Data Fig. 8l), we did not further interrogate the role of the SWI/SNF complex in CoREST recruitment. Altogether, these results indicate that a positive feedback loop exists between CoREST, cJUN, and SWI/SNF in reprogrammed cells (Fig. 5l).
CoREST loss re-wires the chromatin accessibility landscape.
We next sought to determine 1) how the chromatin accessibility landscape is remodeled during reprogramming, the 2) role of CoREST in regulating chromatin accessibility, and 3) the functional interplay between CoREST and BAF (Fig. 6a). ATAC-seq revealed that endocrine resistance resulted in major changes in the chromatin accessibility landscape. Specifically, parental-specific ATAC-seq peaks were identified in regions associated with the estrogen pathway and contained FOXA1 binding motifs. In contrast, reprogrammed-specific peaks were at sites associated with EMT and contained AP-1 binding sites (Fig. 6b). Consistent with the role of CoREST in both gene activation and repression (Fig. 3e and 3g), LSD1 was recruited to both open and closed chromatin in parental and reprogrammed cells (Fig. 6c). TFBS analysis revealed co-localization of LSD1 with FOXA1 in parental cells (Fig. 6c, top), while in reprogrammed cells, LSD1 sites at open chromatin were enriched for AP-1 motifs and for the REST cognate sequence at closed chromatin (Fig. 6c, bottom).
Fig. 6: Chromatin accessibility is regulated by CoREST.
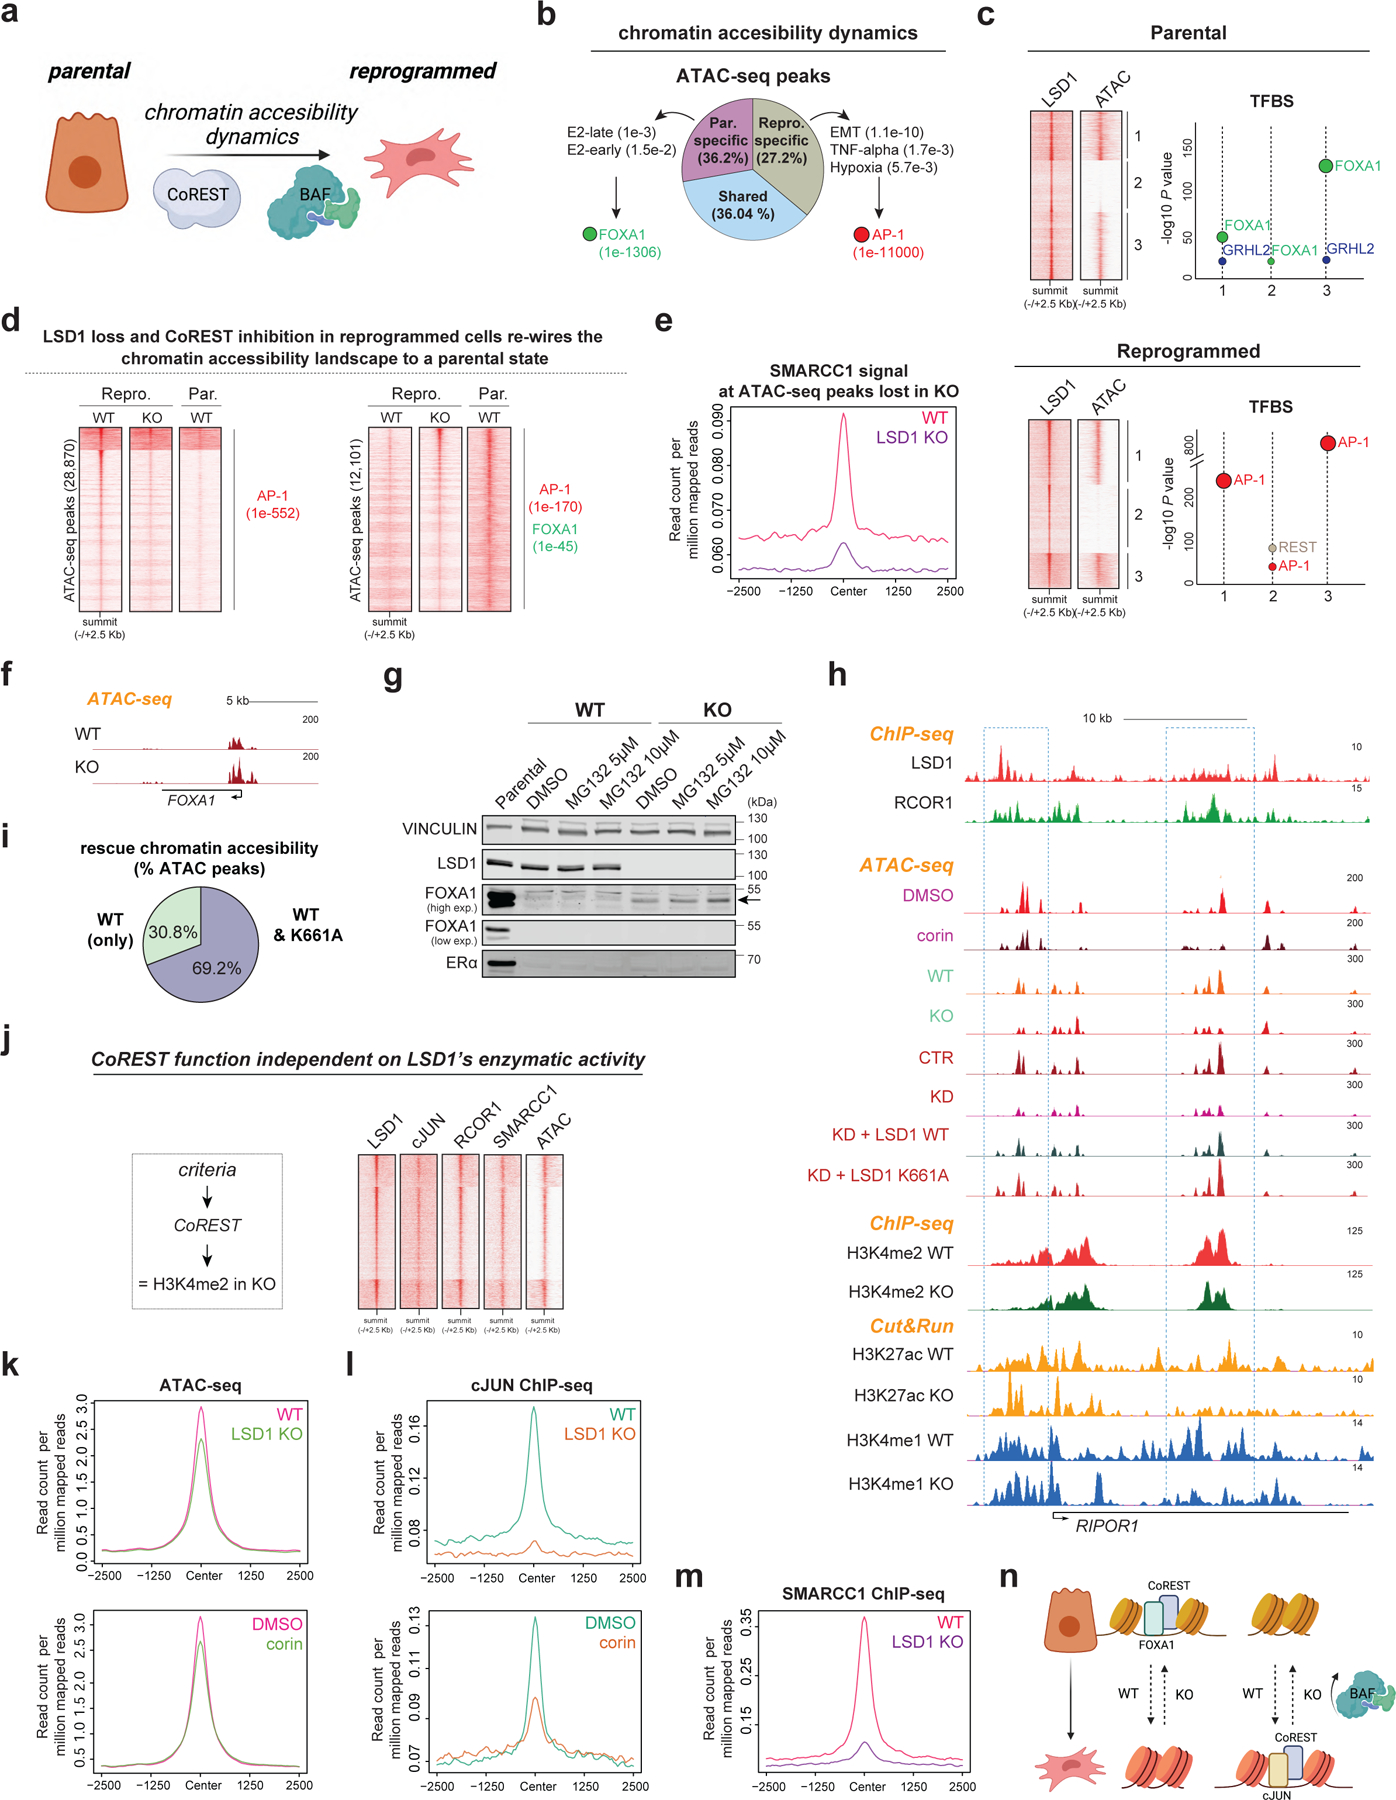
a, Hypothesis. b, Percentage of common and specific ATAC-seq peaks in parental and reprogrammed T47D as well as GO analysis and enriched TF motifs of these peaks, p-values indicated in parentheses. E2, estrogen. c, LSD1 ChIP-seq and ATAC-seq signal at LSD1 binding sites (left) in parental cells and reprogrammed cells. Enriched TF motifs from LSD1 peaks in each cluster (right). d, ATAC-seq peaks in parental WT, LSD1 KO, and corin treated T47D. TF motifs of these peaks and p-values are indicated in parentheses. Homer motif analysis software utilizes cumulative binomial distribution statistics for motif enrichment. e, SMARCC1 ChIP-seq signal at ATAC-seq sites lost in LSD1 KO reprogrammed cells. f, ATAC-seq profile at FOXA1 locus in WT and LSD1 KO reprogrammed T47D. g, WB of parental, WT, and LSD1 KO reprogrammed T47D treated with MG132 for 72h. h, ChIP-seq, CUT&RUN, and ATAC-seq of factors indicated in reprogrammed WT and LSD1 KO T47D at RIPOR1. i, Percentage of ATAC-seq peaks rescued by LSD1WT only or both LSD1WT and LSD1K661A. j, LSD1, RCOR1, cJUN, and SMARCC1 ChIP-seq and ATAC-seq signal at sites with no changes in H3K4me2 levels. k-l, ATAC-seq signal (k) and cJUN ChIP-seq signal (l) at sites from (j) in reprogrammed WT, LSD1 KO and corin treated reprogrammed cells (72h). m, SMARCC1 ChIP-seq signal at sites from (j). n, Proposed model. Uncropped images for g are available as source data.
Notably, LSD1 loss resulted ~25% and ~35% altered ATAC-seq peaks in parental and reprogrammed cells, respectively, and corin treatment also extensively remodeled the chromatin accessibility landscape (Extended Data Fig. 9a-b). We then asked if LSD1 loss re-wired the chromatin landscape in reprogrammed cells towards a more endocrine sensitive-like chromatin state. Indeed, 28,870 sites that became inaccessible following LSD1 KO were also inaccessible in sensitive cells, contained AP-1 binding sites and SMARCC1 recruitment was impaired (Fig. 6d-e and Extended Data Fig. 9c). Moreover, more than 12,000 sites became accessible following LSD1 loss and were also found to be accessible in sensitive cells that contained FOXA1 binding motifs (Fig. 6d). Corin treatment also resulted in chromatin opening at FOXA1 sites accessible upon LSD1 loss (Extended Data Fig. 9d).
Analysis of the chromatin accessibility profile at the FOXA1 locus by ATAC-seq revealed that LSD1 loss resulted in opening of the FOXA1 promoter, and a significant increase in FOXA1 expression (Fig. 6f and Extended Data Fig. 9e). Importantly, we detected FOXA1 in LSD1 KO cells, albeit much less than in parental T47D cells, partially due to its degradation by the proteosome (Fig. 6g). Therefore, chromatin opening at sites containing the FOXA1 cognate binding sequence is likely mediated by increased FOXA1 expression. FOXA1 and LSD1 are co-recruited to the ESR1 enhancer in parental cells (Extended Data Fig. 9f), and although ESR1 was also significantly transcribed in LSD1 KO reprogrammed cells (Extended Data Fig. 9g), we could not detect ERα by WB (Fig. 6g). Treatment with PRC2i, DNMTi, or anisomycin, a potent activator of stress-activated MAP kinases and p38 MAPK recently demonstrated to re-activate ESR1 in TNBC54, failed to rescue ERα at detectable levels (Extended Data Fig. 9h-i). Thus, LSD1 KO cells remained unsensitive to endocrine therapies (Extended Data Fig. 9j).
To determine whether the enzymatic activity of LSD1 was required for chromatin accessibility, we performed ATAC-seq in reprogrammed cells expressing either LSD1WT or the catalytically dead mutant LSD1K661A in shCTR and shLSD1 cells, and in WT and LSD1 KO cells. At sites decorated with CoREST, LSD1 loss resulted in chromatin compaction independently of LSD1 enzymatic activity. Both LSD1 KO and KD cells exhibited reduced chromatin accessibility which was generally rescued upon expression of both WT and mutant LSD1 transgenes, without changes in H3K4me2. About 70% of ATAC-seq sites rescued by LSD1WT were also rescued by LSD1K661A (Fig. 6h-i). Sites at which H3K4me2 levels were not altered upon LSD1 loss that contained CoREST also contained cJUN and SMARCC1 and were in regions of open chromatin (Fig. 6j). Notably, at these sites, cJUN and SMARCC1 recruitment was completely impaired upon LSD1 loss (Fig. 6k-m and Extended Data Fig. 9j) and corin treatment concomitant with chromatin compaction and reduced H3K27ac and H3K4me1 levels (Fig. 6k-l). Overall, these results indicate inhibition or loss of CoREST rewires the endocrine resistant chromatin landscape to a sensitive-like state and revealed a novel CoREST association with the SWI/SNF complex which is required for cJUN recruitment and chromatin accessibility (Fig. 6n).
CoREST regulates tumorigenesis.
We next assessed the estrogen-independent tumorigenic potential of primed and reprogrammed cells. Intracardiac injection of primed cells confirmed their estrogen-independent metastatic potential (Extended Data Fig. 10a) and revealed, as expected, that primed CD44+ cells were more metastatic and aggressive than primed CD24+ cells, leading to reduced overall survival (Extended Data Fig.10b-e). We then assessed the potential of reprogrammed cells to develop primary tumors and metastases. Reprogrammed WT cells produced larger primary tumors that proliferated in an estrogen-independent manner and metastasized (Fig. 7a-c). LSD1 KO abrogated these effects, resulting in extended overall survival (Fig. 7d). We also tested whether LSD1 plays a role in extravasion and invasion to distal organs. Reprogrammed WT and LSD1 KO cells were intravenously injected in the tail and metastasis was monitored by IVIS. Lung metastases were reduced in the LSD1 KO cohort, suggesting LSD1 has a role in metastasis of endocrine resistant breast cancer cells (Extended Data Fig. 10f). Notably, corin was active in vivo (Extended Data Fig. 10g), and it reduced growth of both parental and reprogrammed primary tumors (Fig. 7e-f) as well as tumors derived from T47D-FulR (Fig. 7g). LSD1 KO tumors and corin treated tumors had reduced Ki67+ staining, indicating proliferation defects (Extended Data Fig. 10h). Since reprogrammed cells do not express ESR1 and have phenotypic characteristics of basal-like breast cancer cells, we next asked whether LSD1 depletion and CoREST inhibition by corin, also affects proliferation potential of triple negative breast cancer (TNBC) cells. MDA-MB-231 cells were sensitive to corin and LSD1 depletion (Extended Data Fig. 10i-l). Altogether, our data demonstrates that sensitive and endocrine therapy resistant ER+ and TNBC breast cancer subtypes are addicted to CoREST. We posit that CoREST inhibition could be a novel therapeutic candidate alone or in combination with the standard of care therapies in breast cancer.
Fig. 7: CoREST promotes breast cancer tumorigenesis.
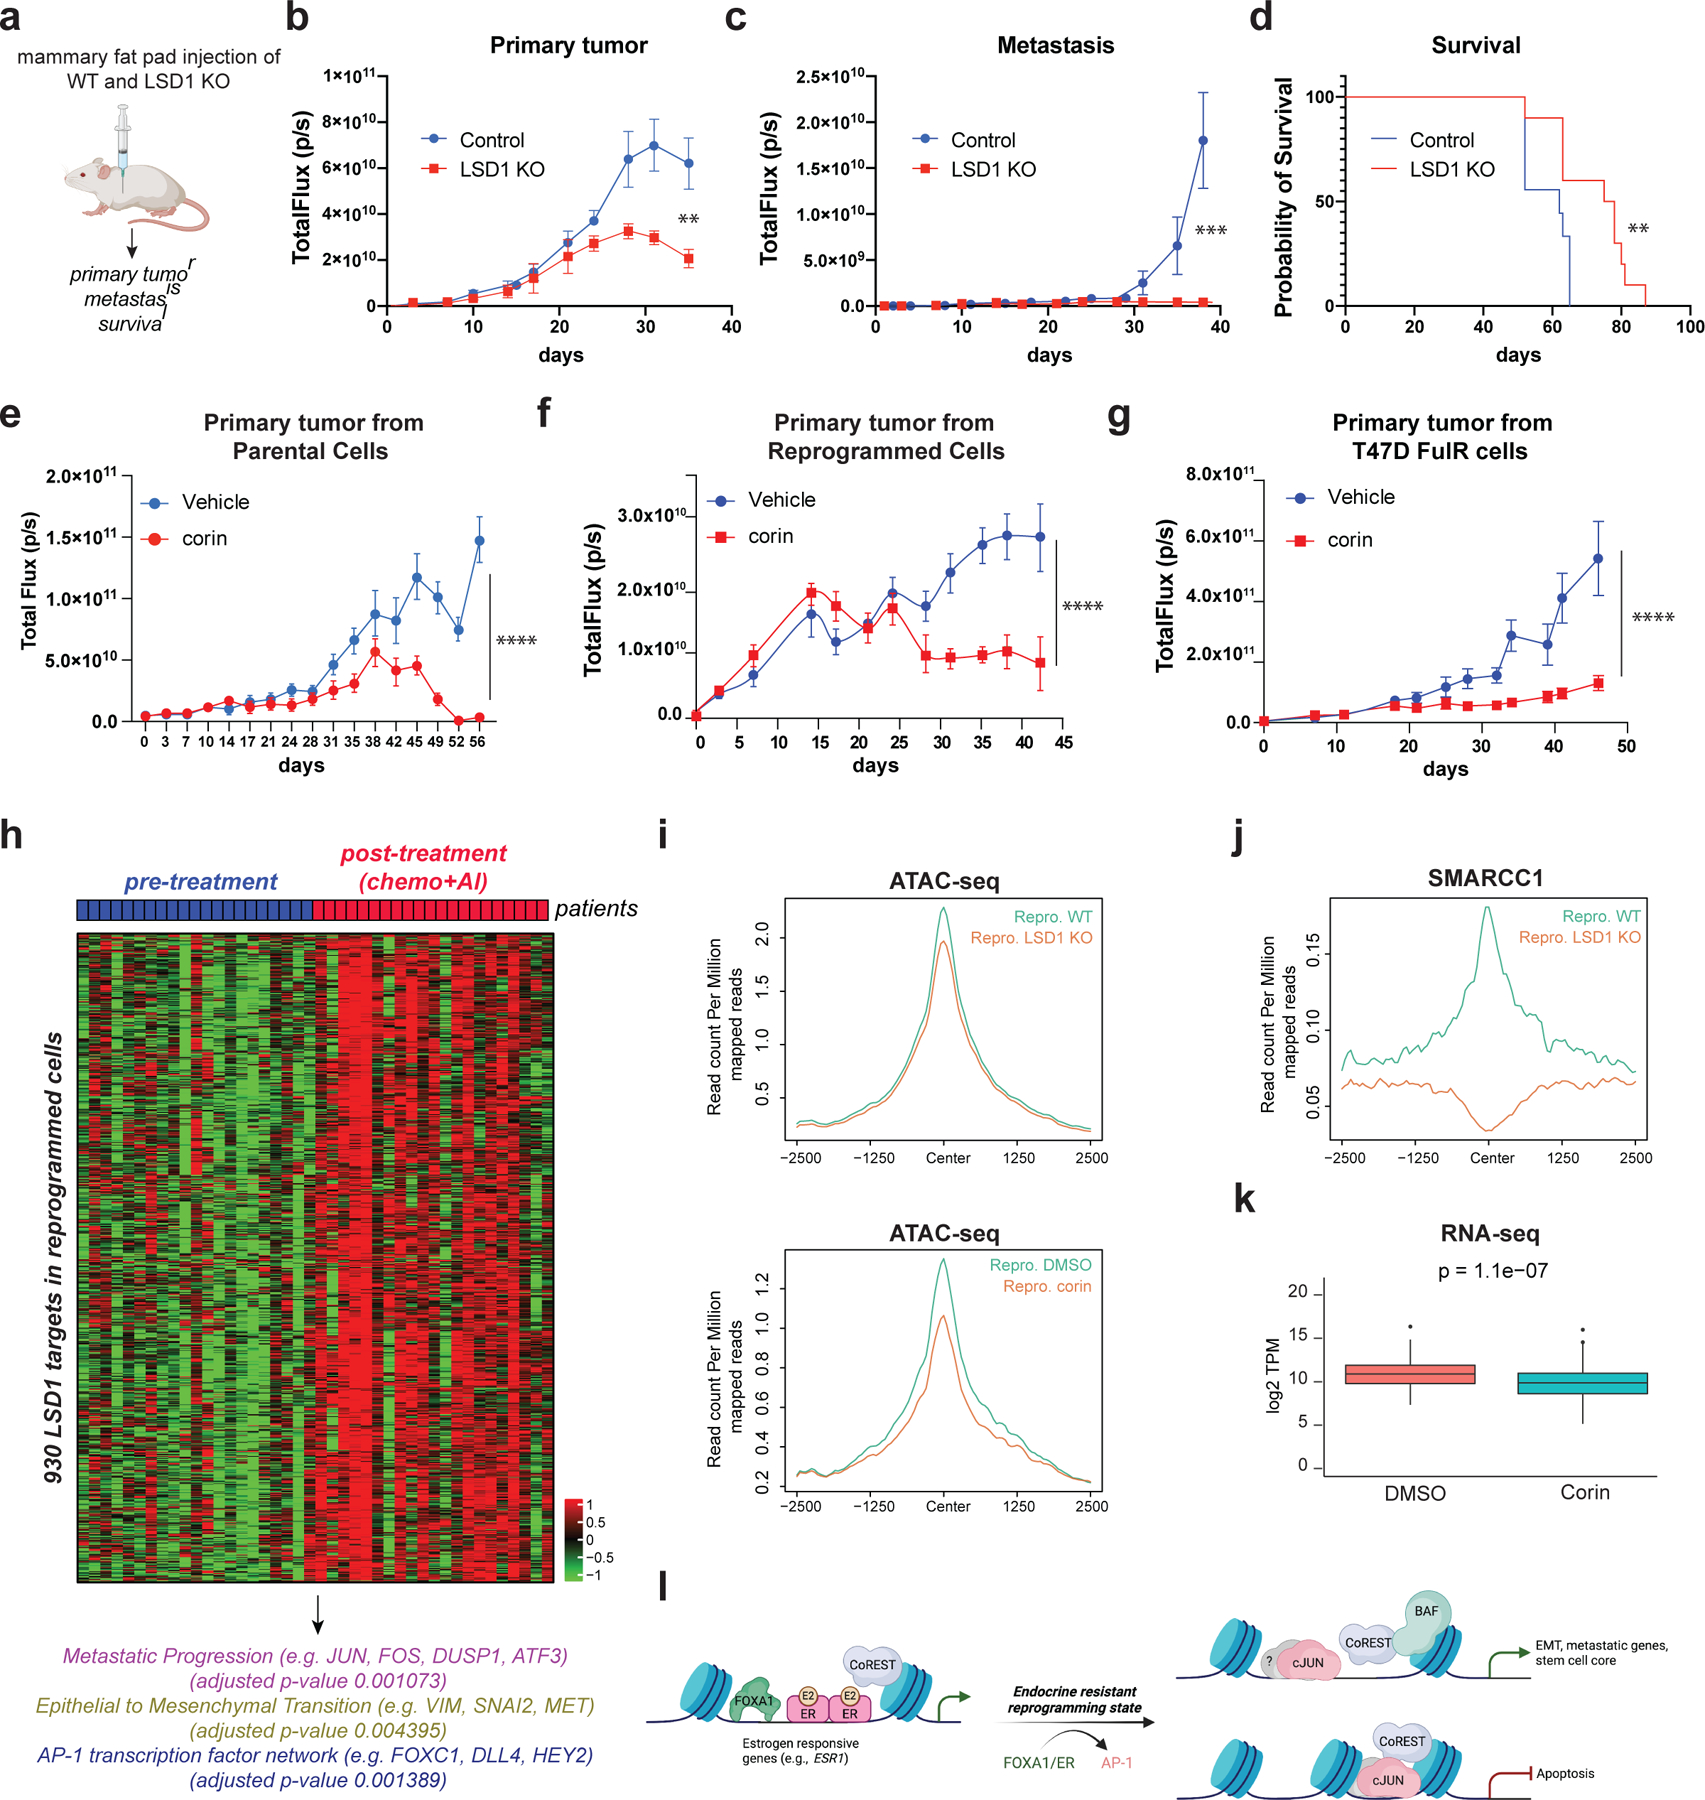
a, Schematic of experimental design (n = 10/group). b-c, Quantification of primary tumors (b) (p-value < 0.005; Two-way RM ANOVA) and metastatic lesions (c), (p-value < 0.001; unpaired two-tailed test). Data are presented as mean values + SD. d, Survival probability (p-value = 0.0082, Log-rank [Mantel-Cox test]). e-g, Quantification of parental (e), reprogrammed (f), and T47D-FulR (g) primary tumors (p-value < 0.001, n = 10/group, Two-way RM ANOVA). Data are presented as mean values + SEM. Mice were treated daily with vehicle or corin (7.5mg/kg). h, RNA-seq heatmap of 930 LSD1 target genes in patients resistant to chemo-endocrine treatment. i, ATAC-seq signal at the 930 LSD1 targets in WT and LSD1 KO reprogrammed T47D, and in reprogrammed cells treated with DMSO or 500nM of corin for 72h. j, SMARCC1 ChIP-seq signal at the 930 LSD1 targets in WT and LSD1 KO reprogrammed T47D. k, Expression of LSD1 targets in reprogrammed T47D treated with 500nM corin for 72h, (p-value = 1.1e-7, t-test, two-sided). The box plots span from the 25th to 75th percentiles, the center line shows the median and whiskers show maximum and minimum values). l, Proposed model.
CoREST gene signature in patients resistant to endocrine therapies.
To gain insights on how CoREST regulates endocrine resistance in patients, we analyzed the gene expression signature of the LSD1 target genes in the reprogrammed cells in a dataset of 21 patients before and after treatment with chemotherapy and the aromatase inhibitor, letrozole, who developed endocrine resistance53. Notably, we found a cluster of 930 LSD1 target genes uniquely upregulated in endocrine resistant tumors (post-treatment) (Fig. 7h and Supplementary Table 5). The promoters of these genes were enriched for AP-1 motifs. Moreover, consistent with the downregulated genes in LSD1 KO reprogrammed cells, the 930 genes were associated with metastasis and EMT (Fig. 7h). Mechanistically, LSD1 loss and corin treatment in the reprogrammed cells resulted in chromatin compaction of these genes (Fig. 7i) and displacement of BAF (Fig. 7j). Importantly, RNA-seq of reprogrammed corin treated cells unveiled a direct function of CoREST in regulating these genes, since their expression was significantly reduced compared to control (Fig. 7k). Overall, these results reveal that endocrine resistant breast cancers are addicted to CoREST which could be therapeutically explored.
Discussion
During development, cell fate determination is orchestrated by environmental cues, signaling pathways, TFs, and epigenetic mechanisms10,55. This exquisite choreography ensures proper cell differentiation and tissue homeostasis. However, these processes become erratic during tumorigenesis. Moreover, cancer treatments induce cellular stress and stimulate de novo genetic mutations and epigenomic rewiring, all of which can contribute to a resistant phenotype5,10. While specific genetic alterations, such as loss of the tumor suppressors RB and TP53, increase the likelihood of cell lineage conversion and resistance56, the mechanisms underlying cell plasticity in response to endocrine therapy remain largely unknown.
Here, we investigated the genetic, epigenetic, and transcriptomic evolution of ER+ breast cancer towards endocrine resistance and identified CoREST as a key determinant of endocrine therapy failure. We propose that during breast cancer cell reprogramming towards an endocrine resistant state, CoREST is dynamically associated with chromatin regulators and specific TFs to regulate cell plasticity and to drive resistance. Our findings are in agreement with the role of FOXA1 in mediating LSD1 recruitment at ERα shared sites to regulate proliferation57. We also uncovered a dual role of CoREST in regulating oncogenic transcriptional circuits during resistance acquisition and maintenance, as CoREST is recruited by the AP-1 family member, cJUN, to drive expression of invasive genes (Fig. 7l). High levels of cJUN are associated with aggressive and metastatic breast cancer and it is also overexpressed in colorectal and lung cancers, among others58-61. Importantly, our results provide the first evidence of a potential regulatory network controlled by CoREST in patients who develop resistance to endocrine therapies. Thus, we conclude that LSD1 plays a pivotal role in maintaining endocrine resistance in breast cancer. It remains to be fully investigated how specific transcription factors dictate CoREST genomic occupancy and activities in tissue homeostasis and other cancer types.
cJUN and BAF recruitment are regulated by CoREST and is accompanied by loss of chromatin accessibility in an LSD1 enzymatically independent manner. The CoREST-cJUN-BAF axis reported here suggests that targeting CoREST could be an alternative strategy to targeting cJUN and can be synergized with other therapies against the PI3K pathway62,63. These findings are important considering that cJUN is a downstream effector of alternative survival pathways such as MAPK which is hyperactivated after endocrine therapy failure11. CoREST stands up as a novel therapeutic target which is independent of ERα loss. Compounds with a bifunctional LSD1/HDAC inhibitory activity such as corin are currently being tested in other solid malignancies (melanoma and glioma)38,39 and represent a promising candidate alone or in combination with the standard of care therapies in breast cancer. Finally, detailed analyses of the role of CoREST in cancers harbouring mutations in BAF subunits, warrant further investigation.
Our LSD1 interactome analysis revealed an association of LSD1 with previously identified interactors such as KAT8 (MOF)41, SFMBT142, and CARM143. We discovered an unexpected association between LSD1 and multiple members of BAF complexes. To the best of our knowledge, CoREST subunits have not been reported to physically interact with BAF variants. Interestingly, CARM1 methylates SMARCC1 in breast cancer cells and methylated SMARCC1 regulates the MYC pathway and correlates with poor prognosis43,64. Notably, LSD1 is also a CARM1 substrate in breast cancer cells43. Thus, CoREST, CARM1, and BAF complexes may cooperate to stimulate breast cancer progression and resistance to endocrine therapy. Whether CARM1 plays a role in CoREST function via methylation of SMARCC1 remains to be investigated. In agreement with our results and proposed model, high levels of BAF subunits are associated with poor survival in patients with ERα loss and mutated TP53. Additionally, the involvement of specific BAF complexes in regulating CoREST function also makes it worth investigating whether discrete perturbations in this mechanism underlie cellular plasticity.
Targeting cell plasticity to overcome resistance is an active area of research. Compounds against epigenetic regulators may rewire cells to overcome resistance. Out of the histone demethylase family of enzymes, only molecules targeting LSD1 are being actively explored in clinical trials65. These LSD1 inhibitors currently tested in hematological malignancies are structural analogs of TCP which target LSD1 enzymatic activity and induce terminal cell differentiation. While its importance is unarguable, the histone demethylase activity of LSD1 seems to be dispensable for its oncogenic role in endocrine resistant breast cancer. Our results imply that the LSD1 oncogenic program is mediated by its scaffolding function to keep the CoREST complex intact, rather than by its catalytic activity. This finding agrees with increasing evidence supporting the role of LSD1 in regulating gene transcription and proliferation separately from its enzymatic activity, such as in castration-resistant prostate cancer66.
Finally, our integrated approach combining LSD1 genomic profiles in vitro and in vivo, gene expression, and chromatin accessibility assays revealed a gene signature predictive of endocrine resistant tumor sensitivity to pharmacological inhibition of CoREST. Our study highlights new strategies to achieve personalized breast cancer treatment by developing novel targeted therapeutic strategies.
Methods
Cell Lines.
T47D primed and fully reprogrammed were derived from parental T47D cells (ATCC HTB-113) cultured in long term estrogen deprivation, LTED, conditions. All cells were maintained at 37°C with 5% CO2 and split every 2–3 days according to ATCC recommendations. Complete culture media for each cell line was as follows: MDA-MB-231 (ATCC HTB-26) (Dulbecco’s modified Eagle’s medium with 10% fetal bovine serum [FBS, BenchMark 100–106]), T47D (RPMI 1640, Lonza 12–167Q with 10% FBS), T47D/MCF7 LTED (Improved MEM, Richter’s Mod. without phenol red and glutamine, Corning 10–026-CV with 10% Charcoal:Dextran Stripped FBS [BenchMark 100–119]), MCF7 (ATCC-HTB22) (Eagle’s Minimum Essential Medium with 10% FBS and 0.01 mg/ml human recombinant insulin). All cell culture media were supplemented with 1x Penicillin/Streptomycin (10,000 U/ml, Thermo Fisher Scientific 15140–122) and glutaMAX (Thermo Fisher Scientific, 35050–061). T47D and MCF7 TamR and FulR cells were generated by growing parental cells in the presence of 1µM tamoxifen (Sigma-Aldrich H7904) and 1µM fulvestrant (ICI 182,780, Tocris 1047), respectively. Cells were routinely tested to be free of mycoplasma infection. Additionally, the authenticity of parental T47D were verified by microsatellite analysis (ATCC 135-XV FTA Sample Collection Kit for Human Cell Authentication Service). In experiments using LSD1/CoREST inhibitors, cells were treated with vehicle (DMSO) or different concentrations of corin (MedChem Express HY-111048).
Generation of stable shRNA cells.
2×10⁶ of 293T cells (ATCC #CRL-3216) were plated into a 10cm2 plate and transfected 16h later with 8µg of pLKO-shRNAs (Addgene #10879 for shCTR; Sigma-Aldrich, #TRCN0000382379 for LSD1; Sigma-Aldrich #TRCN0000128570 for RCOR1, Sigma-Aldrich #TRCN0000015631/ #TRCN0000278033 and Sigma-Aldrich, #TRCN0000010366 for cJUN), 2µg of pCMV-VSV-G, and 6µg of pCMV-dR8.91 with calcium phosphate. 72h after transfection, viral supernatant was collected, passed through a 0.45µM polyethersulfone filter, and used to transduce cells with 8µg/ml of polybrene (Millipore-Sigma, #TR-1003-G). Cells were allowed to recover in complete cell culture media and were selected with puromycin after 24h (2µg/ml Biogems, #5855822).
Transfection of siRNA.
T47D cells were seeded into 6-well plates at 2x10⁵ the day prior to siRNA transfection and maintained in antibiotic-free culture medium. 25nM of siRNAs (Sigma-Aldrich #SIC007 for control, EHU098171 for LSD1) were transfected using Lipofectamine RNAiMAX (Thermo Fisher Scientific #13778150) following the manufacturer’s instructions. On day 2, a second round of transfection was carried out.
Clonogenic assays.
5×10² cells were seeded into 3 individual wells on a 6-well plate. The clonogenic capacity of MDA-MB-231 cells after stable transduction with shCTR and shLSD1 (TRCN0000382379), of reprogrammed T47D cells after stable transduction with shCTR and shcJUN (TRCN0000010366), and of reprogrammed T47D parental and LSD1 KO cells were determined. Cells were cultured in 2ml media refreshed twice a week. After 11 days (reprogrammed), 2 weeks (parental), and 3 weeks (MDA-MB-231), media was removed, and colonies stained with crystal violet solution (0.25g crystal violet Sigma-Aldrich C3886; 13.5ml 37% formaldehyde Sigma-Aldrich 252549–100; 5ml methanol VWR BDH20864.400; 1× PBS to 500ml Sigma-Aldrich P3813) for 20min. After staining, the wells were gently washed with tap water. Plates were air-dried and colonies were imaged using an Epson V750 Pro photoscanner at 1200 dpi resolution.
Growth curves.
Cells (2×10⁵) were seeded into 6-well plates (Greiner Bio-One 657160). Media was replaced 1 day after plating and cells were treated with 1µM of tamoxifen, fulvestrant, palbociclib, GSK-LSD1, MCC2580, DPP38003, or corin depending on the experiment. Treatment media was changed every 2 days and cell numbers were counted using a Countess II Automated Cell Counter on days 0, 3, 5, and 7. The effect on proliferation upon cJUN, RCOR1, SMARCC1 and LSD1 depletion was also determined using this methodology.
Western blotting.
Cells were lysed with high-salt buffer (300nM NaCl, 50mM tris-HCl pH 8.0, 10% glycerol, and 0.2% NP-40) supplemented with protease inhibitors (Sigma-Aldrich, #04693132001). After 10 minutes on ice, cells were sonicated 5min at 4°C with a Bioruptor in 30sec ON/OFF cycles and then centrifuged at 16,000 × g for 15min. Soluble material was quantified by Bradford assay (Bio-Rad, #5000006) and 40µg were loaded onto SDS-page for WB performed using standard protocols and imaged on an Odyssey CLx imaging system (Li-COR) and various exposures within the linear range captured using ImageStudioLite software (Li-COR, v5.2.5). Images were rotated, resized and cropped using Adobe Photoshop 2020 and assembled into figures using in Adobe Illustrator 2020. Antibodies are listed in Supplementary Table 6.
Immunoprecipitation (IP).
IP experiments were done using nuclear fraction of cells. Briefly, cells were lysed on ice for 10 min with Buffer A (10 mM HEPES, 1.5 mM MgCl2, 10 mM KCl, 0.5 mM DTT, 0.05% NP40, pH 7.9) followed by centrifugation at 2,300g for 5 min. Supernatant was discarded and the procedure was repeated. The cell pellet was dissolved in IP300 (half of the volume used for Buffer A) and processed as described in the WB section. 1mg of protein was used for each IP and 500μg of nuclear extract as the input material. IP samples were incubated overnight with 10μg of antibody or IgG followed by 30μl of protein A/G agarose bead slurry (Santa Cruz #sc-2003) for 2h. In the IP experiments performed in the presence of corin, cells were incubated for 30 minutes at 4 °C in Buffer A containing 1μM of the inhibitors. This concentration was maintained during next steps. Similarly, 10μg/ml ethidium bromide (Sigma-Aldrich, E1510) were used to address DNA-independent protein association. IP material was washed 3× with high-salt buffer and eluted with Laemmli buffer, then loaded for SDS-PAGE.
IC50 experiments.
Cells were seeded at 4x10⁴ cells/ml density in a 96-well plate (Greiner-Bio-One 655180). Media was replaced 1 day after plating and cells were treated with DMSO (vehicle) and serial dilutions of GSK-LSD1 (Cayman Chemical Company 16439) or corin. 5 technical replicates per compound and concentration, and 3 biological replicates were performed.
Generation of LSD1 KO cells.
The target sequence CGCGGAGGCTCTTTCTTGCG from the LSD1 exon 1 was cloned into the lentiCRISPR v2 vector following the manufacturer’s instructions. Lentivirus containing the LSD1 CRISPR construct were packaged in 293T cells (ATCC #CRL-3216). Transduced cells were selected with puromycin (2µg/ml) for 3 days and cultured as single clones in 96-well plates. Single clones were screened by WB.
Rescue experiments.
LSD1 WT and catalytic mutant (K661A-LSD1) constructs cloned into the retroviral PINCO vector. Reprogrammed T47D cells were stably transfected with shRNA targeting endogenous LSD1 (Sigma-Aldrich, #TRCN0000382379 for LSD1). After puromycin selection, cells were transduced with WT or the K661A mutant.
Cell cycle profiles.
Cells (2x10⁵) were washed twice with cold 1x PBS and re-suspended in 1x PBS with 2mM EDTA and fixed in 70% ethanol overnight at 4°C. Cells were recovered by centrifugation, washed with 1x PBS once and incubated at 37°C for 30 min in staining buffer (2mM EDTA in 1x PBS with 10µg/ml RNase A, 5µg/ml of propidium iodide [Sigma]). Cells were analyzed using a BD Biosciences FACSCanto-II and FlowJo software (v10.7.1).
Apoptosis and β-galactosidase analysis.
5x10⁵ cells were collected, washed twice with 4°C annexin binding buffer (ABB) (BD Pharmingen), and resuspended in 500µl ABB. FITC-conjugated annexin V (5µl) and propidium iodide (5µl) were added to the solution and mixed. After incubation for 15 min at room temperature (RT) in the dark, the cells were analyzed with BD Biosciences FACSCanto-II and FlowJo software (v10.7.1). Four days after exposure to DMSO or 500nM corin, β-Galactosidase staining (Takara) was carried out following manufacturer instructions. Samples were analyzed using an Axiovert 40 CFL microscope with Zen software (Zeiss).
Immunofluorescence assays.
Cells were fixed with 2% formaldehyde in PBS for 10 min at RT, washed with 1x PBS and bound to poly-L-lysine coated slides. After washing with 1x PBS for 5 min, cells were incubated with blocking solution (1% W/V BSA, 3% V/V goat serum, 0.2% V/V Triton X-100 in PBS) for 30 min at RT. Next, the cells were incubated with the primary antibodies in blocking solution for 1h at RT, washed three times with PBS, and incubated with Alexa 488 or 594 coupled antibodies (ThermoFisher) for another 30 min. Finally, cells were incubated with 0.5µg/ml, 6-diamino-2-phenylindole (DAPI, Sigma) in PBS for 5 min, washed with PBS for 2 min, air dried, and mounted in SlowFade Diamond antifade mounting reagent (ThermoFisher). Samples were analyzed using a Leica DMI6000B microscope with LAS-X software (Leica). Antibodies used were: 53BP1 (Millipore; 1:1000), γ-H2AX (Ser 139) clone JBW301 (Millipore; 1:1000), RAD51 (B-Bridge International; 1:1000).
ChIP-seq and library preparation.
Cells were grown to 80% confluence on six 150cm2 plates67. For all ChIP experiments, except RCOR1 and SMARCC1, single crosslinking using formaldehyde was done. Briefly, cells were fixed by adding (1/10 of the volume of the plate) 11% formaldehyde (Thermo Fisher #28908), 50mM HEPES-KOH (pH 7.5), 100mM NaCl, 0.5M EDTA, 0.5M EGTA for 10 min. Freshly prepared 2.5M glycine was added to quench the reaction for 5 min. Cells were washed twice with 5ml 1x PBS and harvested on ice using cell scrapers. Cells were pelleted at 2,950 x g for 10 min at 4°C, washed with 10ml cold 1x PBS twice. Cell pellets were flash frozen in liquid nitrogen and stored at -80°C. For RCOR1 and SMARCC1 ChIP, a dual crosslinking approach was used. Protein-protein interactions were preserved with ChIP-gold crosslinking reagent (Diagenode C01019027) followed by DNA-protein crosslinking with 11% formaldehyde solution. Cells collected were resuspended in 5ml Lysis Buffer 1 (50 mM HEPES-KOH, pH 7.5; 140 mM NaCl, 1mM EDTA, 10% glycerol, 0.5% NP-40, 0.25% Triton X-100), allowed to rotate for 10 min at 4°C, and pelleted at 2,950 x g for 10 min at 4°C. Cells were then resuspended in 5ml of Lysis Buffer 2 (10 mM Tris-HCL pH 8.0, 200 mM NaCl, 1 mM EDTA, 0.5 mM EGTA), and pelleted at 2,950 x g for 10 min at 4°C. Cells were resuspended in 3ml of Lysis Buffer 3 (10 mM Tris-HCl pH 8, 100 mM NaCl, 1 mM EDTA, 0.5 mM EGTA, 0.1% Na-Deoxycholate, 0.5% N-lauroylsarcosine) and transferred to 15ml sonication tubes (Diagenode cat# C01020031) then sonicated on a Bioruptor Pico at 4°C for 20 min of 30’’ ON-OFF cycles with 1.2g of sonication beads. Samples were centrifuged at 20,000 x g for 15 min at 4°C. To check sonication efficiency, 50µl of sonicated sample was transferred to a microtube with 50µl PBS and incubated at 65°C for 3h on an Eppendorf Thermomixer shaking at 1000rpm to de-crosslink. DNA was purified with the QIAquick PCR Purification Kit (Qiagen 28106) and eluted in 50µl of H20. 1μg of de-crosslinked chromatin from each sample was run in a 1% agarose gel at 100V for 45 min and imaged on a BIO-RAD ChemiDoc XRS+. DNA concentration was measured by Qubit. 10µg of LSD1, cJUN, RCOR1, or SMARCC1 antibodies along with 2µg of spike-in antibodies (Active Motif 61686) were bound to 50µl of Dynabeads Protein G (Thermo Fisher 10004D), previously washed with 1ml of 0.5% BSA in 1x PBS 3 times and rotated end-to-end overnight at 4°C (Eppendorf cat# 0030108051). For RNA Pol II, FOXA1 and ERα ChIP, 5μg of antibodies was used while 2µg was used for H3K27ac and H3K4me2. After binding of the antibodies, beads were washed with 1ml of 0.5% BSA in 1x PBS 3 times. 30µg of chromatin and 50ng of spike-in chromatin (Active Motif 53083) were added to 1.5ml LoBind tubes (Eppendorf cat# 0030108051) containing the beads pre-bound with antibodies and brought up to 500µl final volume with Lysis Buffer. 5µl was removed as input material (1%) and placed in a separate microtube at 4°C completing the volume to 50µL with Lysis Buffer 3. Samples were rotated end-to-end overnight at 4°C. Immunocomplexes were washed 6 times with 1ml Wash Buffer (50 mM Hepes-KOH, pH 7.6; 500 mM LiCl, 1 mM EDTA, 1% NP-40; 0.5% Na-Deoxycholate) and once with 1ml TE containing 50mM NaCl. 210μl of Elution Buffer (50 mM Tris-HCl, pH 8; 10 mM EDTA, 1% SDS) was added to each sample and 150µl elution buffer were added to each input sample that was previously set aside. To elute immunocomplexes from beads, samples were incubated at 65°C for 15 min on an Eppendorf Thermomixer shaking at 1000 rpm. Tubes were centrifuged for 3 min at 960 x g at RT and 200µl of supernatant was transferred to a new tube and reverse crosslinked overnight at 65°C. Next day, 200μl of TE was added to each de-crosslinked sample and input, and the samples were treated sequentially with 0.2mg/ml RNAse A (Sigma R5503) at 37°C and 0.2µg/ml Proteinase K (NEB P8107S) at 55°C for two hours. DNA purification was performed with the QIAquick PCR Purification Kit (Qiagen cat# 28106), eluted in 50µl of H2O and quantified by Qubit. Immunoprecipitated DNA was used to generate libraries using the NEBNext Ultra DNA Library Prep Kit for Illumina (New England Biolabs cat# 7370) following the manufacturer’s instructions. A Tapestation 2200 was used for fragment analysis using D1000 DNA ScreenTape (Agilent Technologies, #5067–5582). Libraries were quantified on a Qubit 3 fluorometer with Qubit double-stranded DNA high-sensitivity reagents (Thermo Fisher Scientific, #Q32851) following the manufacturer’s instructions, then pooled and sequenced (single-end, 75bp) either on an Illumina NextSeq 500 or Novaseq 6000. Antibodies are listed in Supplementary Table 6.
ChIP-seq analysis.
Single-end ChIP-seq fastq files were processed using the ENCODE Transcription Factor and Histone ChIP-Seq processing pipeline (https://github.com/ENCODE-DCC/chip-seq-pipeline2), SAMtools v1.9, Bowtie2 v2.3.4.3, MACS2 v2.2.4, cutadapt v2.5, Picard Tools v2.20.7. Peaks with fold change > 3.5 compared to input and FDR < 0.05 were used for subsequent analysis. Only default parameters were used. Bigwig output files were visualized in the UCSC genome browser. Homer annotatePeaks v4.11 was used for peak annotation and Bedtools v2.29.0 intersect was used to determine peak overlaps and assign target genes. NGS plot v2.63.1 (https://github.com/shenlab-sinai/ngsplot) was used to generate heatmaps and density plots.
CUT&RUN.
Anti-H3K27ac (Diagenode, C15410194), anti-H3K4me1 (Abcam, ab4729) and anti-IgG (EpiCypher, 13–0042K) were used for CUT&RUN. CUT&RUN was performed with the CUTANATM ChIC/CUT&RUN kit according to the manufacturer’s protocol (EpiCypher, 14–1048). Libraries were generated using the NEBNext Ultra II DNA Library Prep Kit for Illumina (NEB, E7370L) and sequenced on an Illumina NovaSeq 6000. Paired-end fastq files were processed using the ENCODE Transcription Factor and Histone ChIP-Seq pipeline. Antibodies are listed in Supplementary Table 6.
ATAC-seq experiments and analysis.
Briefly, 50,000 viable cells were used for the transposition reaction. Cells were treated with DNAse I (Worthington LS002007) for 30 min at 37°C to eliminate DNA debris and dead cells. Cell pellets were resuspended in 50µL cold ATAC-Resuspension Buffer (RSB) containing 0.1% NP40, 0.1% Tween-20, and 0.01% Digitonin (Promega catalog number G9441) and incubated on ice for 3 min. The lysis washout was done using 1ml of cold ATAC-RSB containing 0.1% Tween-20 and mixed by tube inversion 3 times. Cell pellet was resuspended in 50µL of transposition mixture: 25µl 2x TD buffer, 2.5µl transposase (100nM final, Illumina Tagment DNA Enzyme and Buffer Small Kit 20034197), 16.5µl PBS, 0.5µl 1% digitonin, 0.5µl 10% Tween-20, 5µl H2O by pipetting up and down 6 times. The transposase reaction was incubated for 30 min at 37°C in a thermomixer at 1000 rpm. The cleanup of the transposed fragments was performed using Zymo DNA Clean and Concentrator-5 Kit (Zymo D4014) and DNA was eluted in 21µL of provided elution buffer. Purified DNA was amplified using a master mix containing 2.5µL 25µM Primer Ad1, 2.5µL 25µM Primer Ad2, 2x NEBNext Master Mix (NEB er M0541S) and 20µL transposed sample. The following cycling conditions were used: 72 °C for 5 min, 98 °C for 30s, 98 °C for 10s, 63 °C for 30s and 72°C for 30s, 5 cycles, 72°C for 1 min, and hold at 4 °C. The Ad1 and Ad2 custom oligos were synthesized by Integrated DNA Technologies using sequences68. To determine the number of additional cycles needed, a qPCR was run in a Roche Lightcycler qPCR machine using a mix containing, 5µL (10%) of pre-amplified mixture, 0.2µL 25µM Primer Ad1, 0.2µL 25µM Primer Ad2, 0.2µL 100x SYBR green (Invitrogen S7563), 10µL 2x NEBNext Master Mix and 4.4µL sterile water. Cycling conditions were the following 98 °C for 30s, 20 cycles of 98 °C for 10s, 63 °C for 30s and 72 °C for 1min, hold at 4°C. After qPCR amplification profiles were assessed and the required number of additional cycles was determined based on the Rn vs Cycle linear plots. Using the remainder (45µl) of the pre-amplified DNA, the previously determined additional cycles were run and the final PCR reaction was purified using the Zymo kit and eluting DNA in 20µL. To determine the average fragment size of each library, samples were run through a high sensitivity DNA screentape (Agilent Technologies #5067–5584) following the manufacturer’s instructions on an Agilent Technologies 2200 TapeStation machine. Concentration of each library was measured using Qubit dsDNA high sensitivity reagents (ThermoFisher Q32851) following the manufacturer’s instructions on a Qubit 3 fluorometer. Finally, the samples were pooled and sequenced, paired end, 75bp on a NovaSeq 6000 (Illumina). ATAC-seq analysis was performed using the encode ATAC-seq pipeline (https://github.com/ENCODE-DCC/atac-seq-pipeline). Read alignment was offset as previously described68. Peaks were called using the MACS2 v2.1.0 algorithm with the parameters: -g hs -p 0.01—nomodel—shift −75—extsize 150 and a cutoff of q-value < 0.05. Bedtools v2.26.0 intersect was used to determine peak overlaps. NGS Plot was used to generate heat maps and density plots. The gene ontology (GO) analysis and pathway enrichment analysis were performed with EnrichR (2016 update) using the genes within 2.5kb up and down from the ATAC-seq peaks.
Acid histone extraction and digestion for LC-MS/MS.
Freshly harvested cells (2x10⁶) were washed with cold PBS. Cell pellets were resuspended in 500µl of pH 6.5 cold lysis buffer containing 10mM tris-HCl (pH 8), 50mM sodium bisulfite,1% Triton X-100, 10mM MgCl2, 8.6% sucrose, and 10mM sodium butyrate. Then, cells were centrifuged at 20,000 x g for 15 min at 4°C, discarding the supernatant resuspending the pellet by vortex in 500µl of cold lysis buffer for a second centrifugation at 20,000 x g for 15 min at 4°C. After a total of three rounds of lysis buffer treatment, the pellet was washed with 1ml of wash buffer (pH 7.4) containing 10mM Tris and 13mM EDTA. Supernatant was discarded and cell pellets were dissolved in 100µl of 0.4M H2SO4 and kept on ice. After 1h, cells were centrifuged at 20,000 x g for 5 min. The supernatant and 900µl of acetone were incubated overnight at -20°C. Next day, samples were centrifuged at 20,000 x g for 10 min, and the supernatant was discarded. Pellets containing the histones were air-dried for 5 min and then resuspended in 50µl of water. Histone concentration was estimated by Bradford. Histones were then digested with 1µg of sequencing grade trypsin (Promega) diluted in 50mM ammonium bicarbonate (1:20, enzyme:sample) overnight at room temperature. The derivatization reaction was repeated to derivatize the peptide N-termini. The samples were dried in a vacuum centrifuge. Antibodies are listed in Supplementary Table 6.
FACS analysis and sorting.
For staining of the luminal and basal cell surface markers CD24 and CD44, respectively, 1x10⁶ freshly harvested cells were washed with cold PBS and pelleted. Cell pellets were dissolved in 100µl of 1xPBS and incubated in the presence of 1µg of APC anti-human CD24 [ML5] (BioLegend-311118) and 1µg of PE anti-mouse/human CD44 [IM7]. Cells were incubated with the antibodies in the dark for 30min at 4°C and washed twice with cold 1xPBS. Cell populations were analyzed using CytoFLEX Flow Cytometer (Beckman Coulter). Additionally, CD44high/CD24low and CD44low/CD24high primed cells were sorted in a BD Biosciences FACS Aria IIu sorter. FACS sorted cells were used for in vivo experiments.
RNA extraction, library preparation and RNA-seq analysis.
Total RNA was isolated from frozen cell pellets using TRIzol reagent (Thermo Fisher Scientific cat# 15596018) according to manufacturer’s instructions. Library preparation was performed on DNAse-treated RNA using the Illumina TruSeq Stranded Total RNA Library Prep Gold (Illumina 20020598). TruSeq RNA UD Indexes (Illumina 20022371) were used for the adapter ligation step. Samples were normalized to a concentration of ranging from 100–250ng for input, and 1µl of ERCC spike-in Mix 1 (Thermo Fisher 4456740) diluted 1:200 was added to the samples. RNA-seq fastq files were processed using the LSF-RNAseq Pipeline from Diderote (https://github.com/diderote/LSF-RNAseq). Reads were trimmed using cutadapt v2.3 with the following parameters: -j 4 --netseq-trim=20 -m 18. Reads were aligned to the hg19 genome using STAR v2.6.1a along default parameters, and RSEM v1.3.0 was used to obtain the expected gene counts against the human refseq also along default parameters. RNA-seq differential expression was determined using DESeq2 v1.18.1 and R v3.4.1 with q-value < 0.05. Ruvseq v1.12.0 was used for factor analysis to remove count based on ERCC spike-in. GSEA analysis was performed using gsea-3.0.jar.
LC-MS/MS acquisition and analysis.
Prior to mass spectrometry analysis, samples were desalted using a 96-well plate filter (Orochem) packed with 1mg of Oasis HLB C-18 resin (Waters). Briefly, the samples were resuspended in 100µl of 0.1% TFA and loaded onto the HLB resin, which was previously equilibrated using 100µl of the same buffer. After washing with 100µl of 0.1% TFA, the samples were eluted with a buffer containing 70µl of 60% acetonitrile and 0.1% TFA and then dried in a vacuum centrifuge. Samples were resuspended in 10µl of 0.1% TFA and loaded onto a Dionex RSLC Ultimate 300 (Thermo Scientific), coupled online with an Orbitrap Fusion Lumos (Thermo Scientific). Chromatographic separation was performed with a two-column system, consisting of a C-18 trap cartridge (300µm ID, 5mm length) and a picofrit analytical column (75µm ID, 25cm length) packed in-house with reversed-phase Repro-Sil Pur C18-AQ 3µm resin. To analyze the proteome, peptides were separated using a 60 min gradient from 4–30% buffer B (buffer A: 0.1% formic acid, buffer B: 80% acetonitrile + 0.1% formic acid) at a flow rate of 300 nl/min. The mass spectrometer was set to acquire spectra in a data-dependent acquisition (DDA) mode. Briefly, the full MS scan was set to 300–1200 m/z in the orbitrap with a resolution of 120,000 (at 200 m/z) and an AGC target of 5x10e5. MS/MS was performed in the ion trap using the top speed mode (2 secs), an AGC target of 1x10e4 and an HCD collision energy of 35. To analyze the histones, peptides were separated using a 30 min gradient from 1–30% buffer B (buffer A: 0.1% formic acid, buffer B: 80% acetonitrile + 0.1% formic acid) at a flow rate of 300 nl/min. The mass spectrometer was set to acquire spectra in a data-independent acquisition (DIA) mode. Briefly, the full MS scan was set to 300–1100 m/z in the orbitrap with a resolution of 120,000 (at 200 m/z) and an AGC target of 5x10e5. MS/MS was performed in the orbitrap with sequential isolation windows of 50 m/z with an AGC target of 2x10e5 and an HCD collision energy of 30.
Proteome raw files were searched using Proteome Discoverer software (v2.4, Thermo Scientific) using SEQUEST search engine and the SwissProt human database (updated February 2020). The search for total proteome included variable modification of N-terminal acetylation, and fixed modification of carbamidomethyl cysteine. Trypsin was specified as the digestive enzyme with up to 2 missed cleavages allowed. Mass tolerance was set to 10 pm for precursor ions and 0.2 Da for productions. Peptide and protein false discovery rate were set to 1%. Following the search, data was processed as previously described69. Briefly, proteins were log2 transformed, normalized by the average value of each sample and missing values were imputed using a normal distribution 2 standard deviations lower than the mean. Statistical regulation was assessed using heteroscedastic T-test (if p-value < 0.05). Data distribution was assumed to be normal, but this was not formally tested. Histone peptides raw files were imported into EpiProfile 2.0 software70. From the extracted ion chromatogram, the area under the curve was obtained and used to estimate the abundance of each peptide. In order to achieve the relative abundance of post-translational modifications (PTMs), the sum of all different modified forms of a histone peptide was considered as 100% and the area of the particular peptide was divided by the total area for that histone peptide in all of its modified forms. The relative ratio of two isobaric forms was estimated by averaging the ratio for each fragment ion with different mass between the two species. The resulting peptide lists generated by EpiProfile were exported to Microsoft Excel and further processed for a detailed analysis.
Animal studies.
All procedures involving experimental procedures with mice were approved by the Institutional Animal Care and Use Committees (protocol number 20–170 LF; maximum tumor size should not exceed 1000mm3) of University of Miami. NOD Scid Gamma (NSG) mice were obtained from the Jackson Laboratory (002374) and bred inhouse for one generation. For primary tumor xenograft studies, the indicated breast cancer cell lines were implanted subcutaneously with matrigel in the mammary fat pad of immunocompromised NSG females. Primary tumor growth and metastasis in these models were measured biweekly by IVIS Spectrum (Perkin Elmer). When indicated, to confirm metastatic burden, organs were collected and analyzed ex vivo by IVIS. Corin was prepared in DMSO (17.85mg/ml) and then diluted in corn oil and administered intraperitoneally at a dose of 7.5 mg/kg, with no observable toxicity or weight loss. We confirmed that 7.5mg/kg of corin was sufficient to induce changes in histone acetylation in vivo (Extended Data Fig. 10f). Drug and vehicle were administered once daily for the duration of experiment. For the generation of metastatic models, the indicated number of cells (in 100µl of PBS) were either injected either intravenously (tail vein; see FACS sorting and analysis) or by ultrasound-guided cardiac injections (primed and MDA-MB-231 cells). Metastatic growth was measured biweekly by IVIS.
Statistics and Reproducibility.
For target genes analysis, the Student’s t-test was used to compare the expression of LSD1/RCOR1 target genes. The function stat_compare_means (method=t.test) from the ggpubr package (version >= 0.1.3) and the geom_boxplot function of the ggplot2 package were used to generate boxplots for data visualization. Gene expression, genomic and clinical data of the METABRIC cohort were extracted from www.cbioportal.org/study/summary?id=brca_metabric. Gene expression and disease specific survival from 1,423 patients were included in this analysis. Patients who died from other reasons were excluded from survival analysis. Patients were classified based on PAM50 and based on ER and TP53 mutation status, extracted from cBioportal. Details on individual statistical tests and the number of times individual experiments were replicated are noted in the respective figure legends. Representative Western Blots from at least three independent experiments are shown. No statistical method was used to predetermine sample size. Except from animal studies, experiments were not randomized, and investigators were not blinded to allocation during experiments and outcome assessment.
Extended Data
Extended Data Fig. 1. Further characterization of LSD1/CoREST in breast cancer and long-term estrogen deprivation (LTED) model.
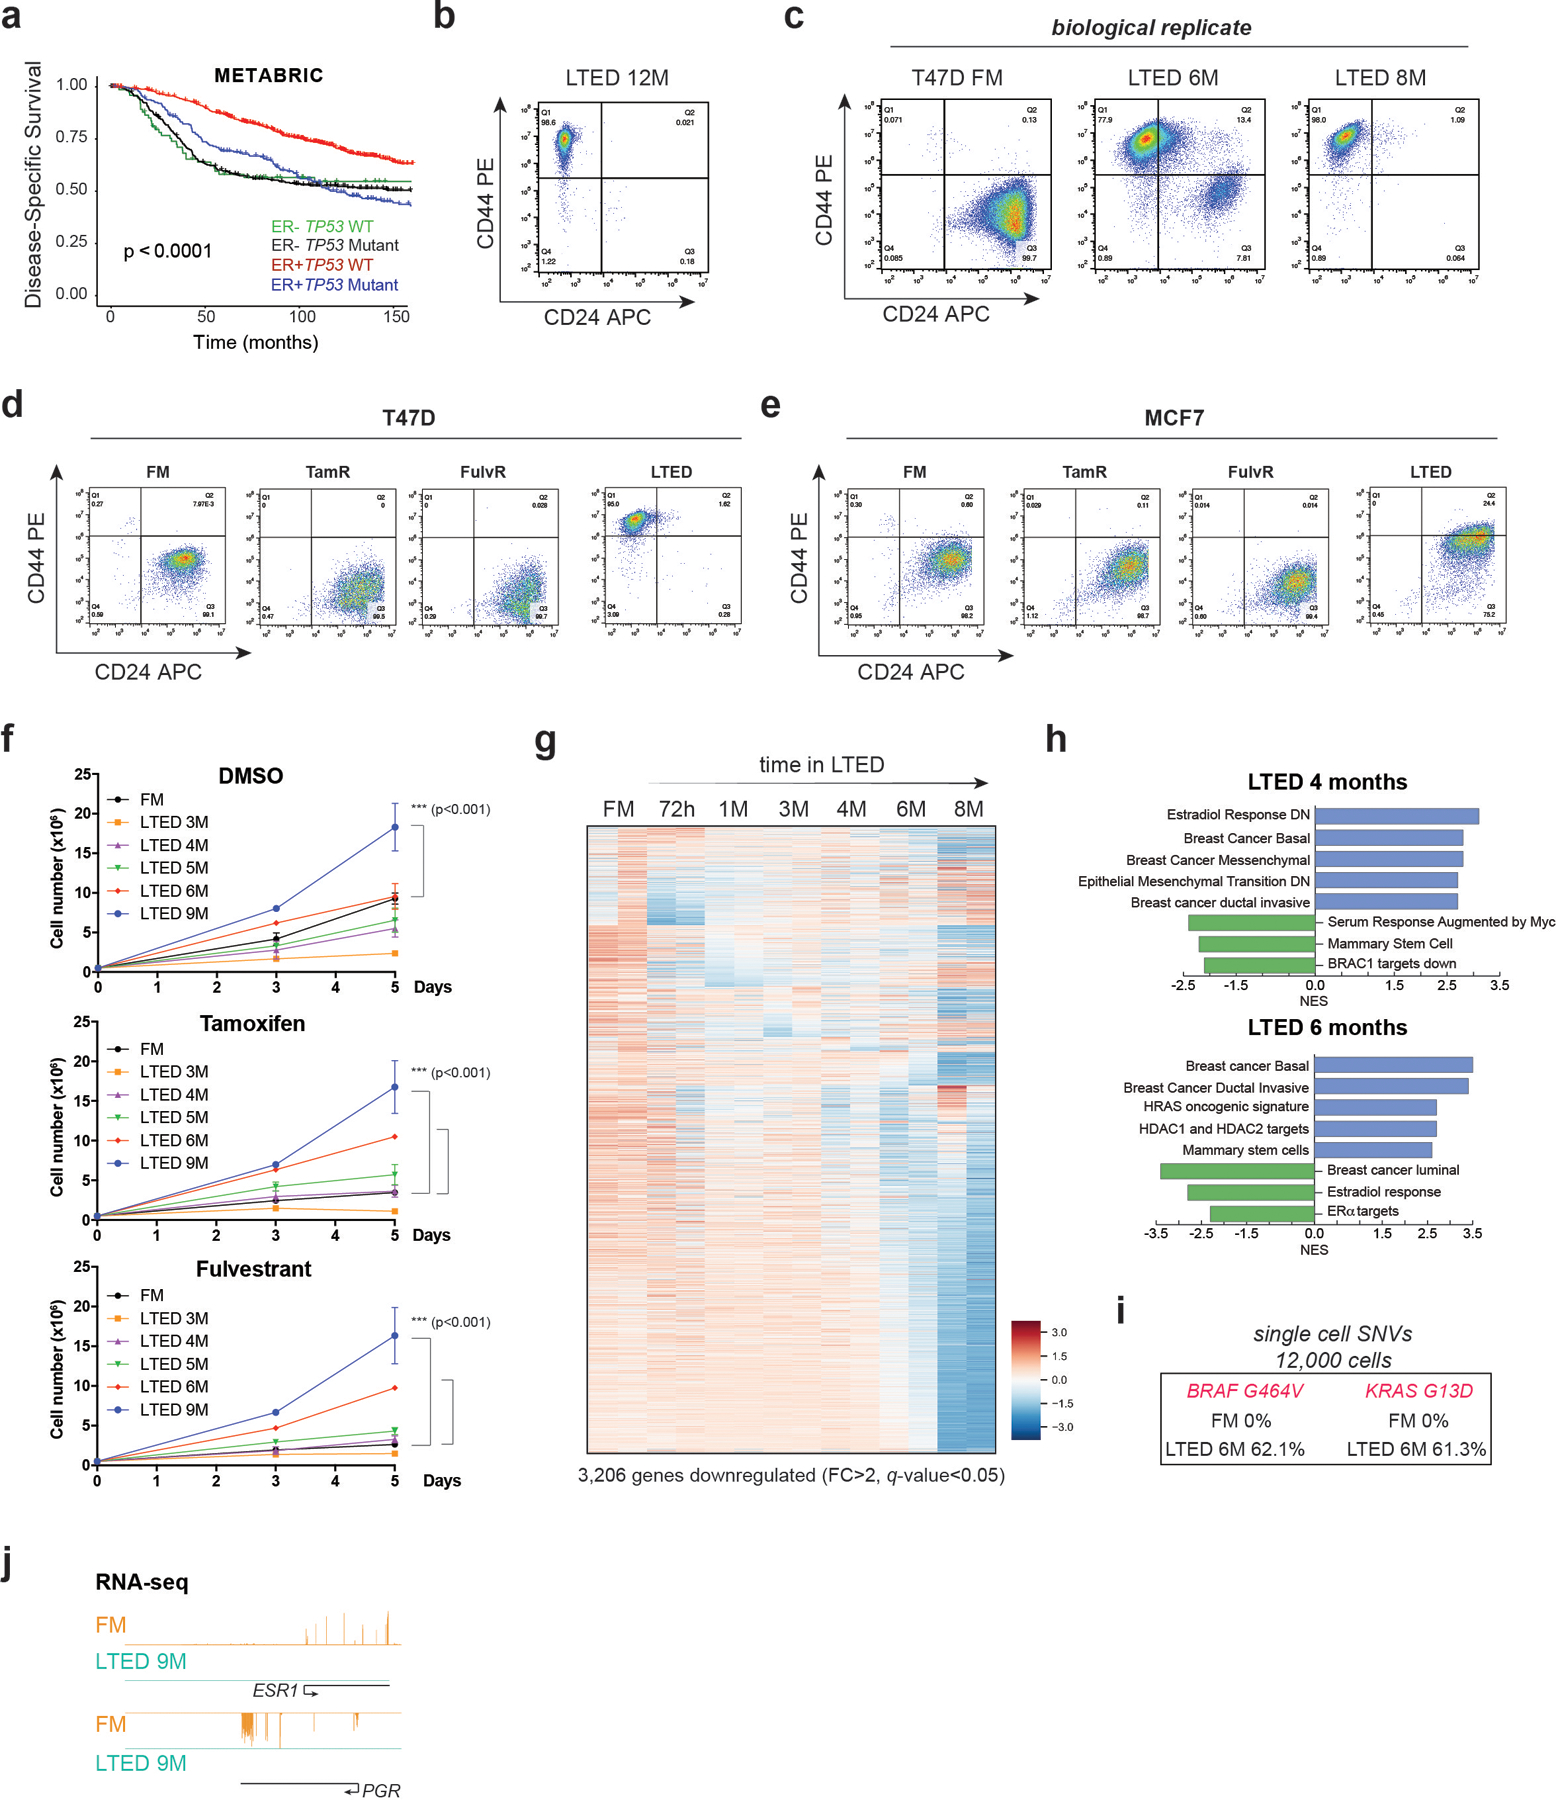
a, Kaplan–Meier survival curves segregated by ERα expression and TP53 mutation status (METABRIC dataset of 1,423 samples). Overall survival of patients with ER-/TP53 mutations is significantly diminished. P value was calculated using a log-rank (Mantel–Cox) test. b, CD24 and CD44 expression after 12 months (M) in LTED. c, FACS of T47D-LTED biological replicate (FM, full media). d-e, CD24 and CD44 expression in FM, TamR, FulR, and LTED T47D (d) and MCF7 (e). f, Growth curves of 2 × 10⁵ FM and LTED T47D (3–9M) cultured with DMSO (vehicle) or 1µM tamoxifen or fulvestrant for 5 days, n=3 biological independent replicates, data are presented as mean values + SEM, p-value < 0.001 (two-way ANOVA). g, Heatmap of 3,206 significantly downregulated genes (FC > 2, q-value < 0.05) during acquisition of resistance in T47D. Major transcriptomic changes occurred after 6M in LTED. h, GSEA of 4M and 6M T47D-LTED cells. Basal breast cancer, EMT transition, and ductal invasive signatures were upregulated while response to estrogen and luminal breast cancer signatures were downregulated after 6 months in LTED conditions. NES, normalized enrichment score. i, Single-cell SNV (single nucleotide variant) analysis from 6 × 10³ FM and 6M T47D-LTED. No FM cells harboured BRAF or KRAS mutations while ~60% of 6M cells acquired mutations in both genes. j, RNA-seq signal at ESR1 and PGR in FM and 9M T47D-LTED.
Extended Data Fig. 2. ESR1 loss is not mediated by epigenetic repressive mechanisms, and corin treatments in parental and endocrine resistant MCF7 cells.
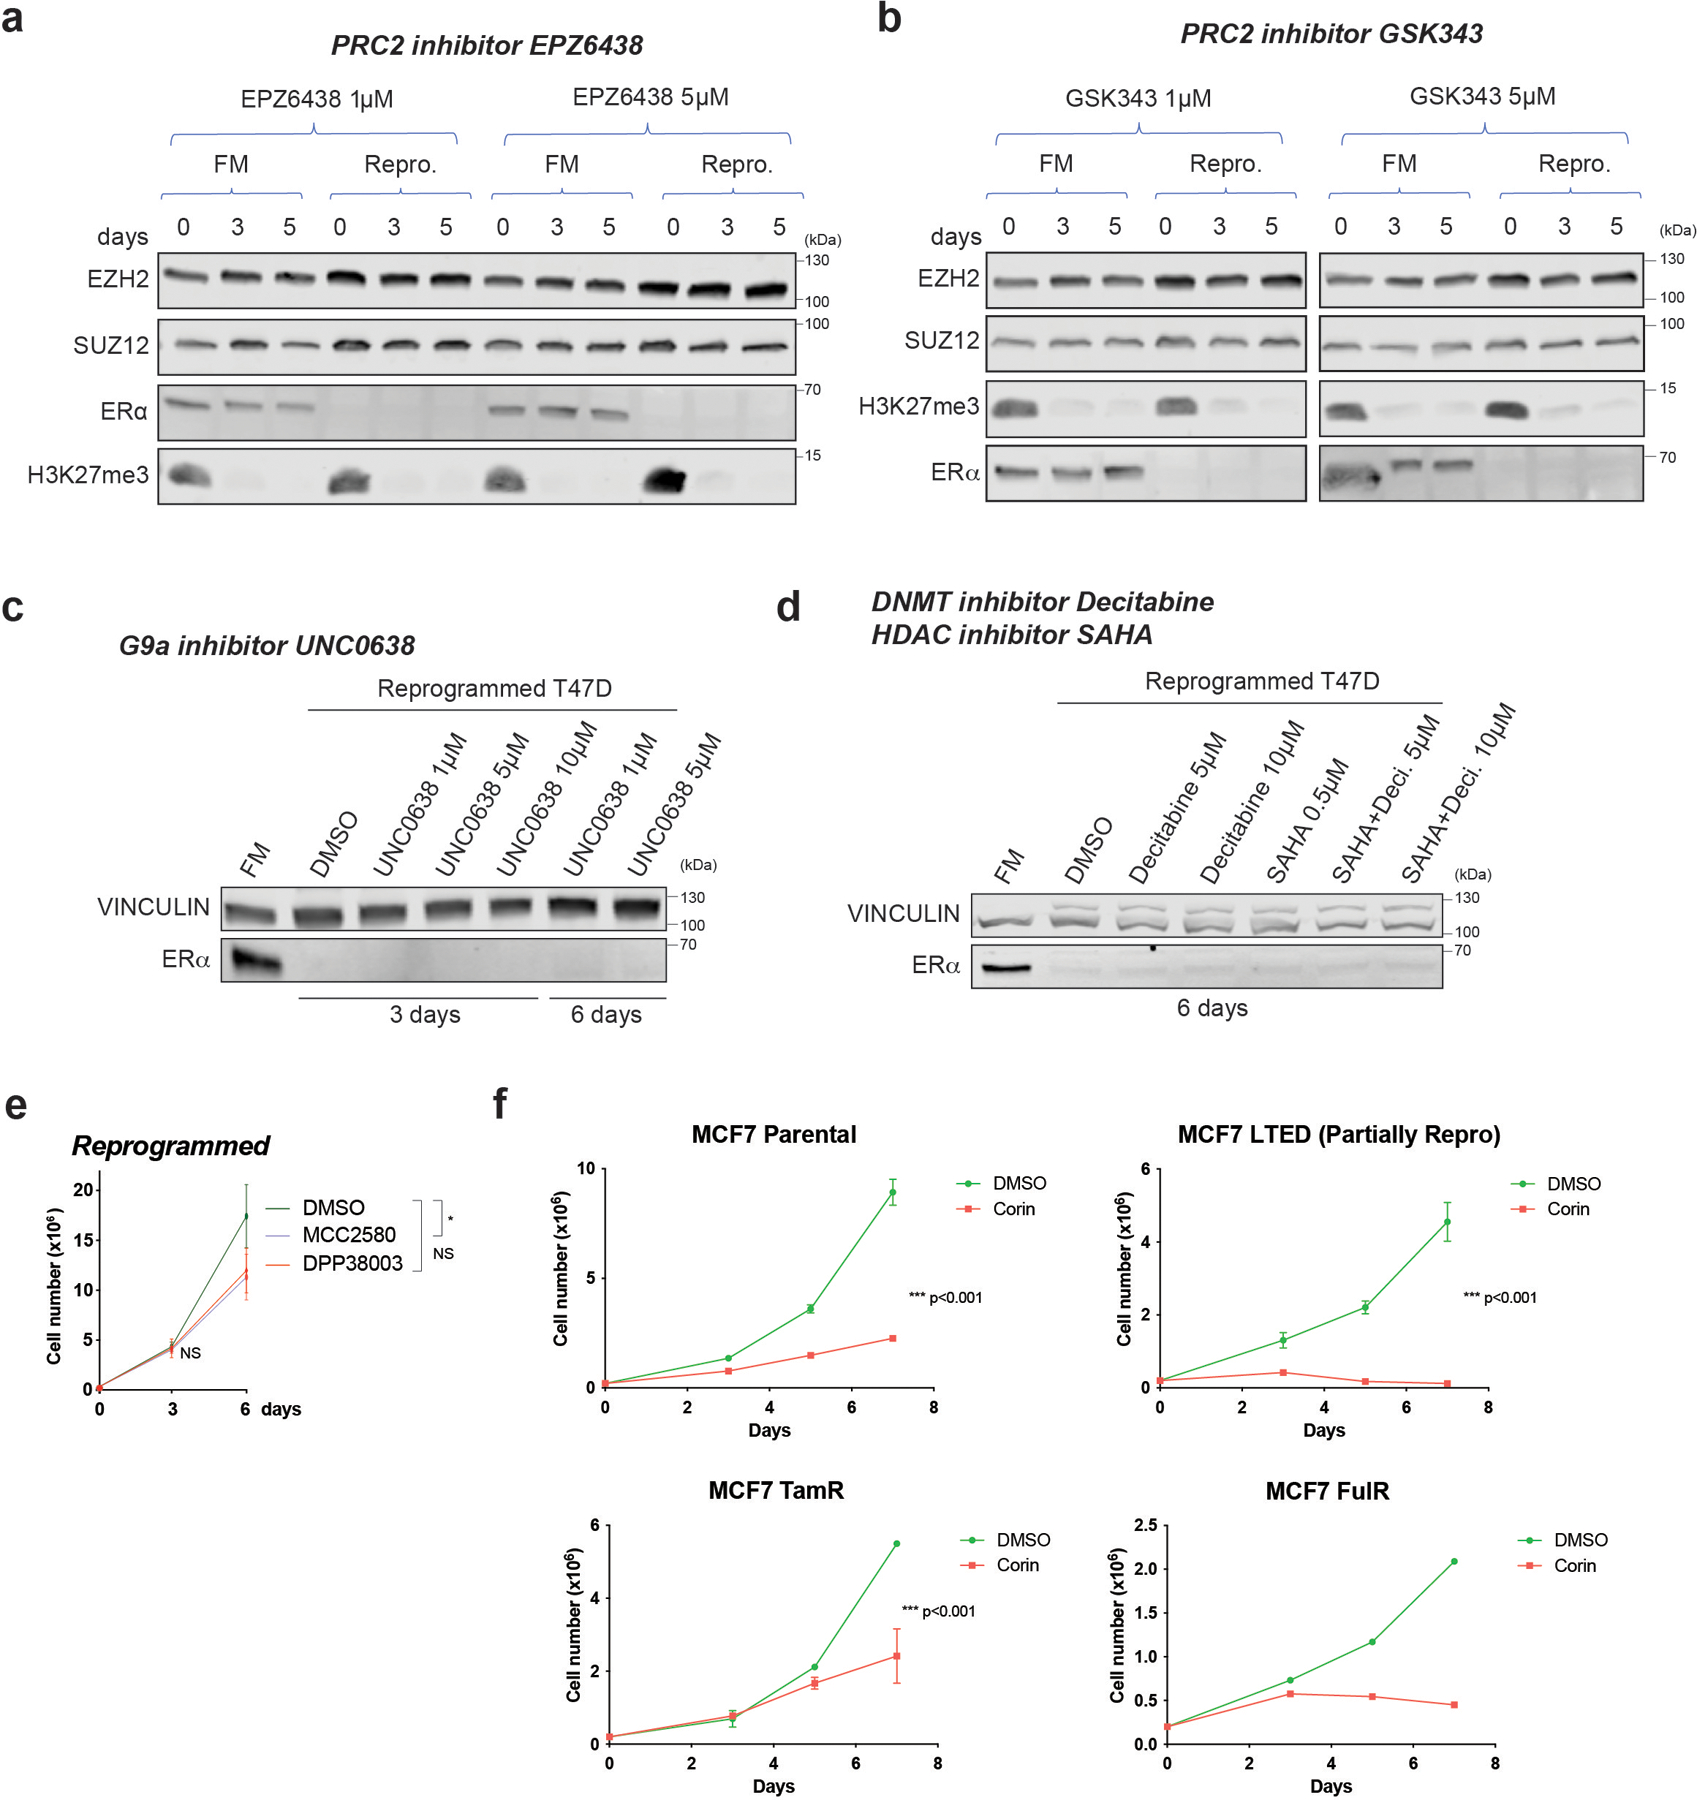
a-b, WB of PRC2 subunits (EZH2 and SUZ12) and ERα from whole cell extracts of FM and reprogrammed (Repro.) cells cultured for 3 and 5 days in the presence of 1µM or 5µM of PRC2 inhibitors EPZ6438 (a) and GSK343 (b). Total H3K27me3, the primary substrate of EZH2, decreased after PRC2 inhibition. c, ERα WB from whole cell extracts of FM and reprogrammed cells cultured for 3 and 6 days in the presence of vehicle (DMSO), 1µM, 5µM, or 10µM of the G9A inhibitor, UNC0638. d, ERα WB from whole cell extracts of FM and reprogrammed cells cultured for 6 days in vehicle (DMSO), 5µM, or 10µM of the DNMT inhibitor, decitabine (Deci.), 0.5µM of the HDAC inhibitor, SAHA, or in combination. e, Proliferation of reprogrammed cells treated with 5µM DMSO (vehicle) or two LSD1 enzymatic inhibitors (MCC2580, DPP38003) for 6 days, n = 3 biological independent replicates, data are presented as mean values + SEM, p-value < 0.05 for treatment with MCC2580 on day 6 (two-way ANOVA). f, Growth curves of 2 × 10⁵ FM, LTED, TamR, and FulR MCF7 cultured with DMSO (vehicle) or 500nM corin for 7 days, n = 3 independent experiments (except FulR cells, n =2 independent experiments), Data are presented as mean values + SEM, p-value < 0.001 (two-way ANOVA). Uncropped images are available as source data.
Extended Data Fig. 3. Genetic abrogation of LSD1 impaired proliferation and survival of endocrine sensitive and resistant cells, and the LSD1 interactome.
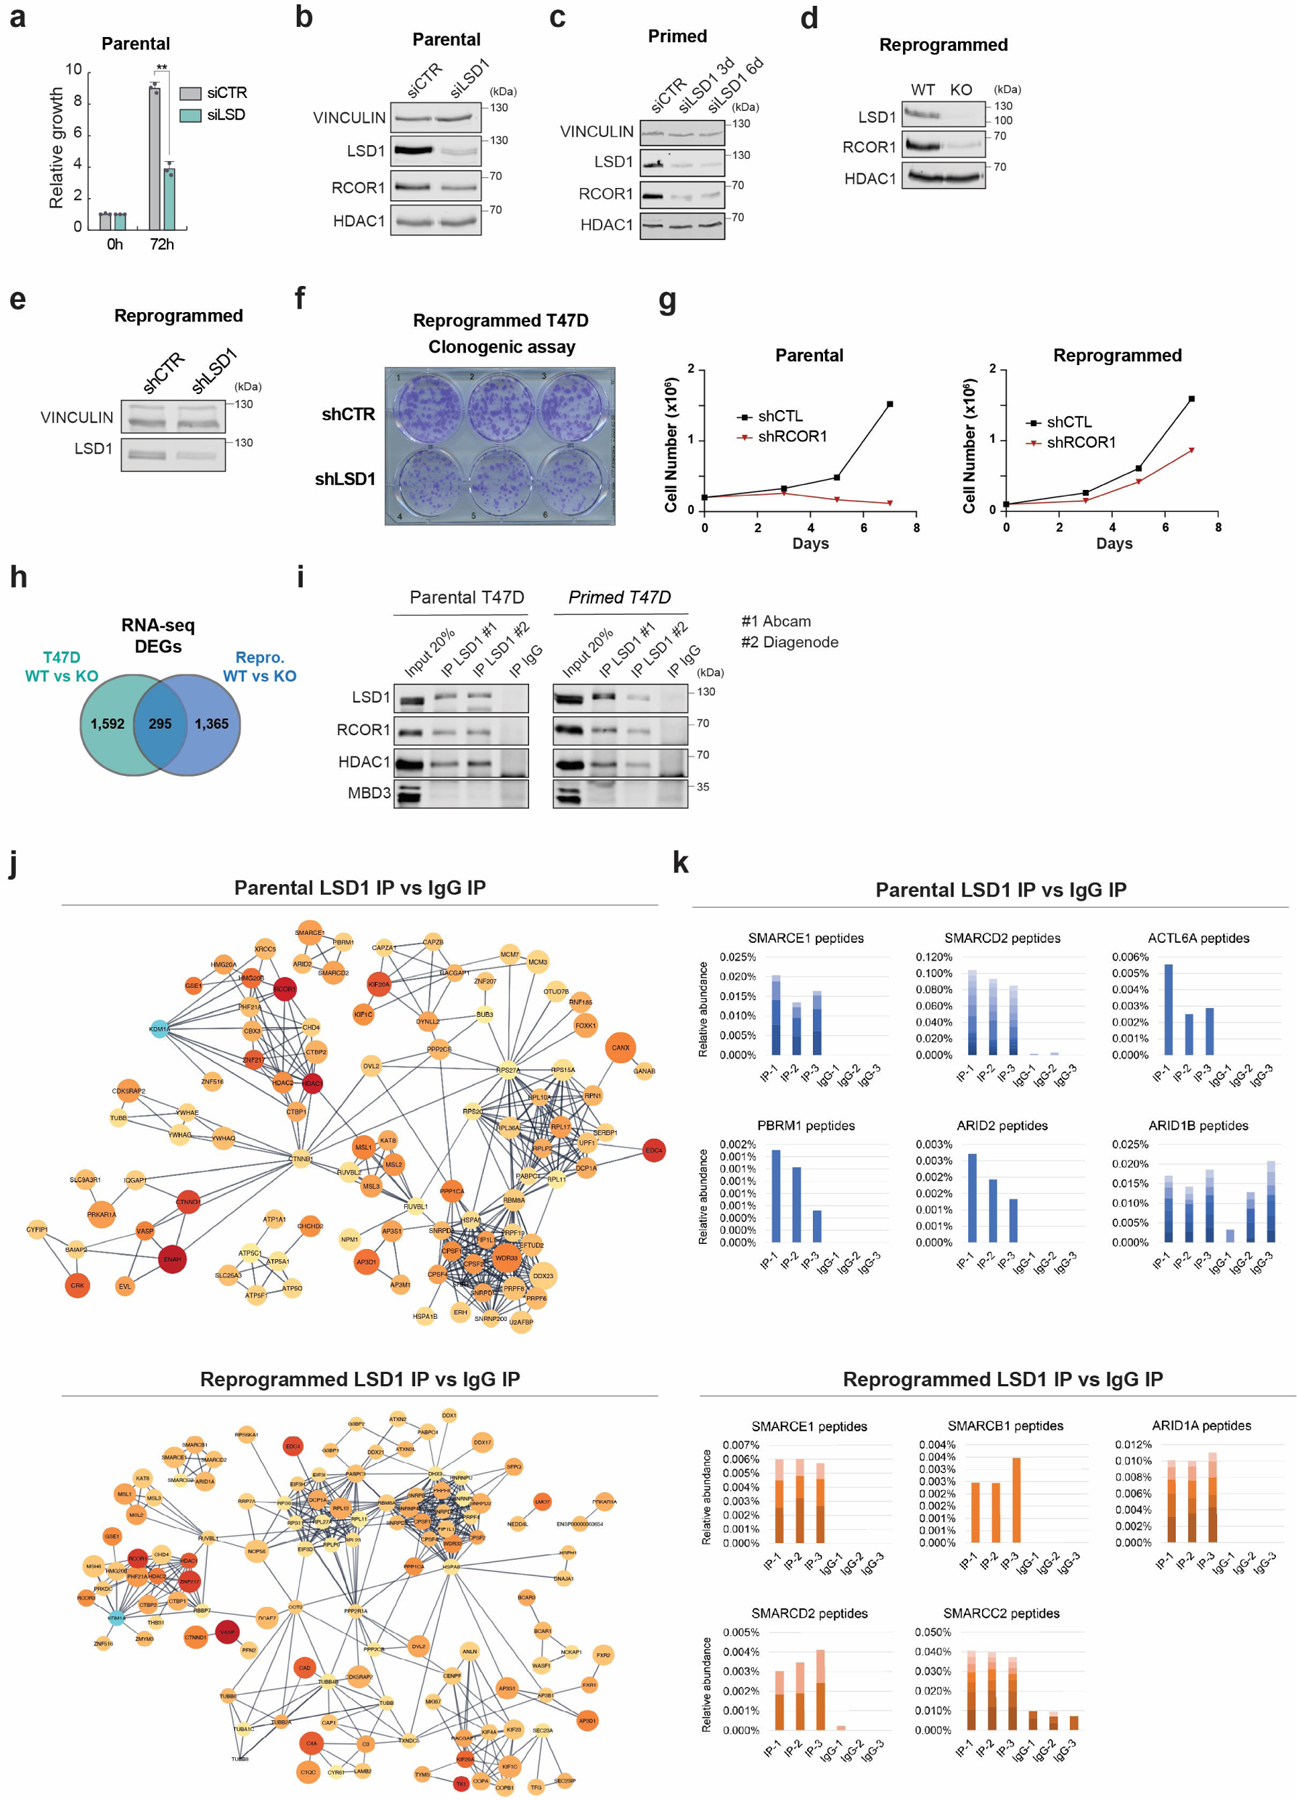
a, Proliferation of siLSD1 parental T47D 72h after siRNA transfection, n = 3 biological independent replicates. Data are presented as mean values + SEM. p-value < 0.005 (one-way ANOVA). b-e, WB of proteins indicated, with VINCULIN as the loading control, in siCTR and siLSD1 T47D 6 days after transfection (b), primed siLSD1 T47D 3- and 6-days post siRNA transfection (c) and in WT and KO reprogrammed T47D (d), and reprogrammed shCTR and shLSD1 T47D (e). f, Clonogenic assay of reprogrammed shLSD1 T47D, n = 3 biological independent replicates. g, Proliferation of shCTR and shRCOR1 parental and reprogrammed T47D for 7 days, n = 2 biological independent replicates. h, DEG overlap between parental and reprogrammed LSD1 KO T47D. i, Endogenous LSD1 immunoprecipitation (IP) with CoREST subunits in whole cell lysates using two antibodies in parental or primed T47D. IgG and MBD3 were used as negative controls. j, Interaction network of LSD1 interactome in parental and reprogrammed T47D. k, Relative peptide abundance of selected SWI/SNF subunits identified by LC-MS/MS in parental and reprogrammed T47D. IP = LSD1 IP, IgG = IgG IP. n = 3 biological independent replicates. Number of peptides are represented as shades of blue and orange. Uncropped images are available as source data.
Extended Data Fig. 4. LSD1-BAF interaction in endocrine sensitive and resistant cells.
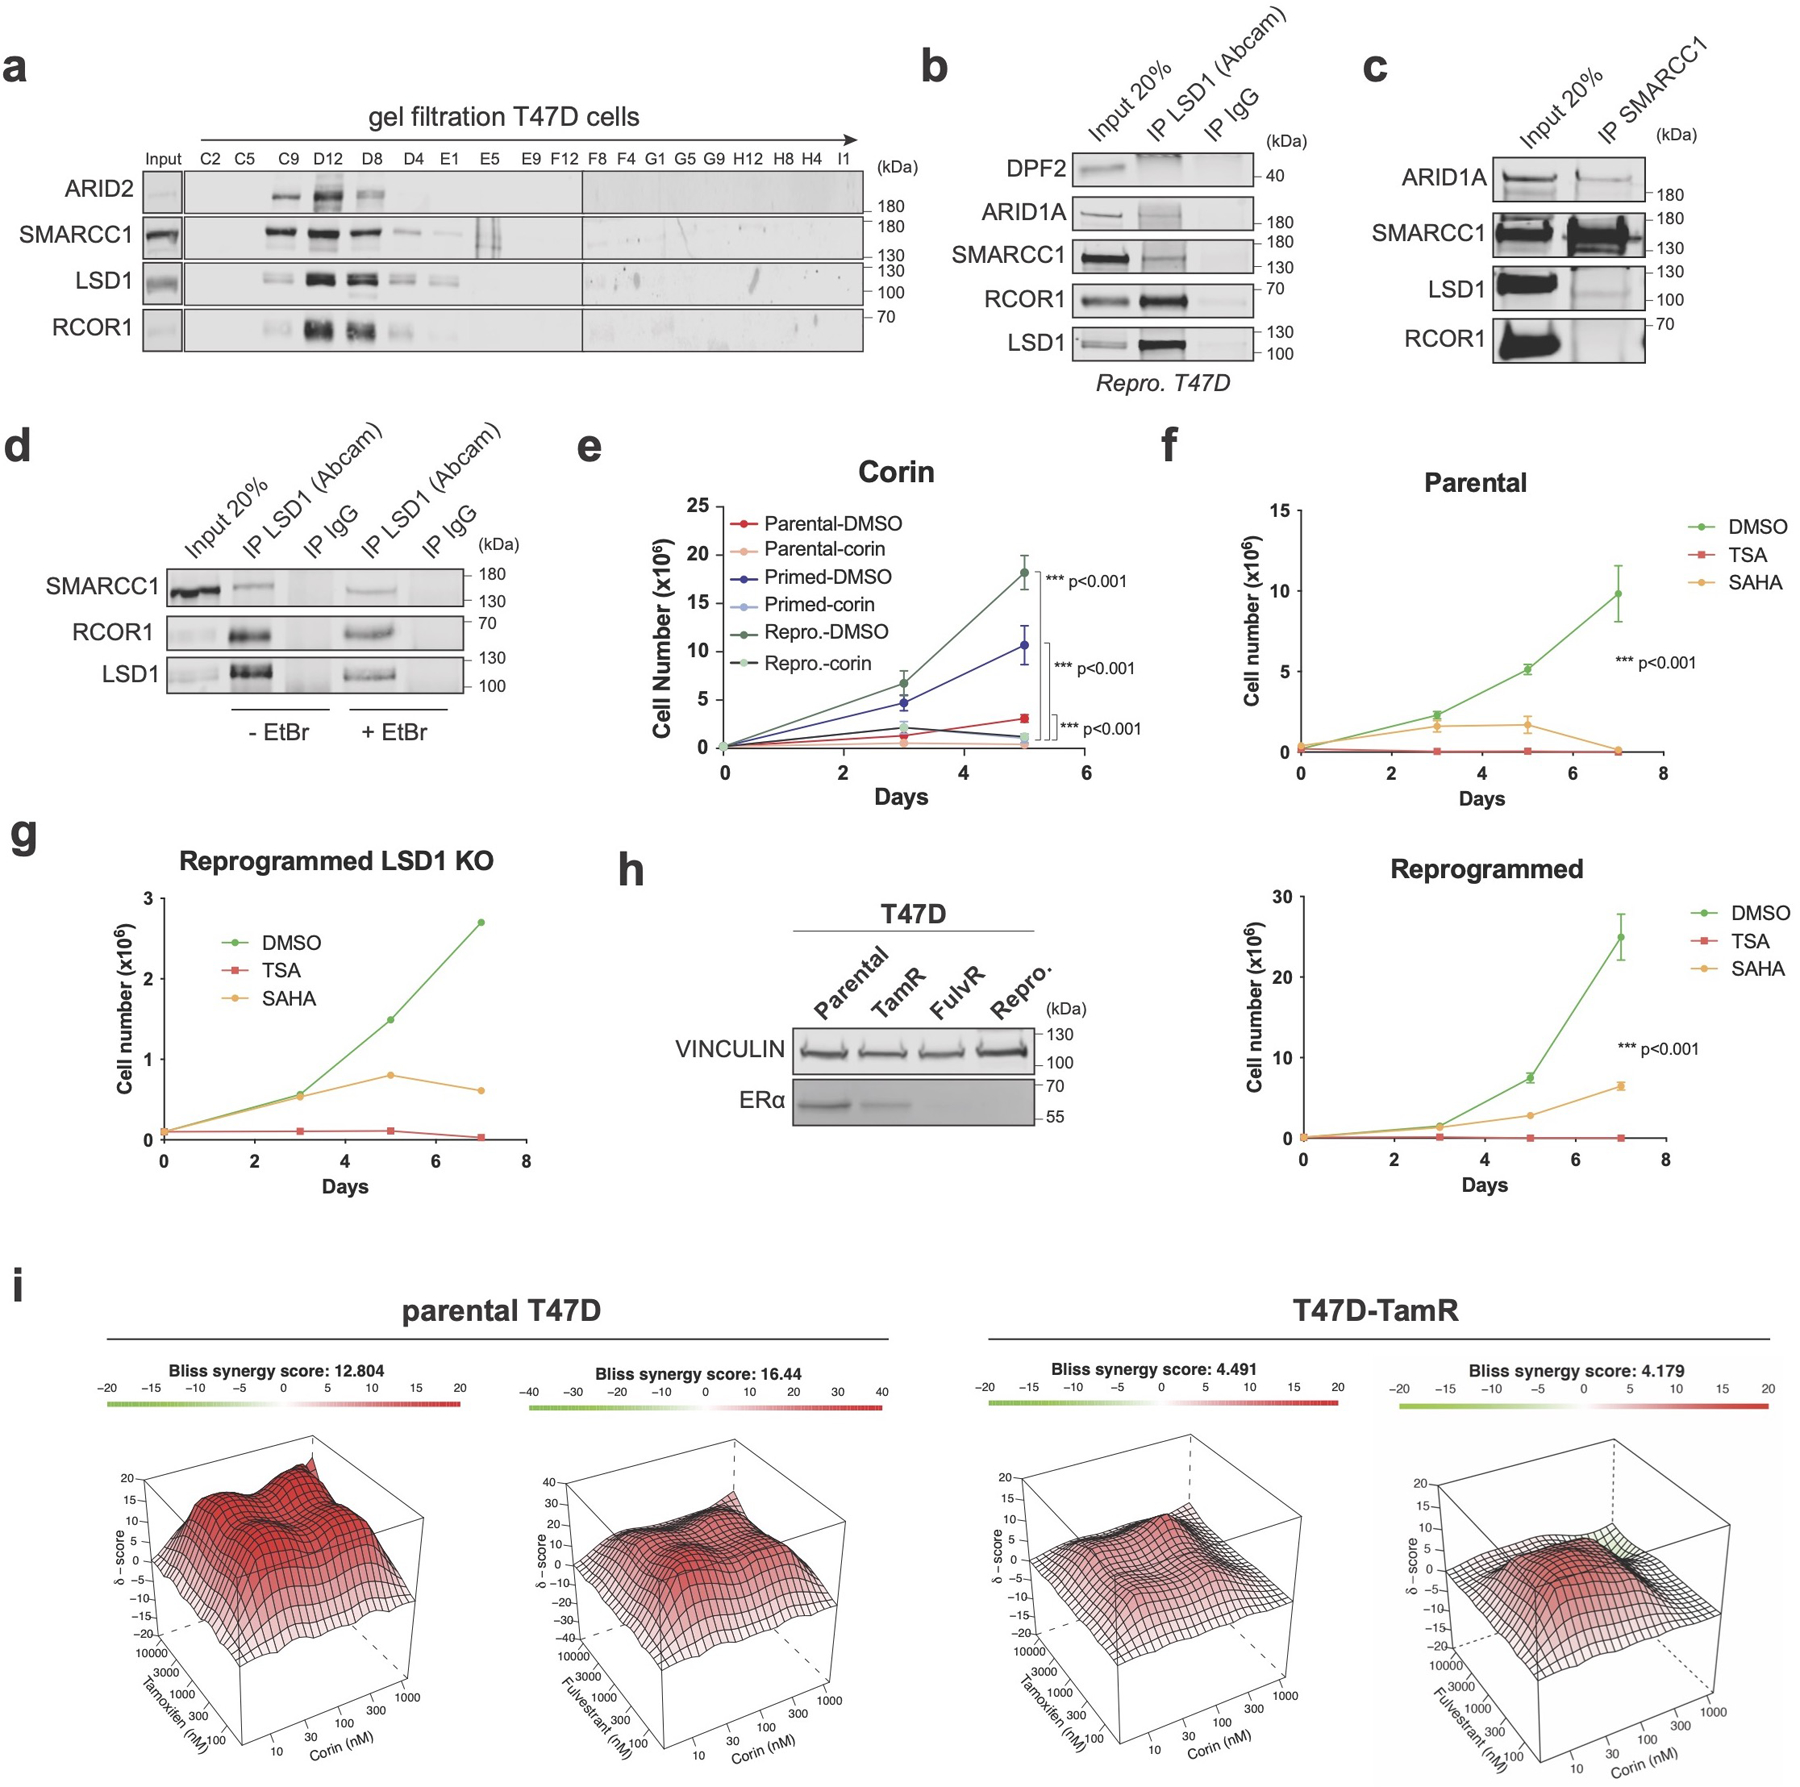
a, Superose 6 gel filtration in parental cells showing co-elution of LSD1, RCOR1, and members of the SWI/SNF complex (SMARCC1 and ARID2). b, LSD1 IP with SWI/SNF subunits in reprogrammed T47D. Note that the DPF2-LSD1 interaction was also not detected by LC-MS/MS (Fig. 2e). c, SMARCC1 IP with LSD1 in reprogrammed T47D. d, The LSD1-SMARCC1 interaction is DNA-independent. EtBr, ethidium bromide1. e-f, Proliferation of T47D treated with 1µM corin for 5 days (e), and TSA or SAHA for 7 days (f), n = 3 biological independent replicates. Data are presented as mean values + SEM, p-value < 0.001 (two-way ANOVA). g, Proliferation of WT and LSD1 KO reprogrammed T47D treated with TSA or SAHA for 7 days, n = 2 independent experiments. h, ERα WB in parental and endocrine resistant T47D lines with VINCULIN as a loading control. i, Synergy maps of parental and TamR T47D treated with tamoxifen and corin, or fulvestrant and corin. The 3D synergy matrix was generated with SynergyFinder 2.0, n = 3 biological independent replicates. Uncropped images are available as source data.
Extended Data Fig. 5. Mechanisms of action following CoREST chemical inhibition.
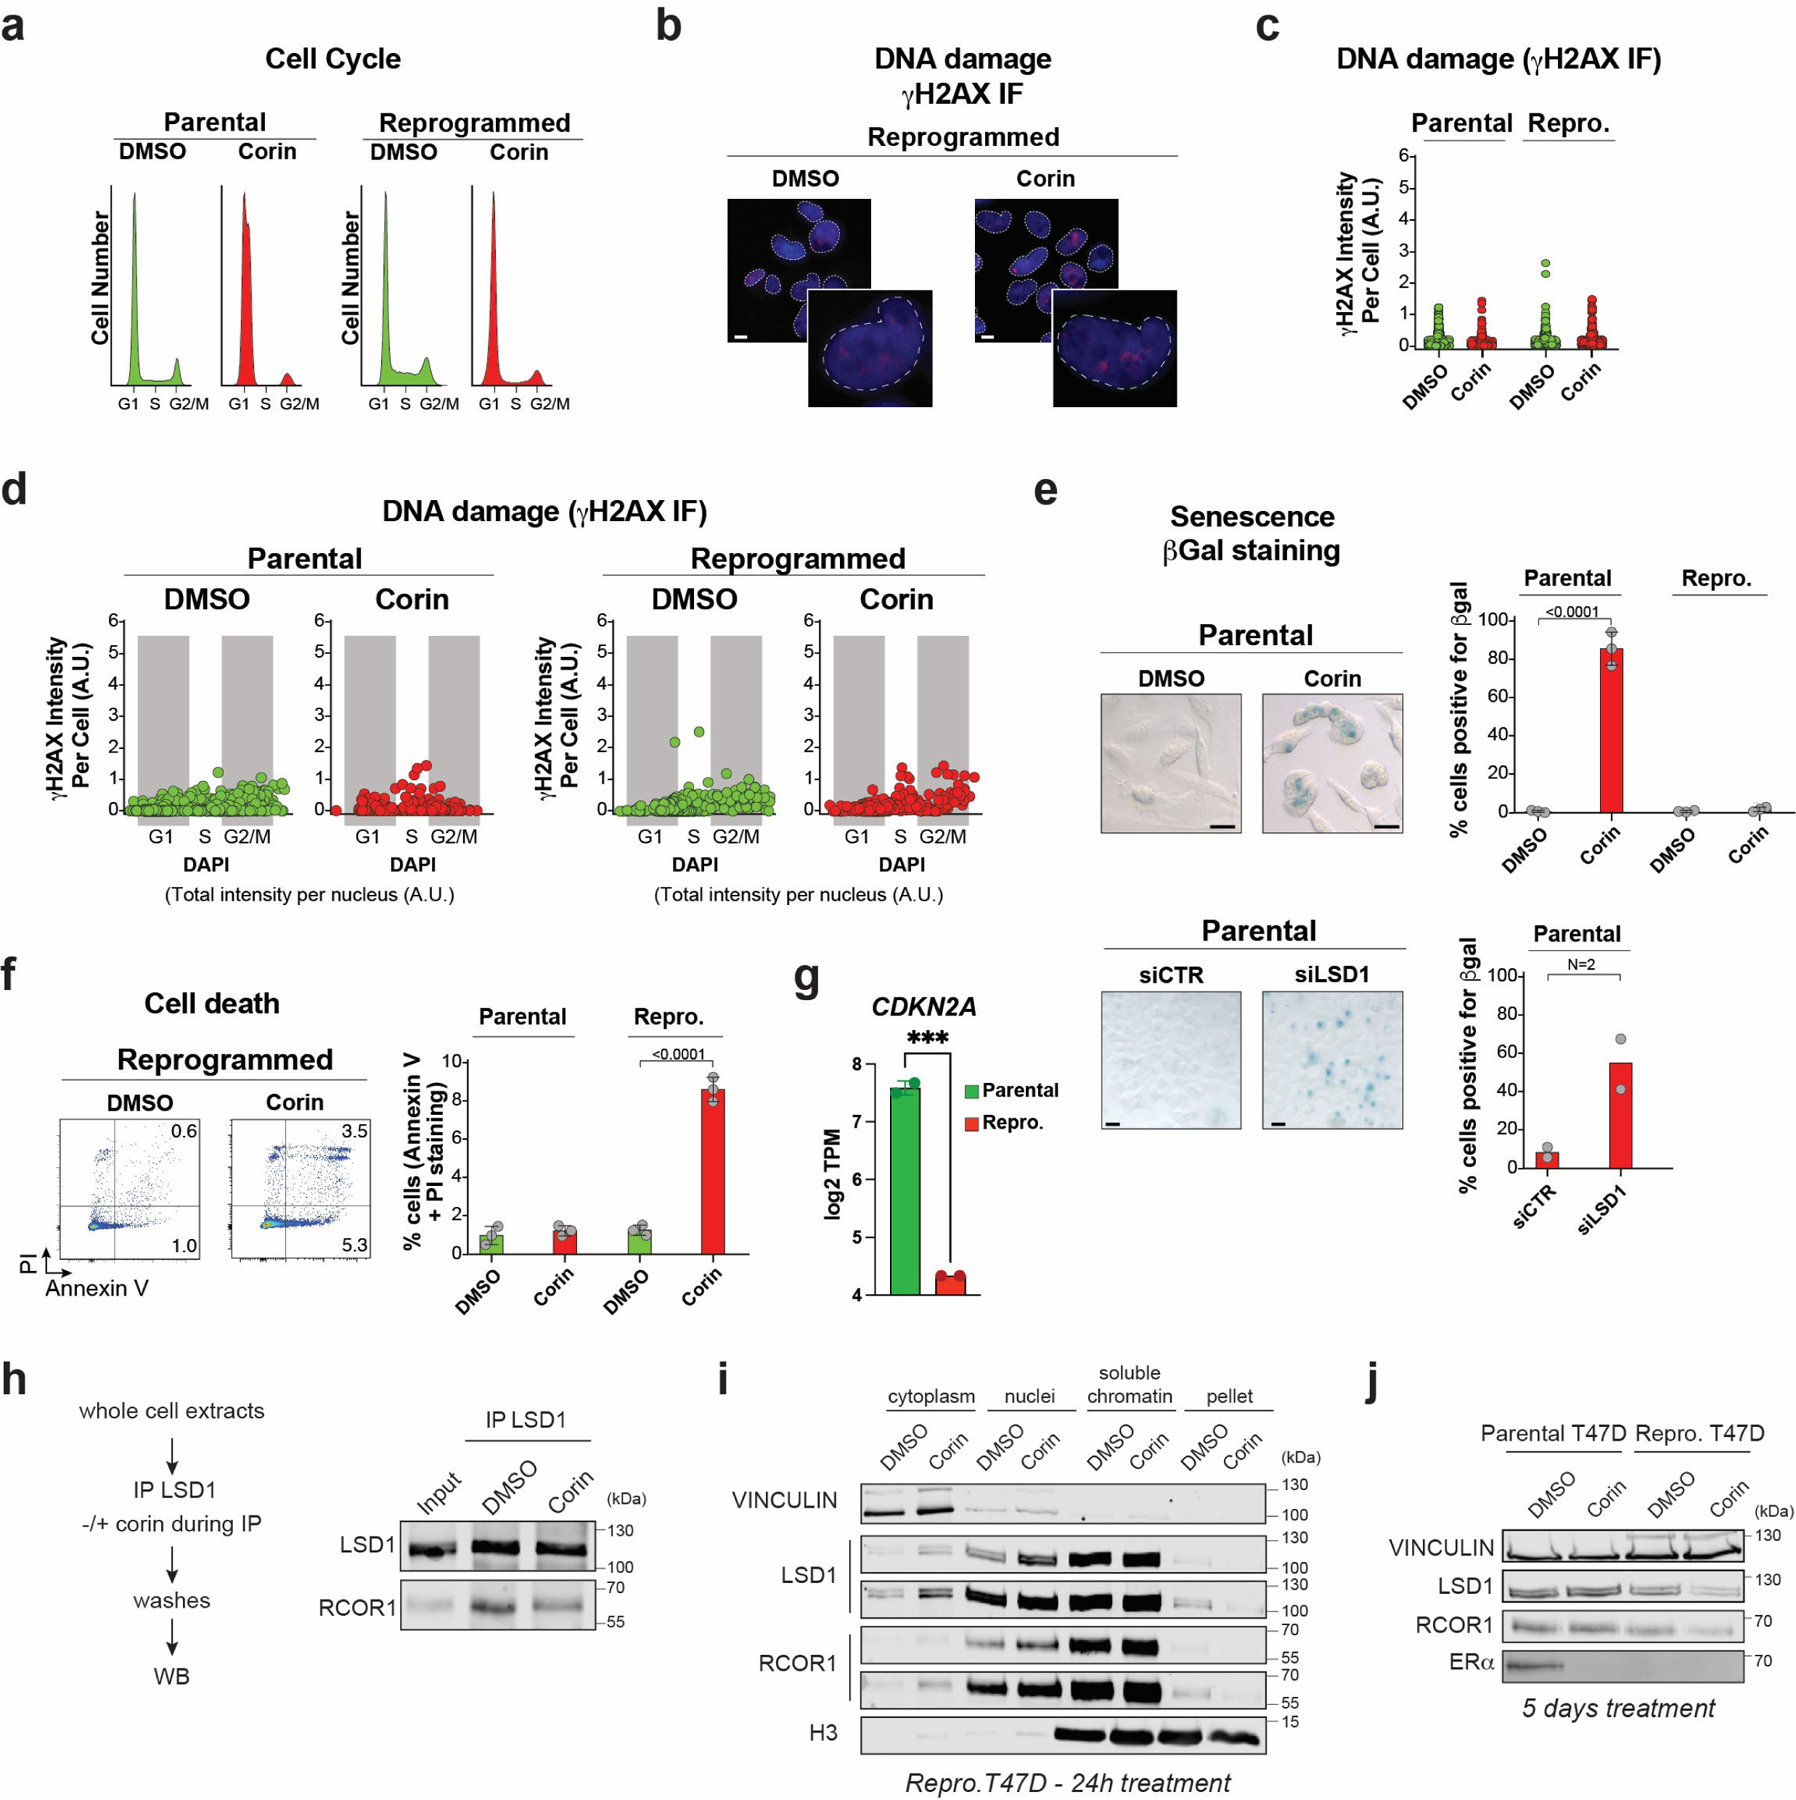
a-b, Cell cycle analysis (a) and representative γH2AX staining (b) 4 days after treatment with 500nM DMSO or corin. PI, propidium iodide (inset zoom = 4X, scale bar = 5μm). c, Quantification of γH2AX staining intensity from three biologically independent experiments; 200 cells per sample/experiment were analyzed. d, Quantification of the cell cycle distribution of γH2AX defined as the sum of the intensities of γH2AX foci per nucleus post-exposure to DMSO or 500nM corin and stained with DAPI. Data from 3 biologically independent experiments; 200 cells per sample/experiment were analyzed. e-f, Representative images (left) and quantification (right) of ß-galactosidase (e) or PI/Annexin V (f) staining following exposure to DMSO or 500nM corin for 4 days, n = 3 biological independent replicates (two-way ANOVA, scalebar = 10μm), or LSD1 depletion, n = 2 biological independent replicates. g, CDKN2A (encoding p16) log2 TPM values in parental and reprogrammed T47D. (p-value = 0.0007, Two-tailed unpaired t-test), n = 2 biological independent replicates. h, The LSD1-RCOR1 interaction in reprogrammed whole cell lysate is destabilized in the presence of 1µM corin. i, Cellular fractionation of reprogrammed cells treated with 500nM corin for 24h. Two different exposures are shown for LSD1 and RCOR1. j, WB of proteins indicated on the left from parental and reprogrammed cells treated with 1µM of corin for 5 days. Uncropped images are available as source data.
Extended Data Fig. 6. LSD1/CoREST genomic occupancy during reprogramming LSD1 ChIP-qPCR.
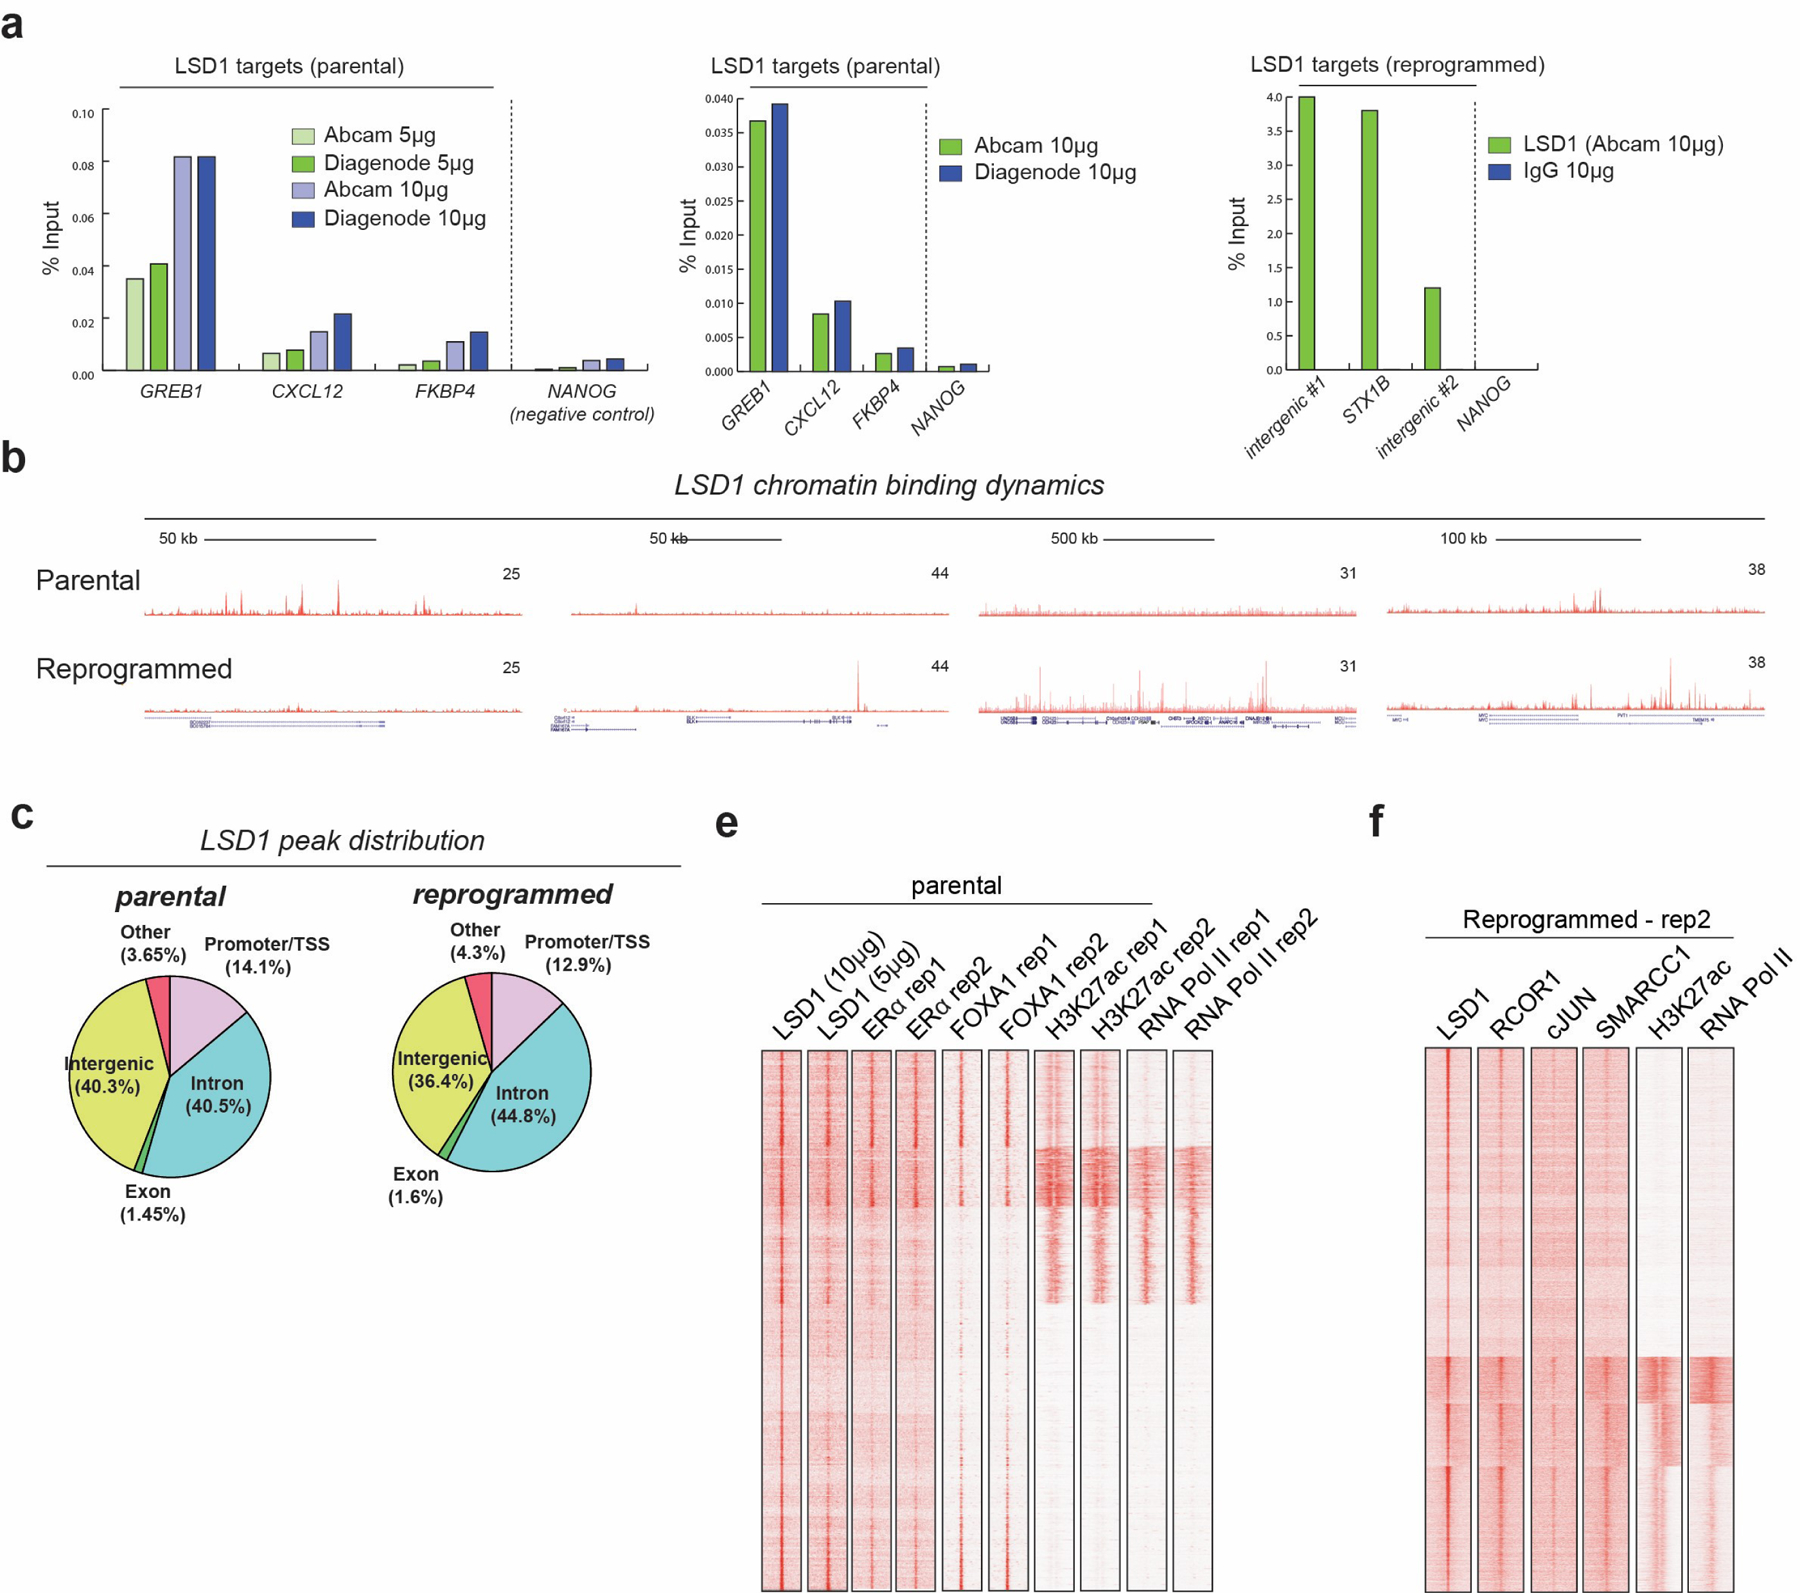
Validation of LSD1 ChIP-seq with two different LSD1 antibodies and concentrations in parental T47D, n = 2 biological independent replicates. NANOG was used as a negative control. Validation of LSD1 ChIP-seq in reprogrammed cells. NANOG was used as a negative control. b, LSD1 ChIP-seq signal at selected genomic regions. c, LSD1 ChIP-seq peak distribution. e-f, ChIP-seq signal of biological replicates in parental and reprogrammed cells.
Extended Data Fig. 7. Analysis of T47D-ERαY537S and role of the LSD1 paralog, LSD2.
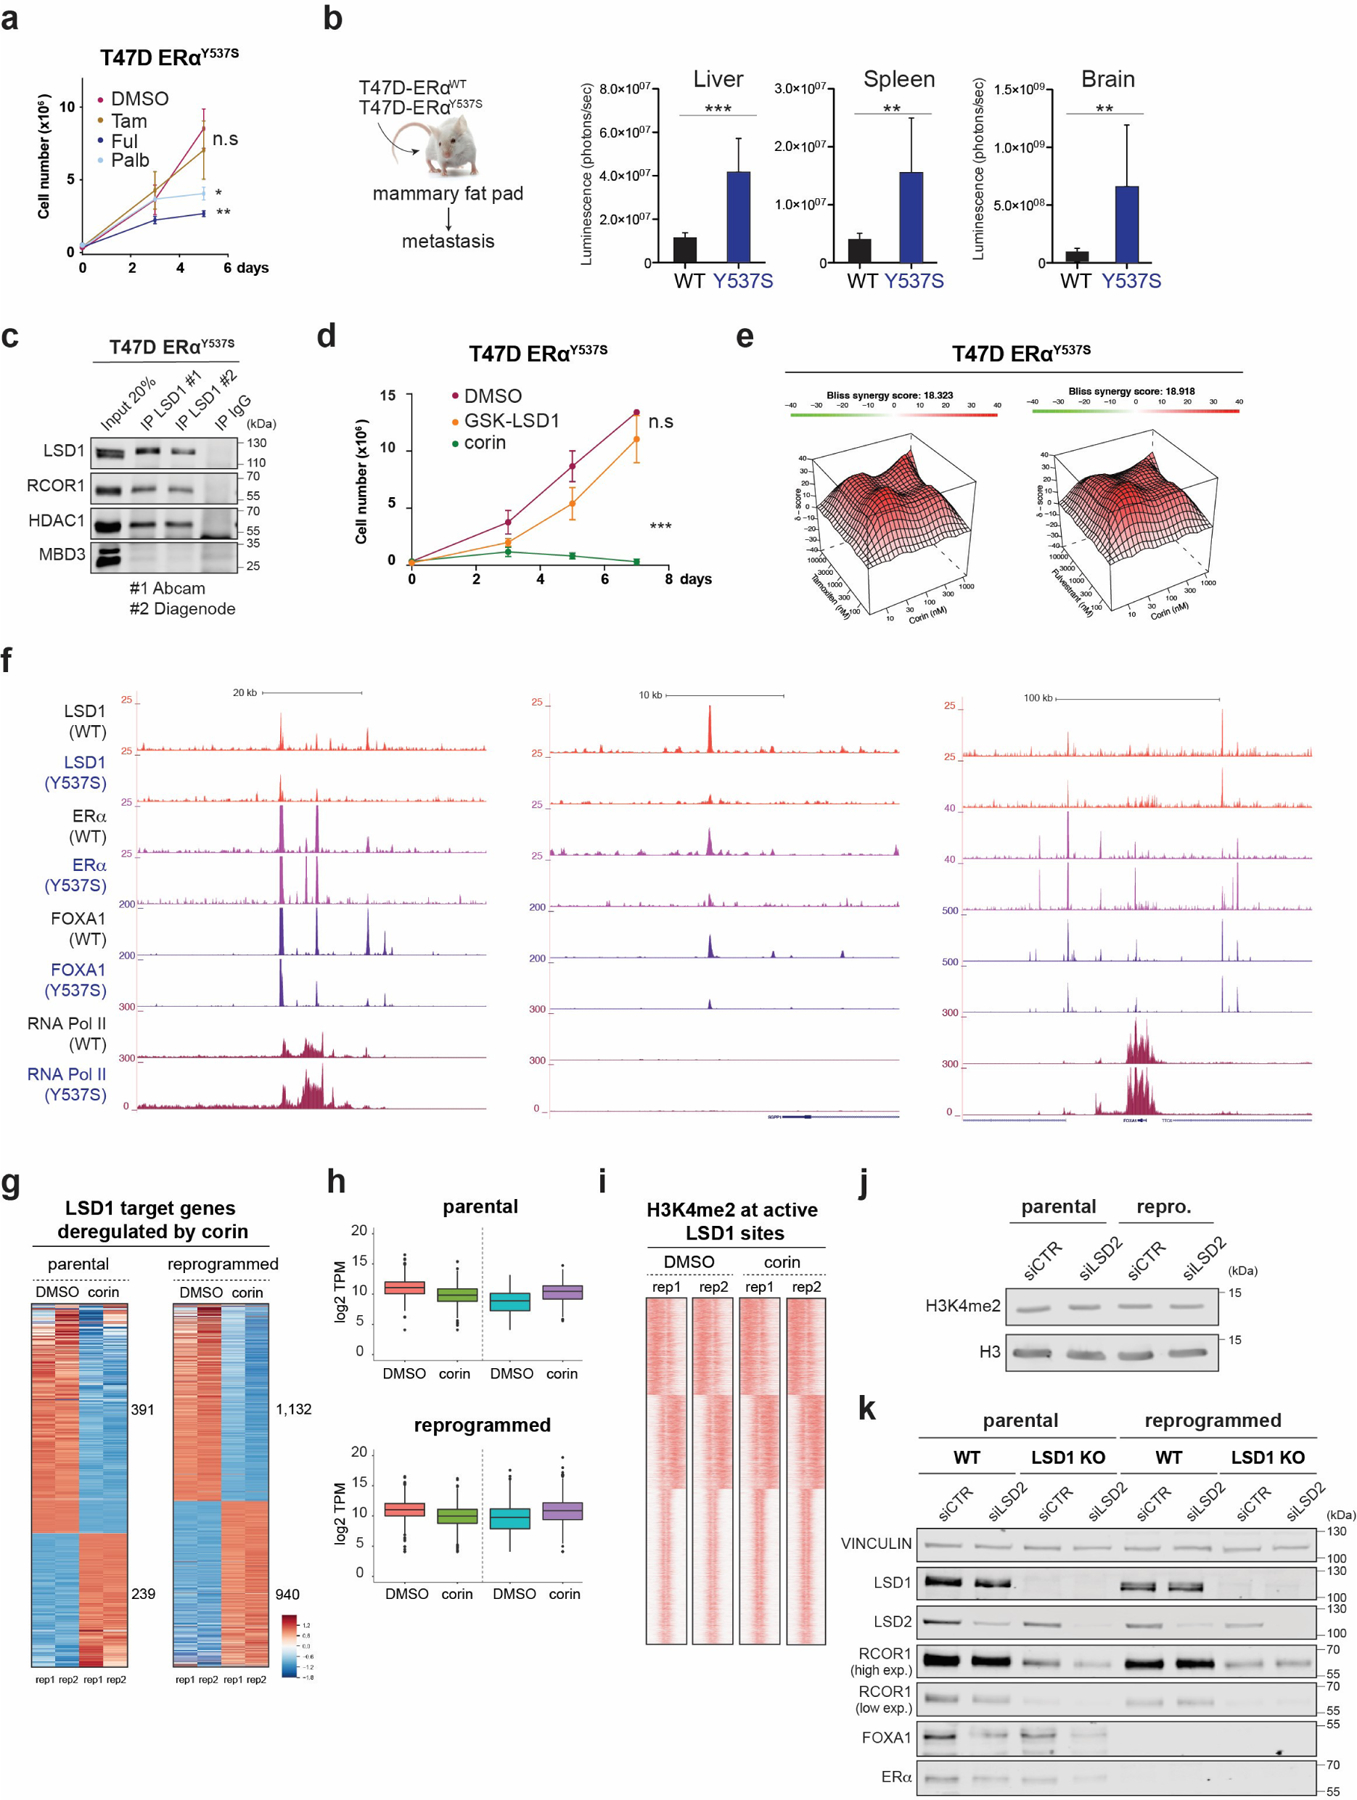
a, Growth curves of 2 × 10⁵ T47D-ERαY537S cells cultured with 1µM of tamoxifen, fulvestrant, or palbociclib for 5 days, n = 3 biological independent replicates. Data are presented as mean values + SEM, **p-value < 0.01, *p-value < 0.05 (two-way ANOVA). b, Parental and T47D-ERαY537S expressing luciferase were transplanted into the mammary fat pad of NSG mice (n = 8 biological replicates). Data are presented as mean values + SEM. Metastasis was analyzed by IVIS 45 days after orthotopic injection. ***p-value < 0.001, **p-value < 0.01 (two-way ANOVA). c, Endogenous LSD1 immunoprecipitation (IP) in whole cell lysates with CoREST subunits using two antibodies in parental or primed T47D. IgG and MBD3 were used as negative controls. d, Growth curves of 2 × 10⁵ T47D-ERαY537S cells cultured with 1µM of GSK-LSD1 or corin for 7 days, n = 3 biological independent replicates. Data are presented as mean values + SEM, p-value < 0.001 (two-way ANOVA). e, Synergy maps for T47D-ERαY537S cells treated with tamoxifen and corin, or fulvestrant and corin. The 3D synergy matrix was generated with SynergyFinder 2.0. n = 3. f, LSD1, ERα, FOXA1, and RNA Pol II ChIP-seq signal at selected genomic regions in parental and T47D-ERαY537S cells. g-h, RNA-seq heat maps (g) and TPM values (h) of differentially expressed LSD1 target genes in parental and reprogrammed T47D treated with corin (500nM, 72h), n=2 biologically independent samples. The box plots span from the 25th to 75th percentiles, the center line shows the median and whiskers show maximum and minimum values. i, H3K4me2 ChIP-seq signal at LSD1 target genes in parental and reprogrammed cells treated with corin (500nM, 72h). j, H3K4me2 WB of acid-extracted histones from parental and reprogrammed siCTR and siLSD2 cells. k, WB of proteins indicated from parental and reprogrammed WT and LSD1 KO T47D transfected with siCTR or siLSD2. Uncropped images are available as source data
Extended Data Fig. 8. CoREST genomic occupancy and role in cJUN and SMARCC1 chromatin recruitment during reprogramming.
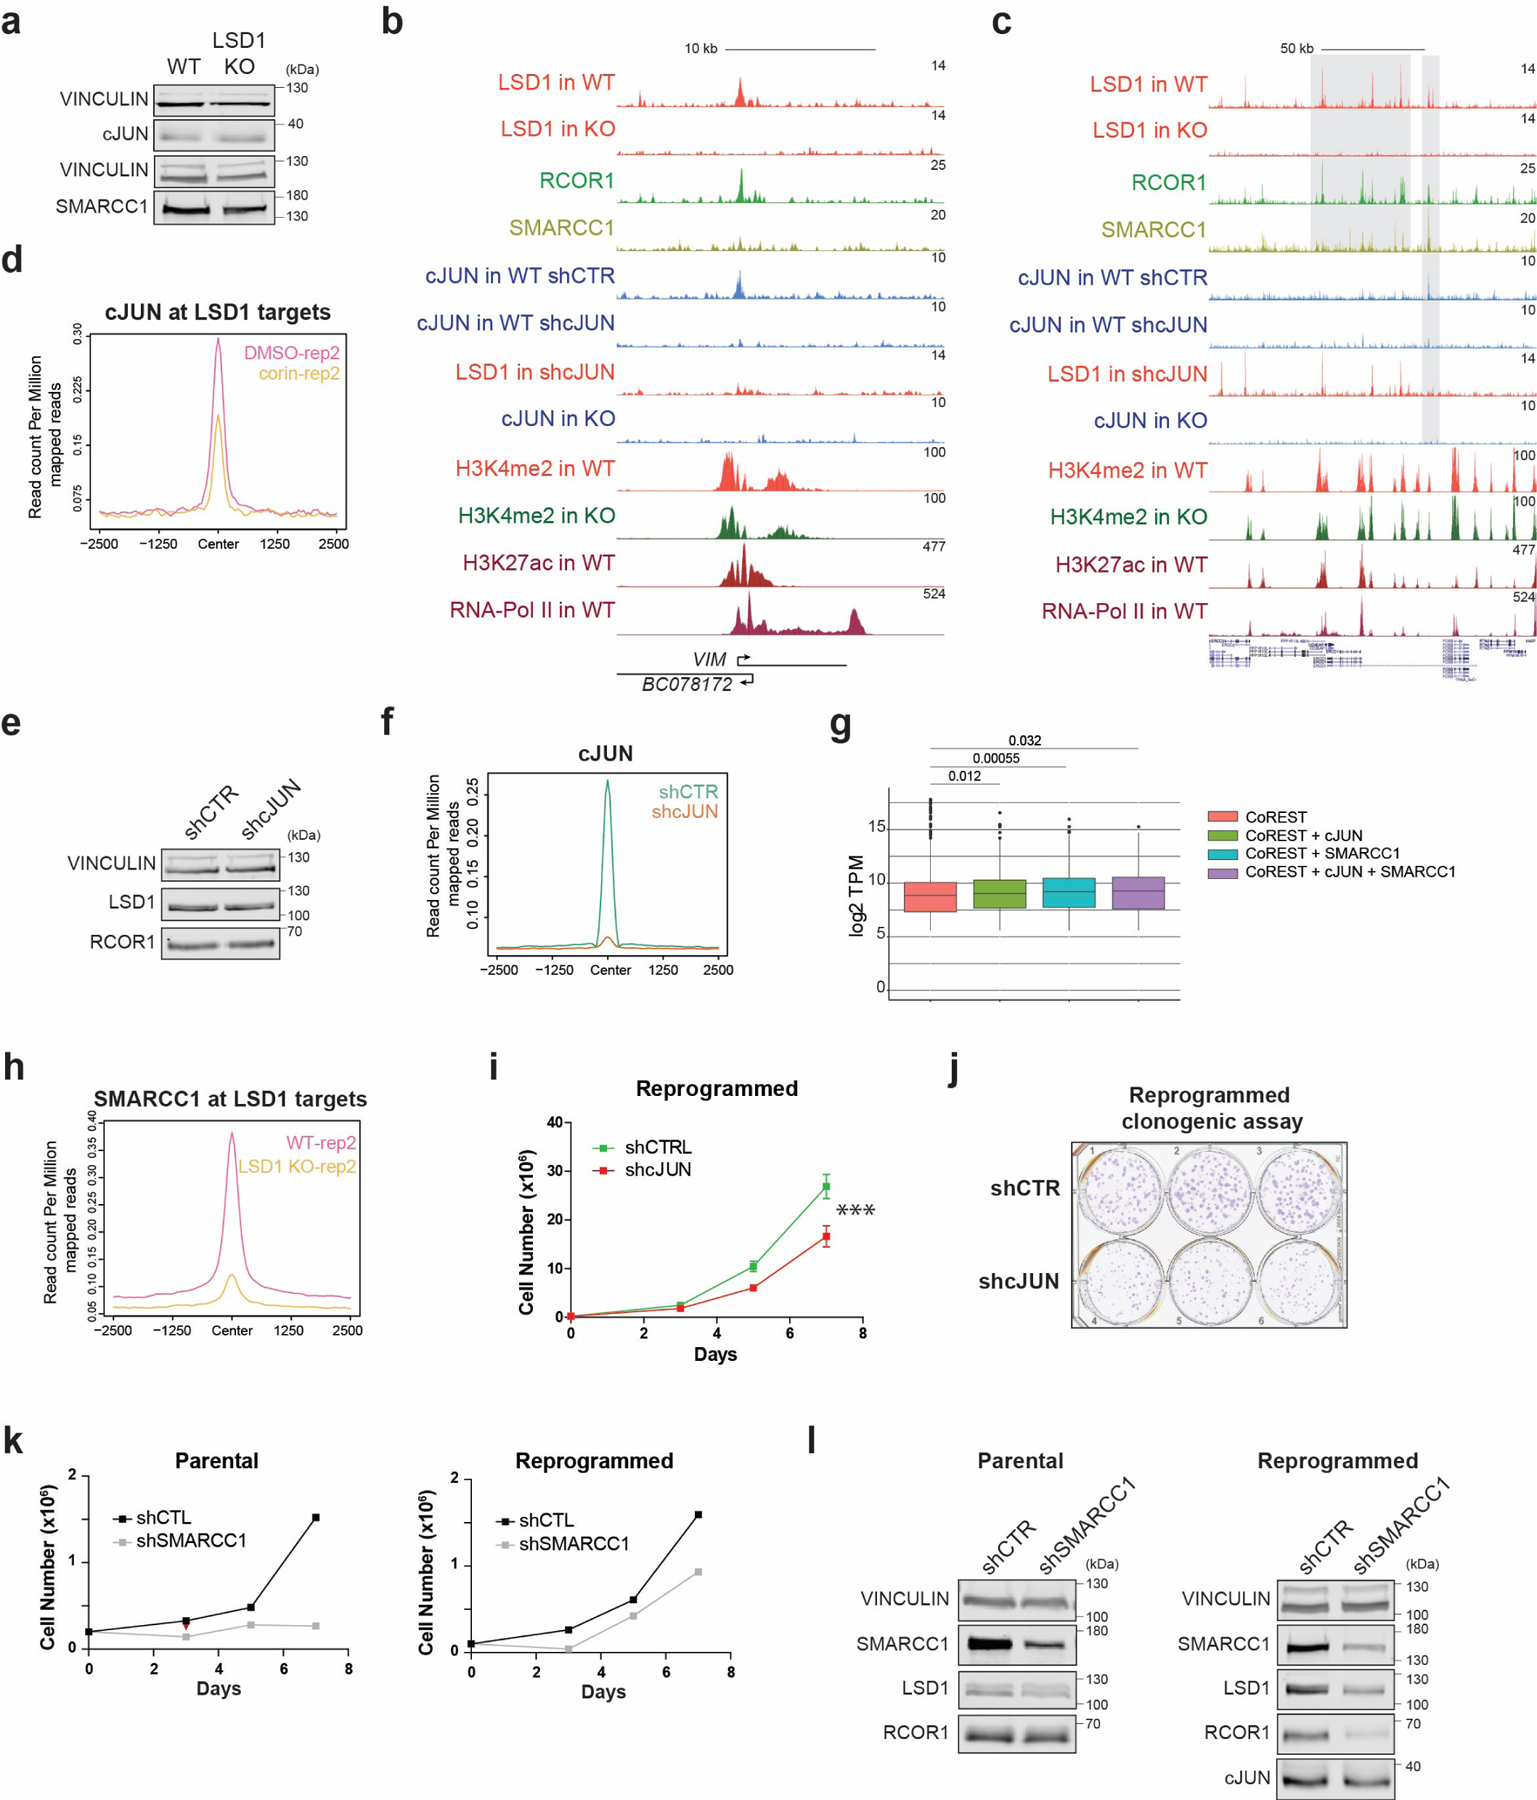
a, cJUN and SMARCC1 WB in reprogrammed control and LSD1 KO T47D. b-c, ChIP-seq signal of factors indicated in reprogrammed WT, LSD1 KO, shCTR and shcJUN T47D at selected regions. d, Second biological replicate of cJUN ChIP-seq in reprogrammed T47D treated with 500nM corin for 72h. e, LSD1 WB in reprogrammed shCTR and shcJUN T47D. f, cJUN ChIP-seq in shCTR and shcJUN reprogrammed cells. g, TPM values of genes identified in each co-occupancy profile (significance determined by the Mann-Whitney test, two-sided), n=2 biologically independent samples. The box plots span from the 25th to 75th percentiles, the center line shows the median and whiskers show maximum and minimum values and statistical significance determined by the Mann-Whitney test). h, Second biological replicate of SMARRC1 ChIP-seq signal in reprogrammed WT and LSD1 T47D. i-j, Proliferation (i) and survival (j) of shCTR and shcJUN reprogrammed T47D. n = 3 independent transductions. Data are presented as mean values + SEM, p-value < 0.001 (two-way ANOVA). k, Proliferation of shCTR and shSMARCC1 parental and reprogrammed T47D, n = 2 biologically independent experiments. l, SMARCC1, LSD1, RCOR1, and cJUN WB in shCTR and shSMARCC1 parental and reprogrammed T47D. Uncropped images are available as source data.
Extended Data Fig. 9. Extended characterization of the CoREST role in chromatin accessibility.
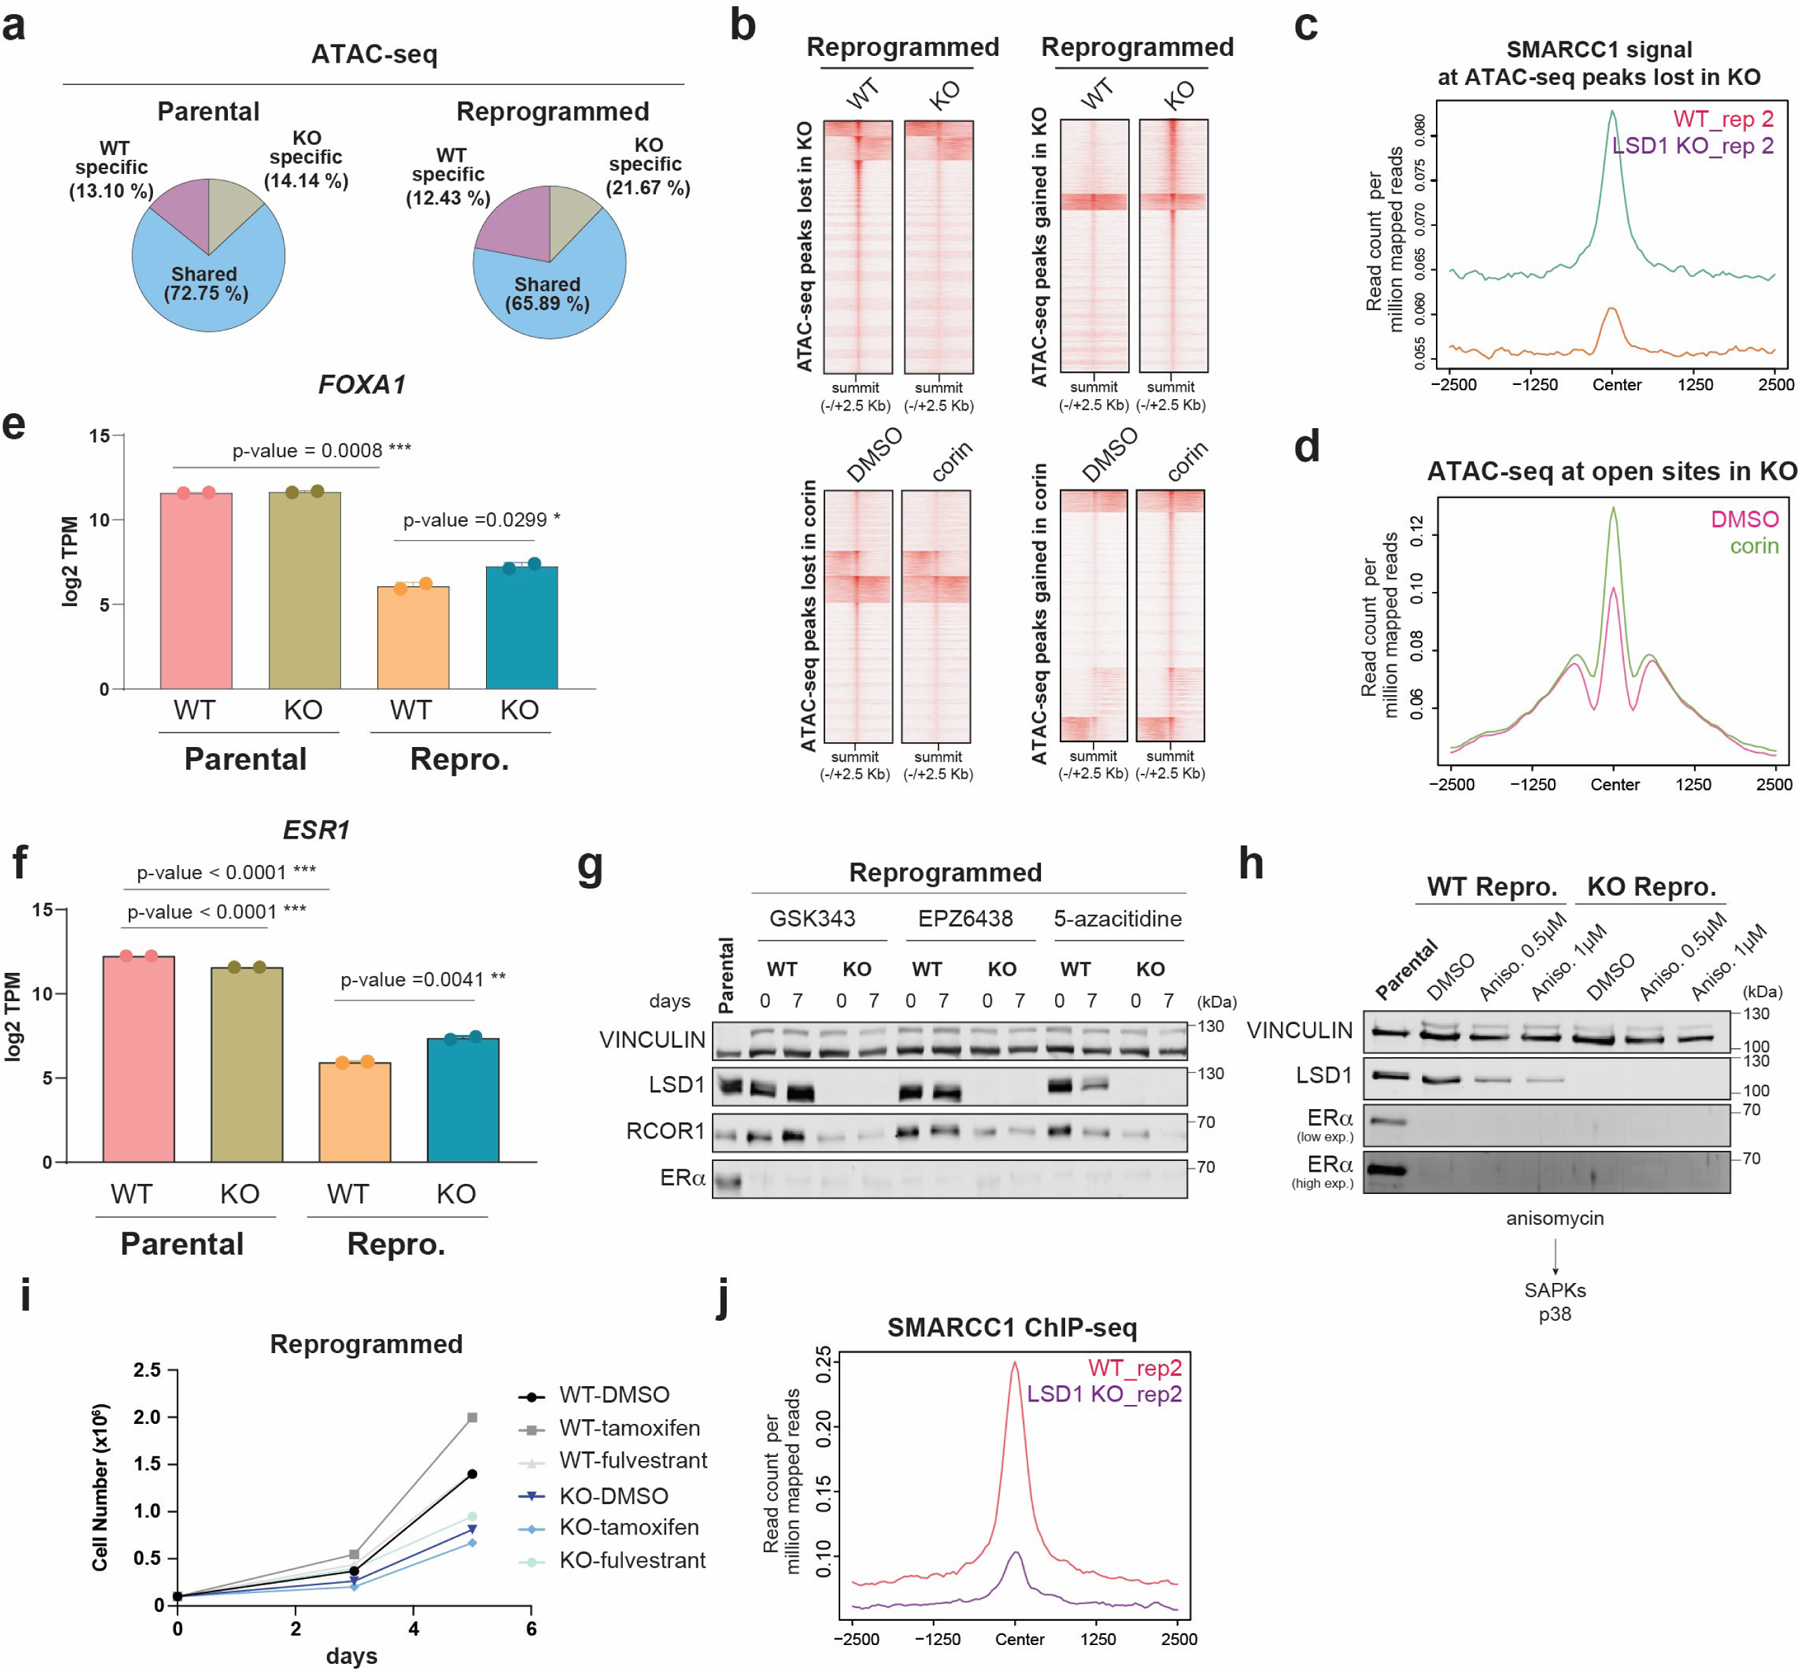
a, Percentage of common and specific ATAC-seq peaks in parental and reprogrammed WT and LSD1 KO T47D. b, ATAC-seq signal in WT and LSD1-KO reprogrammed T47D (top) and cells treated with 500nM corin for 72h (bottom). c, Second biological replicate of SMARCC1 ChIP-seq signal in WT and LSD1 KO from analysis in Fig. 6d. d, ATAC-seq signal in reprogrammed T47D treated with 500nM corin for 72h at accessible sites in LSD1 KO cells that are inaccessible in WT cells. e, log2 TPM values of FOXA1 expression in WT and KO LSD1 parental and reprogrammed cells, n=2 from biological independent experiments. Data are presented as mean values + SD, unpaired t-test, two-sided, p values (parental vs reprogrammed=0.0008, reprogrammed WT vs KO=0.0299). f, log2 TPM values of ESR1 in parental and reprogrammed WT and LSD1 KO T47D, n=2 biologically independent samples Data are presented as mean values + SD, unpaired t-test, two-sided, p values (parental vs reprogrammed<0.0001, parental WT vs KO<0.0001, reprogrammed WT vs KO=0.0041. g-h, WB of LSD1, RCOR1, and ERα from whole cell extracts of reprogrammed WT and LSD1 KO T47D cultured for 7 days in the presence of 1µM PRC2i EPZ6438, GSK343, and DNMTi 5-azacitidine (g) or anisomycin (h). i, Proliferation of WT and LSD1 KO reprogrammed T47D cells treated with 1µM of tamoxifen or fulvestrant for 5 days. j, Second biological replicate of SMARCC1 ChIP-seq signal in WT and LSD1 KO from analysis in Fig. 6j. Uncropped images are available as source data.
Extended Data Fig. 10. Characterization of primed, CD24+, and CD44+ primed cells in vivo and proliferation defects of LSD1 depletion in TNBC.
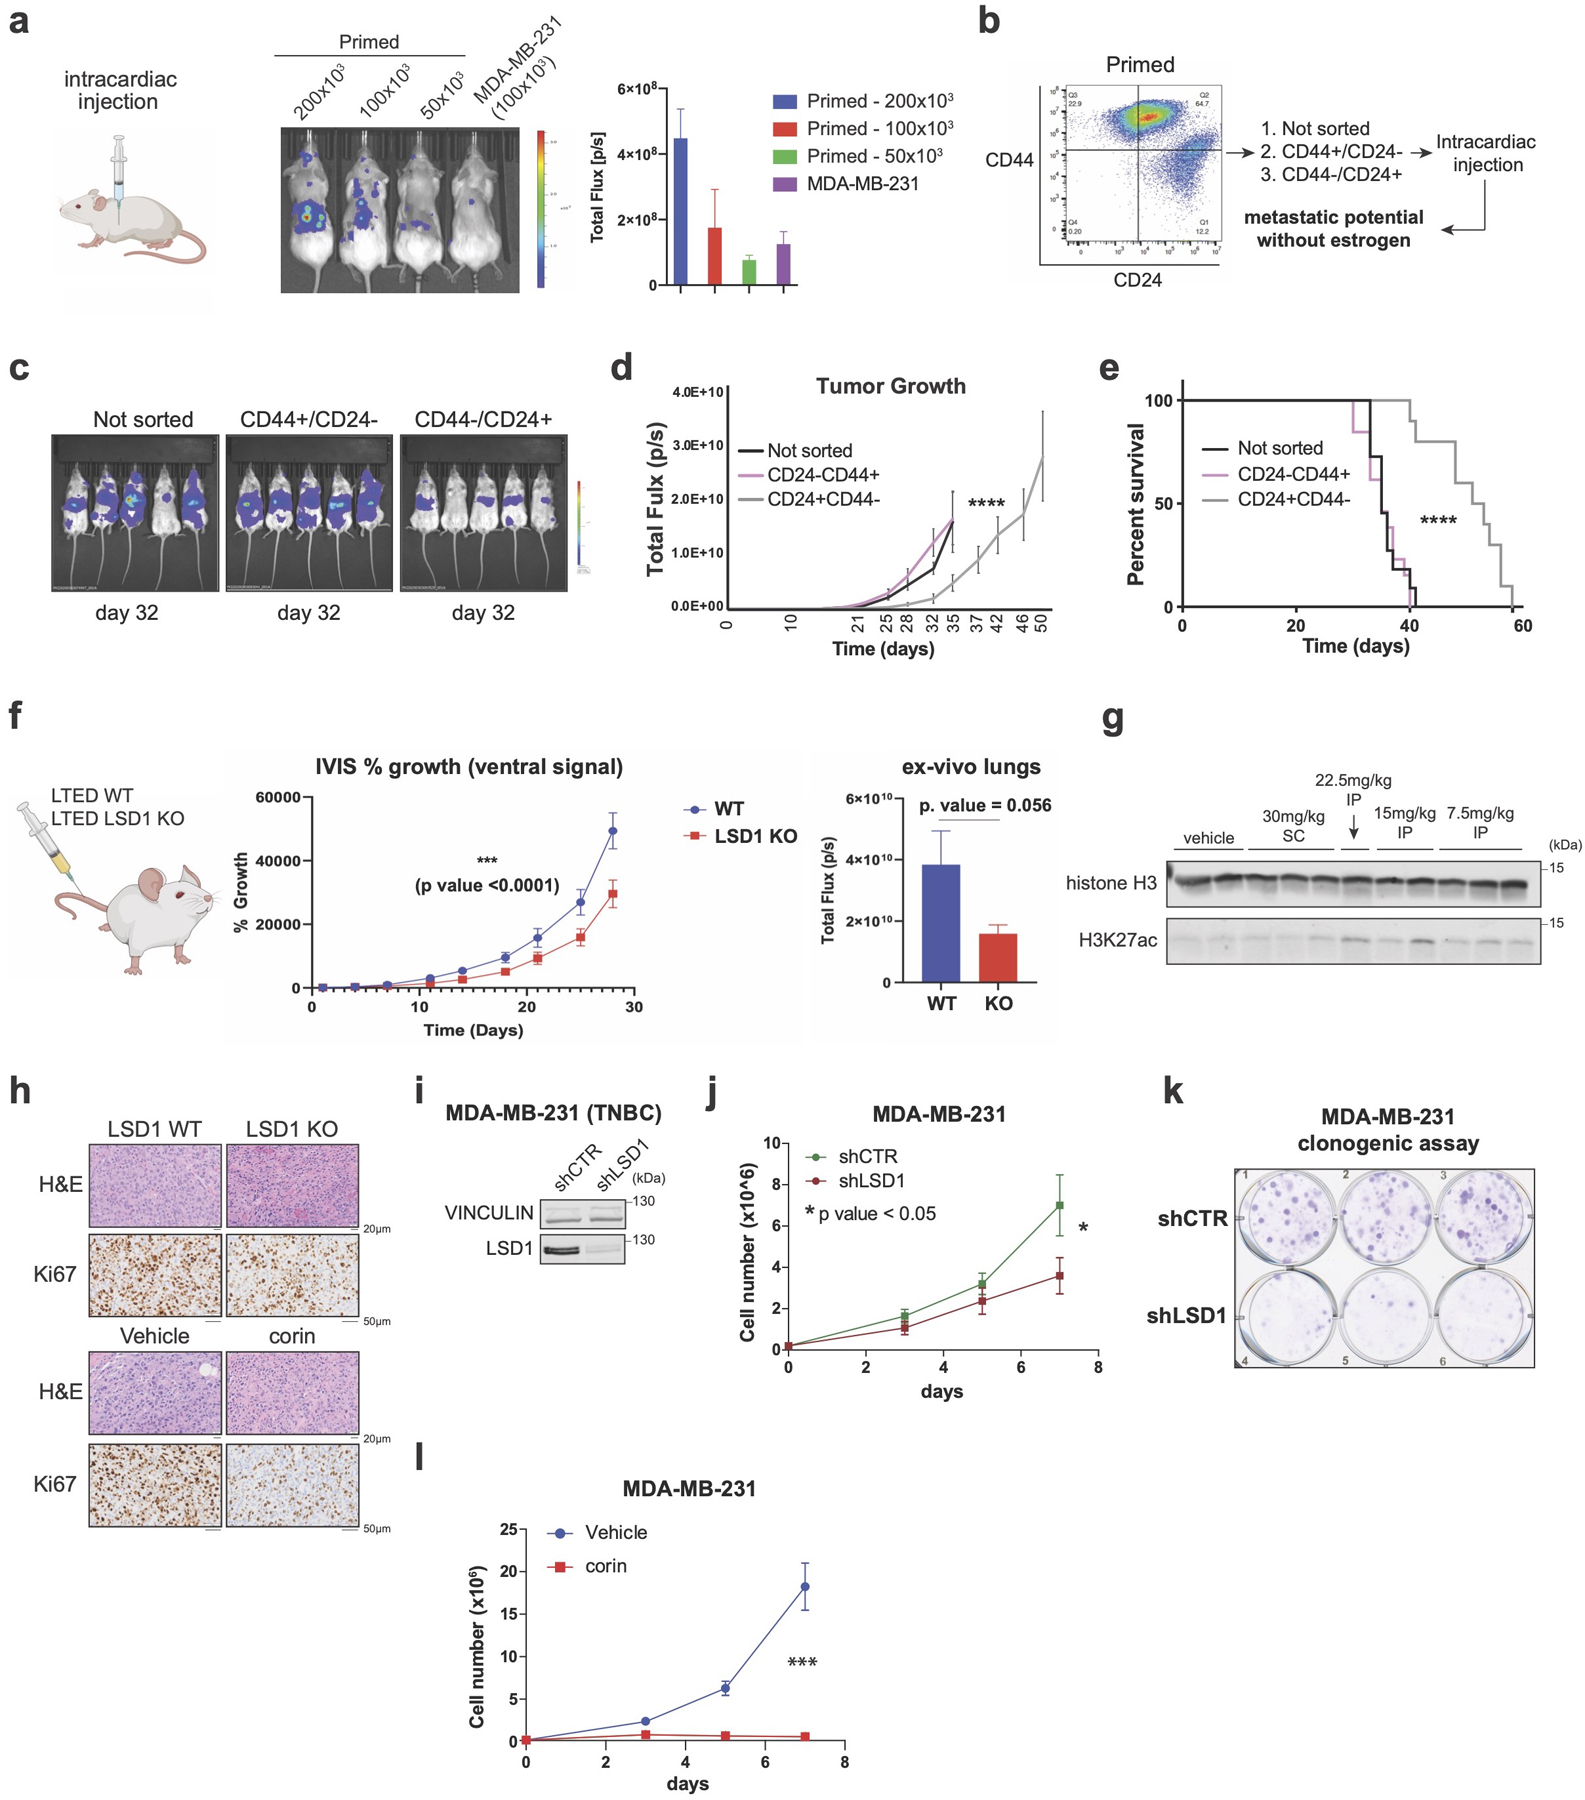
a, Schematic (left) and representative IVIS images of mice (right) injected with serial dilutions of primed T47D and 1×10⁵ MDA-MB-231 (positive control, n = 3/group, data presented as mean values + SEM). b-c, FACS (b) and representative IVIS images at day 32 post-intracardial injection (c) of sorted CD24+ and CD44+ primed T47D two weeks after sorting without estrogen supplementation (n = 5/group). d-e, Tumor size quantification (d) (****p-value < 0.0001, data presented as mean values + SEM) and survival of mice (e) (**** p-value < 0.0001, Log-rank [Mantel-Cox test]). f, Metastasis quantification from WT and LSD1 KO reprogrammed T47D. *** (p-value < 0.0001, Two-way RM ANOVA). 50,000 cells were injected in the tail vain (n = 10 /group, ). g, WB of H3K27ac from liver extracts of mice treated with increasing concentrations of corin. SC, subcutaneous. IP, intraperitoneal. Histone H3 was used as a loading control. h, Representative hematoxylin and eosin (H&E) and Ki67 staining in WT LSD1 or KO (top) and corin treated tumors (bottom). i, LSD1 WB from total extracts of shCTR and shLSD1 MDA-MB-231. j, Effect of LSD1 knockdown on MDA-MB-231 proliferation (p-value =0.0255, unpaired t-test), n=3 independent infections and experiments, data presented as mean values + SEM. k, Clonogenic assay of shCTR and shLSD1 MDA-MB-231 performed in three biological and three technical replicates. l, Proliferation of MDA-MB-231 treated with 1µM corin for 7 days, n = 3 biological independent experiments. Data presented as mean values + SEM, p-value < 0.001 (two-way ANOVA). Uncropped images are available as source data.
Supplementary Material
Acknowledgments
We are indebted to Ho Lam Chan for scientific editing, members of the Morey laboratory for discussions, and the Oncogenomics Core Facility, Cancer Modeling Shared Resource, and Flow Cytometry Core Facility at the Sylvester Comprehensive Cancer Center (SCCC). T47D-ERαY537S cells were kindly provided by Dr. Steffi Oesterreich (University of Pittsburgh). This work was supported by SCCC funds to L.M. and R.E.V., the Florida Health Bankhead-Coley Cancer Research Program (20B15), the V Foundation (DEC2020–009), the Lampert Breast Cancer Research Fund, and R01GM141349 from the National Institute of General Medical Sciences to L.M., and R01GM121595 from the National Institute of General Medical Sciences and 1R01CA233945 from the National Cancer Institute to R.E.V. Research in this publication was supported by the National Cancer Institute of the National Institutes of Health under Award Number P30CA240139. The content is solely the responsibility of the authors and does not necessarily represent the official views of the National Institutes of Health.
Footnotes
Competing interests
The authors declare that they have no competing interests.
The authors declare no potential conflicts of interest.
Code availability
All software and bioinformatic tools used in this study are publicly available.
Data availability
All raw and processed NSG data was deposited in the NCBI Gene Expression Omnibus under accession number GSE168644. Mass spectrophotometry raw files were deposited on the public repository Chorus (chorusproject.org) with the project number 1763.
References
- 1.Siegel RL, Miller KD & Jemal A Cancer statistics, 2020. CA Cancer J Clin 70, 7–30 (2020). [DOI] [PubMed] [Google Scholar]
- 2.DeSantis CE et al. Breast cancer statistics, 2019. CA Cancer J Clin 69, 438–451 (2019). [DOI] [PubMed] [Google Scholar]
- 3.Hanker AB, Sudhan DR & Arteaga CL Overcoming Endocrine Resistance in Breast Cancer. Cancer Cell 37, 496–513 (2020). [DOI] [PMC free article] [PubMed] [Google Scholar]
- 4.Patten DK et al. Enhancer mapping uncovers phenotypic heterogeneity and evolution in patients with luminal breast cancer. Nat Med 24, 1469–1480 (2018). [DOI] [PMC free article] [PubMed] [Google Scholar]
- 5.Marine JC, Dawson SJ & Dawson MA Non-genetic mechanisms of therapeutic resistance in cancer. Nat Rev Cancer 20, 743–756 (2020). [DOI] [PubMed] [Google Scholar]
- 6.Zhu C et al. A Non-canonical Role of YAP/TEAD Is Required for Activation of Estrogen-Regulated Enhancers in Breast Cancer. Mol Cell 75, 791–806 e8 (2019). [DOI] [PMC free article] [PubMed] [Google Scholar]
- 7.Ernst J et al. Mapping and analysis of chromatin state dynamics in nine human cell types. Nature 473, 43–9 (2011). [DOI] [PMC free article] [PubMed] [Google Scholar]
- 8.Garcia-Martinez L, Zhang Y, Nakata Y, Chan HL & Morey L Epigenetic mechanisms in breast cancer therapy and resistance. Nature Communications 12, 1786 (2021). [DOI] [PMC free article] [PubMed] [Google Scholar]
- 9.Sharma SV et al. A chromatin-mediated reversible drug-tolerant state in cancer cell subpopulations. Cell 141, 69–80 (2010). [DOI] [PMC free article] [PubMed] [Google Scholar]
- 10.Boumahdi S & de Sauvage FJ The great escape: tumour cell plasticity in resistance to targeted therapy. Nat Rev Drug Discov 19, 39–56 (2020). [DOI] [PubMed] [Google Scholar]
- 11.Razavi P et al. The Genomic Landscape of Endocrine-Resistant Advanced Breast Cancers. Cancer Cell 34, 427–438 e6 (2018). [DOI] [PMC free article] [PubMed] [Google Scholar]
- 12.Ellis MJ et al. Whole-genome analysis informs breast cancer response to aromatase inhibition. Nature 486, 353–60 (2012). [DOI] [PMC free article] [PubMed] [Google Scholar]
- 13.Berns EM et al. Complete sequencing of TP53 predicts poor response to systemic therapy of advanced breast cancer. Cancer Res 60, 2155–62 (2000). [PubMed] [Google Scholar]
- 14.Abubakar M et al. Clinicopathological and epidemiological significance of breast cancer subtype reclassification based on p53 immunohistochemical expression. NPJ Breast Cancer 5, 20 (2019). [DOI] [PMC free article] [PubMed] [Google Scholar]
- 15.Yamashita H et al. p53 protein accumulation predicts resistance to endocrine therapy and decreased post-relapse survival in metastatic breast cancer. Breast Cancer Res 8, R48 (2006). [DOI] [PMC free article] [PubMed] [Google Scholar]
- 16.Yamamoto M et al. p53 accumulation is a strong predictor of recurrence in estrogen receptor-positive breast cancer patients treated with aromatase inhibitors. Cancer Sci 105, 81–8 (2014). [DOI] [PMC free article] [PubMed] [Google Scholar]
- 17.Bertucci F et al. Genomic characterization of metastatic breast cancers. Nature 569, 560–564 (2019). [DOI] [PubMed] [Google Scholar]
- 18.Silwal-Pandit L, Langerod A & Borresen-Dale AL TP53 Mutations in Breast and Ovarian Cancer. Cold Spring Harb Perspect Med 7(2017). [DOI] [PMC free article] [PubMed] [Google Scholar]
- 19.Yates LR et al. Genomic Evolution of Breast Cancer Metastasis and Relapse. Cancer Cell 32, 169–184 e7 (2017). [DOI] [PMC free article] [PubMed] [Google Scholar]
- 20.Lee MG, Wynder C, Cooch N & Shiekhattar R An essential role for CoREST in nucleosomal histone 3 lysine 4 demethylation. Nature 437, 432–5 (2005). [DOI] [PubMed] [Google Scholar]
- 21.Shi Y et al. Histone demethylation mediated by the nuclear amine oxidase homolog LSD1. Cell 119, 941–53 (2004). [DOI] [PubMed] [Google Scholar]
- 22.Perillo B, Tramontano A, Pezone A & Migliaccio A LSD1: more than demethylation of histone lysine residues. Exp Mol Med 52, 1936–1947 (2020). [DOI] [PMC free article] [PubMed] [Google Scholar]
- 23.Magliulo D, Bernardi R & Messina S Lysine-Specific Demethylase 1A as a Promising Target in Acute Myeloid Leukemia. Front Oncol 8, 255 (2018). [DOI] [PMC free article] [PubMed] [Google Scholar]
- 24.Bennani-Baiti IM, Machado I, Llombart-Bosch A & Kovar H Lysine-specific demethylase 1 (LSD1/KDM1A/AOF2/BHC110) is expressed and is an epigenetic drug target in chondrosarcoma, Ewing’s sarcoma, osteosarcoma, and rhabdomyosarcoma. Hum Pathol 43, 1300–7 (2012). [DOI] [PubMed] [Google Scholar]
- 25.Wang Y et al. LSD1 is a subunit of the NuRD complex and targets the metastasis programs in breast cancer. Cell 138, 660–72 (2009). [DOI] [PubMed] [Google Scholar]
- 26.Wu Y et al. The deubiquitinase USP28 stabilizes LSD1 and confers stem-cell-like traits to breast cancer cells. Cell Rep 5, 224–36 (2013). [DOI] [PMC free article] [PubMed] [Google Scholar]
- 27.Shahbandi A, Nguyen HD & Jackson JG TP53 Mutations and Outcomes in Breast Cancer: Reading beyond the Headlines. Trends Cancer 6, 98–110 (2020). [DOI] [PMC free article] [PubMed] [Google Scholar]
- 28.Fu X et al. FOXA1 overexpression mediates endocrine resistance by altering the ER transcriptome and IL-8 expression in ER-positive breast cancer. Proc Natl Acad Sci U S A 113, E6600–E6609 (2016). [DOI] [PMC free article] [PubMed] [Google Scholar]
- 29.Jeselsohn R et al. Embryonic transcription factor SOX9 drives breast cancer endocrine resistance. Proc Natl Acad Sci U S A 114, E4482–E4491 (2017). [DOI] [PMC free article] [PubMed] [Google Scholar]
- 30.Morrison G et al. Therapeutic potential of the dual EGFR/HER2 inhibitor AZD8931 in circumventing endocrine resistance. Breast Cancer Res Treat 144, 263–72 (2014). [DOI] [PMC free article] [PubMed] [Google Scholar]
- 31.Murphy CS, Pink JJ & Jordan VC Characterization of a receptor-negative, hormone-nonresponsive clone derived from a T47D human breast cancer cell line kept under estrogen-free conditions. Cancer Res 50, 7285–92 (1990). [PubMed] [Google Scholar]
- 32.Murphy CS, Meisner LF, Wu SQ & Jordan VC Short- and long-term estrogen deprivation of T47D human breast cancer cells in culture. Eur J Cancer Clin Oncol 25, 1777–88 (1989). [DOI] [PubMed] [Google Scholar]
- 33.Inman JL, Robertson C, Mott JD & Bissell MJ Mammary gland development: cell fate specification, stem cells and the microenvironment. Development 142, 1028–42 (2015). [DOI] [PubMed] [Google Scholar]
- 34.Idowu MO et al. CD44(+)/CD24(-/low) cancer stem/progenitor cells are more abundant in triple-negative invasive breast carcinoma phenotype and are associated with poor outcome. Hum Pathol 43, 364–73 (2012). [DOI] [PubMed] [Google Scholar]
- 35.Honeth G et al. The CD44+/CD24- phenotype is enriched in basal-like breast tumors. Breast Cancer Res 10, R53 (2008). [DOI] [PMC free article] [PubMed] [Google Scholar]
- 36.Fang Y, Liao G & Yu B LSD1/KDM1A inhibitors in clinical trials: advances and prospects. J Hematol Oncol 12, 129 (2019). [DOI] [PMC free article] [PubMed] [Google Scholar]
- 37.Ravasio R et al. Targeting the scaffolding role of LSD1 (KDM1A) poises acute myeloid leukemia cells for retinoic acid-induced differentiation. Sci Adv 6, eaax2746 (2020). [DOI] [PMC free article] [PubMed] [Google Scholar]
- 38.Anastas JN et al. Re-programing Chromatin with a Bifunctional LSD1/HDAC Inhibitor Induces Therapeutic Differentiation in DIPG. Cancer Cell 36, 528–544 e10 (2019). [DOI] [PubMed] [Google Scholar]
- 39.Kalin JH et al. Targeting the CoREST complex with dual histone deacetylase and demethylase inhibitors. Nat Commun 9, 53 (2018). [DOI] [PMC free article] [PubMed] [Google Scholar]
- 40.Foster CT et al. Lysine-specific demethylase 1 regulates the embryonic transcriptome and CoREST stability. Mol Cell Biol 30, 4851–63 (2010). [DOI] [PMC free article] [PubMed] [Google Scholar]
- 41.Luo H et al. MOF Acetylates the Histone Demethylase LSD1 to Suppress Epithelial-to-Mesenchymal Transition. Cell Rep 15, 2665–78 (2016). [DOI] [PubMed] [Google Scholar]
- 42.Zhang J et al. SFMBT1 functions with LSD1 to regulate expression of canonical histone genes and chromatin-related factors. Genes Dev 27, 749–66 (2013). [DOI] [PMC free article] [PubMed] [Google Scholar]
- 43.Liu J et al. Arginine methylation-dependent LSD1 stability promotes invasion and metastasis of breast cancer. EMBO Rep 21, e48597 (2020). [DOI] [PMC free article] [PubMed] [Google Scholar]
- 44.Bahreini A et al. Mutation site and context dependent effects of ESR1 mutation in genome-edited breast cancer cell models. Breast cancer research : BCR 19, 60 (2017). [DOI] [PMC free article] [PubMed] [Google Scholar]
- 45.Fang R et al. Human LSD2/KDM1b/AOF1 regulates gene transcription by modulating intragenic H3K4me2 methylation. Mol Cell 39, 222–33 (2010). [DOI] [PMC free article] [PubMed] [Google Scholar]
- 46.Karytinos A et al. A novel mammalian flavin-dependent histone demethylase. J Biol Chem 284, 17775–82 (2009). [DOI] [PMC free article] [PubMed] [Google Scholar]
- 47.Hatzi K et al. Histone demethylase LSD1 is required for germinal center formation and BCL6-driven lymphomagenesis. Nat Immunol 20, 86–96 (2019). [DOI] [PMC free article] [PubMed] [Google Scholar]
- 48.Grose R Epithelial migration: open your eyes to c-Jun. Curr Biol 13, R678–80 (2003). [DOI] [PubMed] [Google Scholar]
- 49.Sioletic S et al. c-Jun promotes cell migration and drives expression of the motility factor ENPP2 in soft tissue sarcomas. J Pathol 234, 190–202 (2014). [DOI] [PMC free article] [PubMed] [Google Scholar]
- 50.Zhang Y et al. Critical role of c-Jun overexpression in liver metastasis of human breast cancer xenograft model. BMC Cancer 7, 145 (2007). [DOI] [PMC free article] [PubMed] [Google Scholar]
- 51.Kappelmann-Fenzl M et al. C-Jun drives melanoma progression in PTEN wild type melanoma cells. Cell Death Dis 10, 584 (2019). [DOI] [PMC free article] [PubMed] [Google Scholar]
- 52.Malorni L et al. Blockade of AP-1 Potentiates Endocrine Therapy and Overcomes Resistance. Mol Cancer Res 14, 470–81 (2016). [DOI] [PMC free article] [PubMed] [Google Scholar]
- 53.Bi M et al. Enhancer reprogramming driven by high-order assemblies of transcription factors promotes phenotypic plasticity and breast cancer endocrine resistance. Nat Cell Biol 22, 701–715 (2020). [DOI] [PMC free article] [PubMed] [Google Scholar]
- 54.Munne PM et al. Compressive stress-mediated p38 activation required for ERalpha + phenotype in breast cancer. Nat Commun 12, 6967 (2021). [DOI] [PMC free article] [PubMed] [Google Scholar]
- 55.Gross K, Wronski A, Skibinski A, Phillips S & Kuperwasser C Cell Fate Decisions During Breast Cancer Development. J Dev Biol 4, 4 (2016). [DOI] [PMC free article] [PubMed] [Google Scholar]
- 56.Ku SY et al. Rb1 and Trp53 cooperate to suppress prostate cancer lineage plasticity, metastasis, and antiandrogen resistance. Science 355, 78–83 (2017). [DOI] [PMC free article] [PubMed] [Google Scholar]
- 57.Gao S et al. Chromatin binding of FOXA1 is promoted by LSD1-mediated demethylation in prostate cancer. Nat Genet 52, 1011–1017 (2020). [DOI] [PMC free article] [PubMed] [Google Scholar]
- 58.Smith LM et al. cJun overexpression in MCF-7 breast cancer cells produces a tumorigenic, invasive and hormone resistant phenotype. Oncogene 18, 6063–70 (1999). [DOI] [PubMed] [Google Scholar]
- 59.Beroukhim R et al. The landscape of somatic copy-number alteration across human cancers. Nature 463, 899–905 (2010). [DOI] [PMC free article] [PubMed] [Google Scholar]
- 60.Mariani O et al. JUN oncogene amplification and overexpression block adipocytic differentiation in highly aggressive sarcomas. Cancer Cell 11, 361–74 (2007). [DOI] [PubMed] [Google Scholar]
- 61.Shao J et al. COP1 and GSK3beta cooperate to promote c-Jun degradation and inhibit breast cancer cell tumorigenesis. Neoplasia 15, 1075–85 (2013). [DOI] [PMC free article] [PubMed] [Google Scholar]
- 62.Musgrove EA & Sutherland RL Biological determinants of endocrine resistance in breast cancer. Nat Rev Cancer 9, 631–43 (2009). [DOI] [PubMed] [Google Scholar]
- 63.Zhang X, Jin B & Huang C The PI3K/Akt pathway and its downstream transcriptional factors as targets for chemoprevention. Curr Cancer Drug Targets 7, 305–16 (2007). [DOI] [PubMed] [Google Scholar]
- 64.Wang L et al. CARM1 methylates chromatin remodeling factor BAF155 to enhance tumor progression and metastasis. Cancer Cell 25, 21–36 (2014). [DOI] [PMC free article] [PubMed] [Google Scholar]
- 65.Mohammad HP, Barbash O & Creasy CL Targeting epigenetic modifications in cancer therapy: erasing the roadmap to cancer. Nat Med 25, 403–418 (2019). [DOI] [PubMed] [Google Scholar]
- 66.Sehrawat A et al. LSD1 activates a lethal prostate cancer gene network independently of its demethylase function. Proc Natl Acad Sci U S A 115, E4179–E4188 (2018). [DOI] [PMC free article] [PubMed] [Google Scholar]
Methods-only references
- 67.Zhang Y et al. The Polycomb protein RING1B enables estrogen-mediated gene expression by promoting enhancer-promoter interaction and R-loop formation. Nucleic Acids Research 49, 9768–9782 (2021). [DOI] [PMC free article] [PubMed] [Google Scholar]
- 68.Buenrostro JD, Giresi PG, Zaba LC, Chang HY & Greenleaf WJ Transposition of native chromatin for fast and sensitive epigenomic profiling of open chromatin, DNA-binding proteins and nucleosome position. Nat Methods 10, 1213–8 (2013). [DOI] [PMC free article] [PubMed] [Google Scholar]
- 69.Aguilan JT, Kulej K & Sidoli S Guide for protein fold change and p-value calculation for non-experts in proteomics. Mol Omics 16, 573–582 (2020). [DOI] [PubMed] [Google Scholar]
- 70.Yuan ZF et al. EpiProfile 2.0: A Computational Platform for Processing Epi-Proteomics Mass Spectrometry Data. J Proteome Res 17, 2533–2541 (2018). [DOI] [PMC free article] [PubMed] [Google Scholar]
Associated Data
This section collects any data citations, data availability statements, or supplementary materials included in this article.
Supplementary Materials
Data Availability Statement
All raw and processed NSG data was deposited in the NCBI Gene Expression Omnibus under accession number GSE168644. Mass spectrophotometry raw files were deposited on the public repository Chorus (chorusproject.org) with the project number 1763.


