Abstract
Mutations in ATP13A2 cause Kufor-Rakeb Syndrome (KRS), a juvenile form of Parkinson’s Disease (PD). The gene product belongs to a diverse family of ion pumps and mediates polyamine influx from lysosomal lumen. While the biochemical and structural studies highlight its unique mechanics, how PD pathology is linked to ATP13A2 function remains unclear. Here we report that localization of overexpressed TOM20, a mitochondrial outer-membrane protein, is significantly altered upon ATP13A2 expression to partially merge with lysosome. Using Halo-fused version of ATP13A2, ATP13A2 was identified in lysosome and autophagosome. Upon ATP13A2 co-expression, overexpressed TOM20 was found not only in mitochondria but also within ATP13A2-containing autolysosome. This modification of TOM20 localization was inhibited by adding 1-methyl-4-phenylpyridinium (MPP+) and not accompanied with mitophagy induction. We suggest that ATP13A2 may participate in the control of overexpressed proteins targeted to mitochondrial outer-membrane.
Introduction
ATP13A2 belongs to the diverse family of molecular pumps (P-type ATPases) [1, 2] and recessive mutations have been identified in patients affected by Kufor-Rakeb Syndrome (KRS), a juvenile form of familial Parkinson’s Disease (PD) [3], which is characterized by cognitive impairment, myoclonus [4], and dementia [5]. Loss of ATP13A2 functions have been further associated with broad spectrum of neurodegenerative states, i.e., early-onset neuronal ceroid lipofuscinosis [6], hereditary spastic paraplegia [7], and amyotrophic lateral sclerosis-like phenotype [8].
In the aim of elucidating PD etiology, a series of genes responsible for the monogenic forms (PARK genes) have been characterized, recognizing mitochondrial and proteostatic dysfunctions as a main pathogenetic mechanism underlying PD development [9, 10]. Among 23 PARK genes, ATP13A2 (PARK9) is rather atypical in that the gene product is primarily present in lysosome while others have direct contacts with mitochondria. The molecular function of human ATP13A2 had been critically elusive until recent biochemical and structural studies illuminated its ability to transport polyamines from the lumenal to cytoplasmic side across the biological membrane [11–13]. The published structures unveil distinct intermediate states of ATP13A2 including complexes with polyamines bound in the electronegative cavity passing through the transmembrane α-helical bundle [14, 15]. Polyamines were shown to stimulate the ATPase cycle of ATP13A2 and indeed translocated across the biological membrane in ATP- and ATP13A2-dependent manner [11]. These key evidences have founded the biochemical nature of ATP13A2 as a polyamine pump.
While the shape of ATP13A2 is emerging at atomic resolution, understanding of its role in cell physiology is limited. The most fundamental and ultimate question is “how is the deficiency of ATP13A2 linked to PD development?” Reflecting pathologic features of KRS, ATP13A2 knockout mouse was characterized by rupture in dopaminergic neurons, sensorimotor impairment, and Lewy body accumulation [16, 17]. Development of ceroid lipofuscinosis with accumulated mitochondrial protein was also reported [18]. At cellular level, a number of studies have implicated ATP13A2 in lysosomal function. ATP13A2-deficient fibroblasts from KRS patients exhibited deficits in lysosomal acidification and autophagic processes [19]. Like other PARK genes, ATP13A2 inactivation results in mitochondrial dysfunction [20, 21] which is at least in part attributed to a defect in autophagy [21]. In human neuroblastoma SH-SY5Y cells with ATP13A2 deficiency, the level of lysosomal cathepsin D was downregulated, reflecting reduced proteolytic activity in lysosome [22]. Consistently, other studies pointed to the impacts of ATP13A2 on the cellular proteostasis via mTORC1-TFEB pathway [23], endolysosomal cargo sorting [24], clearance of mitochondria-derived dsDNA [25], autophagic regulation of iron homeostasis [26], and lysosomal HDAC6 [27]. These studies collectively shed a light on an important role of ATP13A2 in autophagic/lysosomal processes. For thorough understanding of the underlying mechanism, further investigation into the cellular impact of ATP13A2 activation/inactivation is required.
Here we report localization analyses of ATP13A2 utilizing various fluorescent organelle-specific proteins and Halo tag fusion which allowed flexible strategy of live-cell imaging. When proteins at the mitochondrial outer membrane(mCerry-TOM20-N,GFP-Mff) were overexpressed, their localizations changed to merge with ATP13A2-containing autolysosome. Importantly, this alteration was dependent on ATP13A2 overexpression, pointing to an important role of ATP13A2 in maintaining normal proteostasis or membrane targeting at mitochondrial outer membrane. We further found that MPP+, a PD-inducing neurotoxin, interfered with ATP13A2-dependent modification of mCherry-TOM20-N localization. Coexpression of ATP13A2 and Tom20 did not alter the frequency of mitophagic cells, indicating that autolysosomal localization of overexpressed Tom20 was not attributed to increased mitophagic activity. These findings provide novel information regarding the cellular function of ATP13A2 and potentially contributes to further understanding of PD etiology.
Materials and methods
Antibodies
The antibodies were obtained from the following manufacturers; polyclonal anti-ATP13A2 antibody produced in rabbit (Sigma-Aldrich, A9607), polyclonal anti-ATP13A3 antibody produced in rabbit (Sigma-Aldrich, SAB1302984), monoclonal anti-β-actin antibody produced in mouse (Sigma-Aldrich, A5441), monoclonal anti-Tom20 antibody produced in mouse (F-10, Santa Cruz, sc-17764), polyclonal anti-rabbit IgG (H+L) Alexa Fluor 568 conjugate (Thermo Fisher Scientific, A11011) and polyclonal anti-rabbit IgG (H+L) Alexa Fluor 488 conjugate (Thermo Fisher Scientific, A11008).
Plasmids
The plasmids are gifts from the following researchers; Su9-mCherry-GFP [28] from Dr. Miho Iijima, mCherry-TOMM20-N-10 from Dr. Michael Davidson (Addgene plasmid #55146), GFP-Mff from Dr. Gia Voeltz (Addgene plasmid #49153 [29]), pLPCX mito Grx1-roGFP2 from Dr. Tobias Dick (Addgene plasmid # 64977 [30]), Lamp1-RFP from Dr. Walther Mothes (Addgene plasmid # 1817 [31]), pEGFP-LC3 (human) from Dr. Toren Finkel (Addgene plasmid #24920 [32]). Constructions of Mito Grx1-roGFP2, PMP2-Grx1-roGFP2, LifeAct7-Grx1-roGFP2, Keratin-Grx1-roGFP2 and Sec61β-Grx1-roGFP2 were previously described [33, 34].
cDNA of human ATP13A2 (variant 1, NCBI accession number NM_022089.4) was de novo synthesized via GenScript and subcloned into pcDNA3.1+C-eGFP, resulting in ATP13A2-GFP, respectively. ATP13A2 was then amplified by PCR and inserted into pHTC HaloTag CMV-neo vector, generating ATP13A2-Halo construct. In this plasmid, the fusion protein is attached with C-terminal protease-recognition site (TEV) and Halo tag.
For constructing native form of human Tom20, 436ggc438 in the coding region of mCherry-TOMM20-N-10 was replaced with stop codon (tga) using QuikChange II Site-Directed Mutagenesis Kits (Agilent Technology) and a set of complementary oligonucleotides; Tom20F_g436t_c438a, 5’-gatccccgctacctcattccacatcatcttcagccaagc-3’; Tom20R_g436t_c438a, 5’-gcttggctgaagatgatgtggaatgaggtagcggggatc-3’. DNA sequences of generated constructs were validated by Sanger sequencing.
For transfection into mammalian cells, DNA plasmids were propagated in Escherichia coli DH5α (TAKARA) or XL10-Gold (Agilent Technology) strain and purified using Plasmid Plus Midi Kit (QIAGEN).
Cell culture
HeLa cells were cultured in Dulbecco’s Modified Eagle Medium (DMEM) with 10% FBS, 50U/ml penicillin and 50 μg/ml streptomycin at 37°C and 5% CO2. DMEM, FBS and streptomycin were purchased from Thermo Fisher Scientific. Plasmid transfection was performed using Lipofectamine 3000 and Opti-MEM (Thermo Fisher Scientific). For some experiments, 100 μM or 500 μM 1-methyl-4-phenylpyridinum (MPP+) was added to culture medium 24 h after plasmid transfection. Stably transfected cells were obtained by treating cells with 500 μg/mL geneticin (Thermo Fisher Scientific) over 10 days.
Immunocytochemistry
Cells were fixed with 4% paraformaldehyde, permeabilized with 0.2% Triton X-100 in PBS and blocked by 3% BSA. Cells were then sequentially treated with primary antibodies (4°C, overnight) and secondary antibodies (room temperature, 3h). Cells were then mounted with Fluoromount-G containing DAPI (SouthernBiotech). Cells were visualized by confocal microscopy using FV1000 (Olympus, Japan) equipped with a temperature- and CO2-controlled stage chamber. Images were processed using Image J [35] with Fiji package [36].
Detection of Halo-fused protein separated on SDS gels
HEK cells were transfected with pHTC/ATP13A2-Halo. Cells stably expressing ATP13A2-Halo were selected by using 500 μg/ml G418. Selected cells were mechanically collected without trypsin treatment, washed with PBS, and resuspended in hypotonic buffer (10 mM HEPES, pH7.0) with Protease Inhibitor Cocktail (Nakalai). After lysing cells by homogenization, the composition of the cell suspension was adjusted to 25 mM HEPES, pH7.0, 150 mM NaCl and 10% glycerol. Debris as well as nuclei were removed by centrifugation at 5,000×g for 20 min. Supernatant was further fractionated by ultracentrifugation at 40,000×g for 1 hr. Pelleted microsome was resuspended in PBS. Protein concentration was determined by bicinchoninic acid assay. Twenty five μg of microsomal protein was incubated with 10 μM TMR Halo-ligand or 2 μM Oregon Green Halo-ligand (Promega) for 20 min at room temperature. Before electrophoretic separation of proteins, each sample was combined with one third volume of 4×Laemmlli sample buffer containing 50 mM dithiothreitol. Proteins were then resolved by SDS-PAGE and fluorescence on gels were imaged by LAS3000 luminoimage analyzer (Fujifilm).
Co-immunoprecipitation assay
To explore potential interaction between overexpressed ATP13A2-Halo and mCherry-Tom20, pull-down assay was performed. Hela cells stably transfected with ATP13A2-Halo were plated on 10 cm dish and additionally transfected with mCherry-TOM20-N-10. Two days after transfection, cells were washed with ice-cold PBS and lysed in 20 mM HEPES buffer pH7.5 containing 0.15 M NaCl, 0.5% (w/v) Triton-X 100, and protease inhibitor cocktail (Nacalai Tesque). Collected lysate was cleared by centrifugation at 13,000×g for 30 min. Primary antibodies (either anti-ATP13A2 or normal IgG) were added, followed by overnight incubation at 4°C. Antibody-antigen complex was adsorbed to Dynabeads Protein G (Thermo Fisher Scientific) and magnetically sedimented. The beads were washed with lysis buffer (the concentration of TritonX-100 was adjusted to 0.1% w/v) five times. After completely removing supernatant, SDS sample buffer was added to protein G beads to resolve adsorbed immune complex. Supernatant was recovered, supplemented with 10 mM dithiothreitol, heat-denatured at 100°C for 5 min, and subjected to western blotting.
Proteins were separated on SDS-polyacrylamide gels containing either 5.5% (ATP13A2 detection) or 10% (Tom20 detection) acrylamide, transferred to PVDF membranes, blocked using blocking one reagent (Nacalai Tesque), and incubated with primary antibodies at 4°C overnight. The membranes were then reacted with secondary antibodies at room temperature for 1 hour. Chemiluminescence was detected using LAS-4000 luminoimageanalyzer (Fujifilm).
Results and discussion
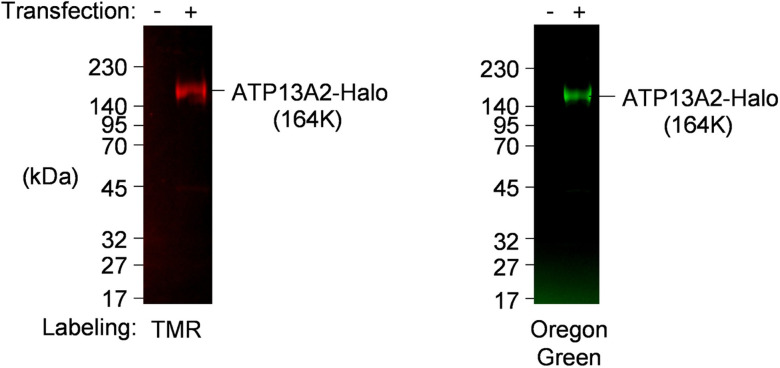
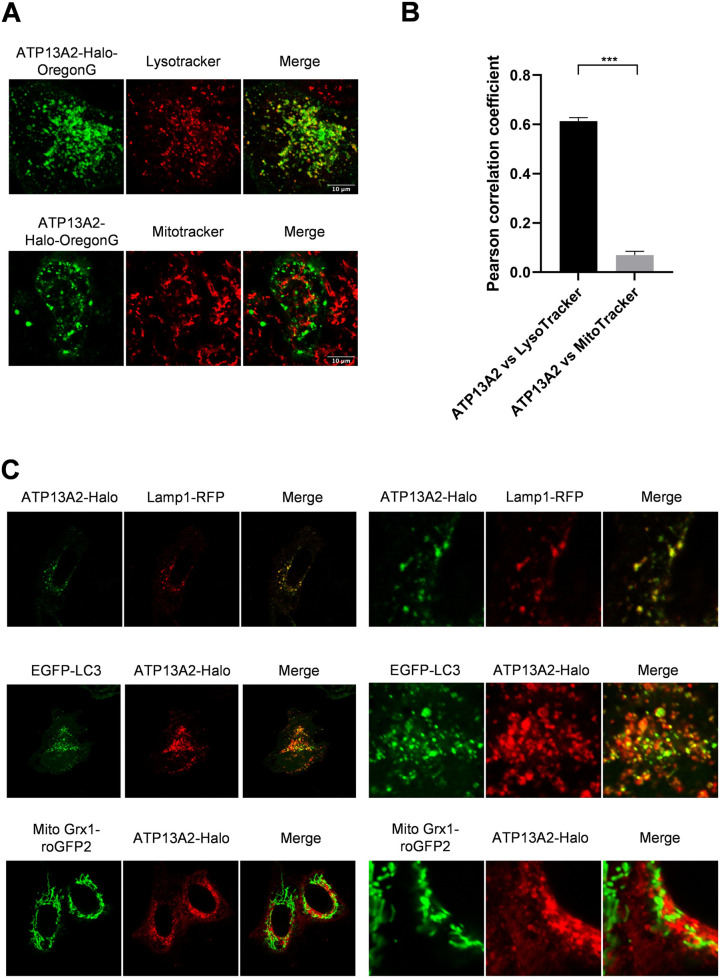
In order to analyze the intracellular localization of ATP13A2 at fine spatiotemporal resolution, we constructed recombinant ATP13A2 fused with C-terminal Halo tag (ATP13A2-Halo) which facilitates protein detection and purification. Halo-directed labeling enabled specific detection of ATP13A2-Halo. Overexpressed protein exhibited a theoretical mass of full length protein (164KDa) and no degraded or immatured protein was observed (Fig 1). Using this construct, first, we sought to confirm distribution pattern of ATP13A2-Halo in HeLa cells. ATP13A2 was previously reported to reside in lysosome and autophagosome. Consistently, Oregon Green-labeled ATP13A2-Halo was identified as vesicular structures seemingly overlapping with or surrounding Lysotracker-stained acidic compartments (Fig 2A, top). Meanwhile, no contact with mitochondria was observed (Fig 2A, bottom). Pearson correlation coefficients (PCCs) were 0.61±0.015 and 0.07±0.015, respectively (Fig 2B and S1 Fig). The observed pattern matches lysosomal localization, which was further tested using a series of fluorescent markers listed in Table 1. ATP13A2-Halo exhibited complete overlap with lysosome marker and partially colocalized with autophagosome marker, indicating the presence at lysosome/autolysosome membranes (Fig 2C), as previously reported for GFP-fused ATP13A2 [3]. Thereby lysosomal/autolysosomal localization of ATP13A2 was preserved without apparent effect of Halo-fusion.
Fig 1. Construction and expression of ATP13A2-Halo.
Halo tag was C-terminally fused with human ATP13A2. Pilot expression in HEK cells produced expected size of ATP13A2-Halo protein (164K). Stable cells were harvested and microsomes were prepared. ATP13A2-Halo was specifically labeled ex vivo with TMR-ligand (left) or Oregon green (right), followed by SDS-PAGE and fluorescence imaging.
Fig 2. Intracellular localization of ATP13A2-Halo in HeLa cells.
(A) Images of live cells stained with indicated fluorophores. ATP13A2-Halo was labeled with Oregon Green by utilizing Halo link technology. Scatter plots are also shown in S2 Fig (B) Pearson correlation coefficients of ATP13A2-Halo and Lysotracker or Mitotracker. Data represent averages of n = 10 samples with S.E.M. (bars). Statistical analysis was performed using Student’s t test: *p < 0.05, ** p < 0.01, *** p < 0.001. (C) Organelle-specific proteins were cotransfected with ATP13A2-Halo. For obtaining high resolution images, cells were fixed and subjected to immunostaining using anti-ATP13A2 antibody.
Table 1. List of organelle markers used in the study and summary of the results.
| Construct name | targeted organelle | Influence of ATP13A2 on distribution pattern |
colocalization with ATP13A2-Halo |
Reference |
|---|---|---|---|---|
| Mito Grx1-roGFP2 | Mitochondria, IMS/inner membrane |
No | No | 30 |
| mCherry-Tom20-N | Mitochondria, outer membrane |
Yes (from tubular to particulate) |
Partial | #55146* |
| GFP-Mff | Mitochondria, outer membrane |
Yes (from tubular to particulate) |
Partial | 29 |
| Lamp1-RFP | Lysosome membrane | No | Complete | 31 |
| EGFP-LC3 | Autophagosome membrane |
No | Partial | 32 |
| Sec61b-Grx1-roGFP2 | ER membrane | No | No | 33 |
*Addgene number
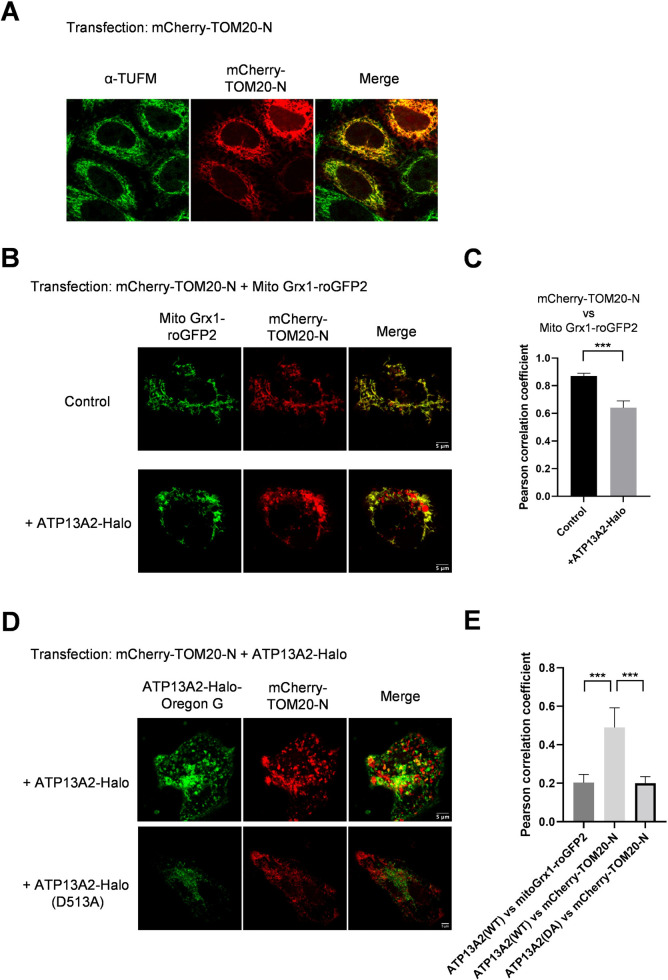
Majority of PD-associated genes found so far have been linked to management of mitochondrial quality, which drove us to further test colocalization of ATP13A2 with various mitochondrial proteins. In addition to matrix/inner membrane-directed marker (Fig 2; mito Grx1-roGFP2), we used another fluorescent marker, mCherry-TOM20-N, targeted to mitochondrial outer membrane (MOM). When singly transfected, mCherry-TOM20-N exhibited tubular distribution pattern and precisely overlapped with endogenous mitochondrial protein, TUFM (Fig 3A), as well as exogenously transfected marker of mitochondrial matrix (mito Grx1-roGFP2, Fig 3B, top), ensuring mitochondrial localization. Unexpectedly, upon co-overexpression of ATP13A2-Halo, mCherry-TOM20-N changed their localization pattern from tubular to partially particulate distribution (Fig 3B, bottom). Accordingly, PCC between mCherry-TOM20-N and the mitochondrial matrix marker (mito Grx1-roGFP2) significantly dropped from 0.87±0.021 to 0.64±0.050, pointing to partial discolocalization (Figs 3C and S3). Of particular interest, these particulate populations of mCherry-TOM20-N colocalized with ATP13A2-positive vesicles, i.e., lysosome/autolysosome (Fig 3D, top). This resulted in higher PCC of ATP13A2-Halo vs mCherry-TOM20-N (0.49±0.102) compared to the value vs mitochondrial matrix marker (mito Grx1-roGFP2; 0.20±0.043, Figs 3E and S4). Catalytically dead mutant (D513A) failed to produce apparent effect on the localization of mCherry-TOM20-N, suggesting that the observed effect depends on catalytic activity of ATP13A2 (Fig 3D, bottom and Fig 3E).
Fig 3. ATP13A2 overexpression altered the intracellular distribution of mCherry-TOM20-N (mitochondrial outermembrane, MOM).
(A) MOM protein, mCherry-TOM20-N, was overexpressed in HeLa cells and mitochondrial localization was confirmed by immunostaining; TOM20 exhibited complete colocalization with the endogenous mitochondrial protein, TUFM. (B) Mitochondria was visualized by mitochondrial intermembrane space (IMS)/matrix marker, mito Grx1-roGFP2. Upon co-overexpression of ATP13A2, substantial portion of mCherry-TOM20-N appeared as particulate structures. Scatter plots are also shown in S3 Fig (C) Pearson correlation coefficients of mCherry-TOM20-N and mito Grx1-roGFP2 are shown. Data represent averages of n = 10 samples with S.E.M. (bars). Statistical analysis was performed using Student’s t test: *p < 0.05, ** p < 0.01, *** p < 0.001. (D) mCherry-TOM20-N and ATP13A2-Halo were coexpressed and their localizations were analyzed by live-cell imaging. TOM20 showed mixed localization pattern with mitochondria-like tubular shapes and particulate structures. The latter signals substantially merge with ATP13A2-positive vesicles. Catalytically dead mutant of ATP13A2 (D513A) produced no effect on the localization pattern of mCherry-TOM20-N. Scatter plots are also shown in S4 Fig (E) Pearson correlation coefficients of indicated proteins are shown. Data represent averages of n = 10 samples with S.E.M. (bars). Statistical analysis was performed using Student’s t test: *p < 0.05, ** p < 0.01, *** p < 0.001.
To determine whether ATP13A2 action on a localization pattern is specific to TOM20 or common for other MOM proteins, localization of EGFP-Mff was also analyzed. As observed for mCherry-TOM20-N, EGFP-Mff was present within ATP13A2-containing vesicles (S5 Fig). Within 9 organelle-specific proteins tested in the study, only mCherry-TOM20-N and GFP-Mff were influenced by ATP13A2, suggesting that this ATP13A2 effect may be specific to MOM proteins. These observations are not inconsistent to the idea that ATP13A2 may be involved in regulating localizations of MOM proteins.
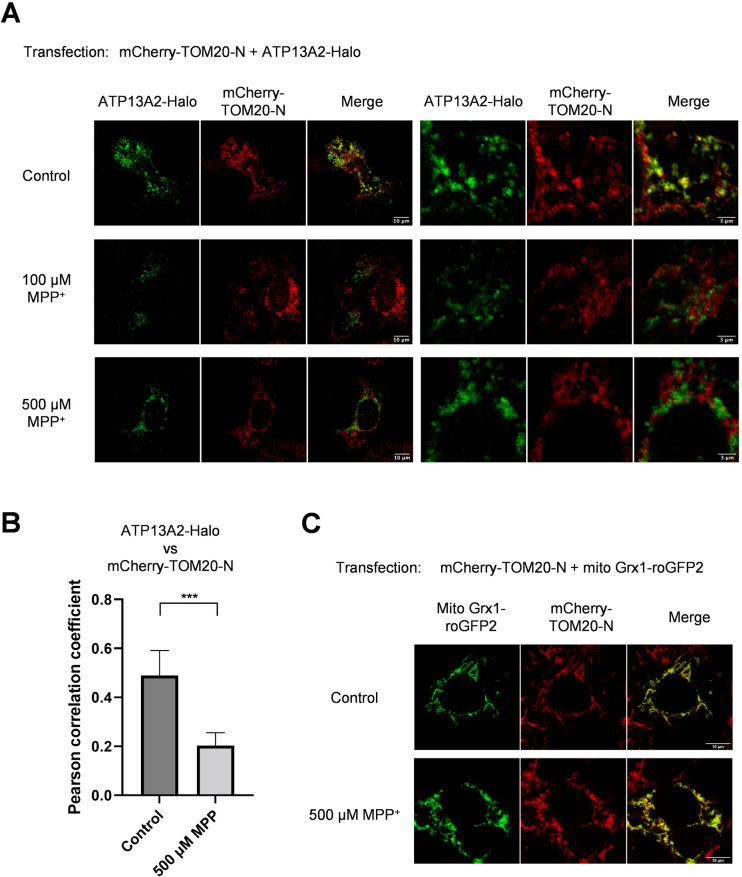
Additionally, we tested the effect of MPP+ which exerts neurotoxicity presumably through intervention in mitochondrial electron transport chain. More recently, impaired autophagic degradation by mild MPP+ exposure was reported [37]. In a condition with acute toxicity (500 μM MPP+, 24 hr), ATP13A2 failed to induce colocalization of mCherry-TOM20-N and ATP13A2-Halo (Fig 4A). PCC between ATP13A2-Halo and mCherry-TOM20-N dropped from 0.49±0102 to 0.20±0.052 upon MPP+ treatment (Figs 4B and S6).
Fig 4. ATP13A2-dependent sorting of mCherry-Tom20-N is sensitive to MPP+ treatment.
(A) HeLa cells were cotransfected with mCherry-TOM20-N and ATP13A2-Halo. One day after transfection, MPP+ was added to the culture medium and cells were further incubated for 24 hours, followed by immunostaining. After MPP+ treatment, no colocalization was observed for ATP13A2 and TOM20. Scatter plots are also shown in S6 Fig (B) Pearson correlation coefficients of ATP13A2-Halo and mCherry-TOM20-N are shown. Data represent averages of n = 10 samples with S.E.M. (bars). Statistical analysis was performed using Student’s t test: *p < 0.05, ** p < 0.01, *** p < 0.001. (C) Together with mCherry-TOM20-N, mito Grx1-roGFP2 was transfected for assessing mitochondrial shapes in the presence of MPP+.
Considering the possibility that overexpressed mCherry-TOM20-N was trapped on mitochondria, mitochondria morphology in MPP+-treated culture was visualized using mito Grx1-roGFP2. After MPP+-treatment, mCherry-TOM20-N was completely merged with mito Grx1-roGFP2 (Fig 4C). This suggests that mCherry-TOM20-N was present at mitochondria even with ATP13A2 expression and potentially insensitive to ATP13A2-dependent action.
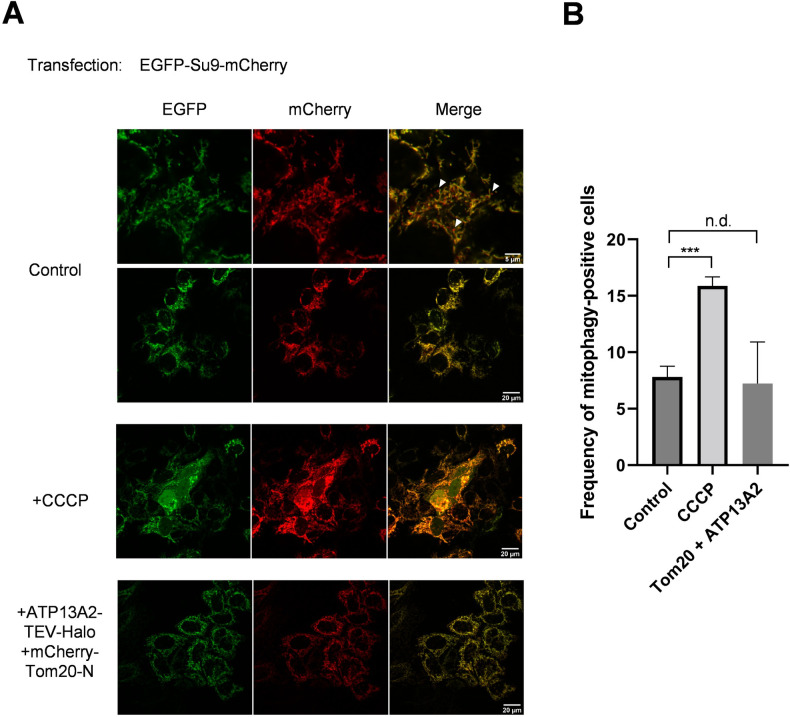
Considering the possibility that co-overexpression of ATP13A2 and Tom20 may trigger mitochondrial damage and autophagic processing of impaired mitochondria (mitophagy), we sought to detect mitophagic cells using a mitophagy biosensor, matrix-targeted Su9-
mCherry-GFP [28, 38–40]. Mitochondrially targeted pool of Su9-mCherry-GFP emits fluorescence from both mCherry and GFP fluorophores. During mitophagy, mitochondria is transported to lysosomes and subjected to acidic pH, resulting in selective loss of GFP fluorescence. The results show that the number of mitophagic cells was not significantly altered by coexpression of ATP13A2 and Tom20 (Fig 5), again suggesting that mitochondrial damage is not prominent in this condition.
Fig 5. The number of mitophagic cells is not affected by co-expression of ATP13A2-Halo and Tom20.
HeLa cells stably overexpressing ATP13A2-Halo were additionally transfected with plasmids carrying Tom20 and Su9-mCherry-GFP. Two days after transfection, the cells were analyzed by confocal microscopy. The mitophagic cells are defined as those exhibiting mCherry-positive and GFP-negative particles. White arrow heads indicates representative mitophagic particles. As a positive control condition, cells were treated with 50 μM 3-chlorophenylhydrazone (CCCP). (B) The numbers of mitophagic cells were counted and shown as frequencies (%). Values are average ± S.E.M. (n = 50 cells). Statistical analysis was performed using Student’s t test: *p < 0.05, ** p < 0.01, *** p < 0.001, “n.d.” difference is not significant.
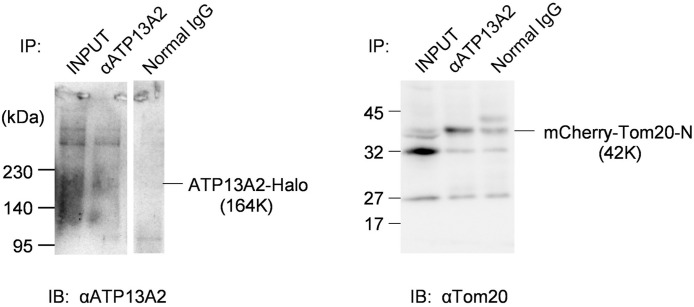
We explored possible interaction between overexpressed ATP13A2-Halo and mCherry-Tom20 by co-IP. ATP13A2-Halo was pulled down using specific antibody. The level of co-immunoprecipitated mCherry-Tom20 was markedly higher than the condition with normal IgG (Fig 6), pointing to significant interaction between overexpressed ATP13A2 and mCherry-Tom20.
Fig 6. Co-IP detected interaction between ATP13A2-Halo and mCherry-Tom20-N.
Cells co-expressing ATP13A2-Halo and mCherry-Tom20-N were assayed for protein interaction. Immunoprecipitation was performed using anti-ATP13A2 antibody and co-precipitated mCherry-Tom20-N was detected. The original entire images of the membranes are shown in S7 Fig.
Overall, this study demonstrated for the first time that localization of overexpressed TOM20, a mitochondrial protein, is influenced by expressing a lysosomal pump, ATP13A2. ATP13A2 belongs to P5B subgroup of P-type ATPase family and is present within lysosomal/autolysosomal pathway. ATP13A2 expression altered localization of mCherry-TOM20-N to merge with autolysosome. This process, sensitive to MPP+, may potentially contribute to maintaining the local proteostasis on the outermembrane of mitochondria.
Although localization of ATP13A2 has been limited to lysosome/autolysosome, substantial evidences have linked ATP13A2 function to mitochondria physiology. Grünewald and her coworkers observed decreased level of mitochondrial ATPase synthesis in fibroblast derived from KRS-affected patients [20]. Defective energy metabolism in mitochondria was further attributed to deficit in autophagy [21]. As represented by these early works, many studies pointed to involvement of ATP13A2 in mitochondrial and/or autophagic processes. In this line, it may not be very surprising that ATP13A2 mediates sorting of mitochondria-targeted protein to autolysosome. However, how this could be achieved by this polyamine pump is still elusive. For answering this question, evidence linking polyamine homeostasis and autophagy is awaited. Polyamines was reported to increase the lifespan of worms and flies and improve neural functions via autophagy induction [41, 42] and, in human, blood level of polyamines serves as a potential PD biomarker [43]. More specifically, spermidine was shown to enhance respiratory capacity in mouse hippocampus and, in flies, this polyamine action requires functional autophagy as well as the mitophagy mediators Pink1 and Parkin, pointing to an important role of polyamine in mitochondrial proteostasis [44]. Alternatively, the recently published study of P5A ATPase (yeast Spf1) might give a direct hint; Spf1 (yeast homologue of human ATP13A1) mediates resorting of mitochondrial proteins from ER membrane to the right destination by ATP-driven extraction of substrate polypeptides [45]. This is of interest considering that localization of mitochondrially targeted protein, mCherry-TOM20-N, in this study was also affected by ATP13A2. We think at least two alternative possibilities for explaining our results; (i) lysosomal proteins, when excessively overexpressed, may end up with nonspecifically perturbed membrane trafficking within a cell; (ii) similar to ATP13A1, ATP13A2 may contribute to membrane sorting of specific protein(s). The former possibility seems unlikely considering that localizations of other marker proteins were not affected by ATP13A2 overexpression. In addition, catalytically dead mutant, D498A, were successfully overexpressed to the WT level but did not affect localization of mCherry-TOM20-N. We expect that a unique role of ATP13A2 in mitochondrial proteostasis might emerge from further investigation into the molecular basis of the observed effect of ATP13A2 overexpression.
The current study demonstrated the impact of ATP13A2 expression on the localization of Tom20, where overexpressed Tom20 was apparently sorted to autolysosomal pathway. This is particularly of interest considering the pertinent role of TOM complex in the PD etiology. TOM complex is directly involved in the MOM-targeted integration of PINK1, which is one of the PARK genes and regulating mitochondrial quality control. Upon mitochondrial damage, PINK1 accumulates in the MOM as a protein complex with TOM subunits [46, 47], which was further unveiled crystal clear in a high-resolution atomic model [48]. While the importance of TOM complex in the regulation of mitochondrial quality control has been established, less is known about how the integrity of TOM complex itself is maintained. Given the potential association between TOM and ATP13A2, it is very intriguing that yeast Spf1, ER-resident analogue pump of human ATP13A2, is directly engaged in evulsion of mistargeted Tom20 from ER membrane and resorting to the MOM [45]. Since the current study similarly pointed to interaction between ATP13A2 and Tom20, it is tempting to speculate that ATP13A2 may be involved in regulation or quality control of TOM complex. For testing such hypothesis, specificity of ATP13A2 interaction, especially potential interaction with other TOM subunits needs to be further investigated.
Conclusions
Localization of overexpressed TOM20, a mitochondrial protein, is influenced by expressing a lysosomal pump, ATP13A2. ATP13A2 expression altered localization of mCherry-TOM20-N to merge with ATP13A2-positive autolysosome. This process, sensitive to MPP+, may potentially contribute to maintaining the local proteostasis on the outermembrane of mitochondria.
Supporting information
Only representative images are shown in the main Fig 2.
(PDF)
Representative 3 plots for each experimental condition are shown. A, ATP13A2-Halo-OregonG vs LysoTracker. B, ATP13A2-Halo-OregonG vs MitoTracker.
(PDF)
Representative 3 plots for each experimental condition are shown. Cells were co-transfected with ATP13A2-Halo (B), resulting in partial segregation of Tom20 signals from Mito Grx1-roGFP2 signals (dashed circles). Without ATP13A2 co-transfection (A), Mito Grx1-roGFP2 and mCherry-Tom20-N signals produced practically perfect overlap.
(PDF)
Representative 3 plots for each experimental condition are shown. A, Mito Grx1-roGFP2 vs ATP13A2-Halo-TMR. B, ATP13A2-Halo-OregonG vs mCherry-Tom20-N. C, ATP13A2(D513A)-Halo-OregonG vs mCherry-Tom20-N.
(PDF)
GFP-Mff and ATP13A2-Halo were cotransfected and ATP13A2-Halo was labeled by TMR ligand, followed by live-cell imaging.
(PDF)
Representative 3 plots for each experimental condition are shown. Cells were incubated in the presence of 500 μM MPP+ for 24 hours (upper panel). For comparison, data for normal conditions (the same as the plots shown in B in S4 Fig) are shown (lower panel).
(PDF)
Nonspecific bands are marked with asterisks.
(PDF)
Data Availability
All relevant data are within the manuscript and its Supporting Information files.
Funding Statement
This work was supported by Promotion and Mutual Aid Corporation for Private Schools of Japan (to N.H.), Yasuda Women's University, Scientific Research Aid (to K.T.), Japan Society for the Promotion of Science, 21K06090 (to H.Y.). The funders had no role in study design, data collection and analysis, decision to publish, or preparation of the manuscript.
References
- 1.Axelsen KB, Palmgren MG. Evolution of substrate specificities in the P-type ATPase superfamily. J Mol Evol. 1998;46(1):84–101. doi: 10.1007/pl00006286 [DOI] [PubMed] [Google Scholar]
- 2.Schultheis PJ, Hagen TT, O’Toole KK, Tachibana A, Burke CR, McGill DL, et al. Characterization of the P5 subfamily of P-type transport ATPases in mice. Biochem Biophys Res Commun. 2004;323(3):731–8. doi: 10.1016/j.bbrc.2004.08.156 [DOI] [PubMed] [Google Scholar]
- 3.Ramirez A, Heimbach A, Gründemann J, Stiller B, Hampshire D, Cid LP, et al. Hereditary parkinsonism with dementia is caused by mutations in ATP13A2, encoding a lysosomal type 5 P-type ATPase. Nat Genet. 2006;38(10):1184–91. doi: 10.1038/ng1884 [DOI] [PubMed] [Google Scholar]
- 4.Hampshire DJ, Roberts E, Crow Y, Bond J, Mubaidin A, Wriekat AL, et al. Kufor-Rakeb syndrome, pallido-pyramidal degeneration with supranuclear upgaze paresis and dementia, maps to 1p36. J Med Genet. 2001;38(10):680–2. doi: 10.1136/jmg.38.10.680 [DOI] [PMC free article] [PubMed] [Google Scholar]
- 5.Najim al-Din AS, Wriekat A, Mubaidin A, Dasouki M, Hiari M. Pallido-pyramidal degeneration, supranuclear upgaze paresis and dementia: Kufor-Rakeb syndrome. Acta Neurol Scand. 1994;89(5):347–52. doi: 10.1111/j.1600-0404.1994.tb02645.x [DOI] [PubMed] [Google Scholar]
- 6.Bras J, Verloes A, Schneider SA, Mole SE, Guerreiro RJ. Mutation of the parkinsonism gene ATP13A2 causes neuronal ceroid-lipofuscinosis. Hum Mol Genet. 2012;21(12):2646–50. doi: 10.1093/hmg/dds089 [DOI] [PMC free article] [PubMed] [Google Scholar]
- 7.Estrada-Cuzcano A, Martin S, Chamova T, Synofzik M, Timmann D, Holemans T, et al. Loss-of-function mutations in the ATP13A2/PARK9 gene cause complicated hereditary spastic paraplegia (SPG78). Brain. 2017;140(2):287–305. doi: 10.1093/brain/aww307 [DOI] [PMC free article] [PubMed] [Google Scholar]
- 8.Spataro R, Kousi M, Farhan SMK, Willer JR, Ross JP, Dion PA, et al. Mutations in ATP13A2 (PARK9) are associated with an amyotrophic lateral sclerosis-like phenotype, implicating this locus in further phenotypic expansion. Hum Genomics. 2019;13(1):19. doi: 10.1186/s40246-019-0203-9 [DOI] [PMC free article] [PubMed] [Google Scholar]
- 9.Li W, Fu Y, Halliday GM, Sue CM. PARK Genes Link Mitochondrial Dysfunction and Alpha-Synuclein Pathology in Sporadic Parkinson’s Disease. Front Cell Dev Biol. 2021;9:612476. doi: 10.3389/fcell.2021.612476 [DOI] [PMC free article] [PubMed] [Google Scholar]
- 10.Sironi L, Restelli LM, Tolnay M, Neutzner A, Frank S. Dysregulated Interorganellar Crosstalk of Mitochondria in the Pathogenesis of Parkinson’s Disease. Cells. 2020;9(1). doi: 10.3390/cells9010233 [DOI] [PMC free article] [PubMed] [Google Scholar]
- 11.van Veen S, Martin S, Van den Haute C, Benoy V, Lyons J, Vanhoutte R, et al. ATP13A2 deficiency disrupts lysosomal polyamine export. Nature. 2020;578(7795):419–24. doi: 10.1038/s41586-020-1968-7 [DOI] [PubMed] [Google Scholar]
- 12.Vrijsen S, Besora-Casals L, van Veen S, Zielich J, Van den Haute C, Hamouda NN, et al. ATP13A2-mediated endo-lysosomal polyamine export counters mitochondrial oxidative stress. Proc Natl Acad Sci U S A. 2020;117(49):31198–207. doi: 10.1073/pnas.1922342117 [DOI] [PMC free article] [PubMed] [Google Scholar]
- 13.Van Veen S, Martin S, Schuermans M, Vangheluwe P. Polyamine Transport Assay Using Reconstituted Yeast Membranes. Bio Protoc. 2021;11(2):e3888. doi: 10.21769/BioProtoc.3888 [DOI] [PMC free article] [PubMed] [Google Scholar]
- 14.Tomita A, Daiho T, Kusakizako T, Yamashita K, Ogasawara S, Murata T, et al. Cryo-EM reveals mechanistic insights into lipid-facilitated polyamine export by human ATP13A2. Mol Cell. 2021;81(23):4799-809.e5. doi: 10.1016/j.molcel.2021.11.001 [DOI] [PMC free article] [PubMed] [Google Scholar]
- 15.Chen X, Zhou M, Zhang S, Yin J, Zhang P, Xuan X, et al. Cryo-EM structures and transport mechanism of human P5B type ATPase ATP13A2. Cell Discov. 2021;7(1):106. doi: 10.1038/s41421-021-00334-6 [DOI] [PMC free article] [PubMed] [Google Scholar]
- 16.Dirr ER, Ekhator OR, Blackwood R, Holden JG, Masliah E, Schultheis PJ, et al. Exacerbation of sensorimotor dysfunction in mice deficient in Atp13a2 and overexpressing human wildtype alpha-synuclein. Behav Brain Res. 2018;343:41–9. doi: 10.1016/j.bbr.2018.01.029 [DOI] [PMC free article] [PubMed] [Google Scholar]
- 17.Schultheis PJ, Fleming SM, Clippinger AK, Lewis J, Tsunemi T, Giasson B, et al. Atp13a2-deficient mice exhibit neuronal ceroid lipofuscinosis, limited α-synuclein accumulation and age-dependent sensorimotor deficits. Hum Mol Genet. 2013;22(10):2067–82. doi: 10.1093/hmg/ddt057 [DOI] [PMC free article] [PubMed] [Google Scholar]
- 18.Sato S, Koike M, Funayama M, Ezaki J, Fukuda T, Ueno T, et al. Lysosomal Storage of Subunit c of Mitochondrial ATP Synthase in Brain-Specific Atp13a2-Deficient Mice. Am J Pathol. 2016;186(12):3074–82. doi: 10.1016/j.ajpath.2016.08.006 [DOI] [PubMed] [Google Scholar]
- 19.Dehay B, Martinez-Vicente M, Ramirez A, Perier C, Klein C, Vila M, et al. Lysosomal dysfunction in Parkinson disease: ATP13A2 gets into the groove. Autophagy. 2012;8(9):1389–91. doi: 10.4161/auto.21011 [DOI] [PMC free article] [PubMed] [Google Scholar]
- 20.Grünewald A, Arns B, Seibler P, Rakovic A, Münchau A, Ramirez A, et al. ATP13A2 mutations impair mitochondrial function in fibroblasts from patients with Kufor-Rakeb syndrome. Neurobiol Aging. 2012;33(8):1843.e1-7. doi: 10.1016/j.neurobiolaging.2011.12.035 [DOI] [PubMed] [Google Scholar]
- 21.Gusdon AM, Zhu J, Van Houten B, Chu CT. ATP13A2 regulates mitochondrial bioenergetics through macroautophagy. Neurobiol Dis. 2012;45(3):962–72. doi: 10.1016/j.nbd.2011.12.015 [DOI] [PMC free article] [PubMed] [Google Scholar]
- 22.Matsui H, Sato F, Sato S, Koike M, Taruno Y, Saiki S, et al. ATP13A2 deficiency induces a decrease in cathepsin D activity, fingerprint-like inclusion body formation, and selective degeneration of dopaminergic neurons. FEBS Lett. 2013;587(9):1316–25. doi: 10.1016/j.febslet.2013.02.046 [DOI] [PubMed] [Google Scholar]
- 23.Bento CF, Ashkenazi A, Jimenez-Sanchez M, Rubinsztein DC. The Parkinson’s disease-associated genes ATP13A2 and SYT11 regulate autophagy via a common pathway. Nat Commun. 2016;7:11803. doi: 10.1038/ncomms11803 [DOI] [PMC free article] [PubMed] [Google Scholar]
- 24.Demirsoy S, Martin S, Motamedi S, van Veen S, Holemans T, Van den Haute C, et al. ATP13A2/PARK9 regulates endo-/lysosomal cargo sorting and proteostasis through a novel PI(3, 5)P2-mediated scaffolding function. Hum Mol Genet. 2017;26(9):1656–69. doi: 10.1093/hmg/ddx070 [DOI] [PubMed] [Google Scholar]
- 25.Matsui H, Ito J, Matsui N, Uechi T, Onodera O, Kakita A. Cytosolic dsDNA of mitochondrial origin induces cytotoxicity and neurodegeneration in cellular and zebrafish models of Parkinson’s disease. Nat Commun. 2021;12(1):3101. doi: 10.1038/s41467-021-23452-x [DOI] [PMC free article] [PubMed] [Google Scholar]
- 26.Anand N, Holcom A, Broussalian M, Schmidt M, Chinta SJ, Lithgow GJ, et al. Dysregulated iron metabolism in C. elegans catp-6/ATP13A2 mutant impairs mitochondrial function. Neurobiol Dis. 2020;139:104786. doi: 10.1016/j.nbd.2020.104786 [DOI] [PMC free article] [PubMed] [Google Scholar]
- 27.Wang R, Tan J, Chen T, Han H, Tian R, Tan Y, et al. ATP13A2 facilitates HDAC6 recruitment to lysosome to promote autophagosome-lysosome fusion. J Cell Biol. 2019;218(1):267–84. doi: 10.1083/jcb.201804165 [DOI] [PMC free article] [PubMed] [Google Scholar]
- 28.Yamada T, Murata D, Adachi Y, Itoh K, Kameoka S, Igarashi A, et al. Mitochondrial Stasis Reveals p62-Mediated Ubiquitination in Parkin-Independent Mitophagy and Mitigates Nonalcoholic Fatty Liver Disease. Cell Metab. 2018;28(4):588–604.e5. doi: 10.1016/j.cmet.2018.06.014 [DOI] [PMC free article] [PubMed] [Google Scholar]
- 29.Friedman JR, Lackner LL, West M, DiBenedetto JR, Nunnari J, Voeltz GK. ER tubules mark sites of mitochondrial division. Science. 2011;334(6054):358–62. doi: 10.1126/science.1207385 [DOI] [PMC free article] [PubMed] [Google Scholar]
- 30.Gutscher M, Pauleau AL, Marty L, Brach T, Wabnitz GH, Samstag Y, et al. Real-time imaging of the intracellular glutathione redox potential. Nat Methods. 2008;5(6):553–9. doi: 10.1038/nmeth.1212 [DOI] [PubMed] [Google Scholar]
- 31.Sherer NM, Lehmann MJ, Jimenez-Soto LF, Ingmundson A, Horner SM, Cicchetti G, et al. Visualization of retroviral replication in living cells reveals budding into multivesicular bodies. Traffic. 2003;4(11):785–801. doi: 10.1034/j.1600-0854.2003.00135.x [DOI] [PubMed] [Google Scholar]
- 32.Lee IH, Cao L, Mostoslavsky R, Lombard DB, Liu J, Bruns NE, et al. A role for the NAD-dependent deacetylase Sirt1 in the regulation of autophagy. Proc Natl Acad Sci U S A. 2008;105(9):3374–9. doi: 10.1073/pnas.0712145105 [DOI] [PMC free article] [PubMed] [Google Scholar]
- 33.Hatori Y, Kubo T, Sato Y, Inouye S, Akagi R, Seyama T. Visualization of the Redox Status of Cytosolic Glutathione Using the Organelle- and Cytoskeleton-Targeted Redox Sensors. Antioxidants (Basel). 2020;9(2). doi: 10.3390/antiox9020129 [DOI] [PMC free article] [PubMed] [Google Scholar]
- 34.Hatori Y, Inouye S, Akagi R, Seyama T. Local redox environment beneath biological membranes probed by palmitoylated-roGFP. Redox Biol. 2018;14:679–85. doi: 10.1016/j.redox.2017.11.015 [DOI] [PMC free article] [PubMed] [Google Scholar]
- 35.Schindelin J, Rueden CT, Hiner MC, Eliceiri KW. The ImageJ ecosystem: An open platform for biomedical image analysis. Mol Reprod Dev. 2015;82(7–8):518–29. doi: 10.1002/mrd.22489 [DOI] [PMC free article] [PubMed] [Google Scholar]
- 36.Schindelin J, Arganda-Carreras I, Frise E, Kaynig V, Longair M, Pietzsch T, et al. Fiji: an open-source platform for biological-image analysis. Nat Methods. 2012;9(7):676–82. doi: 10.1038/nmeth.2019 [DOI] [PMC free article] [PubMed] [Google Scholar]
- 37.Miyara M, Kotake Y, Tokunaga W, Sanoh S, Ohta S. Mild MPP(+) exposure impairs autophagic degradation through a novel lysosomal acidity-independent mechanism. J Neurochem. 2016;139(2):294–308. doi: 10.1111/jnc.13700 [DOI] [PubMed] [Google Scholar]
- 38.McWilliams TG, Prescott AR, Allen GF, Tamjar J, Munson MJ, Thomson C, et al. mito-QC illuminates mitophagy and mitochondrial architecture in vivo. J Cell Biol. 2016;214(3):333–45. doi: 10.1083/jcb.201603039 [DOI] [PMC free article] [PubMed] [Google Scholar]
- 39.Rojansky R, Cha MY, Chan DC. Elimination of paternal mitochondria in mouse embryos occurs through autophagic degradation dependent on PARKIN and MUL1. Elife. 2016;5. doi: 10.7554/eLife.17896 [DOI] [PMC free article] [PubMed] [Google Scholar]
- 40.Itoh K, Nakamura K, Iijima M, Sesaki H. Mitochondrial dynamics in neurodegeneration. Trends Cell Biol. 2013;23(2):64–71. doi: 10.1016/j.tcb.2012.10.006 [DOI] [PMC free article] [PubMed] [Google Scholar]
- 41.Madeo F, Eisenberg T, Pietrocola F, Kroemer G. Spermidine in health and disease. Science. 2018;359(6374). doi: 10.1126/science.aan2788 [DOI] [PubMed] [Google Scholar]
- 42.Eisenberg T, Abdellatif M, Schroeder S, Primessnig U, Stekovic S, Pendl T, et al. Cardioprotection and lifespan extension by the natural polyamine spermidine. Nat Med. 2016;22(12):1428–38. doi: 10.1038/nm.4222 [DOI] [PMC free article] [PubMed] [Google Scholar]
- 43.Saiki S, Sasazawa Y, Fujimaki M, Kamagata K, Kaga N, Taka H, et al. A metabolic profile of polyamines in parkinson disease: A promising biomarker. Ann Neurol. 2019;86(2):251–63. doi: 10.1002/ana.25516 [DOI] [PMC free article] [PubMed] [Google Scholar]
- 44.Schroeder S, Hofer SJ, Zimmermann A, Pechlaner R, Dammbrueck C, Pendl T, et al. Dietary spermidine improves cognitive function. Cell Rep. 2021;35(2):108985. doi: 10.1016/j.celrep.2021.108985 [DOI] [PubMed] [Google Scholar]
- 45.McKenna MJ, Sim SI, Ordureau A, Wei L, Harper JW, Shao S, et al. The endoplasmic reticulum P5A-ATPase is a transmembrane helix dislocase. Science. 2020;369(6511). doi: 10.1126/science.abc5809 [DOI] [PMC free article] [PubMed] [Google Scholar]
- 46.Lazarou M, Jin SM, Kane LA, Youle RJ. Role of PINK1 binding to the TOM complex and alternate intracellular membranes in recruitment and activation of the E3 ligase Parkin. Dev Cell. 2012;22(2):320–33. doi: 10.1016/j.devcel.2011.12.014 [DOI] [PMC free article] [PubMed] [Google Scholar]
- 47.Okatsu K, Uno M, Koyano F, Go E, Kimura M, Oka T, et al. A dimeric PINK1-containing complex on depolarized mitochondria stimulates Parkin recruitment. J Biol Chem. 2013;288(51):36372–84. doi: 10.1074/jbc.M113.509653 [DOI] [PMC free article] [PubMed] [Google Scholar]
- 48.Rasool S, Veyron S, Soya N, Eldeeb MA, Lukacs GL, Fon EA, et al. Mechanism of PINK1 activation by autophosphorylation and insights into assembly on the TOM complex. Mol Cell. 2022;82(1):44–59.e6. doi: 10.1016/j.molcel.2021.11.012 [DOI] [PubMed] [Google Scholar]
Associated Data
This section collects any data citations, data availability statements, or supplementary materials included in this article.
Supplementary Materials
Only representative images are shown in the main Fig 2.
(PDF)
Representative 3 plots for each experimental condition are shown. A, ATP13A2-Halo-OregonG vs LysoTracker. B, ATP13A2-Halo-OregonG vs MitoTracker.
(PDF)
Representative 3 plots for each experimental condition are shown. Cells were co-transfected with ATP13A2-Halo (B), resulting in partial segregation of Tom20 signals from Mito Grx1-roGFP2 signals (dashed circles). Without ATP13A2 co-transfection (A), Mito Grx1-roGFP2 and mCherry-Tom20-N signals produced practically perfect overlap.
(PDF)
Representative 3 plots for each experimental condition are shown. A, Mito Grx1-roGFP2 vs ATP13A2-Halo-TMR. B, ATP13A2-Halo-OregonG vs mCherry-Tom20-N. C, ATP13A2(D513A)-Halo-OregonG vs mCherry-Tom20-N.
(PDF)
GFP-Mff and ATP13A2-Halo were cotransfected and ATP13A2-Halo was labeled by TMR ligand, followed by live-cell imaging.
(PDF)
Representative 3 plots for each experimental condition are shown. Cells were incubated in the presence of 500 μM MPP+ for 24 hours (upper panel). For comparison, data for normal conditions (the same as the plots shown in B in S4 Fig) are shown (lower panel).
(PDF)
Nonspecific bands are marked with asterisks.
(PDF)
Data Availability Statement
All relevant data are within the manuscript and its Supporting Information files.


