Abstract
Background
Spur, a structure capable of producing and storing nectar, not only plays a vital role in the pollination process but also promotes the rapid diversification of some plant lineages, which is considered a key innovation in plants. Spur is the focus of many studies, such as evolution and ecological hypothesis, but the current understanding of spur development is limited. High-throughput sequencing of Impatiens uliginosa was carried out to study the molecular mechanism of its spur development, which is believed to provide some insights into the spur development of Impatiens.
Results
Transcriptomic sequencing and analysis were performed on spurs and limbs of I. uliginosa at three developmental stages. A total of 47.83 Gb of clean data were obtained, and 49,716 unigene genes were assembled. After comparison with NR, Swiss-Prot, Pfam, COG, GO and KEGG databases, a total of 27,686 genes were annotated successfully. Through comparative analysis, 19,356 differentially expressed genes were found and enriched into 208 GO terms and 146 KEGG pathways, among which plant hormone signal transduction was the most significantly enriched pathway. One thousand thirty-two transcription factors were identified, which belonged to 33 TF families such as MYB, bHLH and TCP. Twenty candidate genes that may be involved in spur development were screened and verified by qPCR, such as SBP, IAA and ABP.
Conclusions
Transcriptome data of different developmental stages of spurs were obtained, and a series of candidate genes related to spur development were identified. The importance of genes related to cell cycle, cell division, cell elongation and hormones in spur development was clarified. This study provided valuable information and resources for understanding the molecular mechanism of spur development in Impatiens.
Supplementary Information
The online version contains supplementary material available at 10.1186/s12870-022-03894-1.
Keywords: Impatiens uliginosa, Transcriptome, Nectar spur, Spur development
Introduction
Floral spur, the tubular outgrowth of a plant petal or sepal, widely exists in a variety of taxa, such as Impatiens (Balsaminaceae), Aquilegia (Ranunculaceae), Linaria (Plantaginaceae), etc. As a structure that produces and stores nectar (or disguised as such), spur plays a vital role in plant pollination by providing rewards to attract pollinators. The interactions with spurs lead to pollinator specialization, which promotes reproductive isolation and speciation in certain plant phylogenetic lineages [1, 2]. Therefore, spur is considered a ‘key innovation’ [3, 4]. Early studies on spurs focused on pollination biology. Two hypotheses based on the study of Angraecum, ‘coevolutionary race’ and ‘pollinator shift’, both speculated that with the continuous adaptation of pollinators with longer tongues, spurred plants were more specialized in morphology and function, and short-tongued pollinators would be gradually excluded from the pollination system [5, 6]. Another recent study showed a different view. Impatiens burtonii seemed to be more generalized than the specialization of previous studies. The complex structure of spurs in I. burtonii separated pollinators’ spatial and temporal niches, thus allowing pollination of both short-tongued and long-tongued visitors [7]. The adaptation and evolution of spurred plants of different groups to natural pressure seem diverse.
Studies on Aquilegia and Linaria have shown two types of spur development patterns. In Aquilegia, the spurs go through two stages of development. At stage 1, local cell divisions around the presumptive nectary gave rise to the nectary cup, namely the nascent spur, and then division activity ceased when the spur was only a small fraction of the final length. Then anisotropic cell elongation brought spur to its final morphology at stage 2 [8]. Centranthus ruber also had two stages of spur development that were highly similar to Aquilegia. The difference was that although the cell division diminished significantly at the end of the first stage in C. ruber, it did not stop completely, and there was still a small amount of cell division activity in the later stages of development [9]. In contrast to this anisotropic elongation dominated development model, in Linaria, spur length depended primarily on the number of cells from the initial cell division, although slow anisotropic growth remains throughout development [10]. Spur development includes cell division and anisotropic cell elongation [11]. It plays a role in different populations through unique combination patterns, which makes the development and evolution of spur have different mechanisms in different plant systems.
The mutation of Hirzina and Invaginata loci led to the ectopic expression of KNOX, resulting in a spur-like structure on the petals of Antirrhinum majus, which does not have a spur [12]. The homologous of KNOX was highly expressed in the petals of Linaria vulgaris and Dactylorhiza fuchsia, and the introduction of exogenous KNOX of A. majus and L. vulgaris into tobacco produced sac-like protrusions [12, 13]. KNOX seems to be the key to regulating the formation of spurs in these plants. However, studies on Papaveraceae showed that spur formation is not significantly related to the expression of KNOX, suggesting other possibilities for the molecular mechanism of spur development [14]. The hybridization experiment between Aquilegia ecalcarata and spurred species showed that there was a single genetic factor regulating the presence/absence of spur in Aquilegia, which was later proved to be POPOVICH, a transcription factor encoding C2H2 zinc finger protein [15–17]. Downstream of this locus, multiple genes regulated the variation of spur length, such as ARF6, ARF8, and so on [18]. In addition, TCP4 gene regulated the normal development of spur by inhibiting the cell proliferation of the distal part, while KNOX was not involved in the main regulation process [19].
Extensive research on spur has been carried out in many aspects. It can be seen that there are differences among systems in terms of interaction with pollinators and mechanisms of development. Spur in each group has its unique evolutionary mode and developmental system in the long process of evolution. As a spurred species, there have been some studies on the pollination biology of Impatiens [7, 20], but research on spur development is lacking. De novo transcriptome sequencing was performed on the limb and nectar spur of I. uliginosa to explore the molecular mechanism of spur development in Impatiens. Some candidate genes involved in spur development were identified by detailed analysis. This study may provide some insights into the spur development mechanism of Impatiens.
Results
Spur development of I. uliginosa
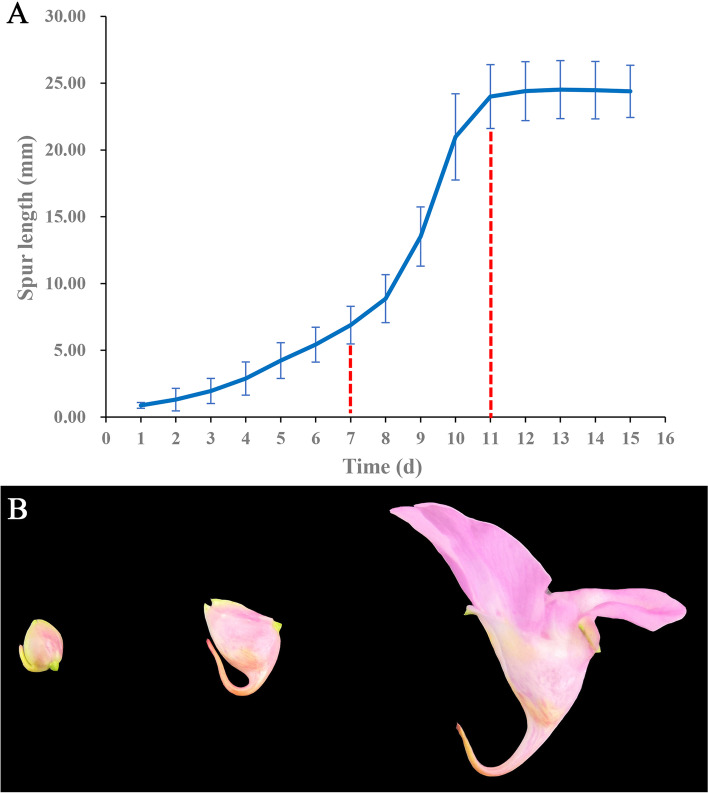
The bud with undeveloped spur from each of the 30 well-growing plants of I. uliginosa was selected randomly and observed every day. When the bulge of the spur was observed, the day was recorded as day 1. Spur length was measured at the same time every day until the flowers withered. Finally, growth data were obtained for a total of 30 spurs, 4 of which showed great individual differences. The time frame of development of these 4 individuals was significantly shorter than the average level, so the data were not used. The data of the other 26 individuals were used to draw the spur growth curve (Fig. 1A).
Fig. 1.
A Average growth curve of spur of I. uliginosa. The red dashed line indicates the boundary between the three development stages B Spur in the early stage, showing a straight appearance (left); Spur in the middle stage, producing an inward curve (middle); Spur at anthesis (right)
According to the growth curve and the morphological characteristics of spur, three development stages were divided. The early stage lasted about 7 days, and spur grew from the bottom of the funnel-shaped labellum to 5 ~ 8 mm long. Different from species with straight spurs, such as Aquilegia and Linaria, although the spur of I. uliginosa also grew in a straight line at this stage, it was oriented upwards. Then, in the middle stage, the growth rate greatly increased, extending to about 25 mm in about 4 days. The spur bent from its junction with the limbs, and the tip of spur was still upward while the part from the connection to the bend grew downward. Some spurs stopped growing completely at the blooming stage, while others continued to elongate by about 1 ~ 2 mm. Spur length basically reached a stable state until the flowers withered (Fig. 1B).
RNA sequencing and de novo assembly of transcriptome
Transcriptome analysis was performed on spurs and limbs at different developmental stages, which were designated DEC (spur in early stage), DEB (limb in early stage), DMC (spur in middle stage), DMB (limb in middle stage), DAC (spur at anthesis) and DAB (limb at anthesis). A total of 321,843,272 raw reads and 48.6 Gb of raw data were generated. After quality control, 47.83 GB high quality clean data were obtained with approximately 50 million clean reads for each sample. Q30 ranged from 94.95 to 95.83% and GC content was above 43.94%. The mapping ratio of the six samples was more than 81.50% (Table 1).
Table 1.
Summary of sequencing data of I. uliginosa transcriptome
| Attributes | DEC | DEB | DMC | DMB | DAC | DAB |
|---|---|---|---|---|---|---|
| Raw reads | 50,368,450 | 56,275,322 | 53,164,256 | 50,216,112 | 53,406,892 | 58,412,240 |
| Clean reads | 50,026,772 | 55,913,178 | 52,731,754 | 49,831,786 | 52,961,214 | 58,019,782 |
| Clean bases | 7,492,666,959 | 8,378,452,375 | 7,899,088,388 | 7,457,133,163 | 7,916,885,573 | 8,688,078,396 |
| Q30(%) | 95.83 | 95.36 | 95.04 | 94.95 | 94.95 | 95.45 |
| GC content(%) | 44.06 | 44.38 | 44.15 | 43.94 | 44.69 | 44.21 |
| Total mapped |
41,733,944 (83.42%) |
47,119,790 (84.27%) |
44,451,460 (84.30%) |
41,554,626 (83.39%) |
43,163,028 (81.50%) |
48,458,136 (83.52%) |
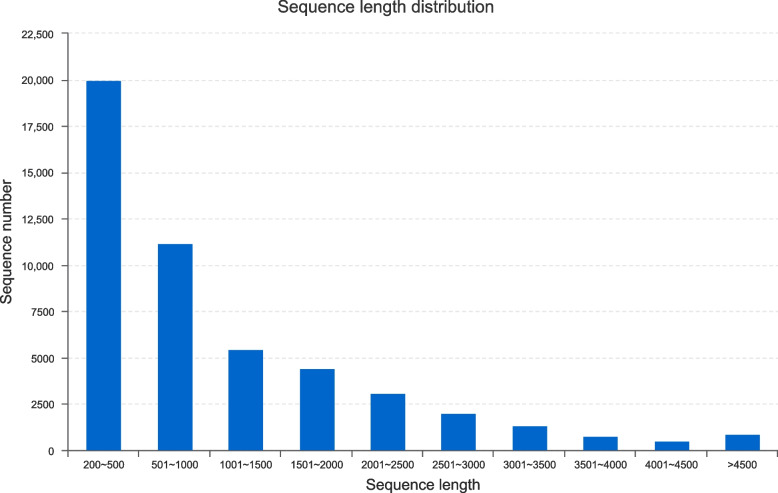
De novo assembly was performed on high quality reads, and 86,413 transcripts (119.7 Mb of sequence) were produced after optimization and filtration. The maximal and minimal transcript length was 13,646 and 201 bp respectively, with an average length of 1384.75 bp and N50 value of 2068 bp. A total of 49,716 unigenes (55.9 Mb of sequence) were obtained, the maximum length and minimum length were consistent with the transcripts, with an average length of 1124.51 bp and N50 value of 1928 bp (Table 2). 82% of the unigenes ranged from 200 to 2000 bp, 15% ranged from 2000 to 4000 bp, and 1421 unigenes were over 4000 bp, accounting for 3% of the total (Fig. 2).
Table 2.
Statistics of transcriptome assembly
| Attributes | unigenes | transcripts |
|---|---|---|
| Total number | 49,716 | 86,413 |
| Total base | 55,906,377 | 119,660,062 |
| Largest length (bp) | 13,646 | 13,646 |
| Smallest length (bp) | 201 | 201 |
| Average length (bp) | 1124.51 | 1384.75 |
| N50 length (bp) | 1928 | 2068 |
Fig. 2.
Length distribution of unigenes
Functional annotation
BLAST search (E-value < 1e-5) was used to compare the assembled sequences with NR (NCBI Non-Redundant Protein Sequence Database), Swiss-Prot, Pfam (Protein families), COG (Clusters of Orthologous Groups of proteins), GO (Gene Ontology) and KEGG (Kyoto Encyclopedia of Genes and Genomes) databases to obtain the annotation information of transcriptome. Of all the 49,716 unigenes, 55.69% (27,686 unigenes) were successfully annotated in the six databases (Table 3, Table S1). 25,813 (51.92%) unigenes were aligned to the NR database, 44.54% (11,496 unigenes) of the mapped sequences showed a similarity of more than 80%, and 19,507 unigenes (75.57%) showed high homology (<1E-30). Camellia sinensis (6182, 23.95%), Actinidia chinensis (4594, 17.8%), Vitis vinifera (1189, 4.61%), Quercus suber (1039, 4.03%) and Oryza sativa (364, 1.41%) were the top five species that showed similarity with unigenes of I. uliginosa (Fig. S1). 22,028 and 22,214 unigenes were assigned to Swiss-Prot and Pfam databases respectively.
Table 3.
Functional annotation of I. uliginosa unigenes
| Database | Number of unigenes | Percentage |
|---|---|---|
| NR | 25,813 | 51.92% |
| Swiss-Prot | 22,028 | 44.31% |
| Pfam | 22,214 | 44.68% |
| COG | 25,018 | 50.32% |
| GO | 21,955 | 44.16% |
| KEGG | 13,416 | 26.99% |
| Total | 27,686 | 55.69% |
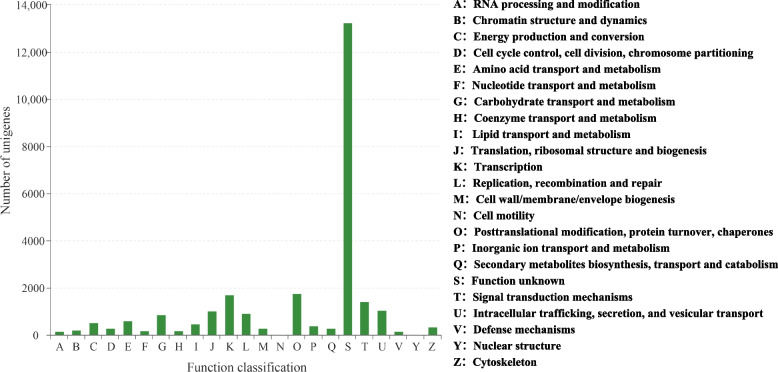
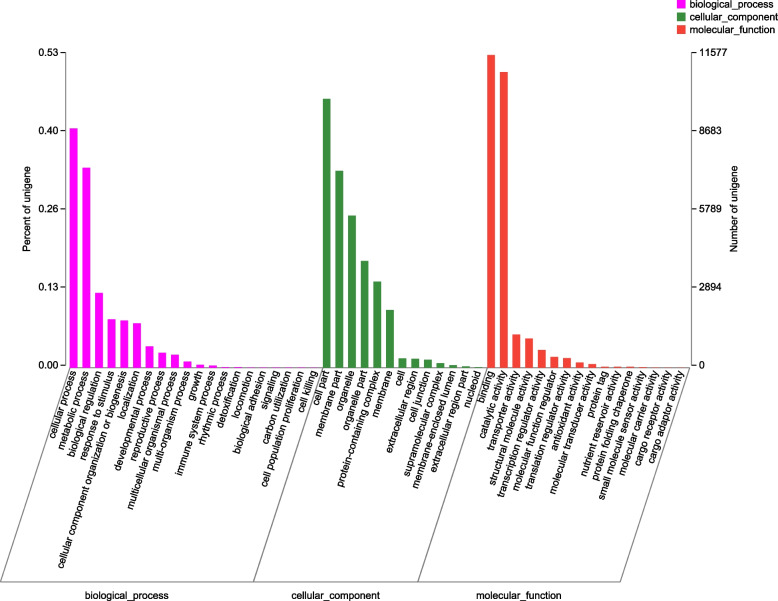
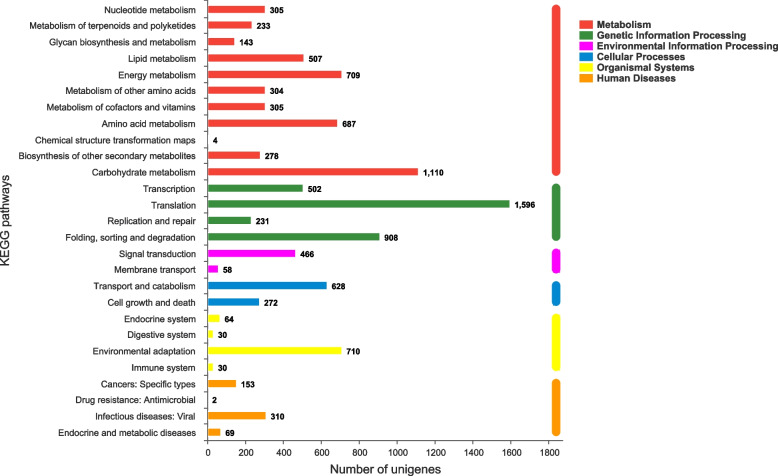
A total of 25,018 unigenes were assigned to the 23 COG categories, 13,235 of which had poor characteristics and were matched to unknown functions. Among the effectively annotated unigenes, the largest group was ‘posttranslational modification, protein turnover, chaperones’, followed by ‘transcription’ and ‘signal transduction mechanisms’ (Fig. 3). Twenty-one thousand nine hundred fifty-five unigenes were classified into at least one GO term. ‘Cellular process’ and ‘metabolic process’ were the most abundant subcategories for biological process (BP). Within the cellular component category (CC), most unigenes were clustered in ‘cell part’. At the level of molecular function (MF), ‘binding’ and ‘catalytic activity’ were the most significant subcategories (Fig. 4). Thirteen thousand four hundred sixteen unigenes successfully annotated to KEGG were classified into 27 pathways in five main categories. Most genes were associated with the categories ‘metabolism’ and ‘genetic information processing’, and pathways such as ‘translation’, ‘carbohydrate metabolism’ and ‘folding, sorting and degradation’ were the most representative (Fig. 5).
Fig. 3.
COG classification of unigenes in I. uliginosa
Fig. 4.
Main GO categories of unigenes in I. uliginosa transcriptome
Fig. 5.
KEGG metabolic pathway of unigenes in I. uliginosa
Differential gene expression
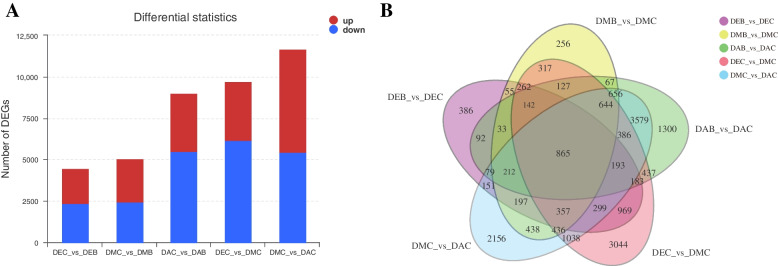
In order to explore the genes that may be involved in regulating the spur development of I. uliginosa, the differential expression between different developmental stages and tissues was analyzed. The results showed that a total of 19,356 genes were differentially expressed among five groups (p-adjust < 0.001, |log2FC| ≥1) (Fig. 6A). During the three developmental stages, 4475, 5064 and 8995 genes were differentially expressed between limbs and spurs, with 2347, 2440, 5486 up-regulated and 2128, 2624, 3509 down-regulated, respectively. In spurs, there were 9699 DEGs (differential expression genes) between the early stage and the middle stage, with 3533 up-regulated and 6166 down-regulated, and 11,686 DEGs between the middle stage and anthesis, with 6237 up-regulated and 5449 down-regulated. There were 865 DEGs shared among these five groups (Fig. 6B).
Fig. 6.
A Differentially expressed genes in different developmental stages and tissues B Venn diagram of DEGs
Enrichment analysis of DEGs
Functional enrichment analysis of DEGs was carried out to understand their possible roles in spur development. The results indicated that all 19,356 DEGs were matched to 208 GO terms, of which 30 terms were significantly enriched (p-adjust < 0.05) (Table S2). ‘cell wall organization or biogenesis’, ‘photosystem II’ and ‘DNA-binding transcription factor activity’ were the most significantly enriched terms, respectively (Fig. 7A). Notably, the main enrichment function of DEGs changed at different developmental stages. In the early stage (DEB_vs_DEC), ‘photosynthesis, light harvesting’, ‘regulation of cell cycle’, ‘protein-chromophore linkage’ and ‘auxin-activated signaling pathway’ were very significant biological processes, while in the middle stage (DMB_vs_DMC), ‘metal ion transport’ was one of the most abundant terms. ‘External encapsulating structure organization’ and ‘cell wall organization’ were very prominent in both the middle and flowering stages (DMB_vs_DMC, DAB_vs_DAC, DMC_vs_DAC), while ‘hormone-mediated signaling pathway’ played an important role in the whole development process (Fig. S2).
Fig. 7.
A The top 20 enriched GO terms of DEGs B The top 20 enriched KEGG pathways of DEGs
KEGG enrichment analysis of DEGs indicated that all 19,356 unigenes were assigned to 146 KEGG pathways, and 7 of them showed significant enrichment (p-adjust < 0.05) (Fig. 7B, Table S3). Further analysis of DEGs in different stages and tissues showed that ‘Plant hormone signal transduction’ was the most abundant pathway in all stages of spur development, while ‘Photosynthesis - antenna proteins’, ‘Phenylpropanoid biosynthesis’, ‘Monoterpenoid biosynthesis’, ‘Plant-pathogen interaction’, ‘Photosynthesis’ and ‘Fatty acid elongation’ were very prominent in both early and middle stages (DEB_vs_DEC, DMB_vs_DMC, DEC_vs_DMC). ‘Homologous recombination’ and ‘MAPK signaling pathway’ showed significant enrichment only in the early stage (DEB_vs_DEC), while ‘Steroid biosynthesis’ and ‘Cutin, suberine and wax biosynthesis’ showed significant enrichment only in the middle stage (DMB_vs_DMC). The pathways significantly enriched at the flowering stage (DAB_vs_DAC) were basically different from other groups, such as ‘Thermogenesis’, ‘Fatty acid degradation’ and ‘Spliceosome’, etc. (Fig. S3).
Identification of transcription factors
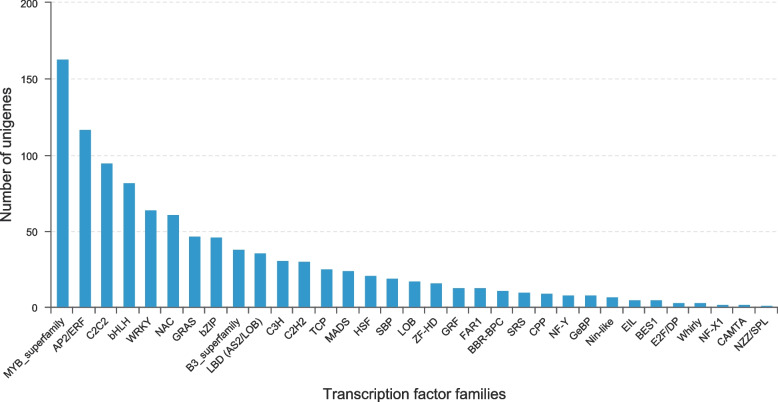
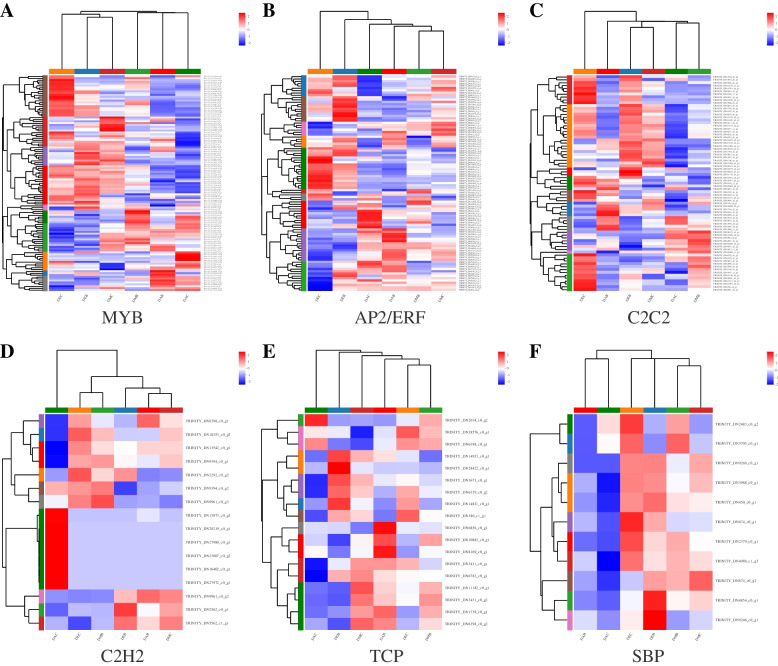
Transcription factors were predicted by analyzing the domain information in the transcripts. A total of 1032 unigenes were annotated as transcription factors, belonging to 33 transcription factor families (Fig. 8). The most prominent family is MYB, which is assigned 163 genes, followed by AP2/ERF (117), C2C2 (95), bHLH (82) and WRKY (64). In addition, C2H2, TCP and GRF families have been proved to play an important role in spur development in Aquilegia. SBP family was well represented in the transcriptome of I. uliginosa. Of all the transcription factors, 726 genes were differentially expressed across tissues, the most significant being up to 2280-fold (Table S4). Most genes of MYB and C2C2 had high expression in the early stage, gradually down-regulated in the middle stage and blooming stage (Fig. 9A, C). AP2/ERF TFs showed two trends, one with higher expression in the early stage, down-regulated in the middle stage and blooming stage, the other with lower expression in the early and middle stages, then up-regulated in the flowering stage (Fig. 9B). Some TFs of C2H2 were highly expressed only in spur at anthesis but very low within other tissues, while the other TFs showed significant differences in spur and limb at each stage (Fig. 9D). The expression levels of TCP and SBP TFs were relatively high in the early and middle stages, but low in anthesis (Fig. 9E, F).
Fig. 8.
Families of transcription factors identified in the I. uliginosa transcriptome
Fig. 9.
Cluster heat maps of DEGs in transcription factor families A MYB B AP2/ERF C C2C2 D C2H2 E TCP F SBP
Candidate genes involved in petal development
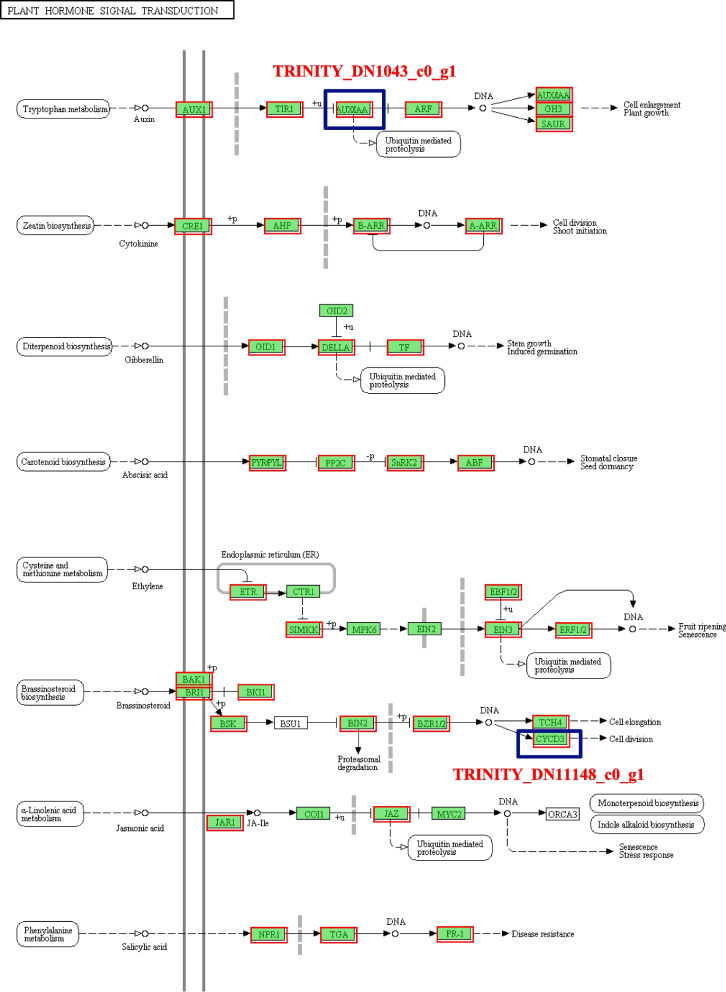
Twenty candidate genes involved in spur development were identified according to their function and differential expression in different tissues (Table S5). These included two genes annotated as Extensin, with extremely high expression levels (TPM > 2000) in the early spur and significant differences from the limb (fold change > 220); three SBP transcription factors that proved to play a regulatory role in flower development; one Cyclin gene (TRINITY_DN11148_c0_g1) and one IAA gene (TRINITY_DN1043_c0_g1) located in ‘plant hormone signal transduction’, the most significantly enriched pathway (Fig. 10) [21]. Some genes that have been confirmed to regulate the development of spur in species such as Aquilegia and Linaria have also performed well in I. uliginosa, including three Aquaporin genes, one KNOX gene and two TCP4 genes. In addition, there are three genes encoding Dof zinc finger protein, one cell division cycle gene, one ABP gene, one floral-binding protein gene and one Expansin gene.
Fig. 10.
The pathway of plant hormone signal transduction, two thick blue boxes represent the location of candidate genes
qRT-PCR validation of the candidate genes
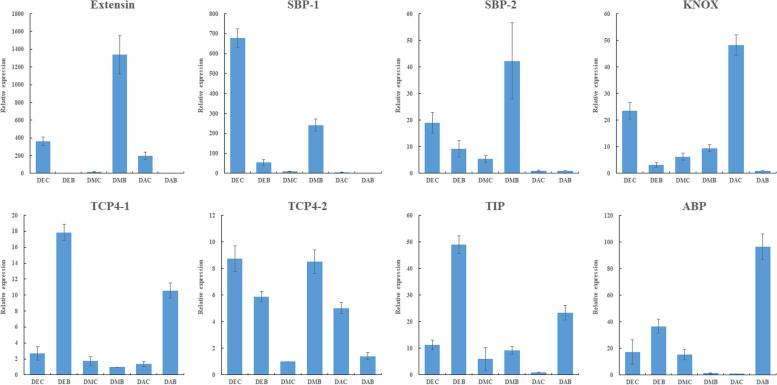
Eight candidate genes were selected for qRT-PCR to verify the accuracy of transcriptome data (Fig. 11, Table S6). The qPCR results showed that Extensin, KNOX and TCP4–2 [22] represented similar expression trends, with expression differences between spurs and limbs in all three stages. The expression of spurs was higher than that of limbs in the early and anthesis stages, while in the middle stage, it was the limb higher than the spur. The expression trends of SBPs in the early and middle stages were similar to Extensin but were very low in both the spur and limb at the flowering stage. The expression levels of TCP4–1 [22], TIP [23] and ABP [24] genes in limbs were significantly higher than spurs in the early stages but did not show much difference in the middle stage. All the verified genes had similar expression patterns to the transcriptome data, and there was a strong correlation between their expression levels (Fig. S4). Therefore, the transcriptome data can be used to analyze genes related to spur development.
Fig. 11.
Expression analysis of eight candidate genes in 6 tissues by qRT-PCR. DEC: spur in the early stage, DEB: limb in the early stage, DMC: spur in the middle stage, DMB: limb in the middle stage, DAC: spur at anthesis, DAB: limb at anthesis
Discussion
Spur plays a vital role in the pollination process. Its special structure will not only affect the preferences and behavior of pollinators but also further affect the composition of the pollination system, and it may play a role in ecological control [25–28]. The morphology of spur itself may also evolve and change due to the interaction with pollinators. This trait has rapidly diversified the species of some plant lineages, making it known as a ‘key innovation’. These characteristics made spur became the focus of many botanists’ research. All species in Impatiens contain the spur structure and have abundant morphological differences between species, which is an ideal population for studying spur. However, the current research on the spur of Impatiens mainly focused on pollination biology and morphological structure [7, 20, 29], and there was no relevant report on the mechanism of spur development. According to previous studies, it can be seen that there was no unified pattern of spur development among different plant groups, such as Aquilegia and Linaria. Impatiens has different curved spur from Aquilegia, Linaria and Centranthus ruber, which makes it more likely to have a distinctive development model. Therefore, I. uliginosa was selected for transcriptome sequencing analysis to dig out the key genes related to spur development to conduct an in-depth study on the mechanism of spur development of Impatiens.
Studies on the spur of Aquilegia have confirmed that genes with differences between spur and blade tissue are likely to be involved in the regulation of spur development [17–19]. The labellum of I. uliginosa was similar to the petals of Aquilegia to some extent in structure, that is, a tubular spur was extended at the bottom of the funnel-shaped petals. Therefore, referring to the research method of Aquilegia, spur and limb tissues of different development stages were taken for transcriptome sequencing analysis. After quality control and assembly evaluation, a total of 47.83 GB of high-quality cleaning data and 49,716 unigenes were obtained, with an average length of 1124.51 bp and N50 of 1928 bp. These length attributes of unigenes had better performance than the published data of Camellia Sasanqua [30], Rhododendron Rex [31], Ocimum Americanum [32] and Gmelina area [33], and the good quality of this transcriptome data was available for the subsequent analysis.
The expression of genes in tissues at different developmental stages and positions (DEB vs DEC, DMB vs DMC, DAB vs DAC, DEC vs DMC, DMC vs DAC) were analyzed. Among all the 49,716 unigenes, a total of 19,356 genes showed expression differences, of which 865 genes showed differences in all five groups. GO and KEGG enrichment analyses were carried out to further explore how these DEGs play a role in spur development. The results showed that in the early stage, DEGs were significantly enriched in terms such as ‘regulation of cell cycle’, ‘auxin-activated signaling pathway’, ‘zeatin biosynthesis’, ‘DNA replication’ and ‘brassinosteroid biosynthesis’, which proved that cell division and growth activities were vigorous in the early stage, which was consistent with studies of Aquilegia and Linaria on spur [10, 19, 34]. Moreover, many terms related to photosynthesis were significantly enriched in the early stage. In the middle stage, the number of terms and pathways related to cell division and growth activities decreased, with significantly reduced enrichment. The number of terms and genes related to photosynthesis also decreased, while the biological activities related to ‘cell wall organization’ were significantly enriched. During anthesis, the terms related to photosynthesis disappeared, while the biological activities related to ‘cell wall’ increased. ‘hormone-mediated signaling pathway’ and ‘plant hormone signal transduction’ were consistently the most significantly enriched terms across the three developmental stages.
Transcription factors play an important role in regulating plant growth and development and stress resistance. MYB TFs regulated cell cycle, early inflorescence development and seed germination [35–37], and also participated in the synthesis of metabolites such as flavonol and anthocyanin in plants [38, 39]. AP2/ERF played a key regulatory role in floral development, such as promoting the establishment of floral meristem, regulating the development of sepals and petals, and regulating the expression of genes related to flower development [40–43]. SBP TFs participated in regulating the development of floral organs such as megaspore, microspore, pollen tube and stamen filament, and it also affected the morphology of inflorescences and leaves [44–46]. C2H2 gene controlled the presence or absence of spur in Aquilegia [17], and TCP gene controlled the proper directed growth of spur cells [19], two known transcription factors that can affect spur growth.
In this study, a total of 1032 transcription factors belonging to 33 families were identified, of which 726 genes in 32 families were differentially expressed. DEGs in these TFS were likely to impact the regulation of spur development. MYB and AP2/ERF were the two TF families with the most abundant genes. MYB DEGs were most highly expressed in the early stage and gradually declined in the middle and flowering stages, suggesting that they might be involved in the early development of spur and cell cycle regulation. AP2/ERF genes showed two expression trends: one was highly expressed at the early stage and down-regulated at the middle and anthesis stage; the other was low expressed at the early and middle stages and up-regulated at the anthesis stage, suggesting that AP2/ERF might play an important role in the differentiation of spur. SBP DEGs have high expression in the early stage, down-regulated in the middle stage, and very low expression in the flowering stage. There was a very significant difference between spur and limb, and it was speculated that it would affect the morphogenesis of spur. C2H2 and TCP families also showed significant differences and high expression among tissues.
Twenty candidate genes that may be related to spur development were screened, and qRT-PCR was performed on eight of them to verify the reliability of transcriptome data. The results showed that these genes were significantly differentially expressed at different developmental stages and sites. Extension is the most abundant structural protein in the primary cell wall of dicotyledons, which can increase the cell wall’s strength and stiffness, control the cell wall’s elongation and regulate plant morphogenesis [47, 48]. Extension may be involved in the anisotropic elongation of spur cells. Aquaporins could efficiently transport water molecules and mediate the transport of other small molecular substances, nutrient elements and metal ions [49, 50]. The water potential gradient generated by the accumulation of solutes regulates the turgor of cells, thus promoting cell division and growth. Aquaporin TIPs and PIPs have been proved to be positively correlated with cell expansion [51, 52]. Dof genes were not only transcription regulators of cell cycle genes but also participated in the auxin response by combining with other genes [53, 54]. The development of spur is mainly a process of cell division and anisotropic elongation [11]. All of these genes involved in cell elongation, cell division, cell cycle and hormone regulation and response affected cell division and elongation activities directly or indirectly. They most likely play an essential role in the formation and development of spur.
Conclusions
This study performed transcriptome sequencing on the spur and limb tissue at various development stages of I. uliginosa. Through clustering and functional enrichment analysis of 19,356 differentially expressed genes, candidate genes related to spur development were screened. These data revealed that hormones play an important role in spur development, and genes regulating cell elongation, cell division and cycle are the most critical factors affecting spur development. This is the first study on the molecular mechanism of spur development in Impatiens, providing necessary information and a theoretical basis for the mechanism of spur development in dicotyledons.
Methods
Plant materials
Seeds of the wild population of I. uliginosa were collected from Laoyuhe Wetland Park in Kunming and cultivated into plants in the greenhouse of Southwest Forestry University. The growth conditions were maintained at 18 ~ 25 °C and 11 ~ 13 hours of daylight.
Observation of spur growth
One flower was randomly selected from each plant for a total of 30 bioreplicates. The length of each spur was measured at 9:00 a.m. every day with three technical replicates. Measurements were performed continuously for 10 to 15 days, depending on the developmental duration of the individual. Growth curves were plotted according to the observed data. Three developmental stages were determined by observing the growth curve of the spur of I. uliginosa.
RNA sequencing and de novo assembly of transcriptome
Referring to Yant et al. [19], tissues from spur and limb of three developmental stages were collected and removed tissues from the connection section (1 ~ 2 mm, Fig. S5). The dissected tissues were stored in liquid nitrogen immediately, and each sample was mixed with more than three biological replicates. Total RNA was extracted using Plant RNA Purification Reagent for plant tissue (Invitrogen, Carlsbad, CA, USA) and genomic DNA was removed using DNase I (Takara). The RNA-seq transcriptome libraries were prepared using the TruSeq™ RNA sample preparation Kit (Illumina, San Diego, CA). After being quantified by TBS380 (Picogreen), the RNAseq libraries were sequenced in a single lane on an Illumina Hiseq Xten/NovaSeq 6000 sequencer (Illumina, San Diego, CA) for 2 × 150 bp paired-end reads.
The raw paired-end reads were trimmed and quality controlled by SeqPrep (https://github.com/jstjohn/SeqPrep) and Sickle (https://github.com/najoshi/sickle) with default parameters. De novo assembly of the clean data was performed with Trinity (http://trinityrnaseq.sourceforge.net/), then the assembled transcripts were homologously clustered, and the longest transcript in each cluster was designated as unigene [55]. The assembled sequences were optimized and filtered using TransRate (http://hibberdlab.com/transrate/), CD-HIT (http://weizhongli-lab.org/cd-hit/) was used to remove redundant and similar sequences, and BUSCO (Benchmarking Universal Single-Copy Orthologs, http://busco.ezlab.org) was used to evaluate the assembly integrity of the transcriptome.
Functional annotation
All the assembled transcripts were searched against the NR, Swiss-Prot, Pfam and COG databases to retrieve function annotations. BLASTX was used to identify the proteins that had the highest sequence similarity with the given transcripts. A typical cut-off E-value was set to less than 1.0 × 10− 5. BLAST2GO (http://www.blast2go.com/b2ghome) [56] program was used to get GO annotations of unique assembled transcripts for describing biological processes, molecular functions and cellular components. Metabolic pathway analysis was performed using the KEGG database (http://www.genome.jp/kegg/) [21].
Differential expression analysis and functional enrichment
The expression level of gene and transcript was calculated using the TPM (transcripts per million reads) / FPKM (fragments per kilobases per million reads) method, and the abundances of gene and transcript were quantified using RSEM (http://deweylab.biostat.wisc.edu/rsem/) [57]. Differential expression analysis was performed using the DESeq2 [58]/DEGseq [59]/EdgeR [60] with Q value ≤0.05, genes with |log2FC| > 1 and Q value <= 0.05(DESeq2 or EdgeR) /Q value <= 0.001(DEGseq) were considered to be significantly different expressed.
GO and KEGG functional-enrichment analysis was performed on DEGs. Goatools (https://github.com/tanghaibao/GOatools) was used for GO functional enrichment analysis and KOBAS (http://kobas.cbi.pku.edu.cn/home.do) was used for KEGG pathway analysis [61]. Fisher exact test was used for calculation, and P values were corrected by Bonferroni and BH (FDR) method. The threshold of the corrected P-value was 0.05.
Identification of transcription factors and cluster analysis
By HMMER analysis, the domain information of transcripts was compared with the database PlantTFDB (http://planttfdb.cbi.pku.edu.cn/) to obtain the homologous transcription factor information for gene transcription factor prediction and family analysis. Clustering analysis of differentially expressed transcription factors was performed using hierarchical clustering methods.
qRT-PCR analysis of gene expression
Total RNA was extracted from the spur and limb at three developmental stages using E.Z.N.A.® Plant RNA Kit (Omega). The first-strand cDNAs were synthesized using EasyScript® One-Step gDNA Removal and cDNA Synthesis SuperMix (TransGen) and used as templates. qRT-PCR was performed on a LightCycler® 480 II Real-Time Quantitative PCR Detection System (Roche) using Hieff® qPCR SYBR® Green Master Mix (Yeasen). The amplification primers for qRT-PCR were shown in supplementary data Table S7, and IuActin was used as a reference gene. Fluorescence quantitative PCR detection was carried out by a three-step method. Each sample had three repetitions. The amplification procedure was as follows: initial denaturation at 95 °C for 5 min, 40 cycles of denaturation at 95 °C for 10 s, annealing at 60 °C for 20 s, extension at 72 °C for 20 s. The comparative cycle threshold (ct) method was used to calculates gene expression levels.
Supplementary Information
Acknowledgements
We thank Shanghai Majorbio Bio-pharm Technology Co.,Ltd. for its help in sequencing. The data were analyzed through the free online platform of Majorbio Cloud Platform (www.majorbio.com).
Abbreviations
- NR
NCBI Non-Redundant Protein Sequence Database
- Pfam
Protein Families
- COG
Clusters of Orthologous Groups of proteins
- GO
Gene Ontology
- KEGG
Kyoto Encyclopedia of Genes and Genomes
- DEGs
Differential Expression Genes
Authors’ contributions
YL and HQH were responsible for the experimental design. YL carried out sample collection, experiments, data analysis and article writing. CMW, XYL, DCM and ZJG participated in the experiment. MJH and SPQ supervised the research and revised the manuscript. All authors read and approved the final manuscript.
Funding
This study was financially supported by the National Natural Science Foundation of China (32060364, 32060366, 31860230), Major Science and Technology Projects in Yunnan Province (202102AE090052), Young and Middle-aged Academic and Technical Leadership Training Project of Yunnan and Doctoral Tutor Team for Genetic Improvement and High-efficient Propagation of Landscape Plants in Yunnan Province (2018HB024).
Availability of data and materials
All data generated in this article are included within the article and its additional files.
Declarations
Ethics approval and consent to participate
We confirm that all experimental research and field studies comply with relevant institutional, national, and international guidelines and legislation. The plant materials used in this study were not rare or endangered species. The samples were collected from wild populations in non-protected areas and cultivated and preserved in the experimental base of Southwest Forestry University; no permissions/licences are required. The voucher specimen is stored in the Herbarium of Kunming Institute of Botany, Chinese Academy of Sciences, with the code KUN 1321456, Li-Gong Lei identified it on May 7, 2015.
Consent for publication
Not applicable.
Competing interests
The authors declare that they have no competing interests.
Footnotes
Publisher’s Note
Springer Nature remains neutral with regard to jurisdictional claims in published maps and institutional affiliations.
Contributor Information
Yang Li, Email: liyang_ocean2020@hotmail.com.
Mei-Juan Huang, Email: xmhhq2001@163.com.
Hai-Quan Huang, Email: haiquanl@163.com.
References
- 1.Figueiredo ACS, Pais MS. Ultrastructural aspects of the nectary spur of Limodorum abortivum (L) Sw. (Orchidaceae) Ann Bot. 1992;70:325–331. doi: 10.1093/oxfordjournals.aob.a088481. [DOI] [Google Scholar]
- 2.Pacini E, Nepi M, Vesprini JL. Nectar biodiversity: a short review. Plant Syst and Evol. 2003;238:7–21. doi: 10.1007/s00606-002-0277-y. [DOI] [Google Scholar]
- 3.Hodges SA, Arnold ML. Spurring plant diversification: are floral nectar spurs a key innovation? Proc Biol Sci. 1995;262:343–348. doi: 10.1098/rspb.1995.0215. [DOI] [Google Scholar]
- 4.Kay KM, Whittall JB, Hodges SA. A survey of nuclear ribosomal internal transcribed spacer substitution rates across angiosperms: an approximate molecular clock with life history effects. BMC Evol Biol. 2006;6:36. doi: 10.1186/1471-2148-6-36. [DOI] [PMC free article] [PubMed] [Google Scholar]
- 5.Darwin C. On the various contrivances by which British and foreign orchids are fertilized by insects; and on the good effects of intercrossing. Br Foreign Med-Chir Rev. 1862;30:312–318. [PMC free article] [PubMed] [Google Scholar]
- 6.Wasserthal LT. The pollinators of the Malagasy star orchids Angraecum sesquipedale, A. sororium and A. compactum and the evolution of extremely long spurs by pollinator shift. Bot Acta. 1997;110:343–359. doi: 10.1111/j.1438-8677.1997.tb00650.x. [DOI] [Google Scholar]
- 7.Vlašánková A, Padyšáková E, Bartoš M, Mengual X, Janečková P, Janeček Š. The nectar spur is not only a simple specialization for long-proboscid pollinators. New Phytol. 2017;215:1574–1581. doi: 10.1111/nph.14677. [DOI] [PubMed] [Google Scholar]
- 8.Puzey JR, Gerbode SJ, Hodges SA, Kramer EM, Mahadevan L. Evolution of spur-length diversity in Aquilegia petals is achieved solely through cell-shape anisotropy. Proc Biol Sci. 2012;279:1640–1645. doi: 10.1098/rspb.2011.1873. [DOI] [PMC free article] [PubMed] [Google Scholar]
- 9.Mack JLK, Davis AR. The relationship between cell division and elongation during development of the nectar-yielding petal spur in Centranthus ruber (Valerianaceae) Ann Bot. 2015;115:641–649. doi: 10.1093/aob/mcu261. [DOI] [PMC free article] [PubMed] [Google Scholar]
- 10.Cullen E, Fernández-Mazuecos M, Glover BJ. Evolution of nectar spur length in a clade of Linaria reflects changes in cell division rather than in cell expansion. Ann Bot. 2018;122:801–809. doi: 10.1093/aob/mcx213. [DOI] [PMC free article] [PubMed] [Google Scholar]
- 11.Box MS, Dodsworth S, Rudall PJ, Bateman RM, Glover BJ. Characterization of Linaria KNOX genes suggests a role in petal-spur development. Plant J. 2011;68:703–714. doi: 10.1111/j.1365-313X.2011.04721.x. [DOI] [PubMed] [Google Scholar]
- 12.Golz JF, Keck EJ, Hudson A. Spontaneous mutations in KNOX genes give rise to a novel floral structure in Antirrhinum. Curr Biol 2002;12:515-522. doi: 10.1016/s0960-9822(02)00721-2. [DOI] [PubMed]
- 13.Box MS, Dodsworth S, Rudall PJ, Bateman RM, Glover BJ. Flower-specific KNOX phenotype in the orchid Dactylorhiza fuchsii. J Exp Bot 2012;63:4811-4819. doi: 10.1093/jxb/ers152. [DOI] [PMC free article] [PubMed]
- 14.Damerval C, Citerne H, Guilloux ML, Domenichini S, Dutheil J, Ronse de Craene L, et al. Asymmetric morphogenetic cues along the transverse plane: shift from disymmetry to zygomorphy in the flower of Fumarioideae. Am J Bot. 2013;100:391–402. doi: 10.3732/ajb.1200376. [DOI] [PubMed] [Google Scholar]
- 15.Prażmo W. Cytogenetic studies on the genus Aquilegia. III. Inheritance of the traits distinguishing different complexes in the genus Aquilegia. Acta Soc Bot Pol. 1965;34:403–437. doi: 10.5586/asbp.1965.031. [DOI] [Google Scholar]
- 16.Ballerini ES, Kramer EM, Hodges SA. Comparative transcriptomics of early petal development across four diverse species of Aquilegia reveal few genes consistently associated with nectar spur development. BMC Genomics. 2019;20:668. doi: 10.1186/s12864-019-6002-9. [DOI] [PMC free article] [PubMed] [Google Scholar]
- 17.Ballerini ES, Min Y, Edwards MB, Kramer EM, Hodges SA. POPOVICH, encoding a C2H2 zinc-finger transcription factor, plays a central role in the development of a key innovation, floral nectar spurs, in Aquilegia. Proc Natl Acad Sci U S A. 2020;117:22552–22560. doi: 10.1073/pnas.2006912117. [DOI] [PMC free article] [PubMed] [Google Scholar]
- 18.Zhang R, Min Y, Holappa LD, Walcher-Chevillet CL, Duan X, Donaldson E, et al. A role for the Auxin Response Factors ARF6 and ARF8 homologs in petal spur elongation and nectary maturation in Aquilegia. New Phytol. 2020;227:1392–1405. doi: 10.1111/nph.16633. [DOI] [PubMed] [Google Scholar]
- 19.Yant L, Collani S, Puzey J, Levy C, Kramer EM. Molecular basis for three-dimensional elaboration of the Aquilegia petal spur. Proc Biol Sci. 2015;282:20142778. doi: 10.1098/rspb.2014.2778. [DOI] [PMC free article] [PubMed] [Google Scholar]
- 20.Bartoš M, Janeček S. Pollinator-induced twisting of flowers sidesteps floral architecture constraints. Curr Biol. 2014;24:R793–R795. doi: 10.1016/j.cub.2014.07.056. [DOI] [PubMed] [Google Scholar]
- 21.Kanehisa M, Goto S. KEGG: kyoto encyclopedia of genes and genomes. Nucleic Acids Res. 2000;28:27–30. doi: 10.1093/nar/28.1.27. [DOI] [PMC free article] [PubMed] [Google Scholar]
- 22.Li Y, Li F, Meng DC, Li LJ, Wei CM, Huang MJ, et al. Cloning and expression analysis of petal spur development related gene TCP4 in Impatiens uliginosa. J Zhejiang University (Agriculture & Life Sciences). 2022. 10.3785/j.issn.1008-9209.2022.04.064.
- 23.Wei CM, Li Y, Meng DC, Li ZF, Li XY, Huang MJ, et al. Cloning and expression analysis of TIP genes related to petal spur development in Impatiens uliginosa. Plant Physiology J. 2022. 10.13592/j.cnki.ppj.100114.
- 24.Wei CM, Meng DC, Li Y, Xiang NX, Yang JY, Huang MJ, et al. Cloning and expression analysis of ABP gene related to spur development in Impatiens uliginosa. Guihaia. 2022. 10.11931/guihaia.gxzw202205014.
- 25.Martins DJ, Johnson SD. Hawkmoth pollination of aerangoid orchids in Kenya, with special reference to nectar sugar concentration gradients in the floral spurs. Am J Bot. 2007;94:650–659. doi: 10.3732/ajb.94.4.650. [DOI] [PubMed] [Google Scholar]
- 26.Jabbour F, Renner SS. Spurs in a spur: perianth evolution in the Delphinieae (Ranunculaceae) Int J Plant Sci. 2012;173:1036–1054. doi: 10.1086/667613. [DOI] [Google Scholar]
- 27.Vervoort A, Cawoy V, Jacquemart AL. Comparative reproductive biology in co-occurring invasive and native Impatiens species. Int J Plant Sci. 2011;172:366–377. doi: 10.1086/658152. [DOI] [Google Scholar]
- 28.Chupp AD, Battaglia LL, Schauber EM, Sipes SD. Orchid–pollinator interactions and potential vulnerability to biological invasion. AoB Plants. 2015;7:plv099. doi: 10.1093/aobpla/plv099. [DOI] [PMC free article] [PubMed] [Google Scholar]
- 29.Young HJ. Selection on spur shape in Impatiens capensis. Oecologia. 2008;156:535–543. doi: 10.1007/s00442-008-1014-1. [DOI] [PubMed] [Google Scholar]
- 30.Huang H, Xia EH, Zhang HB, Yao QY, Gao LZ. De novo transcriptome sequencing of Camellia sasanqua and the analysis of major candidate genes related to floral traits. Plant Physiol Biochem. 2017;120:103–111. doi: 10.1016/j.plaphy.2017.08.028. [DOI] [PubMed] [Google Scholar]
- 31.Zhang Y, Zhang X, Wang YH, Shen SK. De Novo Assembly of Transcriptome and Development of Novel EST-SSR Markers in Rhododendron rex Lévl. through Illumina Sequencing. Front. Plant Sci. 2017;8:1664. doi: 10.3389/fpls.2017.01664. [DOI] [PMC free article] [PubMed] [Google Scholar]
- 32.Zhan X, Yang L, Wang D, Zhu JK, Lang Z. De novo assembly and analysis of the transcriptome of Ocimum americanum var. pilosum under cold stress. BMC Genomics. 2016;17:209. doi: 10.1186/s12864-016-2507-7. [DOI] [PMC free article] [PubMed] [Google Scholar]
- 33.Lancheros MLY, Rai KM, Balasubramanian VK, Dampanaboina L, Mendu V, Terán W. De novo transcriptome analysis of white teak (Gmelina arborea Roxb) wood reveals critical genes involved in xylem development and secondary metabolism. BMC Genomics. 2021;22:494. doi: 10.1186/s12864-021-07777-x. [DOI] [PMC free article] [PubMed] [Google Scholar]
- 34.Conway SJ, Walcher-Chevillet CL, Barbour KS, Kramer EM. Brassinosteroids regulate petal spur length in Aquilegia by controlling cell elongation. Ann Bot. 2021;128:931–942. doi: 10.1093/aob/mcab116. [DOI] [PMC free article] [PubMed] [Google Scholar]
- 35.Ito M. Conservation and diversification of three-repeat Myb transcription factors in plants. J Plant Res. 2005;118:61–69. doi: 10.1007/s10265-005-0192-8. [DOI] [PubMed] [Google Scholar]
- 36.Haga N, Kato K, Murase M, Araki S, Kubo M, Demura T, et al. R1R2R3-Myb proteins positively regulate cytokinesis through activation of KNOLLE transcription in Arabidopsis thaliana. Development. 2007;134:1101–1110. doi: 10.1242/dev.02801. [DOI] [PubMed] [Google Scholar]
- 37.Zhang Y, Cao G, Qu LJ, Gu H. Characterization of Arabidopsis MYB transcription factor gene AtMYB17 and its possible regulation by LEAFY and AGL15. J Genet Genomics. 2009;36:99–107. doi: 10.1016/S1673-8527(08)60096-X. [DOI] [PubMed] [Google Scholar]
- 38.Gonzalez A, Zhao M, Leavitt JM, Lloyd AM. Regulation of the anthocyanin biosynthetic pathway by the TTG1/bHLH/Myb transcriptional complex in Arabidopsis seedlings. Plant J. 2008;53:814–827. doi: 10.1111/j.1365-313X.2007.03373.x. [DOI] [PubMed] [Google Scholar]
- 39.Wang WL, Wang YX, Li H, Liu ZW, Cui X, Zhuang J. Two MYB transcription factors (CsMYB2 and CsMYB26) are involved in flavonoid biosynthesis in tea plant [Camellia sinensis (L.) O. Kuntze] BMC Plant Biol. 2018;18:288. doi: 10.1186/s12870-018-1502-3. [DOI] [PMC free article] [PubMed] [Google Scholar]
- 40.Kim S, Koh J, Ma H, Hu Y, Endress PK, Hauser BA, et al. Sequence and expression studies of A-, B-, and E-Class MADS-Box homologues in Eupomatia (Eupomatiaceae): Support for the bracteate origin of the calyptra. Int J Plant Sci. 2005;166:185–198. doi: 10.1086/427479. [DOI] [Google Scholar]
- 41.Huala E, Sussex IM. LEAFY interacts with floral homeotic genes to regulate arabidopsis floral development. Plant Cell. 1992;4:901–913. doi: 10.1105/tpc.4.8.901. [DOI] [PMC free article] [PubMed] [Google Scholar]
- 42.Okamuro JK, Szeto W, Lotys-Prase C, Jofuku KD. Photo and hormonal control of meristem identity in the Arabidopsis flower mutants apetala2 and apetala1. Plant Cell. 1997;9:37–47. doi: 10.1105/tpc.9.1.37. [DOI] [PMC free article] [PubMed] [Google Scholar]
- 43.Coen ES, Meyerowitz EM. The war of the whorls: genetic interactions controlling flower development. Nature. 1991;353:31–37. doi: 10.1038/353031a0. [DOI] [PubMed] [Google Scholar]
- 44.Huijser P, Klein J, Lönnig WE, Meijer H, Saedler H, Sommer H. Bracteomania, an inflorescence anomaly, is caused by the loss of function of the MADS-box gene squamosa in Antirrhinum majus. EMBO J. 1992;11:1239–1249. doi: 10.1002/j.1460-2075.1992.tb05168.x. [DOI] [PMC free article] [PubMed] [Google Scholar]
- 45.Unte US, Sorensen AM, Pesaresi P, Gandikota M, Leister D, Saedler H, et al. SPL8, an SBP-box gene that affects pollen sac development in Arabidopsis. Plant Cell. 2003;15:1009–1019. doi: 10.1105/tpc.010678. [DOI] [PMC free article] [PubMed] [Google Scholar]
- 46.Shikata M, Koyama T, Mitsuda N, Ohme-Takagi M. Arabidopsis SBP-box genes SPL10, SPL11 and SPL2 control morphological change in association with shoot maturation in the reproductive phase. Plant Cell Physiol. 2009;50:2133–2145. doi: 10.1093/pcp/pcp148. [DOI] [PubMed] [Google Scholar]
- 47.Lamport DTA, Northcote DH. Hydroxyproline arabinosides in the plant kingdom. Plant Physiol. 1971;48:454–456. doi: 10.1104/pp.48.4.454. [DOI] [PMC free article] [PubMed] [Google Scholar]
- 48.Lamport DTA, Catt JW. Glycoproteins and enzymes of the cell wall. Plant Carbohydrates. 1981;II(13):133–165. doi: 10.1007/978-3-642-68234-6_7. [DOI] [Google Scholar]
- 49.Ludewig U, Dynowski M. Plant aquaporin selectivity: where transport assays, computer simulations and physiology meet. Cell Mol Life Sci. 2009;66:3161–3175. doi: 10.1007/s00018-009-0075-6. [DOI] [PMC free article] [PubMed] [Google Scholar]
- 50.Yool AJ, Campbell EM. Structure, function and translational relevance of aquaporin dual water and ion channels. Mol Asp Med. 2012;33:553–561. doi: 10.1016/j.mam.2012.02.001. [DOI] [PMC free article] [PubMed] [Google Scholar]
- 51.Chaumont F, Tyerman SD. Aquaporins: highly regulated channels controlling plant water relations. Plant Physiol. 2014;164:1600–1618. doi: 10.1104/pp.113.233791. [DOI] [PMC free article] [PubMed] [Google Scholar]
- 52.Leng H, Jiang C, Song X, Lu M, Wan X. Poplar aquaporin PIP1;1 promotes Arabidopsis growth and development. BMC Plant Biol. 2021;21:253. doi: 10.1186/s12870-021-03017-2. [DOI] [PMC free article] [PubMed] [Google Scholar]
- 53.Skirycz A, Radziejwoski A, Busch W, Hannah MA, Czeszejko J, Kwaśniewski M, et al. The DOF transcription factor OBP1 is involved in cell cycle regulation in Arabidopsis thaliana. Plant J. 2008;56:779–792. doi: 10.1111/j.1365-313X.2008.03641.x. [DOI] [PubMed] [Google Scholar]
- 54.Baumann K, De Paolis A, Costantino P, Gualberti G. The DNA binding site of the Dof protein NtBBF1 is essential for tissue-specific and auxin-regulated expression of the rolB oncogene in plants. Plant Cell. 1999;11:323–334. doi: 10.1105/tpc.11.3.323. [DOI] [PMC free article] [PubMed] [Google Scholar]
- 55.Grabherr MG, Haas BJ, Yassour M, Levin JZ, Thompson DA, Amit I, et al. Full-length transcriptome assembly from RNA-Seq data without a reference genome. Nat Biotechnol. 2011;29:644–652. doi: 10.1038/nbt.1883. [DOI] [PMC free article] [PubMed] [Google Scholar]
- 56.Conesa A, Götz S, García-Gómez JM, Terol J, Talón M, Robles M. Blast2GO: a universal tool for annotation, visualization and analysis in functional genomics research. Bioinformatics. 2005;21:3674–3676. doi: 10.1093/bioinformatics/bti610. [DOI] [PubMed] [Google Scholar]
- 57.Li B, Dewey CN. RSEM: accurate transcript quantification from RNA-Seq data with or without a reference genome. BMC Bioinformatics. 2011;12:323. doi: 10.1186/1471-2105-12-323. [DOI] [PMC free article] [PubMed] [Google Scholar]
- 58.Love MI, Huber W, Anders S. Moderated estimation of fold change and dispersion for RNA-seq data with DESeq2. Genome Biol. 2014;15:550. doi: 10.1186/s13059-014-0550-8. [DOI] [PMC free article] [PubMed] [Google Scholar]
- 59.Wang L, Feng Z, Wang X, Wang X, Zhang X. DEGseq: an R package for identifying differentially expressed genes from RNA-seq data. Bioinformatics. 2009;26:136–138. doi: 10.1093/bioinformatics/btp612. [DOI] [PubMed] [Google Scholar]
- 60.Robinson MD, McCarthy DJ, Smyth GK. edgeR: a Bioconductor package for differential expression analysis of digital gene expression data. Bioinformatics. 2010;26:139–140. doi: 10.1093/bioinformatics/btp616. [DOI] [PMC free article] [PubMed] [Google Scholar]
- 61.Xie C, Mao X, Huang J, Ding Y, Wu J, Dong S, et al. KOBAS 2.0: a web server for annotation and identification of enriched pathways and diseases. Nucleic Acids Res. 2011;39:W316–W322. doi: 10.1093/nar/gkr483. [DOI] [PMC free article] [PubMed] [Google Scholar]
Associated Data
This section collects any data citations, data availability statements, or supplementary materials included in this article.
Supplementary Materials
Data Availability Statement
All data generated in this article are included within the article and its additional files.


