

Abstract
Gene expression heterogeneity underlies cell states and contributes to developmental robustness. While heterogeneity can arise from stochastic transcriptional processes, the extent to which it is regulated is unclear. Here we characterize the regulatory program underlying heterogeneity in murine embryonic stem cell (mESC) states. We identify differentially active and transcribed enhancers (DATEs) across states. DATEs regulate differentially expressed genes and are distinguished by co-binding of Kruppel-like transcription factors Klf4 and Zfp281. In contrast to other factors that interact in a positive feedback network stabilizing mESC cell-type identity, Klf4 and Zfp281 drive opposing transcriptional and chromatin programs. Abrogation of factor binding to DATEs dampens variation in gene expression, and factor loss alters kinetics of switching between states. These results show antagonism between factors at enhancers results in gene expression heterogeneity and formation of cell states, with implications for the generation of diverse cell types during development.
Keywords: Gene expression variation, cell-to-cell variation, transcription factors, Klf4, Zfp281, enhancer RNA, embryonic stem cell state
Graphical Abstract

eTOC
Embryonic stem cells occupy heterogeneous cell states. Hu et al. describe functional antagonism between transcription factors at enhancers, generating variable expression of regulated genes.
INTRODUCTION
mESC are strikingly heterogeneous, inhabiting gene expression states that range from highly pluripotent to primed for differentiation (Graf and Stadtfeld, 2008; Klein et al., 2015; Kolodziejczyk et al., 2015; Kumar et al., 2014; Martinez Arias and Brickman, 2011). These in vitro cell states mimic developmental transitions in the embryo (Neagu et al., 2020; Shahbazi et al., 2017). mESC can interconvert between states (Chakraborty et al., 2020; Filipczyk et al., 2015), and the ability to reversibly switch between states in vivo enables developmental robustness (Chen et al., 2018; Holmes et al., 2017). Gene expression heterogeneity can bias cell fate decision making (Fiorentino et al., 2020; Goolam et al., 2016; Strebinger et al., 2019; White et al., 2016). In mESC, transcriptional heterogeneity is thought to arise from stochastic gene expression processes (Abranches et al., 2014; Eldar and Elowitz, 2010; Hansen and van Oudenaarden, 2013; Hansen et al., 2018; Huang et al., 2007; Raj and van Oudenaarden, 2008; Singer et al., 2014). However, the extent to which heterogeneity in mESC gene expression arises from a regulatory program remains an open question.
Enhancers establish cell type-specific gene regulatory programs (Heintzman et al., 2009; Heinz et al., 2015; Hnisz et al., 2013) by regulating the dynamics of active gene expression (Fukaya et al., 2016; Larsson et al., 2019). Enhancers are characterized by features including transcription factor binding, presence of specific chromatin modifications, and enhancer transcription. In mESC, enhancers have been identified through a network of transcription factors including Nanog, Sox2, and Pou5f1 (Oct4), collectively referred to as OSN, as well as Klf4, c-Myc, Rex1, and Zfp281 (Chen et al., 2008; Kim et al., 2008a; Whyte et al., 2013). These transcription factors drive ES cell-type gene expression through positive feedback interactions (Niwa, 2007). Whether this network contributes to heterogeneity or reversible state transitions in mESC is unknown.
Enhancer transcription presents a unique opportunity to capture enhancer activity. Active enhancers are divergently transcribed, producing short transcripts called enhancer RNAs (eRNAs) (Core et al., 2014; Mahat et al., 2016). Measuring eRNA has numerous advantages: production of eRNAs correlates with enhancer activity, eRNA detection allows precise enhancer localization, and eRNA detection captures enhancers “in the act” of regulating gene targets (Andersson and Sandelin, 2020; Henriques et al., 2018; Kaikkonen and Adelman, 2018; Lai et al., 2020; Lee and Mendell, 2020; Mikhaylichenko et al., 2018; Tippens et al., 2018). However, it remains unclear whether enhancers are differentially active in mESC states and play a role in gene expression heterogeneity. This is in part due to the instability of eRNA transcripts, which has limited the ability to study enhancer activity in small cell populations.
mESC states have previously been defined by the transcription factors Nanog and Sox2 (Chakraborty et al., 2020; Chambers et al., 2007; Filipczyk et al., 2015; Ying et al., 2008). Using knock-in fluorescent reporters, we previously isolated three mESC states with differential gene expression: Nanoghigh Sox2high cells, Nanoglow Sox2high cells, and Nanoglow Sox2low cells (referred to as States 1, 2, and 3 respectively, Fig. 1A–B, (Chakraborty et al., 2020; Udomlumleart et al., 2021)). State 1 (Nanoghigh) cells represent a naïve pluripotent state whereas State 2 and State 3 cells (Nanoglow) represent primed pluripotent states (Abranches et al., 2014; Chambers et al., 2007; Filipczyk et al., 2015; Singer et al., 2014). Additionally, using lineage barcoding studies, we described the rates at which cells interconvert between states (Udomlumleart et al., 2021), though the molecular mechanisms underlying the kinetics remained unknown. Together, these observations led us to ask whether a regulatory program of transcription factors and enhancers could underlie heterogeneous gene expression and cell state dynamics in mESC.
FIGURE 1: Variable enhancer transcription across heterogeneous mESC states.

A-B. mESC organize into and switch between three cell states, defined by Nanog and Sox2 expression levels. Heterozygous knock-in GFP-P2A-Nanog and Sox2-P2A-mCherry mESC were previously generated (Chakraborty et al., 2020) and analyzed by flow cytometry, yielding States 1, 2, and 3.
C. Single mESC were cloned, grown for 7 days, and colonies analyzed by flow cytometry for distribution across States 1–3 (bottom).
D. Heatmap and hierarchical clustering of differentially expressed genes (mPROseq) across mESC states. Three biological replicates are shown.
E. Ternary plot showing the proportion of nascent eRNA reads across States 1, 2, and 3 for each enhancer. Differentially active and transcribed enhancers (DATEs) and stably active and transcribed enhancers (SATEs) are indicated.
F. Heatmap showing distribution and strength of nascent RNA transcripts at enhancers across States 1, 2, and 3.
Here, we used an optimized assay to identify enhancers with differential transcription and activity across mESC states. Enhancers drive variable gene expression and impact mESC states. Further, we identify a distinct subset of the mESC transcriptional regulatory network, composed of the Kruppel-like transcription factors Klf4 and Zfp281, that act antagonistically at shared enhancer targets. By exerting opposing epigenetic and transcriptional effects, Klf4 and Zfp281 generate mESC cell state heterogeneity and impact cell state switching kinetics, with implications for how cells intrinsically form dynamic and reversible heterogeneous gene expression states during development.
RESULTS
mESC robustly organize into heterogeneous gene expression states
To assess the robustness of ES heterogeneity, we asked to what extent single ES cells repopulate states. We isolated single cells, grew them into mESC colonies, and evaluated the distribution of cell states. Remarkably, all 150 colonies had cells of all three states (Fig. 1C). The distribution of states was fairly consistent across colonies, with 63 ± 20% of cells in State 1, 11 ± 8% of cells in State 2, and 21 ± 17% of cells in State 3 (median ± interquartile range). These data confirm that mESC robustly give rise to heterogeneous cell states, in line with prior observations (Abranches et al., 2014; Chakraborty et al., 2020; Filipczyk et al., 2015; Singer et al., 2014). Given the robust nature of mESC state repopulation, we asked whether this phenomenon could arise from an underlying regulatory program.
To explore the regulatory landscape underlying mESC state formation, we used nascent transcriptome sequencing to identify genes and enhancers actively transcribed in each state. While traditional nascent transcriptomic techniques require large numbers of cells (Mahat et al., 2016), we developed an optimized protocol for precision nuclear run-on sequencing (modified PROseq, or mPROseq) which enables nascent RNA detection from small cell inputs like mESC subpopulations (104–5 cells) and replicates results generated from larger cell input (107–8 cells, Fig. S1A–C).
mPROseq in the 3 mESC states showed differential gene expression suggestive of differential lineage potential (Fig. 1D, Fig. S1D). State 1 cells actively transcribed pluripotency factors such as Esrrb and Klf4. In contrast, State 2 and 3 cells upregulated expression of differentiation genes including Runx1 and Gata6. These data indicate that mESC organize into and repopulate transcriptionally distinct cell states.
Identification of differentially active and transcribed enhancers across mESC state
We investigated whether enhancers were also differentially expressed across state. mPROseq identified 7,228 divergently transcribed enhancers located outside of known genes (Table S1). These regions displayed canonical enhancer marks, including binding of transcriptional co-activators (p300) and histone modifications (H3K27Ac, Fig. S2).
mESC enhancers have been previously identified by OSN factor co-binding using chromatin immunoprecipitation followed by sequencing (ChIPseq) (Chen et al., 2008; Whyte et al., 2013). We compared mPROseq-defined enhancers to OSN enhancers and found partial overlap, with mPROseq enhancers largely comprising distinct regions (Fig. S2A). mPROseq-defined enhancers displayed particularly strong signal for RNA polymerase II (PolII), H3K27Ac, and H3K4me3, as well as weaker transcription factor (TF) binding when compared to OSN enhancers (Fig. S2B), aligning with the methods used. Though techniques like ChIPseq require large input cell numbers and therefore are limited to bulk measurements, mPROseq can resolve differences between subpopulations, such as mESC states. While most mPROseq enhancers were stably transcribed across state, 689 enhancers (9.5% of 7,228 total) were differentially transcribed, exhibiting stronger transcription in one state than the other two (posterior probability of differential expression (PPDE) > 0.95, see Methods). 312 enhancers were most strongly transcribed in State 1 cells, 105 in State 2 cells, and 272 in State 3 cells. We visualized the enhancers on a ternary plot, where position reflects the distribution of reads in States 1, 2, and 3 (Fig. 1E). The differentially active and transcribed enhancers (DATEs) skew towards the vertices, indicating differential expression across state. Further, we visualized DATEs by separating them on a heatmap from enhancers with stable transcription (referred to as stably active and transcribed enhancers, SATEs) (Fig. 1F). In contrast to DATEs, few OSN enhancers demonstrated differential transcription across states (30 out of 7225 enhancers, Fig. S2C). These data indicate that a distinct subset of enhancers is differentially transcribed across mESC states.
DATEs regulate key gene expression and mESC state
Next, we systematically assigned putative gene targets to mPROseq enhancers by identifying the most proximal, expressed genes located within the same topologically associated domain (Dowen et al., 2014). The transcription of DATEs was correlated with the expression levels of their putative gene targets (Fig. 2A, Fig. S3A). This correlation was confirmed at select loci by quantitative PCR with reverse transcription (RT-qPCR) against eRNA and mRNA produced from enhancers and their putative gene targets (Fig. 2B, Fig. S3B). For example, Tbx3, a marker of pluripotency, was highly expressed in State 1 cells and located approximately 13 kb from DATEs that were also highly expressed in State 1. Krt8, a marker of differentiation, was highly expressed in State 3 cells and located 12 kb from DATEs that were also highly expressed in State 3.
FIGURE 2: Differentially active and transcribed enhancers regulate variable gene expression and mESC state.

A. Representative loci of State 1 (Tbx3) and State 3 (Krt8) differential gene and enhancer transcription. Tracks are shown for nascent RNA transcription (mPROseq) in each mESC state, along with ChIPseq for Nanog, H3K27Ac, H3K4me3, and RNA polymerase II (PolII) obtained from (Creyghton et al., 2010; Lin et al., 2011; Whyte et al., 2013).
B. RT-qPCR analysis in States 1, 2, and 3 for levels of Tbx3 and Krt8 genes and DATEs. Data represent mean ± SEM of three technical replicates (one-way ANOVA, *p < 0.05, ** p < 0.01, *** p < 0.001). See also Fig. S3B.
C. Repressive dCas9-KRAB was targeted to the enhancer, and eRNA produced from the enhancer and mRNA produced from the putative gene target measured by RT-qPCR. Samples were treated with either a non-targeting control guide (Control) or an enhancer-targeting guide (CRISPRi). Data represent mean ± SEM of three technical replicates and are representative of two biological replicates (two-tailed Student’s t-test, *p < 0.05, ** p < 0.01, *** p < 0.001). See also Fig. S3C.
D. mPROseq enhancers were mapped to putative gene targets, and the coefficient of variation in gene expression across States 1–3 was calculated for each gene target and plotted. Genes associated with DATEs are more variably expressed than genes associated with SATEs (F-test, *** p < 0.001).
E. Schematic of CRISPRi screen experiment.
F. Enrichment of sgRNAs targeting the −5kb Nanog enhancer, calculated as log2 fold change in sgRNA frequency between sorted (Nanoghigh or Nanoglow) and unsorted populations in a biological replicate (paired t-test, **p < 0.01). See also Fig. S4A.
G. CRISPRi screen enrichment of all sgRNAs detected across four biological replicates, calculated as log2 fold change in sgRNA frequency between Nanoghigh and Nanoglow sorted populations. Hits (gray region, see Methods) are colored based on whether the sgRNA targets a DATE or SATE. See also Fig. S4B–D.
To test if DATEs participate in regulating the expression of their putative gene targets, we selected several DATEs for CRISPR interference, reasoning that targeting transcriptional repressor complex dCas9-KRAB to the enhancer would decrease both eRNA production from the enhancer and mRNA production from the regulated gene. CRISPRi at the Tbx3 DATE decreased eRNA to 0.59-fold of control and Tbx3 mRNA levels to 0.72-fold of control. CRISPRi at the Krt8 DATE decreased eRNA to 0.3-fold of control and Krt8 mRNA levels to 0.48-fold of control (Fig. 2C, Fig. S3C). As the CRISPRi effect extends up to ~1.5kb in either direction (Qi et al., 2013), the reduction in gene activity was likely due to inhibition of enhancer activity as opposed to a direct effect of CRISPRi on gene transcription itself. While significantly reduced, the continued expression of both Tbx3 and Krt8 genes was likely due to either incomplete repression by dCas9-KRAB at the enhancer or the contribution of other enhancers that were not targeted.
Overall, 3,954 unique putative gene targets were assigned to mPROseq enhancers, with most genes regulated by a DATE also regulated by a SATE (Fig. S3D). State 1 DATEs were associated with genes highly expressed in State 1 cells, including pluripotency genes Klf4, Sox2, and Tbx3 (Fig. S3A, E). In contrast, State 2 and 3 DATEs were associated with differentiation genes upregulated in State 2 and 3 cells (Fig. S3A, E). In addition, we calculated the coefficient of variation (CV) for each gene’s expression across States 1–3 as a measure of gene expression heterogeneity. The putative gene targets of DATEs were more variably expressed than putative gene targets of SATEs (Fig. 2D, Fig. S3D). Thus, DATEs preferentially regulated variably expressed genes with key roles in pluripotency and differentiation, suggesting that variation in activity at enhancers was transmitted to their downstream gene targets.
Whether DATEs also contributed to the formation of Nanog-defined states remained unclear. We conducted a CRISPRi screen to identify mPROseq-defined enhancers that establish or maintain cell state. First, we generated a library containing unique single guide RNAs (sgRNAs) targeting dCas9-KRAB to all 7,228 mPROseq enhancers (average 4.9 sgRNAs per mPROseq enhancer and 496 control sgRNAs, for a total of 35,960 sgRNAs, Table S2). We transfected dCas9-KRAB and the sgRNA library into mESC. 7 days after transfection, we sorted cells based on Nanog levels (Fig. 2E). Since a lower proportion of cells inhabit States 2 and 3, we grouped both states together to reach sufficient sample size and compared sgRNA representation in Nanoghigh (State 1) cells and Nanoglow (State 2 and 3 cells). In principle, a sgRNA that is over-represented in Nanoglow cells compared to Nanoghigh cells indicates an enhancer that promotes State 1. Conversely, sgRNAs over-represented in Nanoghigh cells identify enhancers that promote States 2 and 3. We confirmed these expectations using sgRNAs targeting dCas9-KRAB to the Nanog -5kb enhancer and Nanog promoter, which resulted in accumulation Nanoglow cells (States 2 and 3, Fig. 2F, Fig. S4A).
We calculated the log2 fold change for sgRNA frequency in Nanoghigh compared to Nanoglow populations for sgRNAs detected in all four unsorted replicates (Fig. 2G, Table S3). As a group, enhancer-targeting guides showed a larger range in enrichment than control guides (Fig. S4B–D). Next, we identified screen hits as the targets of sgRNAs with the strongest enrichment in Nanoghigh population (referred to as States 2 and 3 promoting enhancers) and with the strongest enrichment in Nanoglow population (referred to as State 1 promoting enhancers). Overall, DATEs were mildly enriched in the screen hits (26 out of 204 hits, p = 0.048, hypergeometric test), particularly State 1 promoting enhancers (17 out of 106 hits, p = 0.042, hypergeometric test). In addition, State 3 DATEs were enriched in States 2 and 3 promoting enhancers (8 out of 99, p = 0.016, hypergeometric test). These results suggest that the action of a subset of DATEs not only includes regulation of direct, downstream gene targets but can also influence Nanog-defined cell state. In addition, some SATEs were identified as screen hits, suggesting a role for their gene targets in regulating cell state heterogeneity. On the whole, gene targets of State 1 or States 2 and 3 promoting enhancers were enriched for functions consistent with development and transcriptional regulation (Fig. S4E).
Differential transcription factor binding at DATEs
Enhancers contain several transcription factor binding motifs and can be activated following binding of multiple factors. In mESC, an extended network of factors co-occupy regulatory regions and participate in the establishment and maintenance of mESC identity (Chen et al., 2008; Kim et al., 2008b; Loh et al., 2006). Thus, we investigated whether the state-specific activation of DATEs could be driven by transcription factor networks. We analyzed 48 available ChIPseq datasets for transcription regulators, activators, and factors meeting quality metrics (Table S4). First, we asked whether factors co-bound DATEs by measuring the overlap between the binding sites of every possible pair-wise combination of two factors (Fig. 3A). As expected, this identified functional categories of transcriptional regulators known to co-occupy genomic sites, such as structural chromatin regulators CTCF, Smc1, Smc3, and Rad21 (Fig. 3A, blue box) and Polycomb proteins Ring1b and Suz12 (Fig. 3A, orange box). Interestingly, while many pluripotency TFs including Sox2, Nanog, and Esrrb clustered together into one large group as expected based on previous studies (Fig. 3A, green box) (Chen et al., 2008; Kim et al., 2008b; Loh et al., 2006), we observed a second unexpected cluster, which included Zfp281 and Klf4 co-binding with Oct4, Ell3, and p300 at DATEs (Fig. 3A, purple box). This second cluster did not appear when we analyzed co-binding genome-wide, suggesting that co-binding of these factors was particularly enriched at DATEs (Fig. S5A). In fact, the factors Klf4 and Zfp281 ranked in the 91st percentile for overlap at DATEs compared to all possible factor pairs (Fig. S5A), with a nearly 2-fold increase in overlapping binding at DATEs as compared to all genomic sites (Fig. 3B, p < 7.2e-36, hypergeometric test). We reviewed the existing literature for factors with high overlap at DATEs. Whereas other highly co-binding pairs reflected known biology, the overlap between Klf4 and Zfp281 had not been functionally characterized (Table S5). As co-binding can occur due to similar binding sequence preferences, we systematically compared the consensus binding motifs of factors, noting a high similarity between the binding motifs of Klf4 and Zfp281 (Fig. S5B). Motif enrichment analysis showed that Klf4 motifs were enriched in State 1 DATEs, while Zfp281 motifs were enriched in State 2 and 3 DATEs (Table S5). Based on these analyses, and after generating and screening knockouts of several factors enriched at DATEs, we selected Klf4 and Zfp281 for further study.
FIGURE 3: Differential transcription factor binding at DATEs identifies a role for Klf4 and Zfp281.

A. Heatmap of the overlap (Jaccard index) between the genomic binding sites of indicated factors at DATEs. See also Fig. S5A.
B. Overlap between Klf4 and Zfp281 binding sites across the genome (left) and at DATEs (right).
C. Klf4 and Zfp281 ChIPseq signal at DATEs, data from (Fidalgo et al., 2016; di Giammartino et al., 2019).
D. Flow cytometry analysis of Zfp281−/−, WT, and Klf4−/− cells. Distributions are representative of three independent clones for each genotype.
E. Zfp281−/−, WT, and Klf4−/− cells were immunohistochemically stained and quantified using p-Nitrophenyl Phosphate assay for alkaline phosphatase activity. The data represent mean ± SEM of three technical replicates from three biological replicates (one-way ANOVA, *** p < 0.001).
F. Zfp281−/−, WT, and Klf4−/− cells were differentiated for 4 days in retinoic acid (RA). Cells were stained for neuroectoderm marker CD24 and analyzed by flow cytometry (left). RT-qPCR was performed for Nanog (right, one-way ANOVA, ** p < 0.01, *** p < 0.001).
Notably, while Klf4 and Zfp281 motifs and binding overlapped at DATEs, the strength of binding varied by state. ChIPseq data showed Klf4 binding more strongly to state 1 DATEs, whereas Zfp281 bound more strongly to state 2 and 3 DATEs (Fig. 3C). Together, these data raised the possibility that Klf4 and Zfp281 drove mESC into opposing cell states by exerting opposing effects at DATEs and their downstream gene targets.
Klf4 and Zfp281 knockouts shift state distribution and differentiation phenotype
To determine the impact of Klf4 and Zfp281 on cell state, we used CRISPR-Cas9 gene targeting to generate functional Klf4 and Zfp281 knockouts in our reporter cell line and assessed the loss of each factor on state distribution (Fig. 3D, Fig. S5C). Zfp281−/− cells exhibited increased proportion of State 1 cells, whereas Klf4−/− cells exhibited increased proportion of State 2 and 3 cells. Transient depletion of Klf4 or Zfp281 by shRNA and siRNA replicated the effects (Fig. S5D). These results aligned with the previous motif and ChIPseq analysis to suggest that State 1 correlated with increased Klf4 activity and binding while States 2 and 3 correlated with increased Zfp281 activity and binding. Together, these findings suggested a model in which Klf4 and Zfp281 exert opposing downstream effects at shared target sites.
mESC states represent naïve, highly pluripotent populations (State 1) or populations primed for differentiation (States 2 and 3) (Chakraborty et al., 2020; Udomlumleart et al., 2021). Thus, we tested whether Klf4 and Zfp281 knockouts influenced differentiation potential. First, we assessed levels of alkaline phosphatase (AP), a phenotypic marker of pluripotency (Lepire and Ziomek, 1989). AP was present at higher levels in Zfp281−/− cells compared to Klf4−/− and WT cells (Fig. 3E). Next, we assessed differences in differentiation potential by treating Klf4−/−, Zfp281−/−, and WT mESC for 4 days in retinoic acid (RA) and measuring the proportion of CD24high (neuroectoderm) cells (Fig. 3F) (Semrau et al., 2017; Ying et al., 2003). Klf4−/− cells readily differentiated into neuroectoderm, with a higher proportion of cells in the CD24high population and higher CD24 levels. In contrast, Zfp281−/− cells did not upregulate CD24 to the same extent upon RA treatment. Consistent with a model of increased stemness and a delayed exit from pluripotency, Zfp281−/− cells also downregulated Nanog expression at a slower rate than WT and Klf4−/− mESC. This suggests that Zfp281−/− cells inhabit a more naïve and pluripotent state, whereas Klf4−/− cells are more primed towards differentiation. These findings align with previous studies (Aksoy et al., 2014; Fidalgo et al., 2012, 2016; di Giammartino et al., 2019; Guo et al., 2009; Huang et al., 2017; Mayer et al., 2020) and our observations of the impact of Klf4 or Zfp281 loss on mESC state.
The pluripotency TF network has been described to operate as a positive feedback loop, promoted by factor co-binding (Boyer et al., 2005; Ivanova et al., 2006; Wang et al., 2006). However, Klf4 and Zfp281 particularly segregated in their co-binding at DATEs and displayed diverging cell state effects. Thus, we hypothesized that Klf4 and Zfp281 may form a subset of the larger pluripotency network that drives gene expression heterogeneity through antagonistic effects at targets.
Klf4 and Zfp281 drive opposing mESC states
To assess the possibility that the factors regulate opposing cell states, we analyzed the effects of Klf4 and Zfp281 on the transcriptional and chromatin landscape of mESC. We performed assay for transposase-accessible chromatin with sequencing (ATACseq), RNAseq, and mPROseq on Klf4−/−, Zfp281−/−, and WT cells. Principal component analysis showed that, globally, Klf4 and Zfp281 knockouts drove mESC into opposing cell states, as Klf4−/−, and Zfp281−/− cells were consistently separated on opposite ends of the plot, regardless of assay (Fig. 4A).
FIGURE 4: Klf4 and Zfp281 drive opposing transcriptional and regulatory programs.
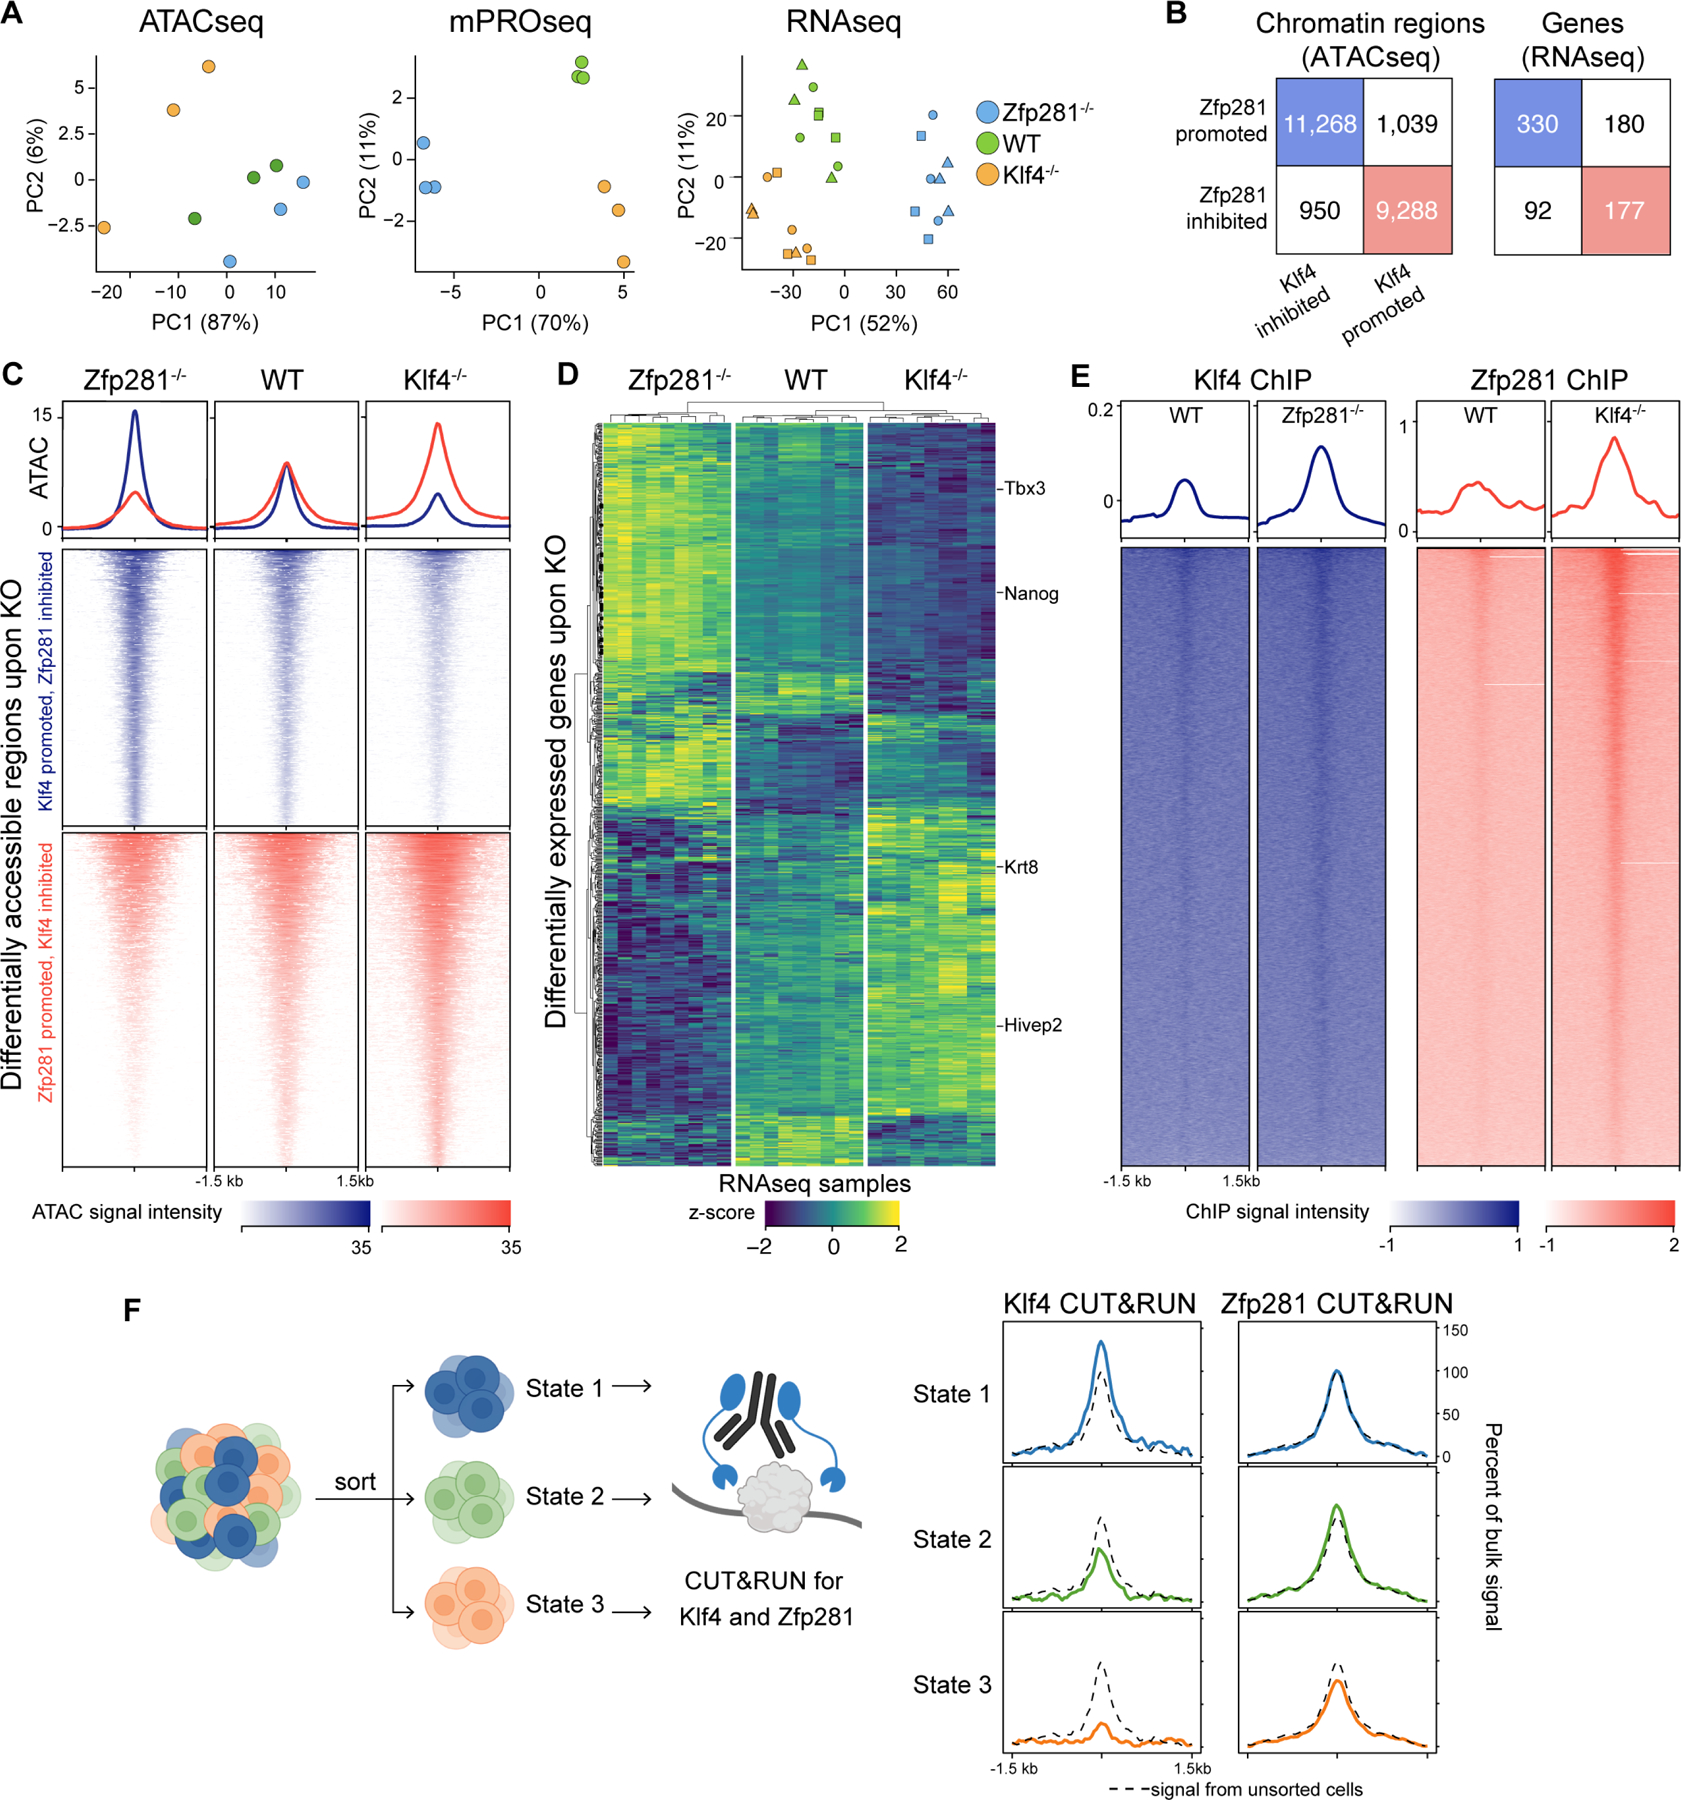
A. Principal component analysis of ATACseq, mPROseq, and RNAseq signal at differentially accessible regions (ATACseq) or differentially expressed (mPROseq and RNAseq) protein coding genes in Zfp281−/−, WT, and Klf4−/− cells. Three biological replicates were analyzed in ATACseq and mPROseq. Three biological replicates of three lines for each genotype were analyzed in RNAseq (point shape denotes lines).
B. Comparison of differentially accessible chromatin regions and differentially expressed genes upon Klf4 and Zfp281 knockout. See also Fig. S6A–F.
C. ATACseq at differentially accessible regions upon Klf4 or Zfp281 knockout.
D. Heatmap and hierarchical clustering of differentially expressed genes and RNAseq samples. Three biological replicates per three lines are shown for each genotype.
E. Klf4 ChIPseq signal at Klf4-bound peaks in WT and Zfp281−/− cells, and Zfp281 ChIPseq signal at Zfp281-bound peaks in WT and Klf4 −/− cells.
F. Klf4 and Zfp281 CUT&RUN signal at DATEs in sorted WT States 1, 2, and 3 cells. Signal is normalized and plotted relative to WT unsorted cells (dashed black lines).
Further, ATACseq identified differentially accessible chromatin regions. Surprisingly, the majority of these regions showed diverging changes in accessibility upon Klf4 and Zfp281 knockout (Fig. 4B–C, Fig. S6A–C). Out of 12,218 regions that decreased in accessibility upon Zfp281 knockout (referred to as Zfp281-promoted regions), 11,268 (92%) increased in accessibility upon Klf4 knockout (Klf4-inhibited regions). Conversely, out of 10,327 regions that decreased in accessibility upon Klf4 knockout (Klf4-promoted), 9,288 (90%) increased in accessibility upon Zfp281 knockout (Zfp281-inhibited). Notably, the majority of State 1 DATEs were located in Zfp281-inhibited, Klf4-promoted regions, and nearly all State 2 and 3 DATEs were located in Zfp281-promoted, Klf4-inhibited regions (Fig. S6D). State 1 DATEs were most accessible in Zfp281−/−, whereas State 2 and 3 DATEs were most accessible in Klf4−/− (Fig. S6E).
Reciprocal effects of Klf4 and Zfp281 knockout were also observed for gene and enhancer expression. RNAseq identified 779 genes that were differentially expressed across the three genotypes (Fig. 4D, Fig. S6F), out of which 507 or 65% showed diverging change in expression. Namely, 330 (42%) genes decreased in expression upon Klf4 knockout and increased upon Zfp281 knockout, and 177 (23%) genes increased upon Klf4 knockout and decreased upon Zfp281 knockout. To identify the gene programs divergently regulated by Klf4 and Zfp281, we performed gene set enrichment analysis (GSEA) and observed that Klf4 or Zfp281 knockout showed reciprocal enrichment for developmental and stem cell function, respectively (Fig. S6G). Klf4 increased and Zfp281 decreased the expression of stemness programs, whereas Klf4 decreased and Zfp281 increased the expression of genes that drive differentiation, morphogenesis, and lineage-specifying programs. Consistent with this result, mPROseq showed that Zfp281 knockout decreased transcription of State 2 and 3 DATEs and was most similar to State 1 cells, whereas Klf4 knockout decreased transcription of State 1 DATEs and was most similar to State 3 cells (Fig. S6H–I).
The reciprocal effects of Klf4 and Zfp281 on chromatin accessibility, gene expression, and enhancer activity, combined with the co-binding of Klf4 and Zfp281 at similar sites (Fig. 3A) suggested that functional antagonism between the two factors could take place at shared target DATEs. To assess this possibility, we asked whether Klf4 and Zfp281 binding changed in Zfp281−/− and Klf4−/− cells, respectively. We conducted ChIPseq for Klf4 in Zfp281−/− mESC and Zfp281 in Klf4−/−mESC, as well as in WT cells. ChIPseq in WT cells replicated the prior observation that State 1 DATEs were more strongly bound by Klf4 than were State 3 DATEs, and State 3 DATEs were more strongly bound by Zfp281 than were State 1 DATEs. Next, we analyzed the binding of each factor in the other’s absence. Both factors remained bound to the majority of binding sites observed in WT and also gained new sites (Fig. S6J). Importantly, both factors showed increased binding at wildtype binding sites in the reciprocal factors’ knockout, including at DATEs (Fig. 4E, Fig. S6K). While underlying shifts in cell state distribution between WT, Klf4−/−, and Zfp281−/− cells (Fig. 3D) may contribute to this binding increase, this finding is consistent with a model of functional antagonism between Klf4 and Zfp281 at target enhancers. To further assess this model, we sorted State 1, 2, and 3 cells and determined binding of Klf4 and Zfp281 in each subpopulation using cleavage under targets and release using nuclease (CUT&RUN) (Skene and Henikoff, 2017). Across States 1–3, we observed a changing ratio of Klf4 binding to Zfp281 binding at DATEs (Fig. 4F), with Klf4 binding relatively stronger in State 1 cells and Zfp281 binding relatively stronger in State 2 and 3 cells, consistent with ChIPseq results across the bulk mESC population (Fig. 3C).
Together, the data indicate that Klf4 and Zfp281 drive opposing transcriptional and chromatin programs, suggesting a model where functional antagonism between the two factors generates cell state heterogeneity.
Klf4 and Zfp281 antagonism at DATEs drives variable expression of gene targets
Klf4 and Zfp281 drove opposing global regulatory and transcriptional programs. Next, we explored how Klf4 and Zfp281 co-binding impacted individual loci. Given the unique similarity in binding motif and location of Klf4 and Zfp281, we targeted genomic sites where Klf4 and Zfp281 binding directly overlapped at DATEs. To isolate the effect of TF binding on gene expression, we analyzed genes whose change in expression was not predicted to impact cell state distribution, which could confound observed gene expression changes. We used two parallel experimental approaches to target the DATEs regulating Tbx3, which is upregulated in State 1 and Zfp281−/−, and Krt8, which is upregulated in State 3 and Klf4−/− (Fig. 5A).
FIGURE 5: Klf4 and Zfp281 antagonism at DATEs regulates variable expression of gene targets.

A. Coverage tracks for gene and enhancer expression at representative loci (Tbx3 and Krt8) across Zfp281−/−, WT, and Klf4−/− cells. Arrows indicate genomic target sites for enhancer deletion (del) and base edits (BE). Representative Sanger sequencing traces show base editing of Klf4 and Zfp281 binding motifs (BE) compared to WT sequence (No edit). Klf4/Zfp281 co-bound regions are underlined, and edited bases are highlighted in red.
B. RT-qPCR analysis for target gene expression following enhancer deletion (del) at sequences indicated above (Fig. 5A, right). Data represent mean ± SEM of three technical replicates and are representative of three biological replicates (one-way ANOVA, *** p < 0.001).
C. RT-qPCR analysis for target gene expression following base editing (BE) at nucleotides indicated above (Fig. 5A, right). Data represent mean ± SEM of three technical replicates and are representative of three biological replicates (one-way ANOVA, *** p < 0.001).
D. (left) RT-qPCR analysis for target gene expression in sorted States 1, 2, and 3 in WT and enhancer deletion (enh del) mESC, coefficient of variation across States 1–3 is indicated for each genotype. (right) Ratio between the highest and lowest expression levels in WT or enhancer deleted mESC is plotted (two-sided Student’s t-test, ** p < 0.01).
First, we generated deletions of the DATE enhancer sequences for Tbx3 and Krt8 using CRISPR-Cas9 targeting, removing the genomic binding sites for Klf4 and Zfp281. In Zfp281−/−, Tbx3 gene expression is increased more than 2-fold, and this increase was mitigated by deletion of the DATE regulating Tbx3 (Fig. 5B top). Similarly, in Klf4−/−, Krt8 gene expression is increased nearly 5-fold, and this increase was abolished by deletion of the DATE regulating Krt8 (Fig. 5B bottom). Knockout of either enhancer did not result in a significant change in cell state distribution (Fig. S7A). These results indicate that knockout-dependent increases in gene expression were primarily mediated by DATEs.
Since deletion of the full enhancer sequence can remove other regulatory elements, we employed CRISPR base editing to further pinpoint the site of action. This approach utilizes a cytidine-deaminase fused to dCas9 generating C>T conversions at targeted nucleotides (Koblan et al., 2018; Walton et al., 2020). The motif sequences of Klf4 and Zfp281 are C-rich (Fig. S7B), facilitating targeting of their binding sites. We performed base editing at Klf4-bound and Zfp281-bound DATEs in knockout cells where the marker gene was upregulated and assessed whether upregulation was dependent on the co-bound Klf4 and Zfp281 motif. We isolated single clones with homozygous C-T conversion at Klf4/Zfp281 binding sites (Fig. 5A right). All analyzed clones had multiple edited nucleotides, and analysis of Klf4 and Zfp281 binding confirmed that base-editing substantially abrogated factor binding (Fig. S7C).
Because both factors are present in WT cells and can bind overlapping sites, we focused subsequent analysis on the effect of enhancer manipulations in knockouts, where resulting changes could be attributed to a specific factor. In Zfp281−/− cells, where Tbx3 is upregulated, base editing at a single site in a Tbx3 DATE decreased Tbx3 expression by 2-fold (Fig. 5C top). In Klf4−/− cells, where Krt8 is upregulated, base editing at a Krt8 DATE decreased Krt8 expression by 3-fold (Fig. 5C bottom). Moreover, we generated an additional base edit at another proximal Klf4- and Zfp281-bound site in the same DATE. These additional base-edits further decreased the knockout-dependent upregulation in gene expression for both Tbx3 and Krt8 in Zfp281−/− and Klf4−/− mESC, respectively (Fig 5C). These data suggest that changes in gene expression upon Klf4 or Zfp281 knockout were mediated by Klf4 and Zfp281 binding sites at DATEs.
In unedited cells, overlapping motifs at DATEs may allow the possibility for both Klf4 and Zfp281 to exert diverging activity at DATEs, and thus generate transcriptional and cell state heterogeneity. Therefore, we asked whether removing the Klf4 and Zfp281 co-bound regions in DATEs decreased gene expression differences across cell state. Cells in States 1, 2, and 3 were isolated by flow cytometry from WT cells, cells with deletion of the Tbx3 or Krt8 DATE sequence, and cells with base editing of the Klf4- and Zfp281-bound sites. As previously, we used the coefficient of variation across state as a measure of gene expression heterogeneity. Significant reductions in gene expression heterogeneity were observed in cells with enhancer deletion and base editing (Fig. 5D, S7D). Tbx3 enhancer deletion reduced the CV of Tbx3 mRNA expression across States 1–3 by 2.3-fold, from 0.88 to 0.37. Similarly, Krt8 enhancer deletion reduced the CV of Krt8 expression by 1.7-fold, from 1.06 to 0.61. Similar, though milder, effects were seen with base-editing: editing of the Tbx3 DATE decreased the CV of Tbx3 mRNA expression by 1.3-fold, and base-editing of the Krt8 DATE decreases the CV of Krt8 mRNA expression by 1.7-fold (Fig. S7D). Together, these results identify the specific nucleotides that drive differences in enhancer and gene expression across cell state.
Ratio of Klf4 and Zfp281 expression levels correlate with mESC state in single cells
Removal of the ability of Klf4 and Zfp281 to act at DATEs dampened variation in enhancer activity and its downstream gene target’s expression. These data are consistent with a model of antagonism between Klf4 and Zfp281, where the two factors are expressed in the same cell and exert opposing effects. To determine whether Klf4 and Zfp281 were expressed in the same cells, we performed immunofluorescence staining for Klf4 and Zfp281 in mESC (Fig. 6A). We analyzed cells for both Klf4 and Zfp281, and found that almost all cells expressed both factors above background levels (Fig. S8A). Additionally, loss of either factor did not result in a marked re-localization of the other (Fig. S8A).
FIGURE 6: Relative levels of Klf4 and Zfp281 correlate with mESC state in single cells.

A. mESC were stained for Klf4 and Zfp281. Merged image is shown. See also Fig. S8A.
B. scRNAseq of WT mESC, visualized by UMAP. Each cell was scored for expression of State 1, 2, and 3 gene signatures and assigned to a state (see Methods).
C. Each cell was scored for expression of Klf4 and Zfp281 gene targets (see Methods). The Klf4/Zfp281 program ratio was calculated as log2(Klf4 gene targets score / Zfp281 gene targets score). See also Fig. S8C–D.
D. Klf4/Zfp281 program ratio plotted against State 1, 2, and 3 scores for each cell.
E. UMAP embedding of WT, Klf4−/−, and Zfp281−/− cells, colored by genotype. Inset shows each genotype separately on the same UMAP embedding, pseudo-colored by density.
F. Trajectory analysis applied to scRNAseq of WT, Klf4−/−, and Zfp281−/− cells. Inset shows cells colored by scored expression for States 1, 2, and 3 (see Methods). See also Fig. S8E–F.
G. Proportion of WT, Klf4−/−, and Zfp281−/− cells along each segment of the trajectory. Proportions shown are the rolling average of 500 cells. See also Fig. S8G.
Expression of both factors within single cells raised the question of how their relative ratio correlated with transcriptional state. To assess this, we performed single cell RNA sequencing (scRNAseq) in WT, Klf4−/−, and Zfp281−/− mESC (Fig. S8B). Cells were scored for the level of expression of the gene signatures of States 1, 2, and 3, as well as the target genes of Klf4 and Zfp281. We observed that State 1 correlated with higher expression of Klf4 and its gene program and States 2 and 3 correlated with higher expression of Zfp281 and its gene program (Fig. 6B–D, S8C–D). Additionally, we used a uniform manifold approximation (UMAP) embedding to represent the transcriptomes of single cells and found Zfp281−/− mESC predominantly overlapped with WT State 1 cells, whereas Klf4−/− mESC primarily overlapped with WT State 2 and 3 cells (Fig. 6E). These data are consistent with opposing effects of Klf4 and Zfp281 contributing to the formation of States 1, 2, and 3.
Previous data suggested that Klf4 and Zfp281 knockout restricted transcriptional heterogeneity by dampening variation in gene expression across state (Fig. 5). However, in addition to this effect, Klf4 and Zfp281 knockout could also shift heterogeneity, enabling cells to enter previously inaccessible states. To parse between these effects, we performed trajectory analysis to order WT, Klf4−/−, and Zfp281−/− cells based on transcriptional similarity (Fig. 6F–G) (Trapnell et al., 2014). We observed cells of all genotypes at the root of the trajectory, which split into two branches. The first branch was correlated with upregulation of both State 1 genes and Klf4 gene targets and showed progressive enrichment for Zfp281−/− cells (Fig. 6F–G, S8E–G). In contrast, the second branch was correlated with upregulation of both State 2 and 3 genes and Zfp281 gene targets and showed progressive enrichment for Klf4−/− cells (Fig. 6F–G, S8E–G). Therefore, the two branches represent cells with increasingly divergent transcriptional profiles, consistent with a model of functional antagonism between Klf4 and Zfp281 generating cell state heterogeneity.
Klf4 and Zfp281 exert opposing effects on cell state transition kinetics
While Klf4 and Zfp281 antagonism at DATEs resulted in transcriptional heterogeneity, knockout of either factor could also alter cell state repopulation. To test this, we repeated the single cell cloning experiment in Fig. 1A using Klf4−/− and Zfp281−/− cells. We sorted individual mESC, allowed them to grow into colonies for 7 days, and assayed the cell state distribution of the resulting colonies. Klf4−/− cells showed a relatively low cloning efficiency, allowing analysis of only 29 Klf4−/− colonies, compared to 150 Zfp281−/− colonies and 150 WT colonies. In line with our hypothesis, single cells with Klf4 or Zfp281 knockout regenerated the parental distribution of each particular genotype, indicating that loss of either factor robustly alters the cell state distribution of mESC (Fig. 7A).
FIGURE 7: Klf4 and Zfp281 exert opposing effects on cell state kinetics.

A. Single Klf4−/− or Zfp281−/− mESC were cloned, grown for 7 days, and colonies analyzed by flow cytometry for distribution of cell state. WT mESC from Fig. 1C shown for comparison.
B. 150,000 cells per States 1–3 were isolated by flow cytometric sorting from WT, Klf4−/−, and Zfp281−/− mESCs. Sorted populations were analyzed every 2 days for mESC proportions in each cell state. Data represent mean ± SEM of three biological replicates.
C. State proportions in WT, Klf4−/−, and Zfp281−/− mESCs from Fig. 7B were fit using a stochastic 3-state model to infer switching rates. k12 refers to the rate of switching from State 1 to State 2, k13 refers to the rate of switching from State 1 to State 3, and so forth. Significantly altered rates of switching (see Methods) are highlighted.
To further explore whether Klf4 and Zfp281 loss impacts cell state dynamics, we isolated cells of each state from Klf4−/−, Zfp281−/−, and WT genotypes and observed the rate of repopulation of the other states every 2 days (Fig. 7B). We modeled the observed changes using a stochastic 3-state switching model in order to calculate rate constants of state-switching (Fig. 7C). Sorted WT cells from any state largely replenished all 3 cell states. Previous reports have suggested that Nanoglow cells comprise two states, one with fast repopulation kinetics and one that persists over multiple generations (Filipczyk et al., 2015; Udomlumleart et al., 2021). Consistent with this, we observed a lower rate of transition for State 2 (Nanoglow, Sox2high) cells compared to State 3 cells when isolated. Knockout cells exhibited differential rates of switching between state compared to WT. For example, Klf4−/− State 1 cells re-populated States 2 and 3 faster than WT (k12 = 0.127 and 0.027 for Klf4−/− and WT, respectively), and Zfp281−/− State 2 and 3 cells repopulated State 1 faster than WT (k21 = 0.5 and 0.081 for Zfp281−/− and WT, respectively). Therefore, Zfp281−/− State 2 cells showed almost no persistence and transitioned rapidly to State 1, suggesting that Zfp281 activity at target sites may be responsible for the previously observed persistence of this second Nanoglow state. Additionally, Zfp281 loss resulted in an increase in the rate of exiting State 2 with no impact on its rate of entry (ex. k21 = 0.500 and 0.081, k12 = 0.027 and 0.027 for Zfp281−/− and WT, respectively), just as Klf4 loss resulted in an increase in the rate of exiting State 1 (ex. k12 = 0.127 and 0.021, k21 = 0.081 and 0.081 for Klf4−/− and WT, respectively). Thus, as both single cells and bulk subpopulations, knockouts consistently return to their underlying, skewed distribution of cell state.
These findings suggest that Klf4 and Zfp281 knockout perturb cell state distribution and dynamics. We conclude that functional antagonism between Klf4 and Zfp281 at DATEs can generate variation in mESC gene expression that underlies multi-state formation, with the potential for analogous motifs to generate diverse cell types during mammalian development.
DISCUSSION
In this study, we identify differentially active transcribed enhancers across interconverting mESC states. We find that Kruppel-like factors Klf4 and Zfp281 co-bind these enhancers, exerting opposing transcriptional and epigenetic effects. This functional antagonism generates variation in gene expression and regulates mESC heterogeneity in cell states.
We find that Klf4 and Zfp281 form a distinct subset of the pluripotency network, distinguished by their antagonistic interactions, enriched co-binding at DATEs, and contribution to gene expression variation. Since Klf4 and Zfp281 co-bind fewer than half of all DATEs, other factors likely contribute to cell state heterogeneity. For example, functional antagonism between Otx2 and Nanog has been shown to contribute to the state distribution of mESC (Acampora et al., 2016, 2017). Identifying other key factors at DATEs will further understanding of mESC heterogeneity.
The identification of Klf4 and Zfp281 demonstrates the utility of studying transcriptional and regulatory differences across substates. Previous studies demonstrated that Klf4 shares redundant functions with Klf2 and Klf5 in mESC, and the loss of three Klfs family members is required to abrogate self-renewal and pluripotency (Jeon et al., 2016; Jiang et al., 2008). Consistent with these results, we observe that Klf4 loss decreased but did not eliminate State 1 cells. Interestingly, Zfp281 is also a Kruppel-like zinc finger transcription factor and has been identified to regulate the exit from naïve pluripotency (Fidalgo et al., 2012, 2016; Huang et al., 2017; Mayer et al., 2020). We extend these findings by identifying the enhancers at which Zfp281 activates pro-differentiation gene expression and plays an opposing role to Klf4-driven naïve pluripotency. Additionally, we find that Klf4 and Zfp281 impact the rate of leaving, rather than entering, States 1 and 2, respectively. Since Klf4 promotes State 1 and Zfp281 promotes State 2, this suggests the two factors play key roles in maintaining cell state, with less of an effect on state entry. Future studies that distinguish whether a factor pioneers entry into or maintains a cell state will be of interest.
The functional antagonism at DATEs raises intriguing questions. For example, at State 1 loci, a high ratio of Klf4 to Zfp281 leads to State 1 specific expression. However, at State 3 loci, a high ratio of Klf4 to Zfp281 leads to little or no expression in State 1 cells. This suggests that context-dependent, cis-regulatory effects can modulate Klf4 activity from promoting to repressing expression. Dissecting the regulatory interactions underlying this switch in activity will be of great interest. Also, many questions remain regarding the nature and timing of the molecular interactions between Klf4 and Zfp281, eRNA, and chromatin. Understanding how these interactions generate heterogeneity may yield new insights into gene regulation.
Transcription factor antagonism is a known developmental motif, such as competition between Brn2 and Sox17 that specifies mESC lineages (Loh and Lim, 2011; Martello and Smith, 2014; Niakan et al., 2010; Sokolik et al., 2015; Thomson et al., 2011) or competition between GATA1 and PU.1 in specifying erythroid and myeloid lineages in hematopoiesis (Arinobu et al., 2007; Burda et al., 2010). Our study suggests that antagonism also underlies more dynamic gene expression changes such as reversible cell state switching. These interactions may represent a cell-intrinsic ‘hardwiring’ of transcriptional heterogeneity and provide a mechanism by which a single cell generates distinct cell fates.
Heterogeneous expression of Nanog and other genes in mESC has been widely studied and attributed to stochastic processes. Antagonism between factors at shared enhancer targets may provide a mechanism for how single cells can consistently and robustly form diverse gene expression states, even in the absence of external signals. Further characterization of intrinsic sources of gene expression heterogeneity may provide insight into developmental processes such as symmetry breaking, lineage priming, and the generation of diverse cell types.
Limitations of this study
First, the study measures the level of knock-in fluorescent reporters at Nanog and Sox2 loci as proxy for cell state. Fluorophore half-lives (t1/2 ~ 22hrs) match the timescale of cell-state switching (~1–3 days), and therefore are not readouts for Nanog and Sox2 levels (estimated t1/2 ~2–3 hrs). In particular, the rate of switching out of State 1 may be underestimated due to reporter persistence. Relatedly, the present approach assumes that the regulatory state of the cell is tied to reporter levels. Regulatory states on finer timescales will be missed. Additionally, cells were binned into 3 states. While justified by the literature (Chakraborty et al., 2020), this misses other microstates. Finally, we cannot formally order state transitions (i.e. rule out that a population observed to switch from State 1 to State 3 transitioned through State 2 unobserved).
STAR Methods
Resource availability
Lead contact
Further information and requests for resources and reagents should be directed to and will be fulfilled by the lead contact, Salil Garg (salil.garg@yale.edu).
Materials availability
Cell lines and plasmids are listed in the key resources table. Oligonucleotides are listed in Table S2.
KEY RESOURCES TABLE
| REAGENT or RESOURCE | SOURCE | IDENTIFIER |
|---|---|---|
| Antibodies | ||
| Anti-Klf4, goat polyclonal | R&D | Cat# AF3158, RRID AB_2130254 |
| Anti-Klf4, rabbit polyclonal | Abcam | Cat #12947, RRID AB_299529 |
| Anti-Zfp281, rabbit polyclonal | Abcam | Cat# 101318, RRID AB_11157929 |
| Anti-Gapdh, mouse monoclonal | Ambion | Cat# AM4300, RRID AB_437392 |
| Anti-goat IgG, 800CW IRDye donkey | LI-COR | Cat# 926–32214, RRID AB_621846 |
| Anti-rabbit IgG, 800CW IRDye donkey | LI-COR | Cat# 925–32213, RRID AB_2715510 |
| Anti-rabbit IgG, 680RD IRDye donkey | LI-COR | Cat# 925–68072, RRID AB_2814912 |
| Anti-H3K4me3, mixed monoclonal | Epicypher | Cat# 13–0041 |
| Rabbit IgG | Epicypher | Cat# 13–0042 |
| Bacterial and virus strains | ||
| MegaX DH10B T1R Electrocomp Cells | ThermoFisher | Cat# C640003 |
| Chemicals, peptides, and recombinant proteins | ||
| Leukemia inhibitory factor (LIF) | MilliporeSigma | Cat# ESG1107 |
| G418 | Invivogen | Cat# ant-gn-2 |
| Blasticidin | ThermoFisher | Cat# A1113903 |
| Trizol reagent | ThermoFisher | Cat# 15596018 |
| Critical commercial assays | ||
| Oligo Clean & Concentrator kit | Zymo Research | Cat# D4060 |
| SuperScript IV | ThermoFisher | Cat# 18090010 |
| KAPA RNA HyperPrep Kit with RiboErase | Roche | Cat# 08098140702 |
| UltraII DNA Library Prep Kit for Illumina | NEB | Cat# E7645L |
| Alkaline Phosphatase Detection Kit | MilliporeSigma | Cat# SCR004 |
| CUTANA ChIC/CUT&Run Kit | Epicypher | 14–1048 |
| Deposited data | ||
| NGS data for this study | This paper | GSE169044 |
| Additional ChIPseq data re-analyzed for this study | Listed in Table S4 | N/A |
| Raw fluorescence microscopy images of immunofluorescence studies and raw scans of immunoblots | This paper | Mendeley data, doi: 10.17632/hx4zs8dbp2. |
| Experimental models: Cell lines | ||
| V6.5 mouse embryonic stem cells | Jaenisch Laboratory | RRID CVCL_C865 |
| Klf4−/− V6.5 mouse embryonic stem cells | This paper | N/A |
| Zfp281−/− V6.5 mouse embryonic stem cells | This paper | N/A |
| V6.5 mouse embryonic stem cells with Tbx3 enhancer deletion | This paper | N/A |
| V6.5 mouse embryonic stem cells with Krt8 enhancer deletion | This paper | N/A |
| Klf4−/− V6.5 mouse embryonic stem cells with Krt8 enhancer deletion | This paper | N/A |
| Zfp281−/− V6.5 mouse embryonic stem cells with Tbx3 enhancer deletion | This paper | N/A |
| V6.5 mouse embryonic stem cells with single base edits in Tbx3 enhancer | This paper | N/A |
| V6.5 mouse embryonic stem cells with single base edits in Krt8 enhancer deletion | This paper | N/A |
| Klf4−/− V6.5 mouse embryonic stem cells with single base edits in Tbx3 enhancer | This paper | N/A |
| Klf4−/− V6.5 mouse embryonic stem cells with double base edits in Tbx3 enhancer | This paper | N/A |
| Zfp281−/− V6.5 mouse embryonic stem cells with single base edits in Tbx3 enhancer | This paper | N/A |
| Zfp281−/− V6.5 mouse embryonic stem cells with double base edits in Tbx3 enhancer | This paper | N/A |
| Oligonucleotides | ||
| Listed in Table S2 | ||
| Recombinant DNA | ||
| psPAX2 | Addgene | Cat# 12260 |
| pMD2.G | Addgene | Cat# 12259 |
| pB-rtTA-Neo-BsmBI | Addgene | Cat# 126028 |
| pB-Cerulean-BsmBI | This paper | N/A |
| pB-CAGGS-dCas9-KRAB-BSD | Addgene | Cat# 110822 |
| pX330-hSpCas9 | Addgene | Cat# 42230 |
| pLKO-Klf4-shRNA1 | MilliporeSigma | Cat# TRCN0000238250 |
| pLKO-Klf4-shRNA2 | MilliporeSigma | Cat# TRCN0000095370 |
| pLKO-Zfp281-shRNA1 | MilliporeSigma | Cat# TRCN0000255744 |
| pLKO-Zfp281-shRNA2 | MilliporeSigma | Cat# TRCN0000255746 |
| Software and algorithms | ||
| dREG | https://github.com/Danko-Lab/dREG | N/A |
| Deeptools | https://deeptools.readthedocs.io/en/develop/ | RRID:SCR_016366 |
| fastxtoolkit | http://hannonlab.cshl.edu/fastx_toolkit/ | N/A |
| Bowtie2 | http://bowtie-bio.sourceforge.net/bowtie2/ | RRID: SCR_016368 |
| Bwa | http://bio-bwa.sourceforge.net | RRID: SCR_010910 |
| Samtools | https://htslib.org/ | RRID:SCR_002105 |
| HOMER | http://homer.ucsd.edu/homer/ | RRID:SCR_010881 |
| Macs2 | https://github.com/macs3-project/MACS | RRID:SCR_013291 |
| Genrich | https://github.com/jsh58/Genrich | N/A |
| IGV | http://www.broadinstitute.org/igv/ | RRID: SCR_011793 |
| R | http://www.r-project.org/ | RRID:SCR_001905 |
| FlowJo | https://www.flowjo.com/solutions/flowjo | RRID:SCR_008520 |
| ImageJ | https://imagej.net/ | RRID: SCR_003070 |
| Other | ||
| Klf4 siRNA ON-TARGETplus SMARTpool | Dharmacon | Cat# L-040001–01-0005 |
| Zfp281 siRNA ON-TARGETplus SMARTpool | Dharmacon | Cat# L-057818–91-0005 |
| Control siRNA ON-TARGETplus Non-targeting pool | Dharmacon | Cat# D-001810–10-05 |
Data and code availability
Data: mPROseq, RNAseq, ATACseq, ChIPseq, and scRNAseq data generated in this study are deposited in NCBI’s Gene Expression Omnibus and are accessible through GEO Series accession number GSE169044. Immunofluorescence and immunoblot images generated in this study are deposited in Mendeley Data and are accessible through at doi:10.17632/hx4zs8dbp2.1. Additionally, ChIPseq datasets from various studies were re-analyzed in this study and are listed in Table S4.
Code: Example code to analyze the generated data is publicly available at https://github.com/SGarg-Lab/DATE-scripts. A
Any additional information required to reanalyze the data reported in this paper is available from the lead contact upon request.
Experimental model and subject details
Cell culture studies
V6.5 mouse embryonic stem cells (mESC, Jaenisch laboratory, Whitehead Institute, Massachusetts Institute of Technology) were cultured in DMEM supplemented with 16.5% FBS, antibiotics, L-glutamine, non-essential amino acids, HEPES buffer, β-mercaptoethanol, and LIF. Cells were cultured at 37°C and 5% CO2
Method details
Cell lines and culture methods
V6.5 mouse embryonic stem cells (ESC, Jaenisch laboratory, Whitehead Institute, Massachusetts Institute of Technology) were cultured on tissue culture-treated 10cm2 plates (Sigma-Aldrich CLS430167) pre-coated with 0.2% gelatin in phosphate-buffered saline (Fisher MT21031CV). Cells were cultured in mESC media [415 mL Dulbecco’s Modified Eagle Medium (Gibco 11995–065), 5 mL 200 mM L-glutamine (Gibco 25030–081), 5 mL 100x non-essential amino acids (Gibco 11140–50), 5 mL 100x penicillin/streptomycin (Corning 30–002-Cl), 5.5 mL HEPES buffer solution (Gibco 15630–106), 4 uL 14.3M β-mercaptoethanol (ThermoFisher 21985023), 82.5 mL FBS (Hyclone SH30070.03 or Avantor Seradigm 97068–085), 55uL leukemia inhibitor factor (MilliporeSigma ESG1107)]. All cells were grown at 37°C and 5% CO2 and passaged every two days to maintain 10–70% confluency.
GFP and mCherry tags were inserted at the endogenous loci of Nanog and Sox2, using CRISPR- Cas9 induced homology directed repair as previously described (Chakraborty et al., 2020). For each targeted gene, the guide RNA sequence was cloned into pX330 (Addgene #42230) using BbsI restriction sites; the modified plasmid was then introduced into cells by Lipofectamine 2000 (Invitrogen) along with a homology-directed repair construct containing the relevant fluorophore, T2A/P2A, and drug resistance. Transfected cells were selected by drug resistance, and PCR was used to confirm heterozygous insertion of the repair construct at the endogenous locus.
Single cell cloning by fluorescence-activated cell sorting (FACS)
For single cell cloning (Fig. 1B, 7A), single cells are sorted per well into 96-well flat bottom plates (Corning 3595) and cultured as above for 7 days. These clonal populations were harvested at day 7 and analyzed for GFP and mCherry fluorescence on a BD LSR II, and the results were analyzed using FlowJo (v9.9). Live cells were selected based on forward scatter area and side scatter area. Single cells were then selected based on forward scatter height and width. Gates for States 1, 2, and 3 were drawn based on GFP (Nanog) and mCherry (Sox2) levels, using unlabeled V6.5 as compensation controls as previously described (Chakraborty et al. 2020, Udomlumleart et al. 2021). Representative gates are shown in Figure 1. For each clone, the percentage of cells in States 1, 2, and 3 was quantified. All FACS plots are showed as 5% contour plots.
Modified precision nuclear run-on sequencing (mPROseq)
States 1, 2, and 3 cells were isolated from Nanog-GFP, Sox2-mCherry tagged V6.5 mESC using a BD FACSAria. Approximately ~105 cells from each subpopulation were collected for mPROseq. Three biological replicates per subpopulation and unsorted population were used. mPROseq was performed according to the PROseq protocol established in (Mahat et al., 2016), with the following changes:
During sample preparation, cell permeabilization was performed only once to reduce sample loss. Cell permeabilization was performed by centrifuging FACS-sorted cells at 1,000g for 5 min at 4°C, resuspending and incubating the cell pellet in 150 uL permeabilization buffer [10 mM Tris-Cl (pH 7.4), 300 mM sucrose, 10 mM KCl, 5 mM MgCl2, 1mM EGTA, 0.05% Tween-20, 0.1% NP-40, 0.5 mM DTT, 1x Halt Protease inhibitor (ThermoFisher 78430), 100 U/mL SUPERase RNAse inhibitor (ThermoFisher AM2694)] for 5 min at 4°C. Then, cells were centrifuged at 1,000g for 5 min at 4°C, and the cell pellet was resuspended in 25 uL storage buffer [10 mM Tris-Cl (pH 8.0), 25% glycerol, 5mM MgAc2, 0.1 mM EDTA, 5 mM DTT, 1x Halt Protease Inhibitor, 100 U/mL SUPERase RNAse inhibitor], flash frozen in liquid nitrogen, and stored at −80°.
RNA fragmentation was performed by ZnCl2 rather than base hydrolysis. 2.5uL 100 mM ZnCl2 and 2.5 uL 100 mM Tris-HCl (pH 7.0) was added to 20 uL purified RNA. This mixture was incubated at 65°C for 10 min. Then, the zinc was chelated by adding 25 uL 100 mM EDTA (pH 8.0). Buffer exchange was performed on the 50 uL hydrolyzed RNA sample as in PROseq protocol.
During biotin RNA enrichment steps, wash steps were reduced in the following manner. The streptavidin beads were washed twice with high salt wash buffer, once with binding buffer, and once with low salt wash (buffers as in PROseq protocol).
During RNA extraction from streptavidin beads using Trizol, 75% ethanol wash steps were not performed to reduce sample loss.
- Several oligonucleotides used were modified (Table S2).
- A terminal G and 6bp TRUseq index were added to the 5’ end of the RNA adaptor used for ligation to the 3’ end of nascent RNA. This enables pooling of libraries earlier, after 3’ RNA adaptor ligation.
- The RNA adaptor used for ligation to the 5’ end of nascent RNA was changed to match TRUseq Small RNA (26bp) flow-cell primer for single-end sequencing.
- Barcodes were removed from the DNA oligo used for PCR amplification.
PCR products of the test library amplification were analyzed on native PAGE gel, rather than agarose gel.
Samples were analyzed by Agilent Bioanalyzer and quantified by qPCR. Sequencing was performed on Illumina NextSeq500.
mPROseq in Klf4−/−, Zfp281−/−, and WT clones in Fig. 4 was performed with four biological replicates each, as above, with the following changes:
Approximately ~107 cells from each cell line were collected for mPROseq.
Zymo Oligo Clean & Concentrator kit (Zymo D4060) was used to clean RNA samples instead of Trizol extraction steps.
Sequencing was performed on Illumina NovoSeq, yielding on average 6M reads per sample. One WT library was excluded from further analysis due to low read number (<0.5 M).
RT-qPCR for enhancer and gene transcripts (eRNA and mRNA)
Total RNA was isolated from cells in the following manner. mESC were grown to approximately 50–70% confluency on 10cm2 plates, as described above. After removing media, 750uL of TRIzol Reagent (ThermoFisher 15596018) was added directly to the plate. The cells were detached using a cell scraper, collected in an Eppendorf tube, vortexed for 1 minute, and incubated for 5 minutes at room temperature. Then, 150uL chloroform was added, and the mixture vortexed vigorously and then incubated for 3 minutes at room temperature. The mixture was centrifuged for 15 minutes at 18,000g at 4C, and the aqueous phase was transferred to a new Eppendorf tube containing 1uL GlycoBlue coprecipitant (ThermoFisher AM9515). Then, 375uL isopropanol was added, and the mixture was incubated for 10 minutes and centrifuged for 10 minutes at 18,000g at 4C. The supernatant was discarded, and the pellet was resuspended gently in 750uL 75% ethanol. This was centrifuged for 5 minutes at 18,000g at 4C, and the supernatant was discarded. The pellet was air dried for 5–10 minutes, resuspended in 20 uL RNA Storage Solution (ThermoFisher AM7001), and incubated at 55C for 5–10 minutes.
Next, DNA digestion was performed in the following manner. The 20 uL RNA sample was treated for 1 minute with 1uL DNaseI (NEB M0303) in 10uL DNase Buffer (10x, NEB B0303) and 69uL DEPC-treated water (ThermoFIsher 4387937). The DNase treatment was inactivated by addition of 1uL 0.5M EDTA and incubation at 75C for 10 minutes. Then, 300uL 100% ethanol was added to the mixture. This was incubated for 10 minutes at −20C and centrifuged for 20 minutes at 18,000g at 4C. The supernatant was discarded. The pellet was resuspended gently in 750uL 100% ethanol. This was centrifuged for 5 minutes at 18,000g at 4C. The supernatant was discarded, and the pellet was resuspended in 20 uL RNA Storage Solution.
RNA concentration was measured by Nanodrop, and 500ng of RNA per sample was used for the synthesis of complementary DNA (cDNA) in 10uL reactions using SuperScript IV (ThermoFisher 18090010) according to manufacturer’s instructions. 0.3 uL of the resulting cDNA was used for each 20uL qPCR reaction. qPCR was performed with Power SYBR Green Master Mix (ThermoFisher 4367659) on the Applied Biosciences StepOne Plus RT-qPCR system. Actb was used as an endogenous control to normalize between samples. All RT-qPCR primers are listed in Table S2. The data were analyzed using the 2-ΔΔCTmethod. At least two sets of primers were tested per enhancer locus. Primer sets were validated for specific, single products using melt curve analysis and comparison to products formed in “no reverse transcriptase” control reactions. Three technical replicates and at least two biological replicates were performed for each experiment.
CRISPRi at specific enhancer loci
sgRNA sequences for CRISPRi were designed using CRISPick and are listed in Table S2. The sgRNA oligos were synthesized by IDT and cloned into a piggyBac sgRNA delivery vector (pB-Cerulean-BsmBI) using BsmBI restriction sites. This vector co-expresses Cerulean and was created by digesting pB-rtTA-Neo-BsmBI (Addgene #126028) with XbaI and BamHF to excise rtTA and inserting Cerulean by Gibson assembly.
One day after plating 50,000 Nanog-GFP, Sox2-mCherry ESC per well into 6-well plates, each well was transfected with 500ng of pB-Cerulean-BsmBI containing the indicated sgRNA, 500ng of a plasmid expressing piggyBac transposase, and 1ug of pB-CAGGS-dCas9-KRAB-BSD (Addgene #110822) using Lipofectamine 3000 (ThermoFisher L3000001) according to manufacturer’s instructions. After 24 hours of transfection, cells were expanded into 10cm2 plates containing 300 ug/mL G418 (Invivogen ant-gn-2) and 2ug/mL blasticidin (ThermoFisher A1113903) to select for expression of the sgRNA and dCas9-KRAB, respectively. After at least 48 hours of selection, cells were harvested for FACS. Cerulean+ cells were sorted using a BD FACSAria, pelleted, and resuspended in 500uL Trizol, and subsequent RNA extraction and RT-qPCR analysis was performed as described above.
CRISPRi screen
sgRNAs targeting each mPROseq enhancer were designed using CRISPR library designer (CLD) from the Boutros laboratory (Heigwer et al., 2016) using the default parameters (crispri_downstream=50, crispri_upstream=400), except as needed to generate output outside of annotated genes (exon_exclusive=0, gene_exclusive=0, number_of_CDS=0, sort_by_rank=1). The top 5 candidate sgRNA sequences were taken for each mPROseq enhancer that met design parameters whenever available; some target enhancers did not yield 5 suitable candidates (total 35,780 unique guides against 7,228 mPROseq enhancers, Table S2). Guide sequences were extended (5’ end – TCCCACGACGCTTTATATATCTTGTGGAAAGGACGAAACACC, 3’ end - GTTTTAGAGCTAGAAATAGCAAGTTAAAATAAGGCTAGGTCAAAACC), amplified using primers creating overhangs for Gibson assembly (5’-CTTGGCTTTATATATCTTGTGGAAAGGACGAAACACC- 3’,5’-GTTGATAACGGACTAGCCTTATTTTAACTTGCTATTTCTAGCTCTAAAAC-3’) and cloned into pB_rtTA_BsmBI (Addgene #126028) using BsmBI digestion and Gibson assembly (HiFi assembly, NEB E2621L) and introduced into MegaX DH10B T1R Electrocomp Cells (ThermoFisher, C640003) using recommended settings (2.0 kV, 200 Ohm, 25 μF). Additionally, 496 non-targeting control sgRNAs sequences were obtained from the Broad Institute Genetic Perturbation Platform, synthesized as an oligo pool by IDT (Table S2). Oligos were amplified using the same primers to create overhangs for Gibson assembly (5’-CTTGGCTTTATATATCTTGTGGAAAGGACGAAACACC-3’,5’- GTTGATAACGGACTAGCCTTATTTTAACTTGCTATTTCTAGCTCTAAAAC-3’) and cloned into pB_rtTA_BsmBI (Addgene #126028) using BsmBI digestion and Gibson assembly (HiFi assembly, NEB E2621L) and introduced into MegaX DH10B T1R Electrocomp Cells (ThermoFisher, C640003).
For three screen replicates, 6 10cm2 plates were seeded with 2x10⁶ Nanog-GFP, Sox2-mCherry ESC per plate. One day after plating, each plate was transfected with 9ug of pB-CAGGS-dCas9-KRAB (Addgene #110822), 9ug of a plasmid expressing piggyBac transposase, 9ug of the sgRNA library targeting mPROseq enhancers, and 0.5 ug of the non-targeting sgRNA library, using Lipofectamine 3000 (Thermo Fisher Scientific). A fourth screen replicate was performed with the same method, but without transfection of the non-targeting sgRNA library. 48 hours after transfection, cells were expanded into 15cm2 plates containing 400 ug/mL G418 and 2ug/mL BSD to select for expression of sgRNA and dCas9-KRAB, respectively. Cells were passaged and maintained in antibiotic selection. After 5 days in culture, ESC were sorted on the basis of Nanog levels (GFP) into the top 5% and bottom 5% GFP expressing cells. Genomic DNA (gDNA) was isolated from ~3–4 x 10⁶ recovered cells from each population (Nanog-low and Nanog high) as was gDNA from unsorted library transduced cells (106). These three populations were amplified using primers with Illumina flowcell compatible overhangs (Table S2) and sequenced on an Illumina NextSeq500 platform.
Generation of knockout cell lines
Klf4−/− and Zfp281−/− cell lines were generated using the CRISPR-Cas9 system. sgRNAs were designed to the unique genomic DNA sequence of the Klf4 and Zfp281 genes using GPP sgRNA Designer. sgRNAs were synthesized as oligos (IDT) and cloned using a BbsI restriction site into PX330 (Addgene #42230). The PX330 plasmid containing the appropriate sgRNA was co-transfected into Nanog-GFP, Sox2-mCherry ESC with a transiently expressed fluorescent marker (mCerulean3, Addgene #54730), using Lipofectamine 2000 (ThermoFisher 11668030) according to manufacturer’s instructions. Single CFP+ cells were sorted into wells, grown to lines, and screened for alteration at the targeted loci by PCR and analyzed for changes in GFP and mCherry distribution by flow cytometry.
Next, lines showing genomic alteration by PCR were screened for depletion of the TF protein by immunoblotting. Cells were washed twice with cold PBS, harvested via scraping, and pelleted at 4oC. Cells were resuspended in 200 μL RIPA lysis buffer [50 mM Tris (pH 8.0), 150 mM NaCl, 1% NP-40, 0.5% sodium deoxycholate, and 0.1% SDS] supplemented with protease inhibitor cocktail (cOmplete, Roche) and lysed under constant agitation at 4oC for 30 minutes. Lysates were pelleted at 4oC, and 30 μg of protein was mixed with 2x Laemmli buffer with B-Mercaptoethanol and boiled for 5 min at 100 temperature. Samples were loaded and run on a 12% SDS-polyacrylamide electrophoresis gel, transferred onto nitrocellulose membrane, and immunoblotted using anti-Klf4 (1:1000, R&D AF3158) or anti-Zfp281 (1:500, Abcam 101318) and anti-GAPDH (1:1000, Ambion AM4300) antibodies. Membranes were probed using anti-goat 800nm (1:10,000, LI-COR 926–32214) or anti-rabbit 800nm (1:10,000, LI-COR 925–32213) and anti-mouse 700nm (1:10,000, LI-COR 925–68072) and imagined on LI-COR Odyssey (Fig. S5C). We selected three Klf4−/−clones and three Zfp281−/− clones for further analysis.
siRNA and shRNA knockdown
mESC were plated into 6 well plates and, 24 hours later, transfected with 1.5 uL 20uM siRNA using Lipofectamine RNAiMax (Invitrogen 13778075) according to manufacturer’s instructions. The next day, the media was removed, and fresh media was added. Cells were harvested for FACS analysis 2 days after transfection.
shRNA vectors were obtained from Millipore Sigma (see key resources table). Because Nanog-GFP, Sox2-mCherry ESC already carry resistance against puromycin, the puromycin resistance marker in the shRNA vectors was extracted by digestion with BamHI and MluI and replaced by Gibson assembly with hygromycin resistance marker. Lentivirus-encoding shRNAs were packaged using HEK293T cells following The RNAi Consortium (TRC) Broad Institute protocol using Pax2 and VSV-G plasmids. ESC were plated into 6 well plates, and 2.5mL of viral culture supernatant along with 8uL 1 mg/mL polybrene (MilliporeSigma TR-1003-G) was added to 2mL of ESC media per well. The next day, cells were expanded into 10 cm2 plates containing 250 ug/mL hygromycin (ThermoFisher 10687010). Cells were harvested for FACS analysis after 5 days.
Alkaline phosphatase detection
Alkaline phosphatase analysis was performed on three independent clones per genotype. Two days after seeding 10,000 mESC per well into 12 well plates (Alkaline Phosphatase Detection Kit, MilliporeSigma SCR004), cells were washed, incubated with 4% paraformaldehyde in PBS for 1 minute, washed with 1x tris-buffered saline with 0.1% Tween-20 (TBST), and stained with 2:1:1 mixture of Fast Red Violet solution, napthol aS-BI phosphate solution, and water for 15 minutes. Cells were washed and imaged (Fig. 4E).
Alkaline phosphatase levels were quantitatively measured using p-nitrophenyl phosphate assay. One day after seeding 150,000 cells per well into 6 well plates, mESC were harvested for protein using RIPA lysis buffer, as described above (Generation of knockout cell lines). For each replicate, 1 uL of protein sample was incubated with 200 uL 1-Step PNPP Substrate Solution (ThermoFisher, 37621) at 37C for 10 minutes. Absorbance was measured by Tecan Infinite M200Pro Microplate reader at 405 nM and normalized to total protein amount, as measured by BCA assay (Pierce BCA Protein Assay Kit, ThermoFisher 23225).
Retinoic acid differentiation
Three independent clones per Klf4−/−, Zfp281−/−, and WT cells (GFP-Nanog, Sox2-mCherry) were differentiated in retinoic acid using the following protocol. 24 hours after seeding 2.5 x 10⁵ cells per 10cm2 plates, cells were washed with HBS and RA media was added. The RA media was composed of 2.5 mL 100x N2 supplement (Gibco 17502–048), 247.5 mL DMEM/F12 (Gibco 11320–033), 5mL 50x B27 supplement (Gibco 17504–044), 2.5 mL 200 mM L-glutamine (Gibco 25030–081), 245 mL Neurobasal medium (Gibco 21103–049), 2.5uL 25mM retinoic acid (final concentration 0.25 uM, MilliporeSigma R2625) and 3.5 uL of 14.3M β-mercaptoethanol (ThermoFisher 21985023). Cells were maintained in RA media until being harvested for RT-qPCR analysis (as described above) or for flow cytometry. For flow cytometry, cells were trypsinized and then resuspended in PBS with 10% FBS at a concentration of 1–5 x 10⁶ cells per mL. Cells were stained with antibodies against CD24 (APC Rat Anti-Mouse CD24, BD Pharmigen 562349) for 60 minutes in the dark. Nanog levels were measured using GFP fluorescence. Cells were washed three times to remove unbound antibody before analysis by cytometry.
Bulk ATACseq sample preparation
One technical replicate per three different Klf4−/− clones, three different Zfp281−/− clones, and three WT clones were used for ATAC-seq according to the protocol established by (Buenrostro et al., 2013, 2015). In brief, 50,000 mESC were harvested and nuclei prepared using a 0.1% IGEPAL CA-630 lysis buffer. Transposition was performed using TD reaction buffer and 2.5 uL Nextera Tn5 Transposase (Illumina 20034198) for 30 minutes at 37°C and fragments eluted using MinElute PCR purification kit (Qiagen 28006). Fragments were amplified using NEBNext High-Fidelity 2x PCR Master Mix (M0541L) using the primers and according to the cycling parameters established by (Buenrostro et al., 2013, 2015). The number of amplification cycles was determined separately for each sample using a test qPCR reaction as recommended in (Buenrostro et al., 2015). Libraries were purified and sequenced on Illumina HiSeq PE150 yielding 88M-135M reads per sample which were then analyzed as described below.
Bulk RNAseq sample preparation
Three technical replicates per three different Klf4−/− clones, three Zfp281−/− clones, and three ZWT clones were used. Total RNA was isolated as described above (RT-qPCR for enhancer and gene transcripts). Following DNase I (NEB M0303) treatment and ethanol precipitation, samples were analyzed by Agilent BioAnalyzer and accepted for sample RNA integrity number > 7.0. rRNA-depleted RNA-sequencing libraries were prepared using KAPA RNA HyperPrep Kit with RiboErase (Roche 08098140702) to manufacturer’s instructions. The final libraries were quality control checked by fragment electrophoresis. Illumina HiSeq 2500 paired-end 150nt was used for sequencing.
ChIPseq sample preparation
ChIPseq was performed on Klf4−/−, Zfp281-/-, and WT ESC for Klf4 and Zfp281 (Klf4 R&D AF3158, Zfp281 Abcam ab10131). 48 hours before ESC were harvested, 5x10⁶ ESC per plate were seeded into 15cm2 plates. For each 15cm2 plate, cells were washed with room temperature PBS and then crosslinked in 1% formaldehyde on a rocker at room temperature for 10 minutes. Crosslinking was quenched with 250 mM glycine on a rocker at room temperature for 5 minutes. The cells were washed three times with ice-cold PBS, harvested by scraping, and centrifuged at 1000g for 5 minutes at 4C. The cell pellets were washed with ice-cold PBS, aliquoted, and re-pelleted. Aliquots were flash frozen in liquid nitrogen and stored at −80C.
Pellets were thawed on ice and resuspended in 450 ml of ChIP lysis buffer (1% SDS, 10 mM EDTA, 50 mM Tris-HCL pH 7.5) supplemented with 1x cOmplete Protease Inhibitors (MilliporeSigma 11836153001) and 1x Halt Phosphatase Inhibitors (ThermoFisher 78420) and lysed for 10 min at room temperature. Pellets were diluted in 4.05 mL of ChIP Dilution Buffer (1% TritonX-100, 2 mM EDTA, 150 mM NaCl, 20 mM Tris-HCl pH 7.5) supplemented with 1x cOmplete Protease Inhibitors, 1x Halt Phosphatase Inhibitors, and 3 mM CaCl2 and then aliquoted into 6 tubes. Each tube was pre-warmed at 37C for 2 min. Two units of MNase were added per tube and samples were digested 37C with rotation for 3, 5, or 7 minutes (2 tubes per duration). The digestion reaction was quenched by the addition of 15 μl 500 mM EDTA and 30 μl 500 mM EGTA per tube. Samples were sonicated on the Covaris220 evolution sonicator at default settings (peak incident power 140W, duty factor 5%, cycles per burst 200). Samples were combined and cleared by centrifugation (max speed, 4°C, 10 min). 50 uL of the lysate was saved and stored at −20C as the input sample. The remaining lysate was incubated overnight at 4C with a total of 10ug antibody per pellet. The following day, lysates were incubated with 100 uL Protein G Dynabeads (pre-blocked with BSA protein, 100 ng per 10 uL Dynabeads) for 2 hours at 4C. The beads were immobilized on a magnet and washed twice in low-salt buffer (0.1% SDS, 1% Triton X-100, 2 mM EDTA, 150 mM NaCl and 20 mM Tris pH 8), twice in high-salt buffer (0.1% SDS, 1% Triton X-100, 2 mM EDTA, 500 mM NaCl and 20 mM Tris pH 8), twice in LiCl buffer (0.25 M LiCl, 1% NP-40, 1% deoxycholic acid (sodium salt), 1 mM EDTA and 10 mM Tris pH 8) and once in TE buffer with 50 mM NaCl. The DNA was then eluted from the beads by incubating with 200 uL extraction buffer. The saved input samples were thawed, and an equal volume of extraction buffer was added. All samples were incubated at 1000rpm at 65C overnight. The following day, an equal volume of TE buffer was added. Cells were treated with RNase cocktail for 30 minutes at 37C, and then 8 uL 2.2M CaCl2 solution and 4ul 20mg/mL proteinase K for 1 hour at 55C. The DNA was purified using a minElute kit (Qiagen). The immunoprecipitated material (6–10 ng) was used for ChIPseq library preparation using the NEB UltraII kit (NEB E7645). The libraries were pair-end sequenced on an Illumina NextSeq500 platform.
Generation of enhancer deletion cell lines
Enhancer deletions were performed in the same clonal cell lines (ie. the same Klf4−/− clone was used for all genetic manipulations). sgRNA were designed using CRISPick and are listed in Table S2. sgRNA were cloned into pB-Cerulean-BsmBI as described above (CRISPRi at specific enhancer loci). mESC were seeded into 6 well plates and 24 hours later transfected with 500ng of pX330 and 500ng each of two pB-Cerulean-BsmBI containing the appropriate gRNAs. 24 hours after transfection, Cerulean+ single cells were sorted per well into 96-well plates, grown to lines, and screened for alteration at the targeted loci by PCR followed by Sanger sequencing. At least three independent cell lines with homozygous deletion of the targeted sequence were further analyzed by RT-qPCR as described above.
Generation of base edit cell lines
Base editing was performed in the same clonal cell lines as enhancer deletions were (ie. the same Klf4−/− clone was used for all genetic manipulations). sgRNA were designed manually by annotating NA and NG protospacer-adjacent motif (PAM) sequences located 11 to 17 base pairs from the nucleotides of interest, because no NGG PAM sequences are available at these genomic loci. The sgRNA were cloned into pB-Cerulean-BsmBI as described above (CRISPRi at specific enhancer loci). ESC were seeded into 6 well plates, and 24 hours later transfected with 1.2 ug pCAG-CBE4max-SpRY-P2A-EGFP (Addgene #139999) and 300 ng of pB-Cerulean-BsmBI containing the appropriate sgRNA. Cells were harvested for FACS 24 to 48 hours after transfection, and Cerulean+ cells were sorted, replated, and genotyped for base editing at the targeted loci by PCR and Sanger sequencing. Bulk ESC populations showed a variable editing success rate, ranging from approximately 20 to 80% depending on genotype and targeted site. Single clones were isolated from these bulk ESC populations, grown into lines, and screened for base editing by PCR and Sanger sequencing. At least three independent cell lines with homozygous C>T conversion at the sites of interest were further analyzed by RT-qPCR as described above.
Immunofluorescence
V6.5 ESC were stained for Klf4 and Zfp281 in the following manner. Anti-Klf4 was conjugated with Alexa Flour 488 using Alexa Fluor Antibody Labeling Kit and following manufacturer’s instructions (Thermo Fisher A20181). 50 uL of 1mg/mL anti-Klf4 (abcam ab129473) was used for conjugation. Unconjugated anti-Zfp281 (abcam ab101318) was used.
Cells were plated onto gelatinized, glass coverslips at least 1 day prior to fixation. Cells were fixed with 4% paraformaldehyde for 20 minutes at room temperature, washed three times with PBS, and permeabilized and blocked with 0.3% Triton X-100 in 0.1M glycine and 1% rabbit serum (Jackson ImmunoResearch 011–000-120) for 30 minutes, and washed three times with PBS. Cells were stained overnight at 4C with anti-Zfp281 primary antibody (1:1000) in 1% BSA and 1% rabbit serum in PBST (0.1% Tween 20 in 1xPBS). The next day, cells were washed three times with PBS and incubated with goat anti-rabbit Alexa Flour 657 (1:1000, Thermo A-21245) in 1% BSA in PBST for 2 hours in the dark at room temperature. Cells were washed three times with PBS, and then incubated with 10% rabbit serum in 1% BSA in PBST for 1 hour in the dark at room temperature to saturate anti-rabbit binding sites. Next, cells were stained with Klf4*488 (1:250) in 1% BSA and 1% rabbit serum in PBST overnight at 4C. The next day, cells were washed three times with PBS and incubated with 0.5ug/mL DAPI for 5 minutes in the dark at room temperature. Coverslips were washed three times with PBS and mounted with Vectashield with DAPI (Vector H-1200–10). All images were taken with Widefield fluorescence using a Andor Clara DR-2454 camera with 1000 ms exposure time. Fluor 488 was imaged at an excitation of 465–495 nm and emission of 515–555 nm. Alexa Fluor 657 was imaged at an excitation of 625–650 nm and emission peak of 670 nm.
Single-cell RNA sequencing sample preparation
Single-cell suspensions were made from two biological replicates per Klf4−/−, Zfp281−/−, and WT genotypes. The cells were harvested with 0.25% trypsin followed by inactivation in complete medium, pelleted, resuspended in DMEM with 10% FBS to a concentration of 1–2 x 10⁵ cells per mL, and filtered through a 35μM cell strainer.
Single-cell isolation and library preparation was done using a 10x Genomics Chromium machine in 3’ RNA digital gene expression mode by the MIT BioMicro Center. Sequencing was performed using Illumina NovaSeq6000 S4, yielding a mean sequencing depth of 13,319 paired-end reads per cell.
CUT&RUN
CUT&RUN was performed using CUTANA ChIC/CUT&Run Kit (Epicypher 14–1048) following manufacturer’s instruction in User Manual Version 2.1 or User Manual Version 3. Three technical replicates per antibody were performed. For unsorted, bulk samples, 5x10⁵ cells per replicate were harvested using versene (Thermo Fisher 15040066). For sorted state populations, cells were harvested using versene, and 8x10⁵ cells per replicate were isolated by flow cytometry. Harvested cells were permeabilized using 0.005% digitonin. Additionally, 1 ug of antibody per sample was added (Klf4 Abcam ab12947, Zfp281 Abcam ab10131), with H3K4me3 and Rabbit IgG antibodies (CUTANA 13–0041, 13–0042) used as the positive and negative controls, respectively. E.coli spike-in DNA was also added to each sample. For CUT&RUN qPCR, the resulting CUT&RUN DNA was quantified by Qubit and 0.11ng DNA was used per qPCR reaction. The percent input was calculated as 2ΔCT[input] – ΔCT[sample]. For CUT&RUN followed by sequencing, library preparation using the NEB UltraII kit (NEB E7645) was performed on equal amount per replicate of the resulting CUT&RUN DNA.
Repopulation experiment
For each genotype, 150,000 cells from each state were sorted per replicate on a BD FACSAria. Three biological replicates were performed. The sorted populations were replated and analyzed every 2 days for 8 days on a BD LSR II. The results were analyzed using FlowJo as described above (Single cell cloning by FACS).
Quantification and statistical analysis
All replicate experiments were conducted using a minimum of two biological replicates per condition. Statistical tests were performed after confirming that the data met appropriate assumptions (ex. Normal distribution) and two-tailed. P-values were calculated and adjusted for multiple hypothesis testing where indicated. Statistical significance is indicated as *p < 0.05, ** p < 0.01, *** p < 0.001.
Scripts used to analyze data in this study are publicly available at https://github.com/SGarg-Lab/DATE-scripts, with specific scripts referenced in the relevant sections.
Identification and analysis of differentially active and transcribed enhancers (DATEs)
Raw reads were processed, demultiplexed, and aligned (mPROseq.sh). Fastq files were converted to fasta format using the fastq_to_fasta command with parameter -n (fastxtoolkit v.0.0.13). Adapter sequence was removed using fastx_clipper with parameters -n -a ATCTCGTATGCCGTCTTCTGCTTG -l 14. PCR duplicates were removed using fastx_collapser with default parameters. The 6bp unique molecular identifier (UMI) was removed using fastx_trimmer (-f 7). Then, libraries were demultiplexed using fastx_barcode_splitter with parameters --mismatches 3 –partial 2. Library barcodes were trimmed using fastx_trimmer (-f 10). The reverse complement of trimmed sequences were obtained using fastx_reverse_complement and aligned to the mm10 reference genome using Bowtie2 with parameter --sensitive-local -f. Bam files were converted to bed file using bedtools (v.2.29.2) bamtobed with default parameters, which were split by strand and converted to bedgraph format by strand using bedtools genomecov with parameters −3 -bg. Bedgraph files for each strand were converted to bigWig format using bedGraphToBigWig from UCSC Genome Browser Utilities.
The R package dREG (v.1.4.0) (Danko et al., 2015) was used to identify enhancer regions in mPROseq data. For each sample, separate bigwig files representing each strand were inputted, and transcriptional regulatory elements were identified using the peak calling dREG function (run_dREG.bsh) and a pre-trained dREG model (Wang et al., 2018), obtained from https://cbsuftp.tc.cornell.edu/danko/hub/dreg.models/asvm.gdm.6.6M.20170828.rdata). Genomic regions called by dREG were filtered against gene bodies and a 2kb window around transcriptional start sites (TSS) of annotated genes.
A consensus list of enhancers was generated by merging any overlapping regions using bedtools merge with default parameter -d 0. Reads at enhancers were counted using bedtools intersect (with parameter -c) and aggregated across replicates and inputted into EBseq using rsem (v.1.3.1). Differential expression analysis was performed using the commands rsem-run-ebseq and rsem-control-fdr. Differentially active (DA) enhancers were considered those with FDR < 0.05 and posterior probability of differential expression (PPDE) > 0.95 across subpopulations.
Enhancers were mapped to the most proximal, expressed gene located within the same topologically associated domain (TAD). mm9 locations of TADs in mESC were obtained from (Dowen et al., 2014)and converted to mm10 using the liftOver tool from UCSC Genome Browser Utilities using the chain file mm10ToMm9.over.chain.gz (downloaded from http://hgdownload.cse.ucsc.edu/goldenPath/mm10/liftOver/). Protein-coding genes expressed in mESC were obtained from (Chakraborty et al., 2020). Genes and enhancers were assigned to the encompassing TAD using bedtools intersect with parameters -wa -wb. The expressed protein-coding genes closest to enhancers was identified using bedtools closest with parameters -wa -wb, and these genes were considered the target of the enhancer if the gene and enhancer shared the same TAD. Out of 7,228 enhancers, 4,582 enhancers were successfully mapped to genes within the same TAD. The remaining 2,686 enhancers could not be mapped to a gene within the same TAD and were mapped to the most proximal, expressed gene. Overall, enhancers were mapped to a total of 3,954 unique genes.
Coefficient of variation calculation
The coefficient of variation (CV) was calculated as the standard deviation divided by the mean of the gene expression levels. Gene expression was quantified by bulk RNA sequencing from Chakraborty et al. 2020 in Fig. 2D or by RT-qPCR in Fig. 5D and S7D). An example calculation for Fig. 5D is:
CV was independently calculated for each replicate, and the average CV value were shown in Fig. 5D and S7D. Permutation analysis was conducted to assess the significance of the difference in cumulative distribution fraction of the CV values of DATE gene targets compared to SATE gene targets, and an empirical p-value was calculated as the number of permutation trials meeting or exceeding the F-statistic for the measured data (p = 0.012, 9e-3, and 1e-4 for States 1, 2, and 3, respectively, for 1,000 trials).
CRISPRi screen analysis
Raw reads were processed using the fastxtoolkit. Sequences were clipped for adapter sequence using the fastx_clipper function, trimmed for read quality using the fastq_quality_filter function (-q28 -p 85), and then demultiplexed using fastx_barcode_splitter (--mismatches 2 --partial 1). sgRNA counts were determined using the MAGeCK (v0.5.9.4) mle command (--norm-method control --remove-zero both). 23,509 of all targeting sgRNAs (65.3%, or an average of 3.3 sgRNA per enhancer) were detected in all four unsorted replicates and had over 100 total counts across all samples and further analyzed. Correlation between replicates was assessed using the Spearman coefficient, which ranged from 0.3 to 0.5. sgRNA enrichment was calculated as the log2 fold change in normalized sgRNA count, averaged across replicates, between Nanoghigh and Nanoglow populations (Table S3, analyze_screen.R). The top and bottom 150 sgRNA (approximately 2.5 standard deviations from mean) were identified as screen hits. To confirm differences in variance between targeting and non-targeting sgRNA, we downsampled the counts of non-targeting controls to match the average counts per targeting guide for each replicate (Fig. S4). We generated quantile-quantile plots to confirm differences in effect size range between targeting and non-targeting sgRNA.
TF binding at DATEs analysis
Existing ChIPseq datasets were systematically analyzed in the following manner (compileChIPseq.sh). Fastq files were downloaded from the Gene Expression Omnibus (GEO accession numbers listed in Table S4). ChIPseq reads were aligned to the mm10 reference genome using bowtie2 (v2.3.5.1) with default parameters (Langmead and Salzberg, 2012). ChIPseq peaks were called using the callpeak function in MACS2 (v.2.2.7.1) with default parameters (Zhang et al., 2008). Peak calling was performed with genomic input control used as background, as indicated in Table S4. Peak calling was performed with biological replicates when available. Studies with over 1,000 called peaks were further analyzed to compare factors with relatively similar numbers of binding sites.
Overlap between TF binding sites was calculated between pair-wise combinations of TFs in the following method (compute_overlap.sh, format_overlap.ipynb). Peaks called by macs2 were extended by a 500bp window using the window command in bedtools (v2.29.2). Peaks of TF1 that overlap with peaks of TF2 were identified using bedtools intersect. The Jaccard index for TF1 is calculated as (the number of TF1 peaks that have any overlap with TF2 peaks) / (the total number of TF1 peaks + the total number of TF2 peaks - the number of TF1 peaks that have any overlap with TF2 peaks). The Jaccard index for TF2 is calculated as (the number of TF2 peaks that have any overlap with TF1 peaks) / (the total number of TF1 peaks + the total number of TF2 peaks - the number of TF2 peaks that have any overlap with TF1 peaks). Note that because several TF2 peaks can overlap a single TF1 peak and vice versa, this index can be asymmetric with respect to TF1 and TF2 (Fig. S5A). When analyzing TF binding overlap at DATEs, peaks of TF1, peaks of TF2, and their overlap was further subsetted to regions that overlap DATEs using bedtools intersect. The overlap index is then calculated as (the number of DATEs that are overlap with both TF1 peaks and TF2 peaks) / (the total number of DATEs that overlap either TF1 peaks and TF2 peaks) (Fig. 3A).
Motif analysis
TF motif enrichment analysis was performed using HOMER (v.4.10). A fasta file containing the sequences of regions of interest was obtained using bedtools getfasta and compared to a background of scrambled sequences, obtained using scrambleFasta.pl. The FindMotifs.pl function was used to identify motifs in the HOMER motif database that are enriched in the regions of interest (Table S5).
The distance between transcription factor motifs was calculated as the Kullback-Leibler divergence (pwm_analysis.R). Position weight matrices (PWM) representing the motifs of transcription factors analyzed in mESC were obtained from the HOMER motif database. PWMs for the reverse complement of each motif was calculated using the motif_rc() function in the R package universalmotif (v1.14.0). For each pair-wise combination of TFs, four Kullback-Leibler divergence values were calculated using the PWMSimilarity() function in the R package TFBSTools (v1.10.3): between PWMs of TF1 and TF2, between PWMs of TF1 reverse complement and TF2, between PWMs of TF1 and TF2 reverse complement, and between PWMs of TF1 reverse complement and TF2 reverse complement. The lowest of the four Kullback-Leibler divergence values was used.
ATACseq analysis
Raw ATACseq reads was processed (ATACseq.sh), and differentially accessible ATAC regions were identified (ATACseq_DA.R). ATACseq reads were trimmed for adapter sequences using TrimGalore (v.0.6.5) (--paired --nextera). Paired-end reads were aligned to the mm10 reference genome using Bowtie2 (--very-sensitive -k 10) and filtered for autosomal, properly-paired, mapped read pairs with mapping quality >= 30 using samtools view (-b -h -f 3 -F 4 -F 8 -F 256 -F 1024 -F 2048 -q 30). Peak calling was performed separately for each sample using Genrich (-a 10 -j -r -e chrM,chrY), excluding ENCODE blacklisted regions (ENCFF547MET.bed, downloaded from https://www.encodeproject.org/files/ENCFF547MET/). Peaks called in each sample were collated, and overlapping peaks were merged to generate a consensus list of peaks using bedtools merge.
Reads at each of the merged list of peaks were counted in each sample using the regionCounts() function in the R package csaw (v.1.18.0), and read counts were normalized using the calcNormFactors() function using default parameters in edgeR (v.3.26.8). Differential accessibility analysis was performed using limma (v.3.40.6). A design matrix comparing genotype (Klf4−/−, Zfp281−/−, and WT) was used. The voom() function with default parameters was used to remove heteroscedasticity by modelling the mean-variance relationship of log2 counts per million (CPM) values and calculating observation-level weights for linear modelling. The lmFit() and contrast.fit() functions were used to perform linear modelling against the following contrasts: Klf4−/− vs. WT, Zfp281−/− vs. WT, Klf4−/− vs. Zfp281−/−. Empirical Bayes smoothing of gene-wise standard deviations was performed using the eBayes() function. Peaks that are differentially accessible between Klf4−/− and Zfp281−/− were identified using the threshold of Benjamani-Hochberg adjusted p-value < 0.05.
RNAseq analysis
Raw RNAseq reads were processed (RNAseq.sh), and differentially expressed genes were identified (RNAseq_DE.R). RNAseq reads were trimmed for adapter sequences using TrimGalore (-- paired --illumina --length 20). Sequences were trimmed for read quality using fastq_quality_filter in fastxtoolkit (-Q33 -q 30 -p 90). Paired-end reads were aligned to the mm10 reference genome using hisat2 (--rna-strandness FR). Aligned reads were counted to GENCODE vM15 genomic transcripts using featureCounts (v1.6.2) in the subread package using default parameters. Read counts were normalized by weighted trimmed mean of M-values (TMM) using the calcNormFactors() function in edgeR (method = ‘TMM’). Lowly expressed genes were the filtered using filterByExpr() function, which removes genes with fewer than 10 read counts across samples of the same genotype. Differential expression analysis was performed as above for differential accessibility analysis using limma. Genes that are differentially expressed between Klf4−/− and Zfp281−/− were identified using the threshold of Benjamini-Hochberg adjusted p-value < 0.05.
ChIPseq analysis
Raw ChIPseq reads were processed (ChIPseq.sh). ChIPseq reads were aligned to the mm10 reference genome using BWA-MEM (v.0.7.16a) with default parameters (Li, 2013). Additionally, reads per genomic content (RPGC)-normalized bigWig files were generated for each IP using the bamCoverage function in the deeptools package (v.3.0.1) with parameters --normalizeUsing RPGC -- effectiveGenomeSize 2652783500 --centerReads --extendReads 150. Background signal was subtracted from each sample ChIP using the bigwigCompare function with the parameter –operation subtract (ex. Klf4 ChIP signal in Klf4−/− cells was subtracted from Klf4 ChIP signal in WT cells and from Klf4 ChIP signal in Zfp281−/− cells). ChIP peaks were called using Genrich with the parameters -y -a 1 -e chrM,chrY and excluding reads from ENCODE blacklisted regions. Peaks within 500bp were considered overlapping (Fig. S6J).
CUT&RUN analysis
Raw CUT&RUN reads were processed. CUT&RUN reads were trimmed using cutadapt (v1.16) (-m 10 -q 10). Paired-end reads were aligned to the mm10 reference genome and the E.coli MG1655 using bowtie2 with default parameters. The normalization factor for each replicate was calculated as . Normalized bigWig files were generated for each replicate using the bamCoverage function in the deeptools package by inputting the normalization factor as the -- scaleFactor parameter. Replicates were further normalized to IgG negative control using the bigwigCompare function with the parameter --operation log.
Immunofluoresence quantification
Thresholding and adjustment for brightness and contrast was performed for all quantified images together using ImageJ (v2.3.0). Cell boundaries were automatically generated based on DAPI signal using the watershed function and then manually verified. Klf4, Zfp281 co-stained images were matched to corresponding no Klf4 staining and no Zfp281 staining images. The raw signal intensity of each cell was normalized as and this value is reported as normalized factor signal intensity (arbitrary units) in Fig. S8A.
Single-cell RNA sequencing analysis
Cellranger (v.3.1.0) mkfastq and count pipelines were used for: demultiplexing, converting to fastq format, combining sequencing results, alignment to GRCm38 (mm10) genome assembly and gene annotation, barcode processing, and UMI counting.
Analysis of scRNAseq data was performed in the following manner (scRNAseq.R). Filtering, normalization, and dimensionality reduction were performed using the R package Seurat (v.4.1.0) (Hafemeister and Satija, 2019). To exclude low-quality cells and possible doublets, cells with fewer than 1,000 and more than 5,000 detected genes were removed. Additionally, cells with more than 10% of transcripts from mitochondrial genes were removed. Following quality control, 19545 Klf4−/− cells, 16141 WT cells, and 41754 Zfp281−/− cells were analyzed. Cells were scored for expression of S and G2/M markers from (Kowalczyk et al., 2015). SCTransform normalization was applied, which calculates Pearson residuals per gene per cell from a regularized negative binomial regression model of technical noise in scRNAseq data. The residuals were scaled to regress out percent of reads mapped to mitochondrial genes and cell cycle phase score. The RunUMAP() function was used to perform Uniform Manifold Approximation (UMAP) to reduce the dimensionality of the dataset and visualize the cells in 2D space (dims.use = 1:30).
Monocle (v.2.22.0) (Trapnell et al., 2014) was run on the log-normalized, corrected UMI counts. For trajectory analysis, to equalize the number of cells per genotype, 10,000 cells from each genotype were randomly selected and further analyzed. Trajectory results were replicated across three different trials of random cell selection. The top 3000 variable genes were used to cluster cells using the reduceDimension() function (method = ‘DDRTRee’, norm_method = ‘none’). Cells were ordered from an arbitrarily-selected root state using the orderCells() function.
Each single-cell transcriptional profile was assigned gene expression signature scores using the following method. For each cell, a score was calculated by summing the normalized counts for all genes of a specific program and then scaling the sum for each cell from 0 to 1. To calculate State 1, 2, and 3 scores, the gene programs were defined as the top 200 expressed, genes in each state unique to that state (non-overlapping lists). To calculate Klf4 and Zfp281 scores, the gene programs used were defined as the genes whose transcriptional start sites (TSS) are bound by the factor, as measured by ChIPseq in Fig. 3C, and whose expression decreases upon the factor’s knockout, as measured by RNAseq in Fig. 4. The Klf4:Zfp281 gene target score was calculated as log2(Klf4 score / Zfp281 score). The proportion of Klf4−/−, Zfp281−/−, and WT cells and Klf4:Zfp281 gene target score along each branch was calculated as a rolling mean across 500 cells. Scores visualized on UMAP and trajectory plots are scaled so the minimum value plotted is the 1st percentile and maximum value plotted is the 99th percentile of the overall range to minimize the visual effect of outlier cells. The top 200 genes expressed in each state were obtained from bulk steady-state RNAseq performed in each state, as performed in (Chakraborty et al., 2020).
Stochastic 3-state modeling
To capture the dynamic transitions between different cell states, we consider the following ordinary differential equation (ODE) model:
where xi is the fraction of cells in state i ∈ {1,2,3} and kij is the rate of transition from state i to j. To estimate these six different state-transition rates, we fit the ODE model to data from the repopulation experiments (Fig. 7B), where cells are first enriched to be in a specific state, and then the dynamical relaxation of states back to their steady-state levels is measured over time.
Since we observed that State 2 WT cells repopulate slower than State 1 and State 3, we first fit the model to data from States 1 and 3 sorted populations. Our fitting procedure solves the ODE using the enrichment levels measured just after sorting as initial conditions, and the rates are estimated by minimizing the least square error between the model prediction and data at subsequent timepoints. The optimization is done with the Solver toolbox in Microsoft Excel using the Generalized Reduced Gradient (GRC) solving method. This results in the following estimates:
| (1) |
Next, we investigated the most parsimonious change in these parameters that would explain the stickiness observed in the State 2 enriched population. To do this, we fit the model to the State 2 sorted data to estimate the six rates, and then only considered an order-of-magnitude change in a parameter with respect to (1) as significant. The model is then refitted to data by only changing these significant parameters, while other parameters are maintained as in (1). This analysis reveals that a change in just a single parameter, an increased state 1 to 2 transition rate k12 = 0.28 day−1 (from k12 = 0.03 day−1), is sufficient to explain the slower rate of repopulation in State 2.
Next, we investigated the most parsimonious changes in these parameters to fit the model to the relaxation kinetics of State 1 & 3 sorted populations for Klf4−/−. We found this required a parsimonious change in just two parameters: increased k12 = 0.13 day−1 and decreased k31 = 0.06 day−1 with respect to (1).
Finally, we investigated the most parsimonious changes in these parameters to fit the model to the relaxation kinetics of Zfp281−/−. We found ithat a change in a single parameter, a strong destabilization of state 2 with an increased k21 = 0.5 day−1 (from k12 = 0.08 day−1 in WT), is sufficient to explain the relaxation kinetics of all sorted populations observed in Zfp281−/−.
Gene ontology
Gene ontology (GO) analysis was performed using the web interface for Database for Annotation, Visualization, and Integrated Discovery (DAVID, v.6.8). The Functional Annotation tool was used to identify biological process GO terms (GOTERM_BP_DIRECT) that are enriched in the queried gene list. Selected GO terms with Benjamini-Hochberg adjusted p-value < 0.05 were plotted.
Gene set enrichment analysis (GSEA)
Gene set enrichment analysis (GSEA for Linux, v.4.0.03) was performed using the GSEAPreranked operation with MSigDB gene sets (msigdb.v.7.1.symbols.gmt, downloaded from https://data.broadinstitute.org/gsea-msigdb/msigdb/release/7.1/). Mouse gene symbols were remapped to human orthologs using Mouse_Gene_Symbol_Remapping_to_Human_Orthologs_MSigDB.v7.1.chip (downloaded from https://data.broadinstitute.org/gsea-msigdb/msigdb/annotations_versioned/). Genes were ranked by decreasing expression level in Klf4−/− or Zfp281−/− samples and inputted (-collapse true - set_min 15 -set_max 1500 -nperm 1000). Selected enriched gene sets with FDR < 0.05 and with differential enrichment between Klf4−/−and Zfp281−/− samples were plotted (Fig. S6G).
Data visualization
Reads per genomic content (RPGC)-normalized bigWig files were generated from ChIPseq, ATACseq, and RNAseq bam files using the BamCoverage function in the deeptools package (v.3.0.1) with parameters --normalizeUsing RPGC --effectiveGenomeSize 2652783500 --centerReads. For mPROseq and ChIPseq data, the parameter --extendReads 150 was also used. RPGC-normalized mPROseq, ChIPseq, ATACseq, and RNAseq tracks at specific loci were visualized using Integrative Genomics Viewer (IGV, Broad Institute).
RPGC-normalized mPROseq, ATACseq, ChIPseq, and CUT&RUN signal was calculated in regions ±1.5kb centered at the enhancer using the computeMatrix function in the deeptools package (reference-point --referencePoint center -a 1500, -b 1500 --binSize 10). Heatmaps and profiles of the signal were visualized using plotHeatmap and plotProfile functions respectively using default parameters (Fig. 1F, 3C, 4C, 4E, 4F, S2B). Custom R code (plot_profile.R) was used to generate profiles of mean signal from different samples at the same set of regions (Fig. 4F, S6E, S6H). The mean signal is plotted with a loess smooth function.
Schematics in Fig. 2C, 2E, and 4F were created with BioRender.com.
Supplementary Material
Table S1: mPROseq enhancers, related to Figure 1.
Coordinates and putative gene targets of 7,228 mPROseq-defined enhancers, including 689 DATEs.
Table S2: Oligonucleotide sequences, related to Figures 1 and 2.
Oligonucleotide sequences for oligonucleotides and sgRNAs used in this study
Table S3: CRISPRi screen results, related to Figure 2.
sgRNA enrichment in Nanoglow and Nanoghigh subpopulations
Table S4: ChIPseq dataset information, related to Figure 3.
GEO Accession numbers for datasets used in this study for analysis of TF binding at DATEs
Table S5: Transcription factor binding and motif analysis at DATEs, related to Figure 3.
Enriched transcription factor binding motif sequences and overlap of transcription factor binding at DATEs
Highlights.
Enhancers are differentially active and transcribed (DATEs) in stem cell states.
Klf4 and Zfp281 share overlapping binding sites while exert opposing effects at DATEs.
Loss of Klf4 and Zfp281 binding at DATEs decreases variation in gene expression.
Acknowledgments
We thank the Koch Institute’s Robert A. Swanson (1969) Biotechnology Center for technical support, particularly the Flow Cytometry and Integrated Genomics and Bioinformatics core facilities. This work was funded by NCI F30 CA260739 (SH), NIGMS T32 GM007753 and GM144273 (SH), NCI P01 CA042063 (JA, PAS), NCI K08 CA237856 (SG), a Koch Institute Charles W. and Jennifer C. Johnson Clinical Investigator Award (SG), and the Koch Institute Support (core) Grant NCI P30-CA14051.
Footnotes
Publisher's Disclaimer: This is a PDF file of an unedited manuscript that has been accepted for publication. As a service to our customers we are providing this early version of the manuscript. The manuscript will undergo copyediting, typesetting, and review of the resulting proof before it is published in its final form. Please note that during the production process errors may be discovered which could affect the content, and all legal disclaimers that apply to the journal pertain.
Declaration of interests
Authors declare that they have no competing interests.
Inclusion and Diversity
We support inclusive, diverse, and equitable conduct of research.
References
- Abranches E, Guedes AMV, Moravec M, Maamar H, Svoboda P, Raj A, and Henrique D (2014). Stochastic NANOG fluctuations allow mouse embryonic stem cells to explore pluripotency. Development 141, 2770–2779. 10.1242/dev.108910. [DOI] [PMC free article] [PubMed] [Google Scholar]
- Acampora D, Omodei D, Petrosino G, Garofalo A, Savarese M, Nigro V, di Giovannantonio LG, Mercadante V, and Simeone A (2016). Loss of the Otx2-Binding Site in the Nanog Promoter Affects the Integrity of Embryonic Stem Cell Subtypes and Specification of Inner Cell Mass-Derived Epiblast. Cell Rep 15, 2651–2664. 10.1016/j.celrep.2016.05.041. [DOI] [PubMed] [Google Scholar]
- Acampora D, Giovanni Di Giovannantonio L, Garofalo A, Nigro V, Omodei D, Lombardi A, Zhang J, Chambers I, and Simeone A (2017). Functional Antagonism between OTX2 and NANOG Specifies a Spectrum of Heterogeneous Identities in Embryonic Stem Cells. Stem Cell Reports 9, 1642–1659. 10.1016/j.stemcr.2017.09.019. [DOI] [PMC free article] [PubMed] [Google Scholar]
- Aksoy I, Giudice V, Delahaye E, Wianny F, Aubry M, Mure M, Chen J, Jauch R, Bogu GK, Nolden T, et al. (2014). Klf4 and Klf5 differentially inhibit mesoderm and endoderm differentiation in embryonic stem cells. Nat Commun 5, 3719. 10.1038/ncomms4719. [DOI] [PubMed] [Google Scholar]
- Andersson R, and Sandelin A (2020). Determinants of enhancer and promoter activities of regulatory elements. Nat Rev Genet 21, 71–87. 10.1038/s41576-019-0173-8. [DOI] [PubMed] [Google Scholar]
- Arinobu Y, Mizuno S. ichi, Chong Y, Shigematsu H, Iino T, Iwasaki H, Graf T, Mayfield R, Chan S, Kastner P, et al. (2007). Reciprocal Activation of GATA-1 and PU.1 Marks Initial Specification of Hematopoietic Stem Cells into Myeloerythroid and Myelolymphoid Lineages. Cell Stem Cell 1, 416–427. 10.1016/j.stem.2007.07.004. [DOI] [PubMed] [Google Scholar]
- Boyer LA, Tong IL, Cole MF, Johnstone SE, Levine SS, Zucker JP, Guenther MG, Kumar RM, Murray HL, Jenner RG, et al. (2005). Core transcriptional regulatory circuitry in human embryonic stem cells. Cell 122, 947–956. 10.1016/j.cell.2005.08.020. [DOI] [PMC free article] [PubMed] [Google Scholar]
- Buenrostro JD, Giresi PG, Zaba LC, Chang HY, and Greenleaf WJ (2013). Transposition of native chromatin for fast and sensitive epigenomic profiling of open chromatin, DNA-binding proteins and nucleosome position. Nat Methods 10, 1213–1218. 10.1038/nmeth.2688. [DOI] [PMC free article] [PubMed] [Google Scholar]
- Buenrostro JD, Wu B, Chang HY, and Greenleaf WJ (2015). ATAC‐seq: A Method for Assaying Chromatin Accessibility Genome‐Wide. Curr Protoc Mol Biol 109, 21.29.1–21.29.9. 10.1002/0471142727.mb2129s109. [DOI] [PMC free article] [PubMed] [Google Scholar]
- Burda P, Laslo P, and Stopka T (2010). The role of PU.1 and GATA-1 transcription factors during normal and leukemogenic hematopoiesis. Leukemia 24, 1249–1257. 10.1038/leu.2010.104. [DOI] [PubMed] [Google Scholar]
- Chakraborty M, Hu S, Visness E, Giudice MD, de Martino A, Bosia C, Sharp PA, and Garg S (2020). MicroRNAs organize intrinsic variation into stem cell states. Proc Natl Acad Sci 117, 6942–6950. 10.1073/pnas.1920695117. [DOI] [PMC free article] [PubMed] [Google Scholar]
- Chambers I, Silva J, Colby D, Nichols J, Nijmeijer B, Robertson M, Vrana J, Jones K, Grotewold L, and Smith A (2007). Nanog safeguards pluripotency and mediates germline development. Nature 450, 1230–1234. 10.1038/nature06403. [DOI] [PubMed] [Google Scholar]
- Chen Q, Shi J, Tao Y, and Zernicka-Goetz M (2018). Tracing the origin of heterogeneity and symmetry breaking in the early mammalian embryo. Nat Commun 9, 1819. 10.1038/S41467-018-04155-2. [DOI] [PMC free article] [PubMed] [Google Scholar]
- Chen X, Xu H, Yuan P, Fang F, Huss M, Vega VB, Wong E, Orlov YL, Zhang W, Jiang J, et al. (2008). Integration of External Signaling Pathways with the Core Transcriptional Network in Embryonic Stem Cells. Cell 133, 1106–1117. 10.1016/j.cell.2008.04.043. [DOI] [PubMed] [Google Scholar]
- Core LJ, Martins AL, Danko CG, Waters CT, Siepel A, and Lis JT (2014). Analysis of nascent RNA identifies a unified architecture of initiation regions at mammalian promoters and enhancers. Nat Genet 46, 1311–1320. 10.1038/ng.3142. [DOI] [PMC free article] [PubMed] [Google Scholar]
- Creyghton MP, Cheng AW, Welstead GG, Kooistra T, Carey BW, Steine EJ, Hanna J, Lodato MA, Frampton GM, Sharp PA, et al. (2010). Histone H3K27ac separates active from poised enhancers and predicts developmental state. Proc Natl Acad Sci 107, 21931–21936. 10.1073/pnas.1016071107. [DOI] [PMC free article] [PubMed] [Google Scholar]
- Danko CG, Hyland SL, Core LJ, Martins AL, Waters CT, Lee HW, Cheung VG, Kraus WL, Lis JT, and Siepel A (2015). Identification of active transcriptional regulatory elements from GRO-seq data. Nat Methods 12, 433–438. 10.1038/nmeth.3329. [DOI] [PMC free article] [PubMed] [Google Scholar]
- Dowen JM, Fan ZP, Hnisz D, Ren G, Abraham BJ, Zhang LN, Weintraub AS, Schuijers J, Lee TI, Zhao K, et al. (2014). Control of cell identity genes occurs in insulated neighborhoods in mammalian chromosomes. Cell 159, 374–387. 10.1016/j.cell.2014.09.030. [DOI] [PMC free article] [PubMed] [Google Scholar]
- Eldar A, and Elowitz MB (2010). Functional roles for noise in genetic circuits. Nature 467, 167–173. 10.1038/nature09326. [DOI] [PMC free article] [PubMed] [Google Scholar]
- Fidalgo M, Faiola F, Pereira CF, Ding J, Saunders A, Gingold J, Schaniel C, Lemischka IR, Silva JCR, and Wang J (2012). Zfp281 mediates Nanog autorepression through recruitment of the NuRD complex and inhibits somatic cell reprogramming. Proc Natl Acad Sci 109, 16202–16207. 10.1073/pnas.1208533109. [DOI] [PMC free article] [PubMed] [Google Scholar]
- Fidalgo M, Huang X, Guallar D, Sanchez-Priego C, Valdes VJ, Saunders A, Ding J, Wu WS, Clavel C, and Wang J (2016). Zfp281 Coordinates Opposing Functions of Tet1 and Tet2 in Pluripotent States. Cell Stem Cell 19, 355–369. 10.1016/j.stem.2016.05.025. [DOI] [PMC free article] [PubMed] [Google Scholar]
- Filipczyk A, Marr C, Hastreiter S, Feigelman J, Schwarzfischer M, Hoppe PS, Loeffler D, Kokkaliaris KD, Endele M, Schauberger B, et al. (2015). Network plasticity of pluripotency transcription factors in embryonic stem cells. Nat Cell Biol 17, 1235–1246. 10.1038/ncb3237. [DOI] [PubMed] [Google Scholar]
- Fiorentino J, Torres-Padilla ME, and Scialdone A (2020). Measuring and Modeling Single-Cell Heterogeneity and Fate Decision in Mouse Embryos. Annu Rev Genet 54, 167–187. 10.1146/annurev-genet-021920-110200. [DOI] [PubMed] [Google Scholar]
- Fukaya T, Lim B, and Levine M (2016). Enhancer Control of Transcriptional Bursting. Cell 166, 358–368. 10.1016/j.cell.2016.05.025. [DOI] [PMC free article] [PubMed] [Google Scholar]
- di Giammartino DC, Kloetgen A, Polyzos A, Liu Y, Kim D, Murphy D, Abuhashem A, Cavaliere P, Aronson B, Shah V, et al. (2019). KLF4 is involved in the organization and regulation of pluripotency-associated three-dimensional enhancer networks. Nat Cell Biol 21, 1179–1190. 10.1038/s41556-019-0390-6. [DOI] [PMC free article] [PubMed] [Google Scholar]
- Goolam M, Scialdone A, Graham SJL, MacAulay IC, Jedrusik A, Hupalowska A, Voet T, Marioni JC, and Zernicka-Goetz M (2016). Heterogeneity in Oct4 and Sox2 Targets Biases Cell Fate in 4-Cell Mouse Embryos. Cell 165, 61–74. 10.1016/j.cell.2016.01.047. [DOI] [PMC free article] [PubMed] [Google Scholar]
- Graf T, and Stadtfeld M (2008). Heterogeneity of Embryonic and Adult Stem Cells. Cell Stem Cell 3, 480–483. 10.1016/j.stem.2008.10.007. [DOI] [PubMed] [Google Scholar]
- Guo G, Yang J, Nichols J, Hall JS, Eyres I, Mansfield W, and Smith A (2009). Klf4 reverts developmentally programmed restriction of ground state pluripotency. Development 136, 1063–1069. 10.1242/dev.030957. [DOI] [PMC free article] [PubMed] [Google Scholar]
- Hafemeister C, and Satija R (2019). Normalization and variance stabilization of single-cell RNA-seq data using regularized negative binomial regression. Genome Biol 20, 296. 10.1186/s13059-019-1874-1. [DOI] [PMC free article] [PubMed] [Google Scholar]
- Hansen CH, and van Oudenaarden A (2013). Allele-specific detection of single mRNA molecules in situ. Nat Methods 10, 869–871. 10.1038/nmeth.2601. [DOI] [PMC free article] [PubMed] [Google Scholar]
- Hansen MMK, Desai R. v., Simpson ML, and Weinberger LS (2018). Cytoplasmic Amplification of Transcriptional Noise Generates Substantial Cell-to-Cell Variability. Cell Syst 7, 384–397.e6. 10.1016/j.cels.2018.08.002. [DOI] [PMC free article] [PubMed] [Google Scholar]
- Heigwer F, Zhan T, Breinig M, Winter J, Brügemann D, Leible S, and Boutros M (2016). CRISPR library designer (CLD): Software for multispecies design of single guide RNA libraries. Genome Biol 17, 55. 10.1186/s13059-016-0915-2. [DOI] [PMC free article] [PubMed] [Google Scholar]
- Heintzman ND, Hon GC, Hawkins RD, Kheradpour P, Stark A, Harp LF, Ye Z, Lee LK, Stuart RK, Ching CW, et al. (2009). Histone modifications at human enhancers reflect global cell-type-specific gene expression. Nature 459, 108–112. 10.1038/nature07829. [DOI] [PMC free article] [PubMed] [Google Scholar]
- Heinz S, Romanoski CE, Benner C, and Glass CK (2015). The selection and function of cell type-specific enhancers. Nat Rev Mol Cell Biol 16, 144–154. 10.1038/nrm3949. [DOI] [PMC free article] [PubMed] [Google Scholar]
- Henriques T, Scruggs BS, Inouye MO, Muse GW, Williams LH, Burkholder AB, Lavender CA, Fargo DC, and Adelman K (2018). Widespread transcriptional pausing and elongation control at enhancers. Genes Dev 32, 26–41. 10.1101/gad.309351.117. [DOI] [PMC free article] [PubMed] [Google Scholar]
- Hnisz D, Abraham BJ, Lee TI, Lau A, Saint-André V, Sigova AA, Hoke HA, and Young RA (2013). Super-enhancers in the control of cell identity and disease. Cell 155, 934. 10.1016/j.cell.2013.09.053. [DOI] [PMC free article] [PubMed] [Google Scholar]
- Holmes WR, Reyes de Mochel NS, Wang Q, Du H, Peng T, Chiang M, Cinquin O, Cho K, and Nie Q (2017). Gene Expression Noise Enhances Robust Organization of the Early Mammalian Blastocyst. PLoS Comput Biol 13, e1005320. 10.1371/JOURNAL.PCBI.1005320. [DOI] [PMC free article] [PubMed] [Google Scholar]
- Huang S, Guo YP, May G, and Enver T (2007). Bifurcation dynamics in lineage-commitment in bipotent progenitor cells. Dev Biol 305, 695–713. 10.1016/j.ydbio.2007.02.036. [DOI] [PubMed] [Google Scholar]
- Huang X, Balmer S, Yang F, Fidalgo M, Li D, Guallar D, Hadjantonakis AK, and Wang J (2017). Zfp281 is essential for mouse epiblast maturation through transcriptional and epigenetic control of Nodal signaling. Elife 6. 10.7554/eLife.33333. [DOI] [PMC free article] [PubMed] [Google Scholar]
- Ivanova N, Dobrin R, Lu R, Kotenko I, Levorse J, DeCoste C, Schafer X, Lun Y, and Lemischka IR (2006). Dissecting self-renewal in stem cells with RNA interference. Nature 2006 442, 533–538. 10.1038/nature04915. [DOI] [PubMed] [Google Scholar]
- Jeon H, Waku T, Azami T, Khoa LTP, Yanagisawa J, Takahashi S, and Ema M (2016). Comprehensive Identification of Krüppel-Like Factor Family Members Contributing to the Self-Renewal of Mouse Embryonic Stem Cells and Cellular Reprogramming. PLoS One 11. 10.1371/journal.pone.0150715. [DOI] [PMC free article] [PubMed] [Google Scholar]
- Jiang J, Chan YS, Loh YH, Cai J, Tong GQ, Lim CA, Robson P, Zhong S, and Ng HH (2008). A core Klf circuitry regulates self-renewal of embryonic stem cells. Nat Cell Biol 10, 353–360. 10.1038/NCB1698. [DOI] [PubMed] [Google Scholar]
- Kaikkonen MU, and Adelman K (2018). Emerging Roles of Non-Coding RNA Transcription. Trends Biochem Sci 43, 654–667. 10.1016/j.tibs.2018.06.002. [DOI] [PubMed] [Google Scholar]
- Kim J, Chu J, Shen X, Wang J, and Orkin SH (2008a). An extended transcriptional network for pluripotency of embryonic stem cells. Cell 132, 1049–1061. 10.1016/j.cell.2008.02.039. [DOI] [PMC free article] [PubMed] [Google Scholar]
- Kim J, Chu J, Shen X, Wang J, and Orkin SH (2008b). An Extended Transcriptional Network for Pluripotency of Embryonic Stem Cells. Cell 132, 1049–1061. 10.1016/j.cell.2008.02.039. [DOI] [PMC free article] [PubMed] [Google Scholar]
- Klein AM, Mazutis L, Akartuna I, Tallapragada N, Veres A, Li V, Peshkin L, Weitz DA, and Kirschner MW (2015). Droplet barcoding for single-cell transcriptomics applied to embryonic stem cells. Cell 161, 1187–1201. 10.1016/j.cell.2015.04.044. [DOI] [PMC free article] [PubMed] [Google Scholar]
- Koblan LW, Doman JL, Wilson C, Levy JM, Tay T, Newby GA, Maianti JP, Raguram A, and Liu DR (2018). Improving cytidine and adenine base editors by expression optimization and ancestral reconstruction. Nat Biotechnol 36, 843–848. 10.1038/NBT.4172. [DOI] [PMC free article] [PubMed] [Google Scholar]
- Kolodziejczyk AA, Kim JK, Tsang JCH, Ilicic T, Henriksson J, Natarajan KN, Tuck AC, Gao X, Bühler M, Liu P, et al. (2015). Single Cell RNA-Sequencing of Pluripotent States Unlocks Modular Transcriptional Variation. Cell Stem Cell 17, 471–485. 10.1016/j.stem.2015.09.011. [DOI] [PMC free article] [PubMed] [Google Scholar]
- Kowalczyk MS, Tirosh I, Heckl D, Rao TN, Dixit A, Haas BJ, Schneider RK, Wagers AJ, Ebert BL, and Regev A (2015). Single-cell RNA-seq reveals changes in cell cycle and differentiation programs upon aging of hematopoietic stem cells. Genome Res 25, 1860–1872. 10.1101/gr.192237.115. [DOI] [PMC free article] [PubMed] [Google Scholar]
- Kumar RM, Cahan P, Shalek AK, Satija R, Keyser AD, Li H, Zhang J, Pardee K, Gennert D, Trombetta JJ, et al. (2014). Deconstructing transcriptional heterogeneity in pluripotent stem cells. Nature 516, 56–61. 10.1038/nature13920. [DOI] [PMC free article] [PubMed] [Google Scholar]
- Lai F, Damle SS, Ling KK, and Rigo F (2020). Directed RNase H Cleavage of Nascent Transcripts Causes Transcription Termination. Mol Cell 77, 1032–1043. 10.1016/j.molcel.2019.12.029. [DOI] [PubMed] [Google Scholar]
- Langmead B, and Salzberg SL (2012). Fast gapped-read alignment with Bowtie 2. Nature Methods 2012 9:4 9, 357–359. 10.1038/nmeth.1923. [DOI] [PMC free article] [PubMed] [Google Scholar]
- Larsson AJM, Johnsson P, Hagemann-Jensen M, Hartmanis L, Faridani OR, Reinius B, Segerstolpe Å, Rivera CM, Ren B, and Sandberg R (2019). Genomic encoding of transcriptional burst kinetics. Nature 565, 251–254. 10.1038/s41586-018-0836-1. [DOI] [PMC free article] [PubMed] [Google Scholar]
- Lee JS, and Mendell JT (2020). Antisense-Mediated Transcript Knockdown Triggers Premature Transcription Termination. Mol Cell 77, 1044–1054.e3. 10.1016/j.molcel.2019.12.011. [DOI] [PMC free article] [PubMed] [Google Scholar]
- Lepire ML, and Ziomek CA (1989). Preimplantation mouse embryos express a heat-stable alkaline phosphatase. Biol Reprod 41, 464–473. 10.1095/biolreprod41.3.464. [DOI] [PubMed] [Google Scholar]
- Li H (2013). Aligning sequence reads, clone sequences and assembly contigs with BWA-MEM
- Lin C, Garrett AS, de Kumar B, Smith ER, Gogol M, Seidel C, Krumlauf R, and Shilatifard A (2011). Dynamic transcriptional events in embryonic stem cells mediated by the super elongation complex (SEC). Genes Dev 25, 1486–1498. 10.1101/gad.2059211. [DOI] [PMC free article] [PubMed] [Google Scholar]
- Loh KM, and Lim B (2011). A Precarious Balance: Pluripotency Factors as Lineage Specifiers. Cell Stem Cell 8, 363–369. 10.1016/j.stem.2011.03.013. [DOI] [PubMed] [Google Scholar]
- Loh YH, Wu Q, Chew JL, Vega VB, Zhang W, Chen X, Bourque G, George J, Leong B, Liu J, et al. (2006). The Oct4 and Nanog transcription network regulates pluripotency in mouse embryonic stem cells. Nat Genet 38, 431–440. 10.1038/ng1760. [DOI] [PubMed] [Google Scholar]
- Mahat DB, Kwak H, Booth GT, Jonkers IH, Danko CG, Patel RK, Waters CT, Munson K, Core LJ, and Lis JT (2016). Base-pair-resolution genome-wide mapping of active RNA polymerases using precision nuclear run-on (PRO-seq). Nat Protoc 11, 1455–1476. 10.1038/nprot.2016.086. [DOI] [PMC free article] [PubMed] [Google Scholar]
- Martello G, and Smith A (2014). The Nature of Embryonic Stem Cells. Annu Rev Cell Dev Biol 30, 647–675. 10.1146/annurev-cellbio-100913-013116. [DOI] [PubMed] [Google Scholar]
- Martinez Arias A, and Brickman JM (2011). Gene expression heterogeneities in embryonic stem cell populations: Origin and function. Curr Opin Cell Biol 23, 650–656. 10.1016/j.ceb.2011.09.007. [DOI] [PubMed] [Google Scholar]
- Mayer D, Stadler MB, Rittirsch M, Hess D, Lukonin I, Winzi M, Smith A, Buchholz F, and Betschinger J (2020). Zfp281 orchestrates interconversion of pluripotent states by engaging Ehmt1 and Zic2. EMBO J 39. 10.15252/embj.2019102591. [DOI] [PMC free article] [PubMed] [Google Scholar]
- Mikhaylichenko O, Bondarenko V, Harnett D, Schor IE, Males M, Viales RR, and Furlong EEM (2018). The degree of enhancer or promoter activity is reflected by the levels and directionality of eRNA transcription. Genes Dev 32, 42–57. 10.1101/gad.308619.117. [DOI] [PMC free article] [PubMed] [Google Scholar]
- Neagu A, van Genderen E, Escudero I, Verwegen L, Kurek D, Lehmann J, Stel J, Dirks RAM, van Mierlo G, Maas A, et al. (2020). In vitro capture and characterization of embryonic rosette-stage pluripotency between naive and primed states. Nat Cell Biol 22, 534–545. 10.1038/s41556-020-0508-x. [DOI] [PubMed] [Google Scholar]
- Niakan KK, Ji H, Maehr R, Vokes SA, Rodolfa KT, Sherwood RI, Yamaki M, Dimos JT, Chen AE, Melton DA, et al. (2010). Sox17 promotes differentiation in mouse embryonic stem cells by directly regulating extraembryonic gene expression and indirectly antagonizing self-renewal. Genes Dev 24, 312–326. 10.1101/gad.1833510. [DOI] [PMC free article] [PubMed] [Google Scholar]
- Niwa H (2007). How is pluripotency determined and maintained? Development 134, 635–646. 10.1242/dev.02787. [DOI] [PubMed] [Google Scholar]
- Qi LS, Larson MH, Gilbert LA, Doudna JA, Weissman JS, Arkin AP, and Lim WA (2013). Repurposing CRISPR as an RNA-γuided platform for sequence-specific control of gene expression. Cell 152, 1173–1183. 10.1016/j.cell.2013.02.022. [DOI] [PMC free article] [PubMed] [Google Scholar]
- Raj A, and van Oudenaarden A (2008). Nature, Nurture, or Chance: Stochastic Gene Expression and Its Consequences. Cell 135, 216–226. 10.1016/j.cell.2008.09.050. [DOI] [PMC free article] [PubMed] [Google Scholar]
- Semrau S, Goldmann JE, Soumillon M, Mikkelsen TS, Jaenisch R, and van Oudenaarden A (2017). Dynamics of lineage commitment revealed by single-cell transcriptomics of differentiating embryonic stem cells. Nature Communications 2017 8:1 8, 1–16. 10.1038/s41467-017-01076-4. [DOI] [PMC free article] [PubMed] [Google Scholar]
- Shahbazi MN, Scialdone A, Skorupska N, Weberling A, Recher G, Zhu M, Jedrusik A, Devito LG, Noli L, MacAulay IC, et al. (2017). Pluripotent state transitions coordinate morphogenesis in mouse and human embryos. Nature 552, 239–243. 10.1038/nature24675. [DOI] [PMC free article] [PubMed] [Google Scholar]
- Singer ZS, Yong J, Tischler J, Hackett JA, Altinok A, Surani MA, Cai L, and Elowitz MB (2014). Dynamic Heterogeneity and DNA Methylation in Embryonic Stem Cells. Mol Cell 55, 319–331. 10.1016/j.molcel.2014.06.029. [DOI] [PMC free article] [PubMed] [Google Scholar]
- Skene PJ, and Henikoff S (2017). An efficient targeted nuclease strategy for high-resolution mapping of DNA binding sites. Elife 6. 10.7554/elife.21856. [DOI] [PMC free article] [PubMed] [Google Scholar]
- Sokolik C, Liu Y, Bauer D, McPherson J, Broeker M, Heimberg G, Qi LS, Sivak DA, and Thomson M (2015). Transcription Factor Competition Allows Embryonic Stem Cells to Distinguish Authentic Signals from Noise. Cell Syst 1, 117–129. 10.1016/J.CELS.2015.08.001. [DOI] [PMC free article] [PubMed] [Google Scholar]
- Strebinger D, Deluz C, Friman ET, Govindan S, Alber AB, and Suter DM (2019). Endogenous fluctuations of OCT4 and SOX2 bias pluripotent cell fate decisions. Mol Syst Biol 15, e9002. 10.15252/msb.20199002. [DOI] [PMC free article] [PubMed] [Google Scholar]
- Thomson M, Liu SJ, Zou LN, Smith Z, Meissner A, and Ramanathan S (2011). Pluripotency Factors in Embryonic Stem Cells Regulate Differentiation into Germ Layers. Cell 145, 875–889. 10.1016/j.cell.2011.05.017. [DOI] [PMC free article] [PubMed] [Google Scholar]
- Tippens ND, Vihervaara A, and Lis JT (2018). Enhancer transcription: What, where, when, and why? Genes Dev 32, 1–3. 10.1101/gad.311605.118. [DOI] [PMC free article] [PubMed] [Google Scholar]
- Trapnell C, Cacchiarelli D, Grimsby J, Pokharel P, Li S, Morse M, Lennon NJ, Livak KJ, Mikkelsen TS, and Rinn JL (2014). The dynamics and regulators of cell fate decisions are revealed by pseudotemporal ordering of single cells. Nat Biotechnol 32, 381–386. 10.1038/nbt.2859. [DOI] [PMC free article] [PubMed] [Google Scholar]
- Udomlumleart T, Hu S, and Garg S (2021). Lineages of embryonic stem cells show non-Markovian state transitions. IScience 24, 102879. 10.1016/J.ISCI.2021.102879. [DOI] [PMC free article] [PubMed] [Google Scholar]
- Walton RT, Christie KA, Whittaker MN, and Kleinstiver BP (2020). Unconstrained genome targeting with near-PAMless engineered CRISPR-Cas9 variants. Science (1979) 368, 290–296. 10.1126/science.aba8853. [DOI] [PMC free article] [PubMed] [Google Scholar]
- Wang J, Rao S, Chu J, Shen X, Levasseur DN, Theunissen TW, and Orkin SH (2006). A protein interaction network for pluripotency of embryonic stem cells. Nature 444, 364–368. 10.1038/nature05284. [DOI] [PubMed] [Google Scholar]
- Wang Z, Chu T, Choate LA, and Danko CG (2018). Identification of regulatory elements from nascent transcription using dREG. BioRxiv 293–303. 10.1101/321539. [DOI] [PMC free article] [PubMed]
- White MD, Angiolini JF, Alvarez YD, Kaur G, Zhao ZW, Mocskos E, Bruno L, Bissiere S, Levi V, and Plachta N (2016). Long-Lived Binding of Sox2 to DNA Predicts Cell Fate in the Four-Cell Mouse Embryo. Cell 165, 75–87. 10.1016/j.cell.2016.02.032. [DOI] [PubMed] [Google Scholar]
- Whyte WA, Orlando DA, Hnisz D, Abraham BJ, Lin CY, Kagey MH, Rahl PB, Lee TI, and Young RA (2013). Master transcription factors and mediator establish super-enhancers at key cell identity genes. Cell 153, 307–319. 10.1016/j.cell.2013.03.035. [DOI] [PMC free article] [PubMed] [Google Scholar]
- Ying QL, Stavridis M, Griffiths D, Li M, and Smith A (2003). Conversion of embryonic stem cells into neuroectodermal precursors in adherent monoculture. Nature Biotechnology 2003 21:2 21, 183–186. 10.1038/nbt780. [DOI] [PubMed] [Google Scholar]
- Ying QL, Wray J, Nichols J, Batlle-Morera L, Doble B, Woodgett J, Cohen P, and Smith A (2008). The ground state of embryonic stem cell self-renewal. Nature 453, 519–523. 10.1038/nature06968. [DOI] [PMC free article] [PubMed] [Google Scholar]
- Zhang Y, Liu T, Meyer CA, Eeckhoute J, Johnson DS, Bernstein BE, Nussbaum C, Myers RM, Brown M, Li W, et al. (2008). Model-based analysis of ChIP-Seq (MACS). Genome Biol 9, R137. 10.1186/gb-2008-9-9-r137. [DOI] [PMC free article] [PubMed] [Google Scholar]
Associated Data
This section collects any data citations, data availability statements, or supplementary materials included in this article.
Supplementary Materials
Table S1: mPROseq enhancers, related to Figure 1.
Coordinates and putative gene targets of 7,228 mPROseq-defined enhancers, including 689 DATEs.
Table S2: Oligonucleotide sequences, related to Figures 1 and 2.
Oligonucleotide sequences for oligonucleotides and sgRNAs used in this study
Table S3: CRISPRi screen results, related to Figure 2.
sgRNA enrichment in Nanoglow and Nanoghigh subpopulations
Table S4: ChIPseq dataset information, related to Figure 3.
GEO Accession numbers for datasets used in this study for analysis of TF binding at DATEs
Table S5: Transcription factor binding and motif analysis at DATEs, related to Figure 3.
Enriched transcription factor binding motif sequences and overlap of transcription factor binding at DATEs
Data Availability Statement
Data: mPROseq, RNAseq, ATACseq, ChIPseq, and scRNAseq data generated in this study are deposited in NCBI’s Gene Expression Omnibus and are accessible through GEO Series accession number GSE169044. Immunofluorescence and immunoblot images generated in this study are deposited in Mendeley Data and are accessible through at doi:10.17632/hx4zs8dbp2.1. Additionally, ChIPseq datasets from various studies were re-analyzed in this study and are listed in Table S4.
Code: Example code to analyze the generated data is publicly available at https://github.com/SGarg-Lab/DATE-scripts. A
Any additional information required to reanalyze the data reported in this paper is available from the lead contact upon request.