Abstract
Increased lactate levels in the tissue microenvironment are a well‐known feature of chronic inflammation. However, the role of lactate in regulating T cell function remains controversial. Here, we demonstrate that extracellular lactate predominantly induces deregulation of the Th17‐specific gene expression program by modulating the metabolic and epigenetic status of Th17 cells. Following lactate treatment, Th17 cells significantly reduced their IL‐17A production and upregulated Foxp3 expression through ROS‐driven IL‐2 secretion. Moreover, we observed increased levels of genome‐wide histone H3K18 lactylation, a recently described marker for active chromatin in macrophages, in lactate‐treated Th17 cells. In addition, we show that high lactate concentrations suppress Th17 pathogenicity during intestinal inflammation in mice. These results indicate that lactate is capable of reprogramming pro‐inflammatory T cell phenotypes into regulatory T cells.
Keywords: histone lactylation, immunometabolism, lactate, Th17 cells, Tregs
Subject Categories: Chromatin, Transcription & Genomics; Immunology; Metabolism
Lactate is a common metabolite in the tumor and inflammatory environment. High extracellular lactate concentrations promote the reprogramming of pro‐inflammatory Th17 cells towards regulatory T cell‐like phenotypes by metabolic and epigenetic mechanisms.

Introduction
Lymphocyte proliferation following T cell receptor (TCR) activation is correlated with the metabolic shift towards aerobic glycolysis, characterized by increased production of lactate, designated as the Warburg effect (Chang et al, 2013). Aerobic glycolysis and increased lactate concentrations in the tissue microenvironment are signature features not only of cancer but also of chronic inflammatory conditions (Pucino et al, 2017). While all T cells dramatically increase energy production following activation due to rapid proliferation and the enhanced demand for the biosynthesis of nucleic acids, lipids, and proteins, different CD4+ T cell subtypes adapt their metabolism in different ways. Activated regulatory T (Treg) cells mainly rely on the tricarboxylic acid (TCA) cycle and fatty acid oxidation for energy supply. By contrast, pro‐inflammatory CD4+ effector T cells, such as Th1 and Th17 lymphocytes, are particularly dependent on aerobic glycolysis and thus also produce higher amounts of lactate (Buck et al, 2015). It becomes evident that metabolic activity is tightly linked with T cell effector function and that metabolic alterations influence T cell cytokine production (Chapman et al, 2020; Shyer et al, 2020).
Lactate has long been considered a waste product of aerobic glycolysis; however recent findings have revealed its role as a potent signaling molecule that regulates various cellular processes in cancer and immune cells (Wang et al, 2021). It is suggested to modulate immune responses of the host, both locally in the tumor microenvironment but also systemically (Buck et al, 2017). Thus, lactate accumulation at sites of inflammation is likely to have an extensive impact on T cell function, but the exact influences of lactate on T cells are still under debate. Recent findings suggest that lactate‐mediated modulation of effector molecules might result in either immunostimulatory or immunosuppressive activity of T lymphocytes (Angelin et al, 2017; Pucino et al, 2019). Previously, lactate was shown to suppress the proliferation of effector T cells by impairing glucose‐derived serine production and by reducing NAD+ to NADH (Quinn et al, 2020). In addition, lactate modulates the motility of CD4+ and CD8+ T cell by interfering with glycolysis, which is required for T cells to migrate (Haas et al, 2015). Moreover, contradictory effects of lactate on the activity and cytokine production of various T cell subsets have been reported. In CD4+ T lymphocytes, lactate was shown to induce a functional switch towards the pro‐inflammatory Th17 subset (Certo et al, 2021; Pucino et al, 2020). By contrast, another study demonstrated that lactate impairs the function of effector T cells and promotes the activity of Foxp3‐expressing Tregs (Angelin et al, 2017). A recent report suggests that lactate also supports the differentiation and function of cytotoxic CD8+ T cells (Rundqvist et al, 2020). Apart from the influence on the adaptive immune system, lactate is also able to modulate innate immune responses, particularly in dendritic cells, macrophages, and neutrophils (Khatib‐Massalha et al, 2020; Manoharan et al, 2021; Ratter et al, 2018).
Histone modifications are important means of genetic regulation of cellular functions. Whereas histone methylation and acetylation are well‐characterized phenomena, histone lactylation has been recently discovered (Zhang et al, 2019). It has been shown in macrophages that intracellular lactate provides a source of the lactyl‐residues and its concentration might therefore influence the extent of histone lactylation. This places lactate at the crossroad between small molecule metabolism and epigenetic regulation, with the potential to influence immunological processes. In macrophages, histone lactylation has been linked to the transition of M1 to M2 phenotype and has been associated with anti‐inflammatory, wound healing properties (Zhang et al, 2019).
Our data reveal metabolic‐epigenetic crosstalk in Th17 cells following lactate treatment, resulting in reprogramming of these lymphocytes and consequently loss of IL‐17A production. We show that lactate contributes to the plasticity of T cells by shifting the transcriptional program of pro‐inflammatory Th17 cells towards a regulatory‐like Foxp3‐expressing T cell phenotype. Thus, extracellular lactate produced at the site of inflammation is potentially able to suppress Th17 cell‐driven inflammation and autoimmunity.
Results and Discussion
Lactate downregulates the production of IL‐17A and induces Foxp3 expression in Th17 cells
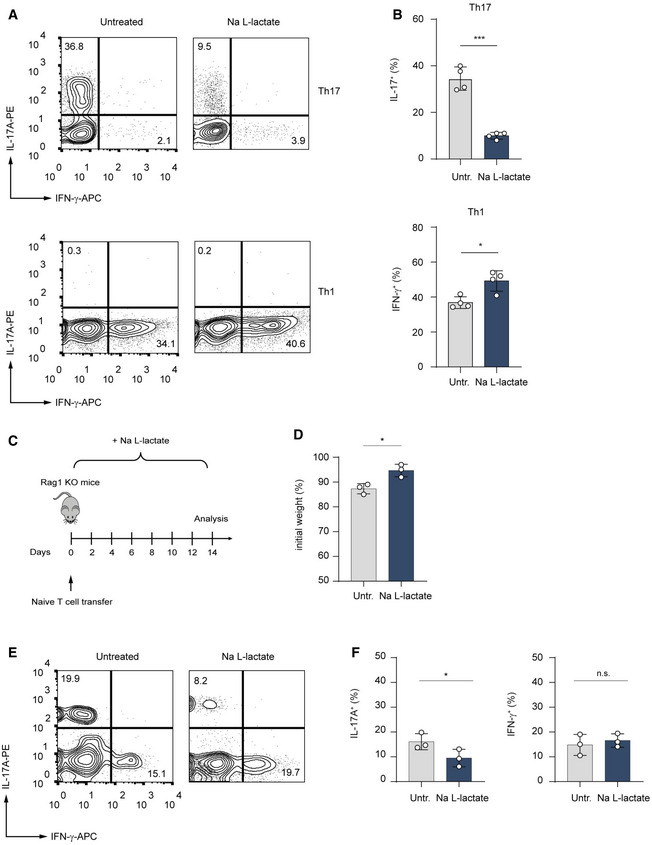
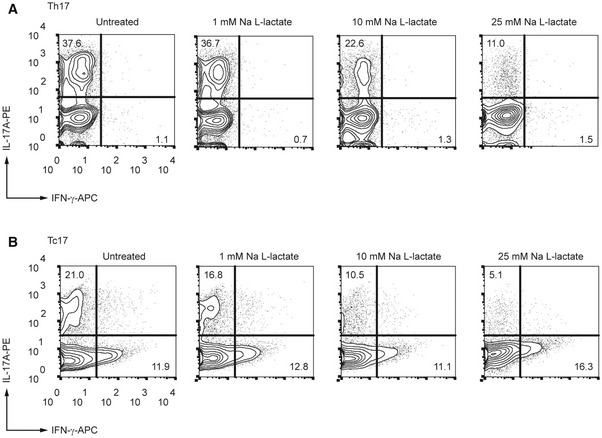
An inflamed tissue microenvironment is associated with lactate accumulation (Lee, 2021). To examine the effects of lactate on pro‐inflammatory T lymphocytes, we treated Th1 and Th17 cells with sodium lactate for 3 days and analyzed cytokine production by flow cytometry. This analysis revealed that in presence of extracellular lactate, Th17 cells strongly reduced IL‐17A expression as compared to the control cells (Figs 1A and EV1A). Similarly, lactate‐treated CD8+ Tc17 cells exhibited decreased expression of IL‐17A in comparison to untreated Tc17 lymphocytes (Fig EV1B). By contrast, Th1 cells slightly upregulated IFN‐γ production in response to lactate treatment (Fig 1B), indicating a specific suppressive effect on Th17 effector function.
Figure 1. Lactate suppresses production of IL‐17A in Th17 cells.
-
A, BCD4+ T cells purified from spleens and LNs of WT mice were polarized under Th1‐ and Th17‐inducing conditions and treated with lactate (25 mM) for 3 days. Representative contour plots (A) and bar graphs (B) show the frequency of IL‐17+ and IFN‐γ+ cells (n = 4 biological replicates; *P = 0.01–0.05; ***P < 0.001; data (B) are shown as mean ± s.e.m.). Data are analyzed by the Student's t‐test.
-
CSchematic overview of the T cell transfer model of colitis in Rag1−/− mice.
-
D–FRag1‐deficient mice were injected with 7.5 × 10⁵ naïve CD4+ T cells. One group of the recipient mice was orally treated with 200 mM lactate during the experiment. After 2 weeks, the body weight changes (D) and the frequency of IL‐17A+ and IFN‐γ+ T cells in the colon (E and F) were analyzed. Weight changes were normalized to the initial body weight of mice before the adoptive transfer of T cells. One of two experiments is displayed (n = 3 mice per group per experiment; n.s., not significant; *P = 0.01–0.05; results are expressed as mean ± s.e.m.). Data are analyzed by the Student's t‐test.
Figure EV1. Lactate suppresses production of IL‐17A in T cells.
-
A, BCD4+ (A) and CD8+ (B) T lymphocytes were purified from spleens and LN of WT mice and differentiated under Th17‐polarizing conditions for 3 days in the presence of increasing lactate concentrations, respectively. Representative contour plots indicate the percentage of IL‐17A+ and IFN‐γ+ cells, detected by flow cytometry (n = 3 biological replicates).
To evaluate the in vivo impact of lactate on inflammatory Th17 lymphocytes, naïve CD4+ T cells were adoptively transferred into Rag1‐deficient mice. Recipient mice were orally treated with lactate or left untreated. Two weeks following the T cell transfer, lactate‐treated animals showed reduced weight loss and significantly decreased frequencies of intestinal IL‐17A+ T cells as compared to control Rag1‐deficient mice receiving naïve T cells only (Fig 1C–F). This suggests that lactate is capable of ameliorating the course of colitis by reducing the frequency of pathogenic Th17 lymphocytes.
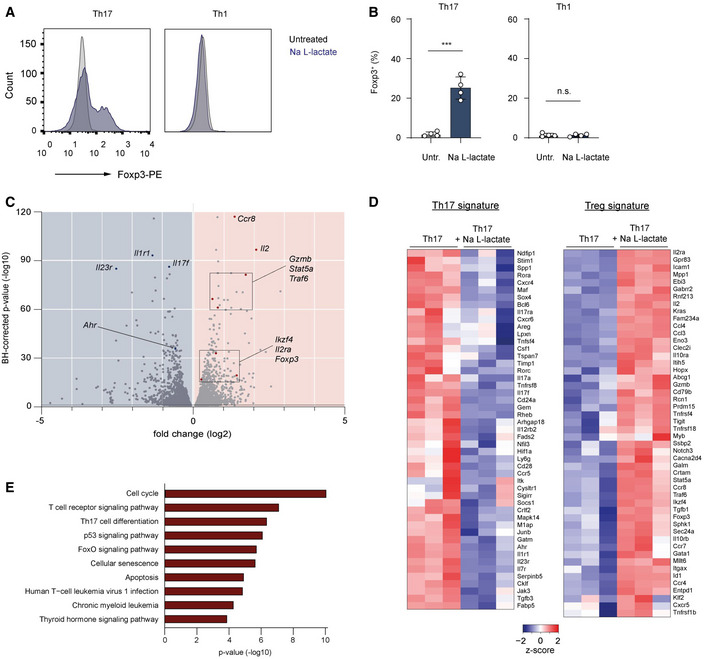
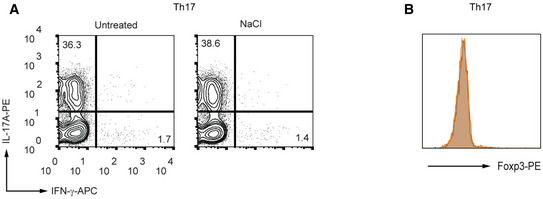
Intriguingly, we observed a possible functional shift of the effector T cell phenotype towards Tregs in lactate‐stimulated Th17 cells. Sodium lactate treatment resulted in a substantial increase in expression of the master regulator of Tregs, Foxp3, under Th17‐polarizing conditions. The induction of Foxp3 expression was not observed under Th1‐polarizing conditions (Fig 2A and B), indicating that lactate likely additionally needs TGF‐β‐signaling for inducing Foxp3 expression. Neither induction of Foxp3 expression, nor suppression of IL‐17A production was observed in control Th17 cells treated with NaCl (Fig EV2A and B). This confirmed the selective effects of lactate and excluded the possibility of sodium ions exerting a regulatory influence.
Figure 2. Lactate induces the transcriptional signature of Tregs under Th17‐polarizing conditions.
-
A, BThe percentage of Foxp3+ cells in polarized Th1 and Th17 cells treated with lactate (25 mM) for 3 days. Representative flow cytometry histograms (A) and bar graphs (B) show the intracellular staining for the transcription factor Foxp3 (n = 4 mice per group; n.s., not significant; ***P < 0.001; data are shown as mean ± s.e.m.). Data are analyzed by the Student's t‐test.
-
C–ECD4+ T cells isolated from spleens and LNs of WT mice were polarized under Th17‐inducing conditions for 3 days following lactate treatment (25 mM) and subsequently analyzed by RNA‐sequencing (n = 3 biological replicates). Volcano plot (C), heatmaps for Th17 and Treg signature genes (D), and KEGG‐pathway analysis (E) of differentially expressed genes in Th17 cells are displayed. Heatmaps (D) with individual lines representing one of three replicates per group show the list of selected genes associated with Treg or Th17 cell genetic signatures that are specifically modified by lactate. Z‐scores were calculated on the basis of TPMs. The respective terms for “top ten” pathways that are modified by lactate are indicated on the left (E).
Figure EV2. Effect of NaCl on differentiation of Th17 cells.
-
A, BMurine CD4+ T cells were cultured under Th17‐inducing conditions in the presence or absence of NaCl (25 mM) for 3 days. The percentages of IL‐17A+ cells (A) and Foxp3 expression (B) were determined by flow cytometry (n = 3 biological replicates).
Lactate destabilizes the transcriptional signature of Th17 cells
To gain further insight into possible lactate‐mediated changes in the Th17‐associated transcription program, Th17 cells were treated with lactate for 48 h and subsequently analyzed by RNA sequencing. The transcriptome analysis of lactate‐treated Th17 lymphocytes revealed significant changes in gene expression reflected in differential expression of approximately 20% of total genes (Fig 2C). Some of the most prominently downregulated genes included several genes required for the pathogenicity of Th17 cells such as Il23r, Il1R1, and Il17f and Ahr. Furthermore, several genes implicated in the differentiation and suppressor function of Tregs such as Il2, Il2ra, Stat5a, Ccr8, Traf6, and Gzmb were significantly upregulated upon treatment with lactate. In addition, the genes Foxp3 and Ikzf4 encoding for master transcription factors Foxp3 and Eos promoting development and function of Tregs, were also upregulated after stimulation of Th17 lymphocytes with lactate (Fig 2C). Upon further analysis, we could detect a lactate‐dependent downregulation of the “core” Th17‐associated gene expression signature in Th17 cells (Fig 2D), which was accompanied by an upregulation of an “activated” Treg signature (Hasan et al, 2019). In addition, the analysis of KEGG‐pathways further revealed that metabolic activity of lactate influenced many signaling cascades, including modulation of the cell cycle, differentiation of Th17 lymphocytes, and FoxO signaling pathway (Fig 2E). Together, the alterations in gene expression induced by lactate treatment indicated a robust phenotypical switching of pro‐inflammatory Th17 cells to immune suppressive Tregs.
Induction of Foxp3 expression in Th17 cells by lactate is dependent on ROS and IL‐2
Recent in vivo studies have revealed that a considerable fraction of pyruvate in various tissues is derived from circulating lactate in the body (Hui et al, 2017). Consistent with this observation, tracing experiments with 13C‐labeled lactate revealed that T lymphocytes exposed to extracellular lactate increase their citrate, acetyl‐CoA, and ROS levels (Pucino et al, 2019; Rundqvist et al, 2020). Recently, it was suggested that increased levels of mitochondrial ROS were required for activation of the nuclear factor of activated T cells (NFAT) and subsequent induction of IL‐2 production (Sena et al, 2013).
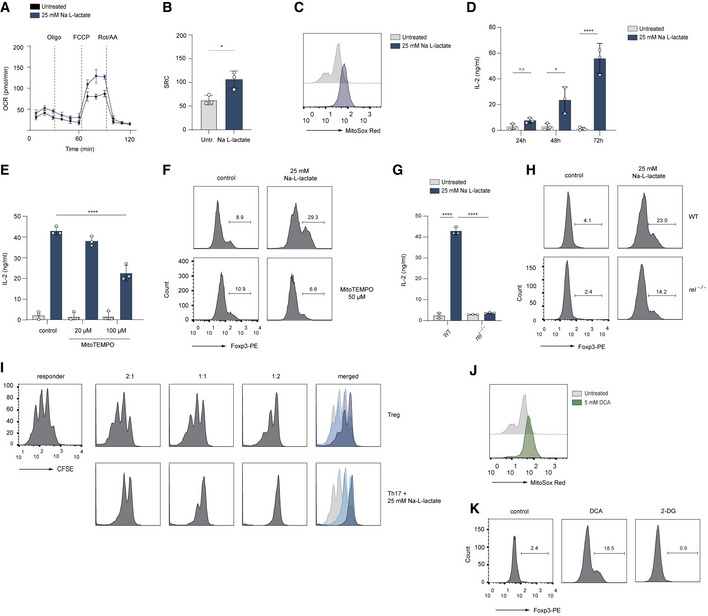
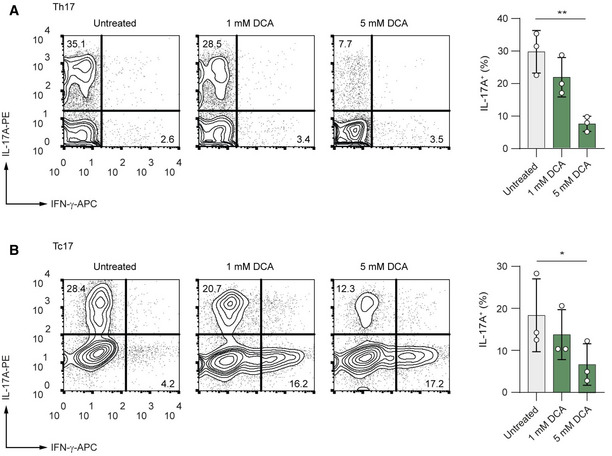
We hypothesize that extracellular lactate might redirect the metabolic pathways towards the generation of pyruvate, leading to its entry into the TCA cycle, which would result in enhanced production of mitochondrial ROS. When we analyzed the mitochondrial function, we found that the oxygen consumption rate (OCR), an indicator of mitochondrial oxidative phosphorylation (OXPHOS), was significantly higher in lactate‐treated Th17 cells than in control Th17 lymphocytes. Further, we observed an increased spare respiratory capacity (SRC) in lactate‐treated Th17 cells, indicating their potential for a higher mitochondrial activity (Fig 3A and B). Moreover, mitochondrial ROS production was also elevated in lactate‐treated Th17 lymphocytes (Fig 3C). Importantly, the quantification of IL‐2 concentrations in supernatants of Th17 cells, cultured for 24, 48 and 72 h with or without lactate, revealed an excessive and prolonged IL‐2 production in lactate‐treated Th17 lymphocytes (Fig 3D). While control Th17 lymphocytes produced relatively low amounts of IL‐2, which was completely consumed during the differentiation, lactate‐treated cells showed increased production and steady accumulation of IL‐2, leading to an approximately 50‐fold increase in comparison to control cells after 72 h (Fig 3D). This finding is in accordance with our RNA‐sequencing data that show an increased mRNA expression of Il2 and Il2ra and Stat5a in lactate‐treated T cells (Fig 2C). Furthermore, we observed that mitoTEMPO, a mitochondria‐targeted antioxidant, counteracted elevated IL‐2 secretion and Foxp3 expression, suggesting that lactate‐mediated increase in generation of mitochondrial ROS promotes the phenotypical switch in Th17 cells (Fig 3E and F). Lactate was previously shown to stimulate the NF‐κB signaling in a ROS‐dependent manner (Vegran et al, 2011). Of note, in the absence of the NF‐κB transcription factor c‐Rel, which is known to bind together with NFAT to Il2 promoter sequence (Shapiro et al, 1996), Th17 cells did not upregulate the production of IL‐2 and only partially induced expression of Foxp3 (Fig 3G and H). These data suggest that a lactate‐mediated increase in the generation of mitochondrial ROS promotes c‐Rel‐mediated IL‐2 production in Th17 cells, leading to a phenotypical switch. In addition, IL‐2 is also known to negatively regulate the function of Th17 lymphocytes via STAT5 signaling (Laurence et al, 2007). To test the causal link between lactate treatment and acquisition of immunosuppressive properties, we examined the capacity of lactate‐treated Th17 cells to inhibit the proliferation of effector CD4+ T cells. Of note, both, in vitro generated Foxp3+ Tregs and Foxp3‐expressing, lactate‐treated Th17 cells were equally effective at suppressing the proliferation of CD4+ T lymphocytes (Fig 3I). Importantly, the effect of lactate on IL‐17A production and Th17 stability can be mimicked by DCA, a substance that inhibits pyruvate dehydrogenase kinase (PDK), thus enabling pyruvate dehydrogenase (PDH) to oxidize pyruvate and to generate the intermediates of the TCA and ROS. In agreement with previous observations (Gerriets et al, 2015), we show reduced IL‐17A production in both Th17 and Tc17 cells upon DCA treatment (Fig EV3A and B). We also observed increased mitochondrial ROS generation and induction of Foxp3 expression mediated by DCA in Th17 cells (Fig 3J and K). The increase in Foxp3 expression was not observed following treatment of Th17 cells with 2‐DG (Fig 3K), indicating that diverting of pyruvate to mitochondria, but not the complete disruption of glycolysis induces Treg phenotype under Th17‐polarizing conditions. These results provide an example of how small metabolic products might be therapeutically exploited for manipulating the phenotype of CD4+ T cells.
Figure 3. Lactate induces ROS‐mediated IL‐2 secretion and Foxp3 expression in Th17 cells.
-
A, BThe Seahorse assay showing the oxygen consumption rate (OCR) and spare respiratory capacity (SRC, calculated as maximal OCR/basal OCR) in vitro‐cultured Th17 cells at baseline and in response to oligomycin (Oligo), FCCP, and rotenone plus antimycin A (Rot/AA). Data are analyzed by the Student's t‐test (n = 3 biological replicates, *P = 0.01–0.05; results are expressed as mean ± s.e.m.).
-
CThe production of mitochondrial ROS in lactate‐treated Th17 cells was measured by FACS analysis using MitoSOX Red on day 3 of cell culture. A representative histogram is displayed (n = 3 biological replicates).
-
DThe secretion of IL‐2 from untreated Th17 cells or Th17 cells treated with lactate was determined by ELISA on day 1, 2 and 3 of cell differentiation (n = 3 biological replicates, n.s., not significant; *P = 0.01–0.05; ****P < 0.0001; data are expressed as mean ± s.e.m.). Data are analyzed by the Student's t‐test.
-
E, FLactate‐stimulated Th17 cells were treated with a mitochondria‐targeted antioxidant, (mitoTEMPO). On day 3 of cell culture, the secretion of IL‐2 was measured by ELISA (E), and Foxp3 expression (F) was analyzed by flow cytometry (n = 3 biological replicates, ****P < 0.0001; data are expressed as mean ± s.e.m.). Data are analyzed by the Student's t‐test.
-
G, Hc‐Rel‐deficient Th17 cells were treated with sodium lactate for 3 days. Afterward, the IL‐2 secretion (G), and Foxp3 expression (H) were examined (n = 3 biological replicates, ****P < 0.0001; data are expressed as mean ± s.e.m.). Data are analyzed by the Student's t‐test.
-
IThe cell proliferation of naïve CD4+ T cells (responder T cells) was analyzed on day 3 of co‐culture in the presence of Tregs or lactate‐treated Th17 cells as described in Material and Methods. The suppressive capacity of lactate‐treated Th17 cells was measured by dilution of CSFE within responder T cell fraction by flow cytometry. One representative experiment is depicted (n = 3 biological replicates).
-
J, KCD4+ T cells were isolated from spleens and LNs of WT mice. Purified T cells were polarized under Th17‐inducing conditions and treated with DCA (5 mM) or 2‐DG (1 mM) for 3 days. The flow cytometry results for mitochondrial ROS (MitoSOX Red, J) and Foxp3 expression (K) following treatment of cells are shown. One representative experiment is depicted (n = 3 biological replicates).
Figure EV3. DCA suppresses production of IL‐17A in Th17 and Tc17 cells.
-
A, BCD4+ (A) and CD8+ (B) T cells were isolated from spleens and LNs of WT mice. Purified T cells were polarized under Th17‐inducing conditions and treated with increasing concentrations of DCA for 3 days. Representative contour plots show the frequencies of IL‐17A+ and IFN‐γ+ cells analyzed by flow cytometry (n = 3 biological replicates; n.s., not significant; *P = 0.01–0.05; **P = 0.001–0.01; data are analyzed by the two‐tailed unpaired Student's t‐test).
Lactate induces histone lactylation in Th17 cells
Lactate is not only an active metabolite but has also been proposed as a precursor molecule for histone lactylation, a recently described post‐translational modification (PTM) of histones in macrophages (Zhang et al, 2019). Consistent with previously reported data, we show that glucose was essential for inducing both pan‐histone lactylation and specific H3K18 lactylation, and that extracellular lactate additionally increased the histone lactylation levels in macrophages. Moreover, we observed that, even in the absence of glucose, extracellular lactate was able to promote histone lactylation (Fig EV4A).
Figure EV4. Histone lactylation in CD4+ T cells.
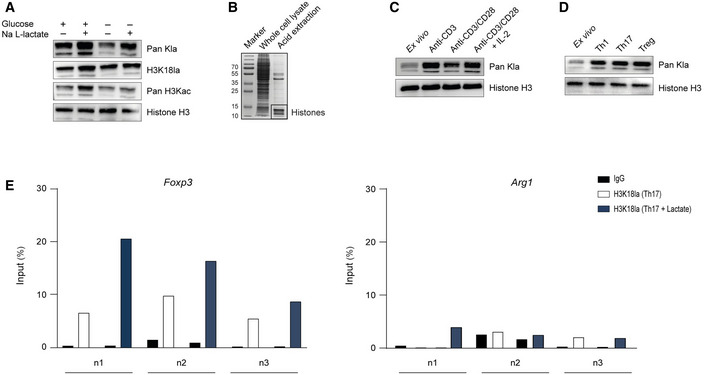
- Global histone (Kla) and specific H3K18 lactylation were analyzed by immunoblotting 24 h after stimulation of nonpolarized macrophages. Bone marrow‐derived macrophages were cultured in the presence or absence of 25 mM glucose and 25 mM Na L‐lactate. Immunoblotting of representative whole‐cell extracts is shown (n = 3 biological replicates).
- Histone preparation by acid extraction from the whole‐cell lysate of murine CD4+ T cells, visualized by Coomassie blue staining.
- Western blots of acid‐extracted histones from activated CD4+ T cells showing global histone lactylation in the presence of glucose (25 mM) at 24 h after stimulation of cells. One of three similar experiments is shown.
- Immunoblotting of acid‐extracted lactylated histones from differentiated Th1, Th17, and Treg cells on day 3 of differentiation. As control lymphocytes, ex vivo purified, nonactivated CD4+ T cells were used.
- ChIP analysis of H3K18‐lactylated histones at the Arg1 and Foxp3 promoter regions in the absence or presence of extracellular lactate (25 mM) was performed after 24 h of the cell culture for Th17 cells. Three independent experiment (n = 3 biological replicates) are shown (n1, n2, n3).
Source data are available online for this figure.
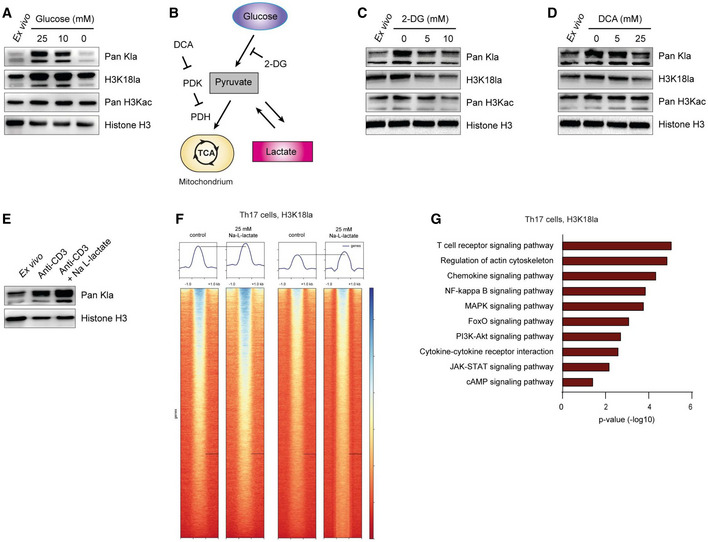
To study potential histone lactylation in T cells, we purified CD4+ T cells from spleens and lymph nodes (LNs) of WT mice and isolated histones using the acid extraction method (Fig EV4B). We performed western blot analysis with antibodies specific for either total histone lysine lactylation or lysine 18 in histone H3 (H3K18 lactylation). Antibodies detecting total histone lysine acetylation or total H3 served as controls. Stimulation with anti‐CD3 alone, or combined with anti‐CD28 antibody in the presence of IL‐2 increased histone lactylation in CD4+ T cells as compared to unstimulated ex vivo derived T lymphocytes (Fig EV4C), suggesting that this histone modification is a part of the lymphocyte activation process. It was previously shown that anti‐CD3‐mediated activation of murine lymphocytes was sufficient for the initial increase in aerobic glycolysis, resulting in enhanced lactate production, whereas anti‐CD28 and IL‐2 further elevated aerobic glycolytic rate (Menk et al, 2018). Next, we investigated how metabolic perturbations that are expected to affect lactate production would influence histone lactylation in T cells. Restricting glucose supply limits glycolysis and therefore lowers lactate production. Activated CD4+ T cells cultured in a glucose‐free medium showed decreased histone lactylation in comparison to cells grown in presence of normal glucose concentrations (Fig 4A). 2‐Deoxy‐D‐glucose (2‐DG) and dichloroacetate (DCA) are substances that are able to lower lactate production in the cytosol. They act either by blocking glycolytic pyruvate production or by increasing pyruvate oxidation in mitochondria, either of which limits pyruvate availability for lactate synthesis (Fig 4B). We observed that treatment of CD4+ T cells with either 2‐DG or DCA reduced both pan‐histone lactylation and H3K18 lactylation (Fig 4C and D). This implies that lactate generated by glycolysis serves as a precursor molecule for this novel PTM. Interestingly, we found a further increase in histone lactylation in lactate‐treated CD4+ T lymphocytes, showing that extracellular lactate is capable of modulating the epigenetic status of T cells (Fig 4E). Moreover, high lactylation levels of histone H3 were detected in Th1 and Th17 cells, as well as in Tregs (Fig EV4D), suggesting that histone lactylation is a widespread PTM in activated T cells. To examine the global effects of extracellular lactate on histone lactylation in Th17 cells, we performed chromatin immunoprecipitation sequencing (ChIP‐Seq) using anti‐H3K18la antibody (pan‐Kla antibody was not used for ChIP‐Seq, as it can detect any lactylated protein and not only histones). This analysis revealed an altered genome‐wide distribution of H3K18 lactylation in response to extracellular lactate (Fig 4F). Interestingly, many genes displaying increased H3K18 lactylation following lactate treatment of Th17 cells belong to general T cell receptor signaling, including NF‐κB and MAPK signaling pathways (Fig 4G). Moreover, by applying ChIP–qPCR assay, we observed an enrichment of H3K18 lactylation at the proximal promoter region of Foxp3 (but not at the macrophage‐specific Arg1 locus) in lactate‐treated Th17 lymphocytes (Fig EV4E). Collectively, although it is premature to interpret its functional impact on T cells, an enrichment of H3K18 histone lactylation in lactate‐treated Th17 cells suggests that this novel PTM might be a mark of active chromatin, as previously shown for macrophages.
Figure 4. Lactate induces histone lactylation in T cells.
-
AWestern blots of acid‐extracted histones from activated CD4+ T cells showing global histone lactylation and H3K18 lactylation levels in the presence and absence of glucose at 24 h after stimulation of cells. One of three similar experiments is shown.
-
BSchematic diagram of glycolysis and inhibitory compounds used for inhibition of lactate production (E and F). While 2‐Deoxy‐D‐glucose (2‐DG) competitively inhibits glycolysis, dichloroacetate (DCA) is an inhibitor of pyruvate dehydrogenase kinase (PDK), which results in enhanced activity of pyruvate dehydrogenase (PDH) and elevated pyruvate oxidation.
-
C, DWestern blots of acid‐extracted histones from activated CD4+ T cells in the presence of glycolysis inhibitor 2‐DG and PDK inhibitor DCA, respectively. Cells were analyzed for global lactylation and H3K18 lactylation 24 h after activation of TCR with anti‐CD3 (5 μg/ml).
-
EImmunoblotting of acid‐extracted lactylated histones from anti‐CD3‐activated CD4+ T cells in the presence of extracellular lactate (25 mM) at 24 h of cell culture. One representative out of three experiments is shown. For all immunoblotting experiments, ex vivo purified, nonactivated CD4+ T cells were used as control lymphocytes.
-
FChIP‐sequencing showing H3K18 lactylation signals in control Th17 cells and lactate‐treated Th17 lymphocytes (25 mM). Biological duplicates are shown.
-
GKEGG‐pathway analysis (biological processes) of H3K18la‐specific genes in lactate‐treated Th17 cells. Statistical significance was determined using DAVID software.
Source data are available online for this figure.
Material and Methods
Mice
WT, rel −/−, and Rag1 −/− mice on a C57BL/6 background were kept under SPF conditions at the Biomedical Research Center, Philipps‐University of Marburg. Eight‐to‐twelve‐week‐old female mice were used for experiments. All experiments were conducted in accordance with the German law guidelines for animal care (RP Gießen, Project Nr.: Ex‐22‐2020). Mice were sacrificed by cervical dislocation, and spleens and lymph nodes were collected for immunological analyses.
Adoptive transfer model of colitis
To induce T cell‐mediated colitis, naïve CD4+ T cells were purified using naïve T cell isolation kit (Miltenyi Biotec). A 7.5 × 10⁵ naïve CD4+CD62L+CD44− T cells were injected intraperitoneally into age‐ and sex‐matched Rag1−/− mice and changes in body weight were monitored throughout the duration of the experiment. One group of mice was additionally treated with sodium lactate (200 mM) in the drinking water. Control mice received sodium‐ and pH‐matched water. Water solutions were prepared and changed three times per week. Two weeks after T cell transfer, mice were sacrificed and colonic T cells were analyzed for their cytokine expression by flow cytometry.
In vitro macrophage differentiation
Femora and tibie of WT mice were removed and bone marrow cells harvested by a short centrifugation at 500 rpm. Cells were washed, strained through a 100 μm cell strainer, and stimulated with 15% M‐CSF for 7 days. Purity was determined with antibodies against F4/80 (clone BM8, lot no. E07284‐36.30) and MHC class II (clone TIB120, lot no. 5607964) by flow cytometry. Cells were then cultured with indicated concentrations of glucose and sodium lactate.
In vitro T cell differentiation
Cells from spleens and lymph nodes were pooled and CD4+ T and CD8+ T cells were purified by a negative isolation kit (Miltenyi Biotec). The purity of T lymphocytes was consistently higher than 95%. Isolated T cells were stimulated with plate‐bound anti‐CD3 (5 μg/ml, Biolegend) and soluble anti‐CD28 (1 μg/ml, Biolegend). Th1 cells were differentiated in the presence of anti‐IL‐4 (10% culture supernatant of clone 11B11), IL‐2 (50 U/ml, Peprotech, 212‐12), and IL‐12 (10 ng/ml, Peprotech). To obtain CD8+ CTLs, the same protocol without the addition of IL‐12 was used. Th17 and Tc17cells were differentiated in the presence of anti‐IFN‐γ (5 μg/ml, Biolegend), anti‐IL‐4, IL‐2 (25 U/ml), TGF‐β1 (1 ng/ml, Peprotech) and IL‐6 (40 ng/ml, Peprotech). Tregs were polarized in the presence of anti‐IFN‐γ (5 μg/ml), anti‐IL‐4, IL‐2 (100 U/ml), and TGF‐β1 (3 ng/ml). Where indicated, T cells were treated with sodium L‐lactate (1–25 mM, Sigma‐Aldrich), sodium chloride (25 mM, Sigma‐Aldrich), 2‐DG (5–10 mM, Sigma‐Aldrich), DCA (1‐25 mM, Sigma‐Aldrich) and NAC (1–2 mM, Sigma‐Aldrich).
In vitro suppression assay
A total of 200,000 CFSE‐labeled naïve CD4+ T cells (responder T cells) were seeded in a 96‐well round‐bottom plate followed by adding 500,000 irradiated T cell‐depleted splenocytes. In order to test their suppressive activity, Tregs or lactate‐treated Th17 cells were co‐cultured with responder T cells at different ratios in RPMI medium together with 1 μg/ml soluble anti‐CD3 and anti‐CD28 antibodies at 37°C. After 72 h, the cells were harvested. The suppressive activity was determined via measurement of the CSFE dilution by flow cytometry.
Flow cytometry
Prior to FACS analysis, T cells were restimulated with 50 ng/ml PMA and 750 ng/ml ionomycin in the presence of 10 μg/ml brefeldin A (all substances were purchased from Sigma‐Aldrich) for 4 h. For flow cytometry analysis, single‐cell suspensions were stained with the following antibodies: anti‐CD4 (RM4‐5, 1:300, lot no. B268264) and anti‐CD8 (53–6.7, 1:300, lot no. B268252). After fixation with 2% formaldehyde and permeabilization, cells were stained with anti‐IL‐17A (12‐7177‐81, 1:300, lot no. 2422187) and anti‐IFN‐γ (17‐7311‐82, 1:500, lot no. B335088). All antibodies were purchased from BioLegend or eBioscience. For intracellular staining of the transcription factor Foxp3, cells were treated with Foxp3 Fixation/Permeabilization Buffer Set (Thermo Fisher Scientific) and stained with anti‐Foxp3 antibody (12‐5773‐82, 1:300, lot no. 2344844). For detection of mitochondrial ROS, the cultured T cells were harvested, washed with PBS, and resuspended in PBS with mitoSOX Red (Thermo Fisher Scientific). The stained cells were examined using FACSCalibur cytometer or BD FACSAria III cell sorter (both BD Biosciences). Data were analyzed with FlowJo analysis software (TreeStar). The gating strategy for the FACS analysis of Th17 cells is provided in Fig EV5.
Figure EV5. Gating strategy for detection of Th17 cells.
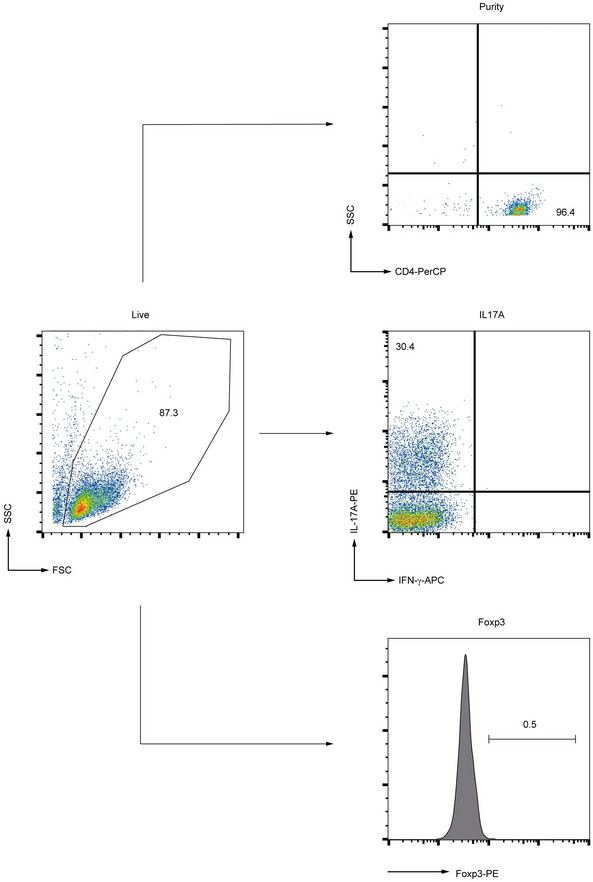
Gating strategy used for flow cytometry analysis of Th17 cells. The purity of CD4+ T cells, as well as IL‐17A frequency and Foxp3 expression, is displayed.
Measurement of OCR
CD4+ T cells were differentiated into Th17 cells and the measurement of oxygen consumption rate (OCR) was performed using a Seahorse Extracellular Flux Analyzer XF96 (Agilent). During the assay, wells containing 5 × 10⁵ lymphocytes/well in RPMI medium were sequentially injected with oligomycin (1 μM), FCCP (0.5 μM), and antimycin A/rotenone (1 μM) (all substances from Cayman Chemicals). For the measurement of the spare respiratory capacity (SRC), the difference between OCR values between OCR with FCCP and basal OCR was used.
Elisa
For measuring secreted IL‐2, murine CD4+ T cells were differentiated under Th17‐inducing conditions in the presence or absence of sodium lactate, and then, culture supernatants were collected. The secretion of IL‐2 was detected by ELISA (Biolegend) according to the manufacturer's instructions. Absorbance was measured using a FLUOstar Omega microplate reader (BMG Labtech).
Histone extraction
Cells were pelleted and washed with ice‐cold PBS, and subsequently supplemented with 5 mM sodium butyrate (Sigma‐Aldrich) in order to inhibit HDACs. Cells were then suspended in Triton X‐100 extraction buffer at a cell density of 107 cells/ml. After 20 min of incubation under rotation at 4°C, intact nuclei were spun down for 10 min at 9.600 g at 4°C. The supernatant was discarded and the pellet washed again with half the volume of extraction buffer and spun down. The pellet was then resuspended in 200 mM HCl at a cell density of 4 × 10⁷/ml, then incubated overnight under rotation at 4°C. The next day, the debris was pelleted for 10 min at 16.200 g at 4°C, and the histone‐containing supernatant was collected into a fresh tube and neutralized with 1/5 of the volume with 1 M NaOH.
Western blot
For immunoblotting, histone extracts were obtained from in vitro generated T cells and macrophages, and subsequently, SDS–PAGE was performed following the measurement of protein concentration and denaturation in 6 × Laemmli Buffer. Proteins were then transferred to a PVDF‐membrane and incubated with primary antibodies overnight. For the analysis of histone lactylation and acetylation, anti‐pan‐Kla (PTM‐1401, PTM BIO, lot no. K082701), anti‐H3K18la (PTM‐1406, PTM BIO, lot no. ZT599K825P8) and anti‐acetyl‐H3 (06‐599, Merck Millipore, lot no. 3430601) were used, respectively. As a loading control for protein samples, a monoclonal anti‐H3 antibody (ab12079, abcam, lot no. GR3282442‐1) was applied.
ChIP–qPCR and ChIP‐seq analysis
Murine T cells were differentiated under Th17 conditions for 24 h and treated with vehicle or 25 mM sodium lactate. ChIP was conducted essentially as described (Unger et al, 2018). Briefly, cells were fixated with formaldehyde and then harvested and washed two times with ice‐cold PBS, then resuspended in 1 ml ChIP lysis buffer I (5 mM PIPES pH 8.0, 85 mM KCl, 0.5% (v/v) NP40) and incubated on ice for 20 min. The pellets were then incubated in 1 ml ChIP lysis buffer II (10 mM Tris–HCl pH 7.5, 150 mM NaCl, 1% (v/v) NP40, 1% (w/v) sodium deoxycholate, 0.1% (w/v) SDS, 1 mM EDTA) on ice for 10 min. Chromatin was sheared using an ultrasound disintegrator. Preclearing was performed with 100 μl of IgG‐linked blocked protein A sepharose (45 min, 4°C, rotator). A 1% aliquot of each sample was taken as input. Per 2 μg antibody, 220 μl of soluble chromatin was used and immune precipitation was performed. A 50 μl of blocked protein A sepharose per sample was added and incubated for 1 h at 4°C. The beads were then washed with wash buffer I (20 mM Tris–pH 8.1, 150 NaCl, 1% (v/v) Triton X‐100, 0.1% SDS, 2 mM EDTA), wash buffer II (20 mM Tris–pH 8.1, 500 mM NaCl, 1% Triton X‐100, 0.1 SDS, 2 mM EDTA) and wash buffer III (10 mM Tris–pH 8.1, 250 mM LiCl, 1% NP40, 1% sodium deoxycholate, 1 mM EDTA) and kept on ice. Afterward, the samples were washed with Tris buffer (Qiagen EB). Elution was performed by adding 200 μl elution buffer (0.1 M NaHCO3, 1% SDS), and then, the samples were incubated for 20 min on a shaker. The samples were then de‐crosslinked by adding 16 μl of de‐crosslinking buffer and incubated at 65°C overnight. A 2.2 ml of binding buffer was added, and then, the samples were run over a DNA binding column (Qiagen). Elution was performed with 2 × 30–50 μl elution buffer EB. Following purification, DNA was amplified using the following primers: Arg1 promoter fw CCCGAGTTTGACCCGAAGAA, rv CTTTACACAGGGACCGGACC; Foxp3 promoter fw CAATTATCAGCACACACACTCATC, rv GCAGACCTCGCTCTTCTAATAATC. For ChIP‐seq sequencing libraries were prepared with the MicroPlex Library Preparation Kit v2 from Diagenode and sequenced on an Illumina NextSeq 550 device. For ChIP‐seq data analysis, reads were mapped to the GRCh38 (mm10) assembly using bwa mem and piped into samtools to generate sorted BAM output. Heatmaps were generated with deeptools. Peaks were called by MACS2 with the broad option. Genes closest to peaks gained after lactate treatment were identified with R code. KEGG‐pathway analysis was performed using DAVID.
RNA sequencing
Total RNA was purified from in vitro generated, lactate‐treated murine Th17 cells using the EXTRACT ME total RNA kit (blirt). The purified RNA was quality‐controlled, sequencing libraries were prepared with the Illumina TruSeq stranded mRNA kit and sequenced on an Illumina NextSeq 550 device. Reads were aligned to the genome of Mus musculus revision GRCm39 (mm39) with Qiagen CLC workbench v.10.0. Counts were calculated and normalized to one million mapped exonic reads (transcripts per million, TPM). Sets of differentially expressed genes were calculated with DESeq2. Only genes with a maximum of 0.1 adjusted P‐value were considered as significantly regulated. The KEGG‐Pathway Database was used for the pathway enrichment analysis. The transcriptional signature of murine Th17 cells and Tregs was previously published (Ciofani et al, 2012; Hasan et al, 2019; Zemmour et al, 2021).
Statistical analysis
Statistical analyses were performed using the two‐tailed Student's t‐test (Prism 8.0, GraphPad). Results were expressed as the mean ± s.e.m., and P‐values of < 0.05 were considered significant. During the analysis, no blinding or randomization was done.
Author contributions
Aleksandra Lopez Krol: Conceptualization; software; formal analysis; supervision; investigation; methodology; writing – original draft; writing – review and editing. Hannah P Nehring: Investigation; methodology. Felix F Krause: Investigation; methodology. Anne Wempe: Investigation; methodology. Hartmann Raifer: Data curation; software; investigation; methodology. Andrea Nist: Resources; data curation; software; formal analysis; investigation; methodology. Thorsten Stiewe: Resources; data curation; software; validation; investigation; methodology. Wilhelm Bertrams: Resources; data curation; software; validation; investigation; visualization. Bernd Schmeck: Resources; software; supervision; validation; methodology. Maik Luu: Investigation; methodology. Hanna Leister: Data curation; software; supervision; investigation; methodology. Ho‐Ryun Chung: Resources; data curation; software; supervision; validation; visualization; methodology. Uta‐Maria Bauer: Resources; data curation; formal analysis; supervision; validation; methodology. Till Adhikary: Resources; data curation; software; supervision; investigation; methodology; writing – original draft. Alexander Visekruna: Conceptualization; data curation; supervision; funding acquisition; writing – original draft; writing – review and editing.
Disclosure and competing interest statement
The authors declare that they have no conflict of interest.
Supporting information
Expanded View Figures PDF
Source Data for Expanded View
Source Data for Figure 4
PDF+
Acknowledgements
The authors are grateful to Anne Hellhund and Dr. Caroline Bouchard for their excellent technical expertise. The authors also thank the members of the Animal Core Facility, Philipps‐University of Marburg. The authors thank Ho‐Ryun Chung and Till Adhikary for performing bioinformatics analyses. This study was supported by research grants from the DFG (grants VI562/7‐1 and VI 562/10‐1 to A.V.). This work has been additionally funded in part by the Bundesministerium für Bildung und Forschung (Federal Ministry of Education and Research, ERACoSysMed2—SysMed‐COPD—FKZ 031L0140), the Deutsche Forschungsgemeinschaft (SFB/TR‐84 TP C01), the von‐Behring‐Röntgen‐Stiftung (66‐LV07), and the Hessisches Ministerium für Wissenschaft und Kunst (LOEWE Diffusible Signals) to B.S.
EMBO reports (2022) 23: e54685
Data availability
RNA‐ and ChIP‐sequencing data have been deposited at NCBI GEO under accession numbers GSE193358 (https://www.ncbi.nlm.nih.gov/geo/query/acc.cgi?acc=GSE193358) and GSE208727 (https://www.ncbi.nlm.nih.gov/geo/query/acc.cgi?acc=GSE208727), respectively.
References
- Angelin A, Gil‐de‐Gomez L, Dahiya S, Jiao J, Guo L, Levine MH, Wang Z, Quinn WJ 3rd, Kopinski PK, Wang L et al (2017) Foxp3 reprograms T cell metabolism to function in low‐glucose, high‐lactate environments. Cell Metab 25: 1282–1293.e7 [DOI] [PMC free article] [PubMed] [Google Scholar]
- Buck MD, O'Sullivan D, Pearce EL (2015) T cell metabolism drives immunity. J Exp Med 212: 1345–1360 [DOI] [PMC free article] [PubMed] [Google Scholar]
- Buck MD, Sowell RT, Kaech SM, Pearce EL (2017) Metabolic instruction of immunity. Cell 169: 570–586 [DOI] [PMC free article] [PubMed] [Google Scholar]
- Certo M, Tsai CH, Pucino V, Ho PC, Mauro C (2021) Lactate modulation of immune responses in inflammatory versus tumour microenvironments. Nat Rev Immunol 21: 151–161 [DOI] [PubMed] [Google Scholar]
- Chang CH, Curtis JD, Maggi LB Jr, Faubert B, Villarino AV, O'Sullivan D, Huang SC, van der Windt GJ, Blagih J, Qiu J et al (2013) Posttranscriptional control of T cell effector function by aerobic glycolysis. Cell 153: 1239–1251 [DOI] [PMC free article] [PubMed] [Google Scholar]
- Chapman NM, Boothby MR, Chi H (2020) Metabolic coordination of T cell quiescence and activation. Nat Rev Immunol 20: 55–70 [DOI] [PubMed] [Google Scholar]
- Ciofani M, Madar A, Galan C, Sellars M, Mace K, Pauli F, Agarwal A, Huang W, Parkhurst CN, Muratet M et al (2012) A validated regulatory network for Th17 cell specification. Cell 151: 289–303 [DOI] [PMC free article] [PubMed] [Google Scholar]
- Gerriets VA, Kishton RJ, Nichols AG, Macintyre AN, Inoue M, Ilkayeva O, Winter PS, Liu X, Priyadharshini B, Slawinska ME et al (2015) Metabolic programming and PDHK1 control CD4+ T cell subsets and inflammation. J Clin Invest 125: 194–207 [DOI] [PMC free article] [PubMed] [Google Scholar]
- Haas R, Smith J, Rocher‐Ros V, Nadkarni S, Montero‐Melendez T, D'Acquisto F, Bland EJ, Bombardieri M, Pitzalis C, Perretti M et al (2015) Lactate regulates metabolic and pro‐inflammatory circuits in control of T cell migration and effector functions. PLoS Biol 13: e1002202 [DOI] [PMC free article] [PubMed] [Google Scholar]
- Hasan SN, Sharma A, Ghosh S, Hong SW, Roy‐Chowdhuri S, Im SH, Kang K, Rudra D (2019) Bcl11b prevents catastrophic autoimmunity by controlling multiple aspects of a regulatory T cell gene expression program. Sci Adv 5: eaaw0706 [DOI] [PMC free article] [PubMed] [Google Scholar]
- Hui S, Ghergurovich JM, Morscher RJ, Jang C, Teng X, Lu W, Esparza LA, Reya T, Le Z, Yanxiang Guo J et al (2017) Glucose feeds the TCA cycle via circulating lactate. Nature 551: 115–118 [DOI] [PMC free article] [PubMed] [Google Scholar]
- Khatib‐Massalha E, Bhattacharya S, Massalha H, Biram A, Golan K, Kollet O, Kumari A, Avemaria F, Petrovich‐Kopitman E, Gur‐Cohen S et al (2020) Lactate released by inflammatory bone marrow neutrophils induces their mobilization via endothelial GPR81 signaling. Nat Commun 11: 3547 [DOI] [PMC free article] [PubMed] [Google Scholar]
- Laurence A, Tato CM, Davidson TS, Kanno Y, Chen Z, Yao Z, Blank RB, Meylan F, Siegel R, Hennighausen L et al (2007) Interleukin‐2 signaling via STAT5 constrains T helper 17 cell generation. Immunity 26: 371–381 [DOI] [PubMed] [Google Scholar]
- Lee TY (2021) Lactate: a multifunctional signaling molecule. Yeungnam Univ J Med 38: 183–193 [DOI] [PMC free article] [PubMed] [Google Scholar]
- Manoharan I, Prasad PD, Thangaraju M, Manicassamy S (2021) Lactate‐dependent regulation of immune responses by dendritic cells and macrophages. Front Immunol 12: 691134 [DOI] [PMC free article] [PubMed] [Google Scholar]
- Menk AV, Scharping NE, Moreci RS, Zeng X, Guy C, Salvatore S, Bae H, Xie J, Young HA, Wendell SG et al (2018) Early TCR signaling induces rapid aerobic glycolysis enabling distinct acute T cell effector functions. Cell Rep 22: 1509–1521 [DOI] [PMC free article] [PubMed] [Google Scholar]
- Pucino V, Bombardieri M, Pitzalis C, Mauro C (2017) Lactate at the crossroads of metabolism, inflammation, and autoimmunity. Eur J Immunol 47: 14–21 [DOI] [PubMed] [Google Scholar]
- Pucino V, Certo M, Bulusu V, Cucchi D, Goldmann K, Pontarini E, Haas R, Smith J, Headland SE, Blighe K et al (2019) Lactate buildup at the site of chronic inflammation promotes disease by inducing CD4(+) T cell metabolic rewiring. Cell Metab 30: 1055–1074.e8 [DOI] [PMC free article] [PubMed] [Google Scholar]
- Pucino V, Certo M, Varricchi G, Marone G, Ursini F, Rossi FW, De Paulis A, Mauro C, Raza K, Buckley CD (2020) Metabolic checkpoints in rheumatoid arthritis. Front Physiol 11: 347 [DOI] [PMC free article] [PubMed] [Google Scholar]
- Quinn WJ 3rd, Jiao J, TeSlaa T, Stadanlick J, Wang Z, Wang L, Akimova T, Angelin A, Schafer PM, Cully MD et al (2020) Lactate limits T cell proliferation via the NAD(H) redox state. Cell Rep 33: 108500 [DOI] [PMC free article] [PubMed] [Google Scholar]
- Ratter JM, Rooijackers HMM, Hooiveld GJ, Hijmans AGM, de Galan BE, Tack CJ, Stienstra R (2018) In vitro and in vivo effects of lactate on metabolism and cytokine production of human primary PBMCs and monocytes. Front Immunol 9: 2564 [DOI] [PMC free article] [PubMed] [Google Scholar]
- Rundqvist H, Velica P, Barbieri L, Gameiro PA, Bargiela D, Gojkovic M, Mijwel S, Reitzner SM, Wulliman D, Ahlstedt E et al (2020) Cytotoxic T‐cells mediate exercise‐induced reductions in tumor growth. Elife 9: e59996 [DOI] [PMC free article] [PubMed] [Google Scholar]
- Sena LA, Li S, Jairaman A, Prakriya M, Ezponda T, Hildeman DA, Wang CR, Schumacker PT, Licht JD, Perlman H et al (2013) Mitochondria are required for antigen‐specific T cell activation through reactive oxygen species signaling. Immunity 38: 225–236 [DOI] [PMC free article] [PubMed] [Google Scholar]
- Shapiro VS, Mollenauer MN, Greene WC, Weiss A (1996) c‐rel regulation of IL‐2 gene expression may be mediated through activation of AP‐1. J Exp Med 184: 1663–1669 [DOI] [PMC free article] [PubMed] [Google Scholar]
- Shyer JA, Flavell RA, Bailis W (2020) Metabolic signaling in T cells. Cell Res 30: 649–659 [DOI] [PMC free article] [PubMed] [Google Scholar]
- Unger A, Finkernagel F, Hoffmann N, Neuhaus F, Joos B, Nist A, Stiewe T, Visekruna A, Wagner U, Reinartz S et al (2018) Chromatin binding of c‐REL and p65 is not limiting for macrophage IL12B transcription during immediate suppression by ovarian carcinoma ascites. Front Immunol 9: 1425 [DOI] [PMC free article] [PubMed] [Google Scholar]
- Vegran F, Boidot R, Michiels C, Sonveaux P, Feron O (2011) Lactate influx through the endothelial cell monocarboxylate transporter MCT1 supports an NF‐kappaB/IL‐8 pathway that drives tumor angiogenesis. Cancer Res 71: 2550–2560 [DOI] [PubMed] [Google Scholar]
- Wang ZH, Peng WB, Zhang P, Yang XP, Zhou Q (2021) Lactate in the tumour microenvironment: From immune modulation to therapy. EBioMedicine 73: 103627 [DOI] [PMC free article] [PubMed] [Google Scholar]
- Zemmour D, Charbonnier LM, Leon J, Six E, Keles S, Delville M, Benamar M, Baris S, Zuber J, Chen K et al (2021) Single‐cell analysis of FOXP3 deficiencies in humans and mice unmasks intrinsic and extrinsic CD4(+) T cell perturbations. Nat Immunol 22: 607–619 [DOI] [PMC free article] [PubMed] [Google Scholar]
- Zhang D, Tang Z, Huang H, Zhou G, Cui C, Weng Y, Liu W, Kim S, Lee S, Perez‐Neut M et al (2019) Metabolic regulation of gene expression by histone lactylation. Nature 574: 575–580 [DOI] [PMC free article] [PubMed] [Google Scholar]


