Abstract
Advances in multiplexed in situ imaging are revealing important insights in spatial biology. However, cell type identification remains a major challenge in imaging analysis, with most existing methods involving substantial manual assessment and subjective decisions for thousands of cells. We developed an unsupervised machine learning algorithm, CELESTA, which identifies the cell type of each cell, individually, using the cell’s marker expression profile and, when needed, its spatial information. We demonstrate the performance of CELESTA on multiplexed immunofluorescence images of colorectal cancer and head and neck squamous cell carcinoma (HNSCC). Using the cell types identified by CELESTA, we identify tissue architecture associated with lymph node metastasis in HNSCC, and validate our findings in an independent cohort. By coupling our spatial analysis with single-cell RNA-sequencing data on proximal sections of the same specimens, we identify cell–cell crosstalk associated with lymph node metastasis, demonstrating the power of CELESTA to facilitate identification of clinically relevant interactions.
Spatial biology provides unprecedented characterization of tissue architectures through technological advances in multiplexed in situ imaging platforms1–6. Using these platforms, specific tissue architectures have been associated with tissue development and disease progression to improve treatment response7–10. For in situ image analysis, pixel-based data are often segmented into individual cells whose cell type needs to be identified. Current cell type identification methods typically involve manual gating or clustering. Manual gating is subjective, and unmanageable with high-dimensional data11,12. Clustering cells with similar marker expressions can be biased by numerous factors including the choice of the number of clusters. Even after clustering, a cluster’s cell type assignment can be subjective, particularly for clusters that are mixtures of cell types13. Hence, even clustering requires manual assessment, preferably by an expert pathologist. Given their subjective nature, use of clustering and manual assessment for cell type identification cannot be robustly evaluated.
To address the limitations, we developed an unsupervised machine learning cell type identification method called CELESTA (CELl typE identification with SpaTiAl information), which does not involve manual gating or clustering and instead leverages the marker expressions and spatial information of cells with minimal user dependence. CELESTA is a robust and fast (on the order of minutes) algorithm for cell type identification that assigns individual cells to their most probable cell types through an optimization framework leveraging prior knowledge in a transparent manner.
We demonstrate CELESTA’s performance on data generated using the CODEX (CO-Detection by indEXing) platform14,15. CODEX is an immunofluorescence-based imaging technology that can quantify more than 50 proteins, across tens of thousands of cells in a tissue slice. To evaluate CELESTA’s performance against extant methods, we applied CELESTA to a published CODEX dataset generated on colorectal cancer samples for which cell type identification was based on clustering and manual assessment by a pathologist, and which we adopted as the gold standard6. CELESTA provides cell type assignments comparable to the gold standard, in a manner that can be robustly evaluated.
We applied CELESTA to identify tissue architectures associated with lymph node metastasis in head and neck squamous cell carcinoma (HNSCC) using CODEX images from primary samples associated with (N+) and without (N0) lymph node metastasis. We identified cell types that are co-localized more extensively in N+ than in N0 HSNCC, and validated our findings using tissue microarray (TMA) analysis from an independent cohort. By coupling our spatial analysis with single-cell RNA-sequencing (scRNA-seq) data on proximal sections of the imaged specimens, we identified cell–cell crosstalk associated with node status, demonstrating the power of CELESTA to facilitate biological discovery.
Results
Overview of CELESTA.
A typical image analysis pipeline often starts with segmenting pixel-based images into cells followed by cell type identification and spatial analysis (Fig. 1a). CELESTA first assigns cell types to cells whose marker expressions match prior knowledge of cell type marker expressions; these cells are defined as ‘anchor cells’. Remaining cells, whose marker expressions do not clearly associate with a cell type, are referred to as ‘non-anchor cells’. For each non-anchor cell, CELESTA uses the cell’s neighboring cell type information, in addition to the cell’s marker expressions, to identify the cell type. Because cells are organized in coherent spatial patterns, we reason that spatial location is valuable information in additional to marker expressions to infer cell type. To test this assumption, we performed cell neighborhood enrichment analysis using a published permutation strategy16 on the annotations of a public CODEX dataset6 and demonstrate that cells with the same or similar cell types are enriched among each other’s nearest neighbors (Extended Data Fig. 1a). CELESTA uses an iterative optimization framework to assign cell types for non-anchor cells (Fig. 1b,c).
Fig. 1 |. Image analysis pipeline with CELESTA.
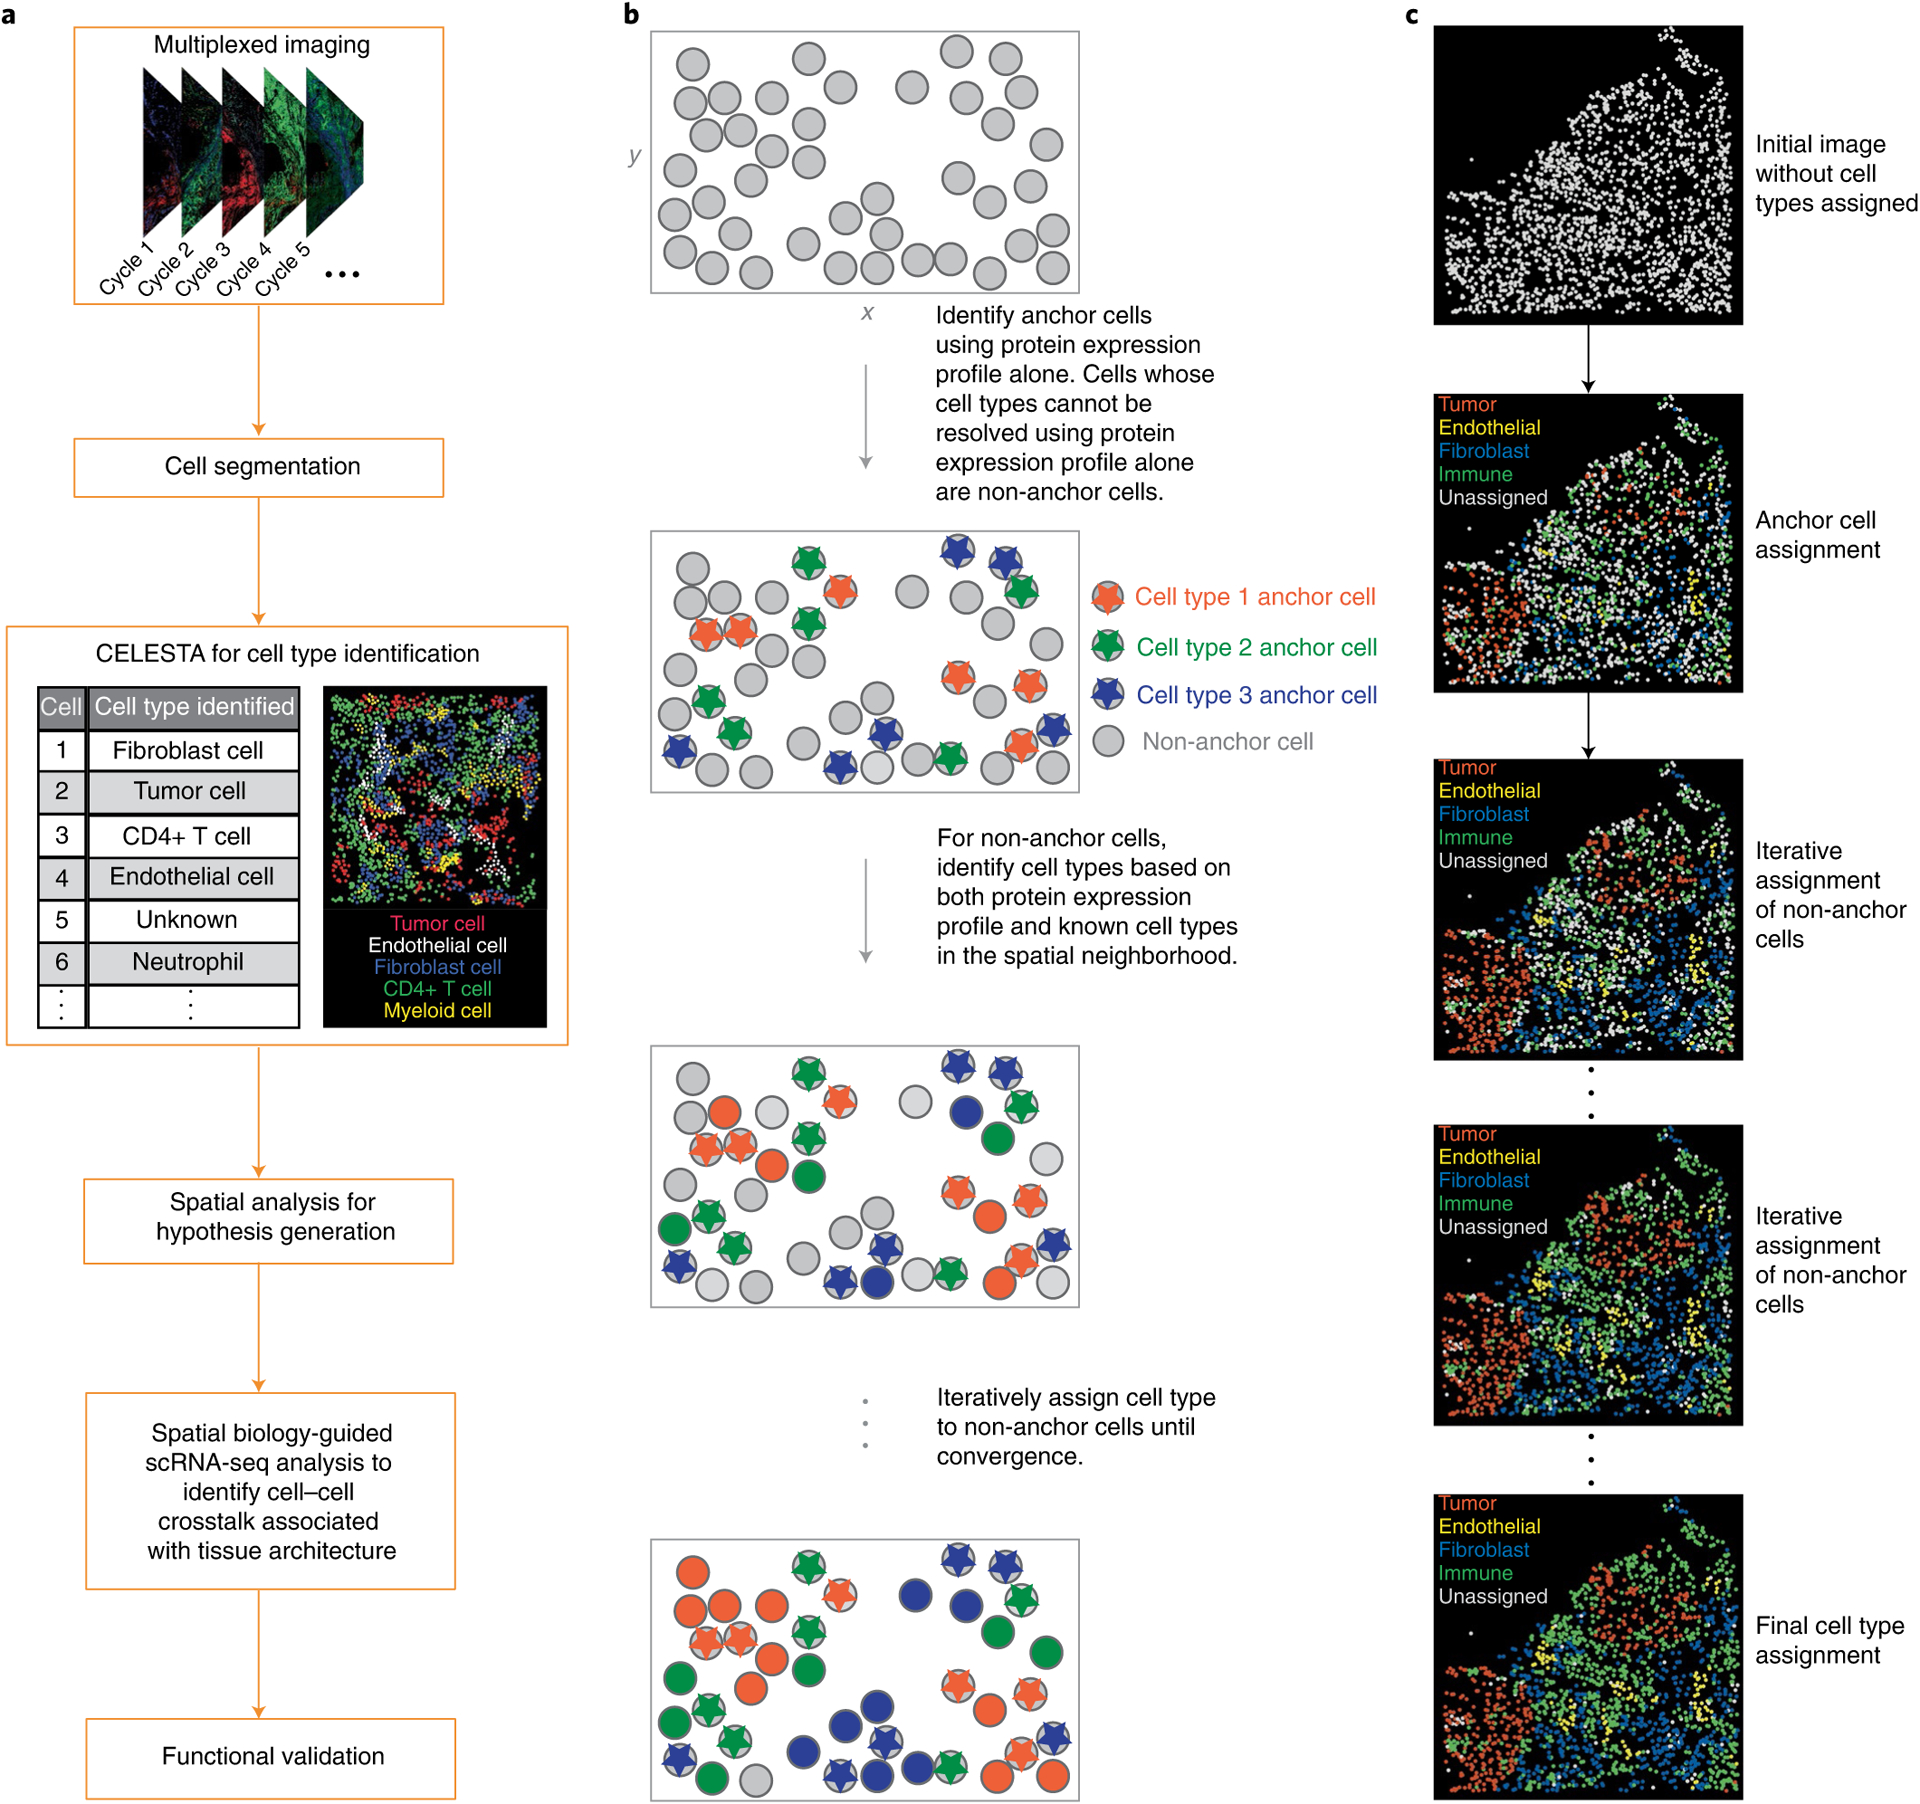
a, Typical analysis pipeline for multiplexed in situ image data. b, Schematic diagram illustrating the iterative process in CELESTA’s cell type assignment. c, In CELESTA’s cell type assignment, the cell types are assigned to an image tile in which each dot represents a single cell and is positioned on the cell’s centroid.
CELESTA (Fig. 2a) requires two main inputs. The first input is an image segmented into individual cells. Each cell is defined by its marker expressions and spatial location (Fig. 2b). CELESTA determines whether a marker is over- or under-expressed in a given cell by fitting a two-mode Gaussian mixture model to the marker expression distribution (Extended Data Fig. 1b) derived from the cells in a sample17. CELESTA converts marker expression into a probability using a sigmoid function, in which the expression levels are scaled between 0 and 1 and the midpoint is the intersection of two-mode Gaussian distributions.
Fig. 2 |. overview of CELESTA.
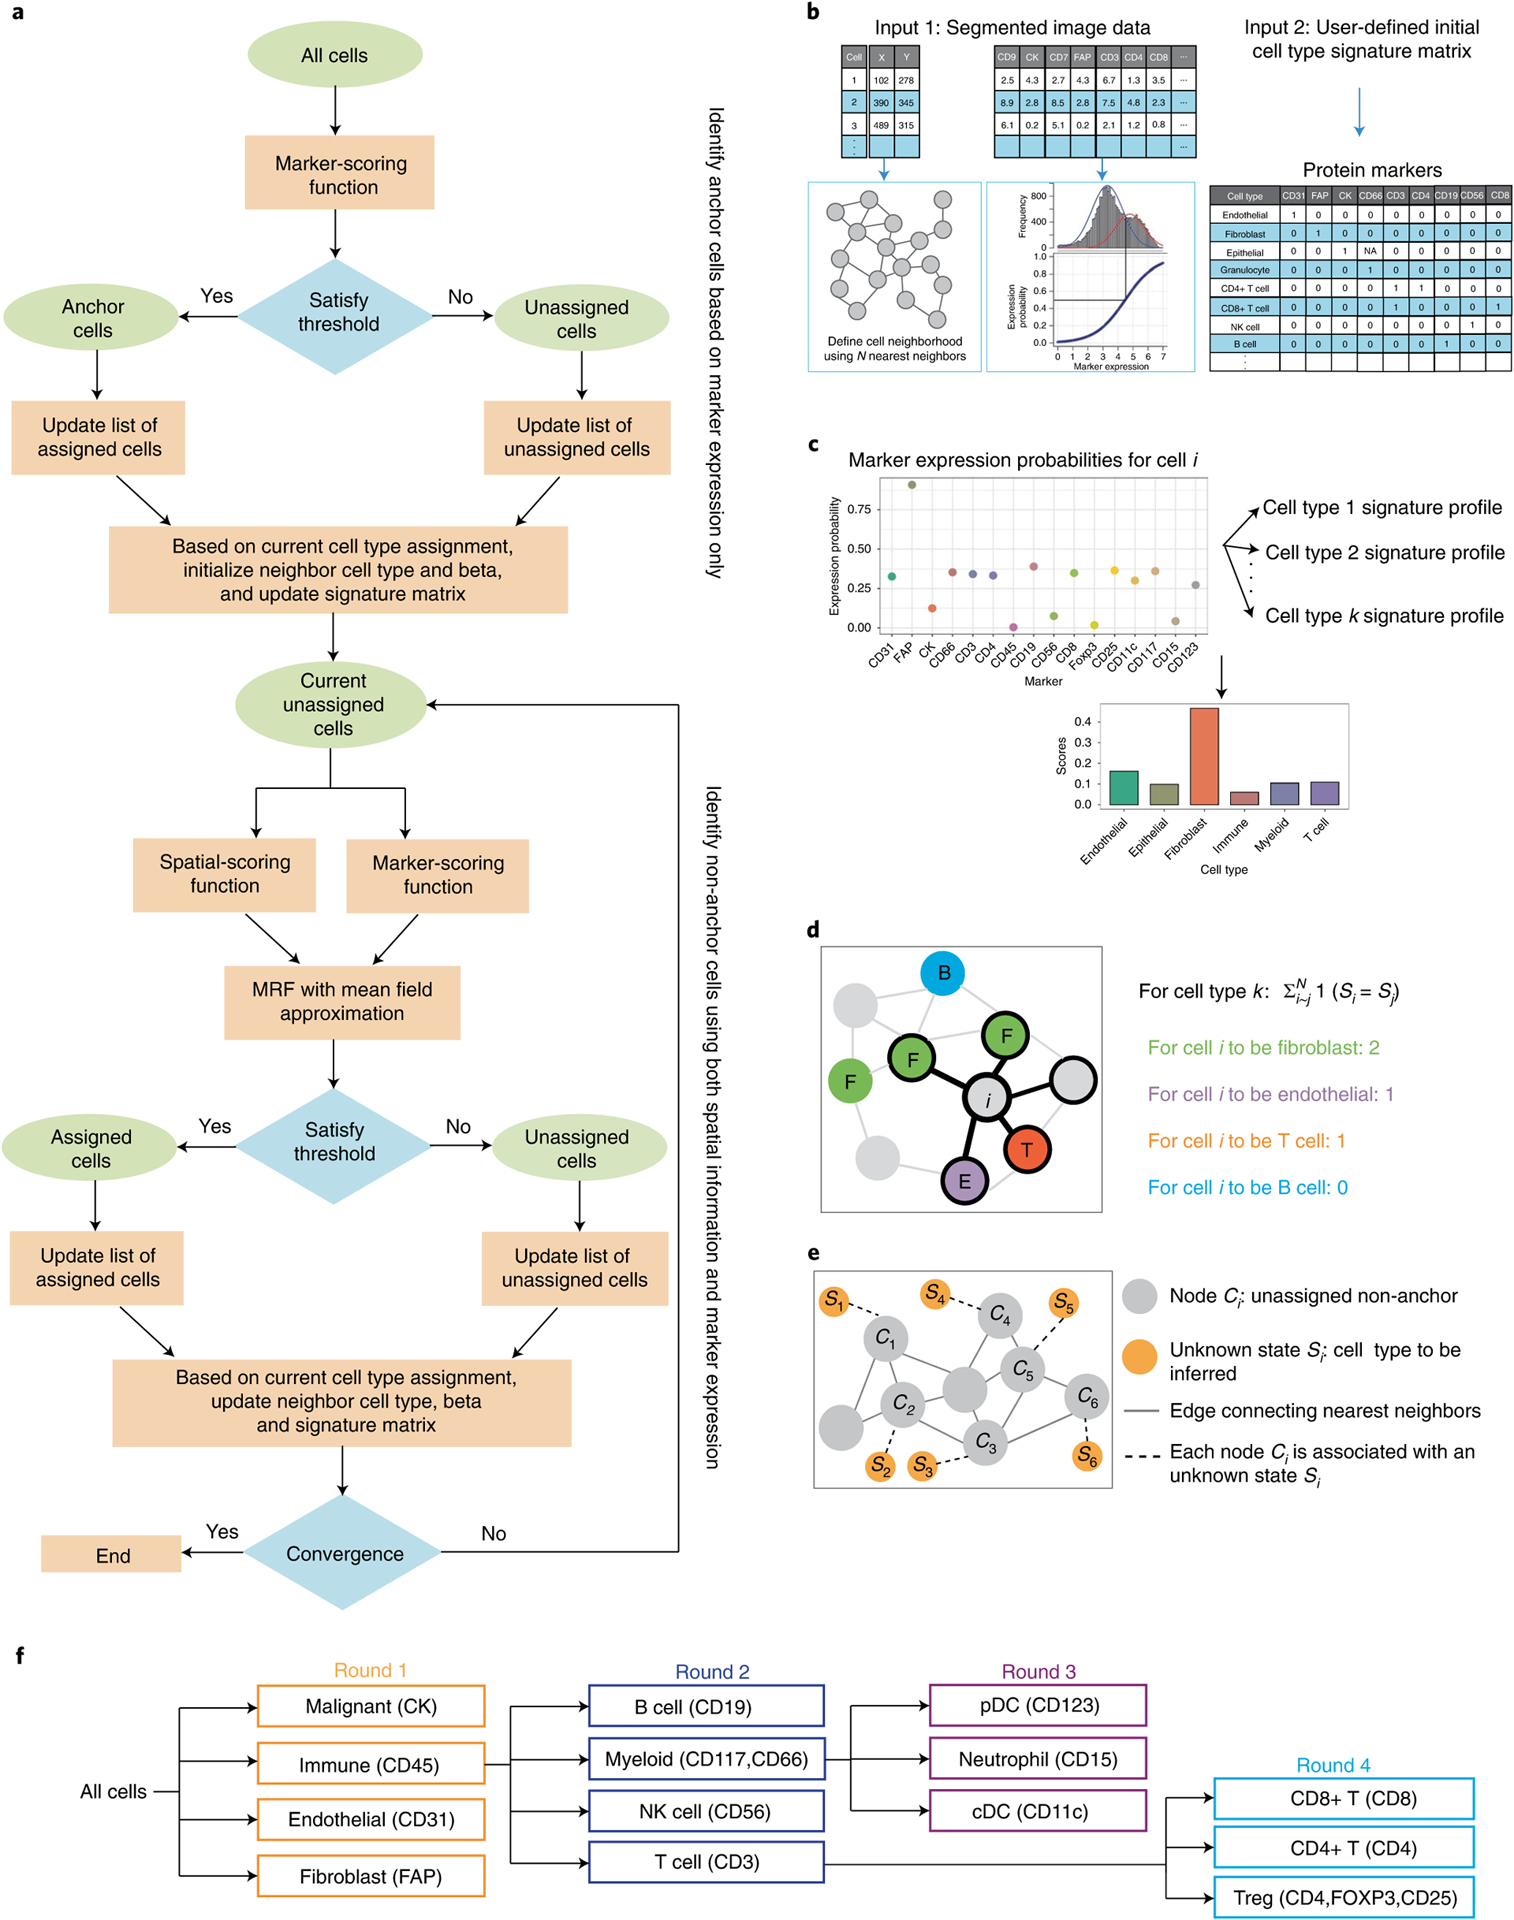
a, CELESTA flowchart. b, CELESTA’s inputs and preprocessing steps. c, Illustration of CELESTA’s marker-scoring function. d, Illustration of CELESTA’s spatial-scoring function, using spatial neighborhood information for each non-anchor cell i. The cell type information from the spatially nearest neighboring cells of cell i is derived using the energy function of the Potts model. e, Each non-anchor cell Ci is associated with an unknown state Si, which is the cell type to be inferred. Cells are represented as nodes in an undirected graph with edges connecting N nearest spatial neighbors. The joint distribution of S is assumed to satisfy a discrete Markov random field. f, Illustration of the cell type resolution strategy used by CELESTA, based on the HNSCC imaging panel markers (in parentheses). cDC, conventional dendritic cell; CK, cytokeratin; MRF, Markov random field; NK, natural killer; pDC, plasmacytoid dendritic cell. Beta used in the flowchart (a) is a vector of model parameters.
The second input to CELESTA is a cell type signature matrix that relies on prior knowledge of markers known to have high or low expression in specific cell types. For each marker the cell type signature matrix is initialized as 1 or 0 if the marker has high or low, respectively, probability of expression, for a given cell type (see Supplementary Table 1 for an example). A marker is denoted as ‘NA’ if it is considered irrelevant for cell type identification. The cell type signature matrix is updated as more cells are assigned (see Extended Data Fig. 1c for an example of a final cell type signature matrix).
For the initial cell type assignment, CELESTA matches a cell’s marker expression probability profile to the cell type signatures using a marker-scoring function (Fig. 2c). When a cell has one dominant cell type score, CELESTA assigns the corresponding cell type to that cell and defines it as an ‘anchor cell’. For a cell whose cell type cannot be identified using marker expressions alone (‘non-anchor cell’), CELESTA leverages cell type information from its N nearest spatial neighbors (Fig. 2d) using a spatial-scoring function that utilizes the Potts model energy function. The Potts model has been used for image segmentation18–20, as a clustering method on spatial transcriptomics data21 and for the analysis of pathological images22. Using both the spatial-scoring and marker-scoring function, CELESTA represents each non-anchor cell as a node in an undirected graph with edges connecting to its N nearest neighbors. CELESTA associates each node with a hidden state, which is the cell type to be inferred, and assumes that the joint distribution of the hidden states satisfies a discrete Markov random field (Fig. 2e). To maximize the joint probability function, CELESTA uses a pseudo-expectation–maximization algorithm (an expectation–maximization-like algorithm) with a mean field approximation23. In each iteration, if the thresholds are met, cell types with maximum probabilities are assigned to the non-anchor cells. If the marker expressions and the spatial information still do not pass the threshold for a cell type assignment, CELESTA re-evaluates the cell on the next iteration as additional neighboring cells have been assigned. The process is repeated until a user-defined convergence threshold is met, whereupon unassigned cells are labeled as ‘unknown’.
Incorporation of cell lineage.
CELESTA introduces a cell type resolution strategy whereby cell type assignment is performed in multiple rounds, in which cell type resolution is increased in each round based on known cell lineages (Fig. 2f). This strategy reduces computational complexity and improves robustness when cell types from different lineages share marker expressions. The pseudocode for CELESTA is provided in Supplementary Note 1.
Performance of CELESTA.
We assessed the performance of CELESTA on a public CODEX dataset generated from a colorectal cancer TMA6. In this dataset, the cell type assignments, which we regard as our benchmark, were based on clustering24 and manual assessment by a pathologist using marker expressions and cell morphology features from hematoxylin–eosin images. CELESTA assignments were comparable to this benchmark (Fig. 3a). The number of cells for each cell type was highly correlated between CELESTA and benchmarked annotations (Fig. 3b,c). Using the benchmarked annotations as ground truth, CELESTA achieved average accuracy scores (Rand index) of around 0.9, average precisions between 0.6 and 0.8, and F1 scores between 0.6 and 0.7 across the major cell types (Fig. 3d). For rare populations, CELESTA achieved average precision and F1 scores between 0.4 and 0.6. Noteworthy, there are two clusters assigned as cell type mixtures in the benchmarked annotations (Fig. 3e,f); for the cells in these two clusters, CELESTA-assigned cell types were consistent with canonical marker expression patterns.
Fig. 3 |. CELESTA applied to a published CodEX dataset generated from a TMA of colorectal cancer primary samples (Schürch et al.6).
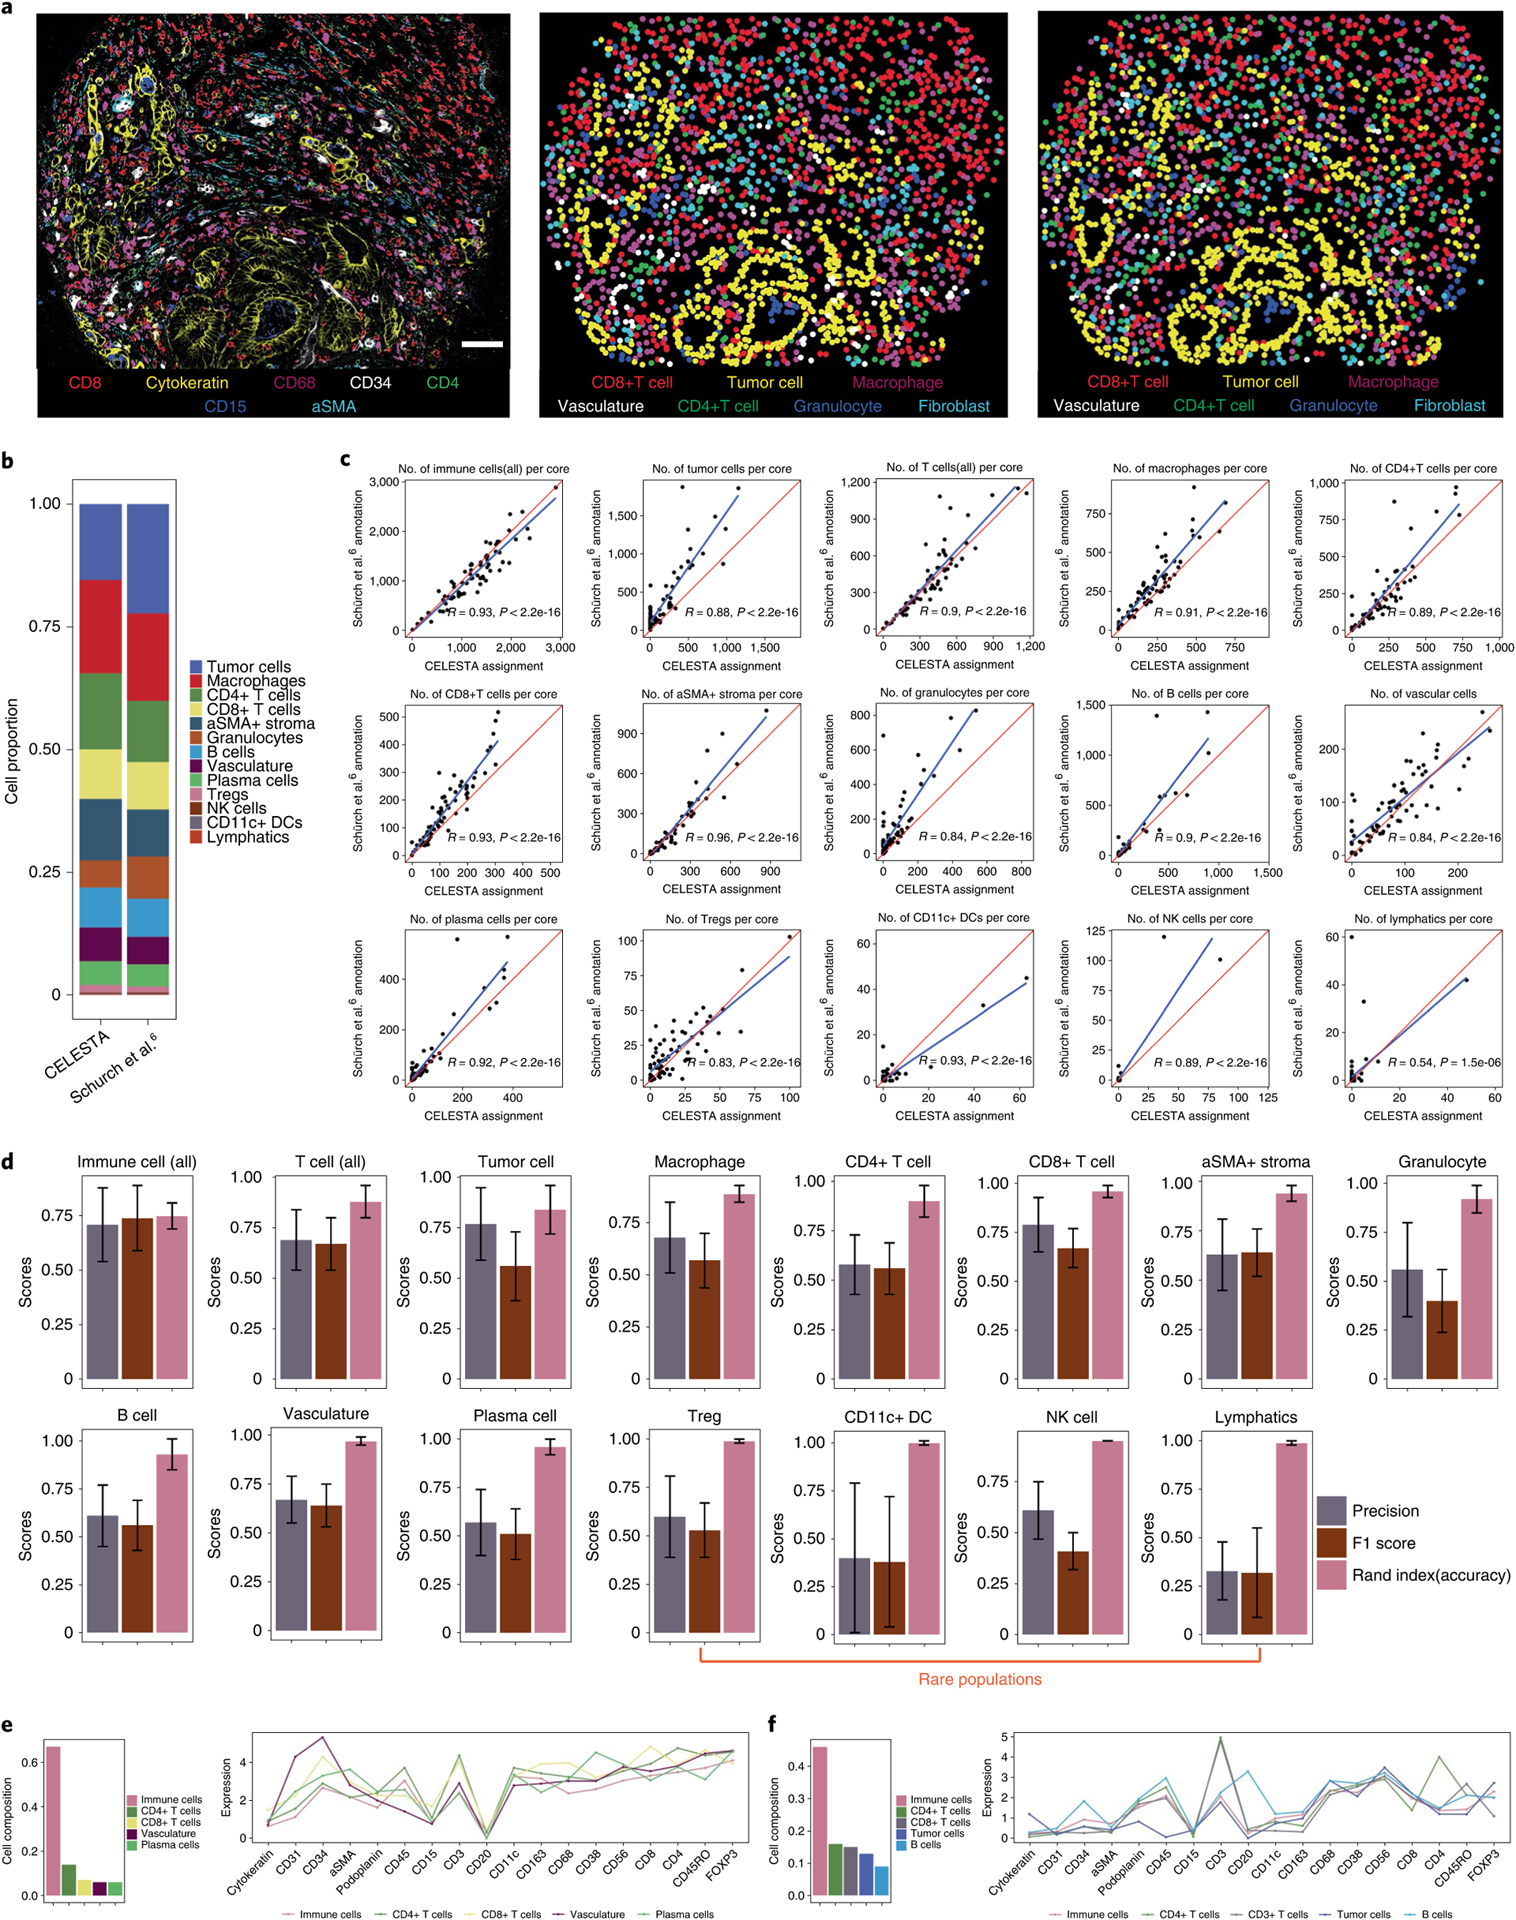
a, Representative TMA core with seven-channel overlay CODEX image (left), image using CELESTA-assigned cell types (middle) and image using annotated cell types from Schürch et al.6 (right). Scale bar, 50 μm. b, Cell type composition from CELESTA-assigned cell types versus annotations from Schürch et al.6, across the 70 cores of the entire TMA. c, Correlations between the number of cells identified, per TMA core across 70 cores, between the CELESTA and Schürch et al.6 annotations, for each cell type. The red line indicates a perfect correlation (slope = 1) and the blue line is the linear fit between the CELESTA-identified cell types and the Schürch et al.6 annotations. R represents the Pearson correlation coefficient. d, Precision score, F1 score and accuracy (Rand index) score for the major cell types identified by CELESTA using the Schürch et al.6 annotations as the ground truth. Error bars are calculated using s.d. across all of the cores (n = 70) as independent samples; the center of the error bars indicates the mean. A cell type is defined as rare if it has, on average, fewer than 100 cells per core. e,f, CELESTA cell type assignments for a cluster that Schürch et al.6 annotated as a mixture of vasculature or immune cells (e) and as a mixture of tumor or immune cells (f). CELESTA cell type compositions are shown in the left panels and the average canonical marker expressions for each cell type in the cluster are shown in the right panels. aSMA, alpha-smooth muscle actin.
To evaluate the mismatched assignments, we built a confusion matrix comparing the cell types between CELESTA and benchmarked assignments (Extended Data Fig. 2). Although there is high agreement between CELESTA and the benchmark annotations for most cell types, we found that tumor cells assigned in the benchmarked annotations but not by CELESTA expressed low to no cytokeratin, which is the tumor-specific marker defined in CELESTA’s cell type signature matrix. CELESTA assigned the majority (around 80%) of these cells to the unknown category (Extended Data Fig. 2). It is possible that cell morphology from the hematoxylin–eosin images was used to identify low-cytokeratin-expressing malignant cells in the benchmark dataset. Although the benchmarked annotations included morphological features, CELESTA does not use morphology in its current implementation.
We evaluated the robustness of CELESTA’s performance on the benchmark dataset. We tested the cell type signature matrix with a leave-one-out strategy to demonstrate that CELESTA has a low rate of misclassification (Extended Data Fig. 3). We tested the cell type resolution strategy, and performed sensitivity tests against user-defined parameters (Extended Data Figs. 3,4 and Supplementary Note 2).
Comparison of CELESTA to clustering methods.
We compared CELESTA with two clustering methods, namely FlowSOM25 and flowMeans26, which are commonly used on mass cytometry data27. For each clustering method we varied the number of clusters (20, 30 and 50) and had two independent annotators manually assign cluster cell types (Extended Data Fig. 5). Between the two annotators, around 60% of the clusters had matched annotations. Compared with CELESTA, both annotators labeled more cells as ‘unknown’ cell type, and CELESTA had better F1 scores, especially for the rare populations (Supplementary Note 3).
CELESTA applied to primary HNSCC tumors imaged by CODEX.
We generated a cohort of eight primary HNSCC tumors with four node-positive (N+) and four node-negative (N0) samples (Supplementary Table 2). We performed CODEX imaging using 52 markers (Supplementary Table 3) and assigned cell types with CELESTA (Supplementary Table 4). We manually assessed CELESTA’s performance by mapping assigned cell types onto the original images using canonical marker staining. We showed qualitatively that the CELESTA-assigned cell types matched well with marker staining (Fig. 4a,b and Extended Data Figs. 6,7). We evaluated cell type composition from CELESTA with paired scRNA-seq data derived on proximal tissue sections, for four samples. Although CELESTA cell type compositions were correlated with scRNA-seq compositions (Fig. 4c), differences may arise because tissue dissociation28 in scRNA-seq data could cause immune cells to be over-enriched.
Fig. 4 |. CELESTA applied to CodEX data generated from fresh-frozen HNSCC primary tumor samples.
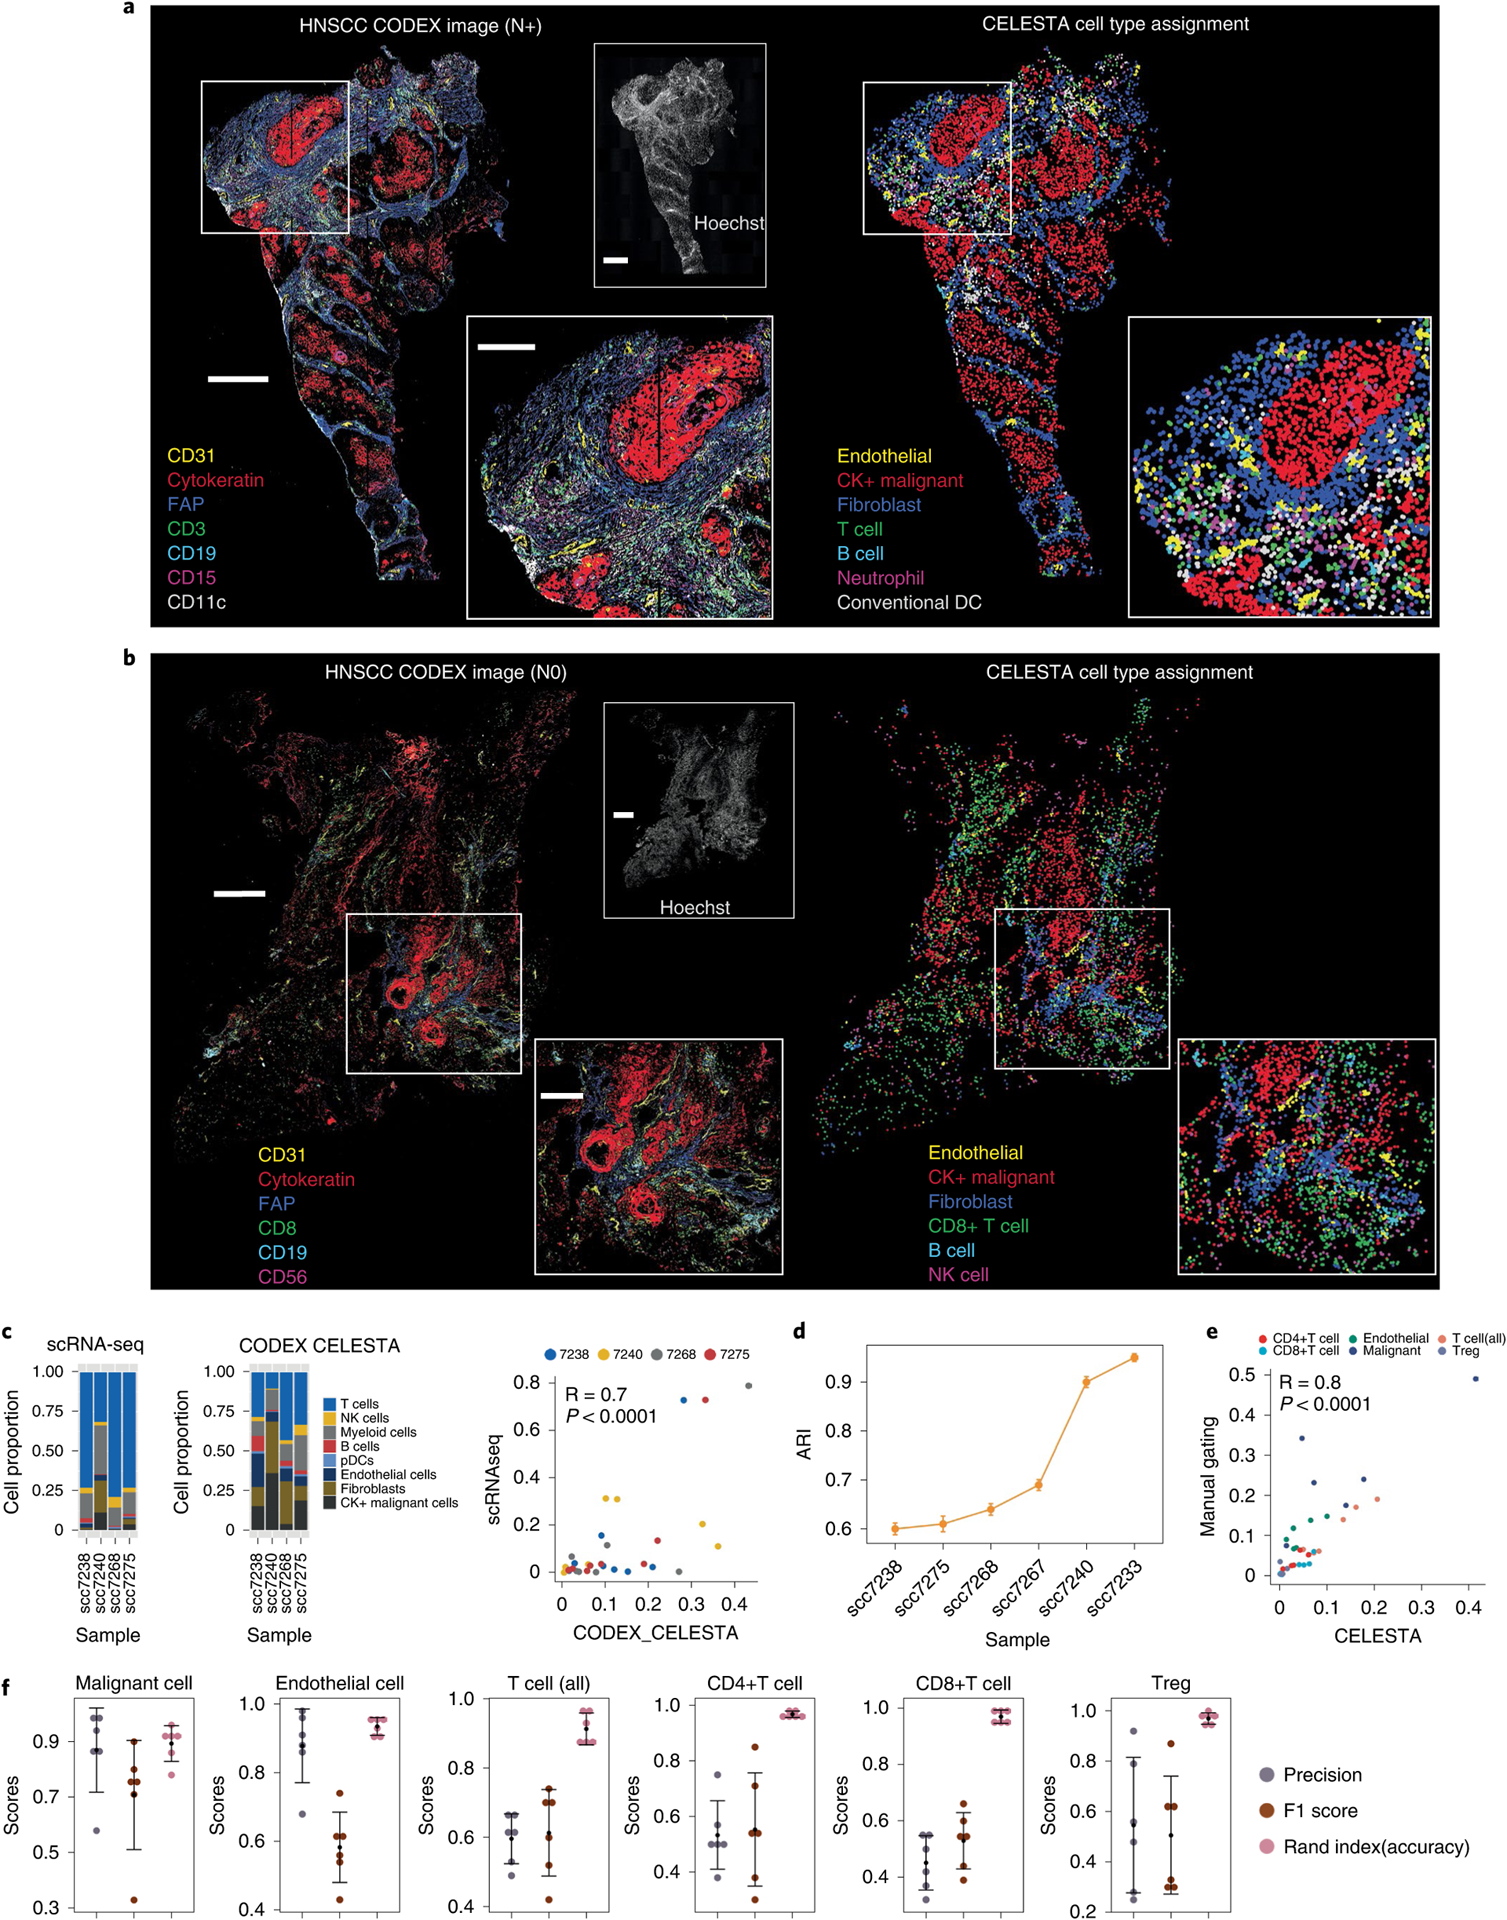
a,b, CODEX image overlay (left) and CELESTA (right) for a primary tumor HNSCC sample associated with lymph node metastasis (N+) (a) and not associated with lymph node metastasis (N0) (b). Scale bars: main image and Hoechst stain, 200 μm; inset, 100 μm. c, Cell type compositions from scRNA-seq data (left) and CELESTA-inferred cell types on CODEX data (middle), by HNSCC patient sample. Paired scRNA-seq and CODEX data were generated on proximal tissue sections from four patient samples. The graph on the right shows the correlation (Pearson correlation test) between CELESTA-inferred cell compositions and scRNA-seq cell compositions on the same four samples. d, Adjusted Rand index (ARI) to assess the performance of CELESTA against manual gating for each HNSCC sample. Error bars indicate the s.d. calculated based on 50 runs of random sampling, and the center of the error bars indicates the mean. e, Correlation (Pearson correlation test) between CELESTA-inferred cell compositions and manual gating compositions. f, Cell type precision score, F1 score and accuracy score (Rand index), across six independent samples, for six cell types. Error bars are calculated using s.d., and the center of the error bars indicates the mean. CK, cytokeratin; NK, natural killer.
We applied manual gating as a benchmark to quantitatively evaluate CELESTA’s performance. We designed a gating strategy focusing on cell types relevant for downstream analysis (Extended Data Fig. 8). Compared with gating, CELESTA achieved an adjusted Rand index of between 0.6 and 0.9 (Fig. 4d). Due to imaging artifacts and lower tissue quality, cell type identification was more difficult in some samples. In terms of cell type compositions, CELESTA and gating were highly correlated (Fig. 4e). CELESTA achieved average F1 scores of around 0.7 and accuracy scores of around 0.9 for malignant, endothelial and T cells (Fig. 4f). For T cell subtypes, CELESTA achieved average F1 scores of around 0.55 (Fig. 4f).
Spatial biology enabled by CELESTA.
We performed spatial analysis on our HSNCC cohort using CELESTA-identified cell types. We adapted the co-location quotient29 used in geospatial statistics to quantify spatial co-localization between pairs of cell types, and tested whether there were differential pairwise cell type co-localization patterns in N+ versus N0 HNSCC (Fig. 5a). We identified four pairs of cell types that were significantly more co-localized in N+ than in N0 HNSCC on two-sided Student’s t-test (Fig. 5b), namely malignant cells and T-regulatory cells (Tregs) (P = 0.038), CD4+ T cells and endothelial cells (P = 0.027), CD8+ T cells and CD4+ T cells (P = 0.049), and CD4+ T cells with themselves (P = 0.014) (Fig. 5c). Representative CODEX images show that FOXP3 (a Treg marker) is more co-localized with cytokeratin (tumor marker) staining, and that CD4 and CD8 (T cell markers) are more co-localized with CD31 (endothelial marker) staining, in N+ than in N0 HNSCC (Fig. 5d,e). To validate the hypothesis of co-localization of Tregs and malignant cells in N+ HNSCC, we stained FOXP3 and cytokeratin on a TMA from an independent HNSCC cohort. Representative TMA images show a stronger co-localization of malignant cells and Tregs in N+ than in N0 samples (Fig. 5f), and N+ HNSCCs have significantly higher density correlations between cytokeratin and FOXP3 than N0 HNSCCs (P = 0.011, two-sided Student’s t-test) (Fig. 5g).
Fig. 5 |. Spatial pairwise cell type co-localization analysis based on CELESTA-identified cell types in the HNSCC study cohort.
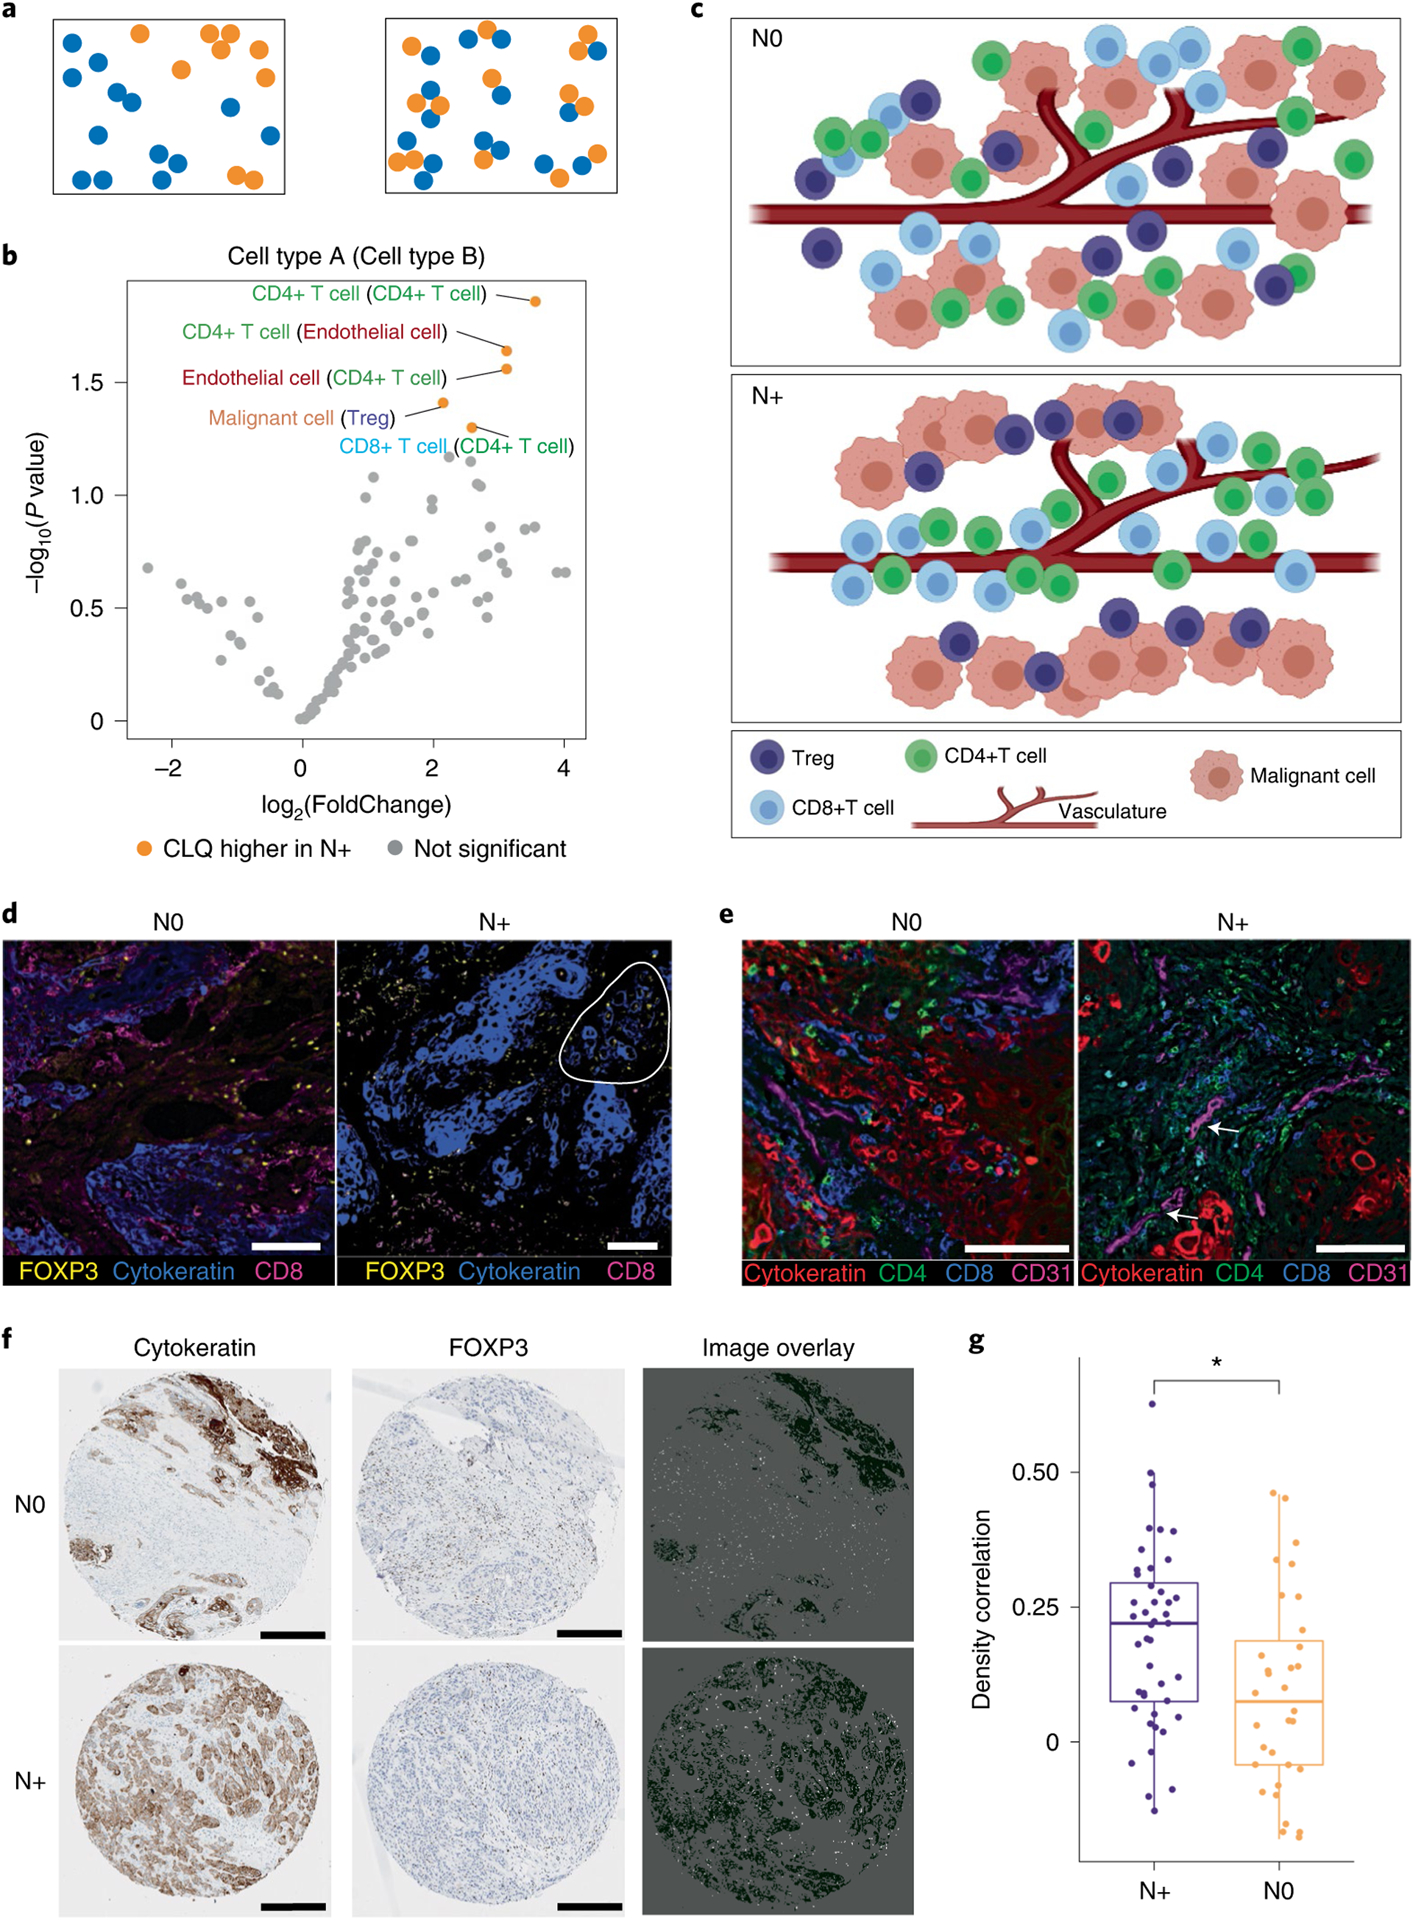
a, Schematic representation of two different pairwise cell type spatial patterns: low pairwise cell type co-localization (left) and high pairwise cell type co-localization (right). b, Differential pairwise cell type co-location quotients (CLQs) when comparing N+ (n = 4) versus N0 (n = 4) HNSCC samples. Volcano plot based on nominal P values from two-sided Student’s t-test. c, Graphical illustration of inferred spatial architectural differences of cell–cell co-localizations in N0 samples (top) versus N+ samples (bottom). Created with BioRender.com. d, Representative regions of an N0 sample (left) and N+ sample (right) shown as three-color overlay images. Circled region in the right panel highlights a region with high co-localization of malignant and Treg cells in the N+ sample. Scale bars, 50 μm (0.4 μm per pixel). e, Representative regions for an N0 sample (left) and N+ sample (right) shown as four-color overlay images. The arrows highlight the regions in the right panel with high co-localization of endothelial and T cells in the N+ sample. Scale bars, 50 μm (0.4 μm per pixel). f, Representative HNSCC TMA cores for N0 and N+ patients shown as overlay images with cytokeratin and FOXP3 staining. Each TMA core is approximately 1 mm in diameter. Scale bars, 0.25 mm. g, Density correlation analysis shows that cytokeratin and Foxp3 expression have a higher density correlation in N+ patients (n = 44) than in N0 patients (n = 32) in an independent TMA cohort of HNSCC primary samples (P = 0.011, two-sided Student’s t-test). The center line of the box plot represents the median, the whiskers represent 1.5-fold the interquartile range, and the upper and lower ends of the box plot indicate the 75th and 25th percentiles, respectively. *P < 0.05.
Spatially guided scRNA-seq analysis.
Because crosstalk between cells may be associated with physical proximity30,31, we sought co-localization patterns to guide the discovery of cell–cell crosstalk associated with node status. We leveraged HNSCC scRNA-seq data generated on specimens proximal to the imaged specimens (Fig. 6a) and analyzed using Seurat32,33. We identified a malignant cluster (Cluster 11) in which CXCL10, a chemokine ligand, was more expressed on N+ than on N0 HNSCC (Fig. 6b,c). We identified a Treg-enriched cluster (Cluster2) based on FOXP3 expression (Extended Data Fig. 9), in which CXCR3, a receptor of CXCL10, was more expressed on N+ than on N0 HNSCC (Fig. 6c). We reasoned that CXCL10–CXCR3 crosstalk between malignant cells and Tregs mediated N+ HNSCC. Evidence for this interaction was found in a public scRNA-seq HNSCC dataset34 (Extended Data Fig. 9). In a similar manner, we found that CCL20–CCR6 crosstalk is higher in N+ than in N0 HNSCC, and may mediate crosstalk between endothelial and CD4+ T cells in N+ HNSCC (Fig. 6d). Hence, following CELESTA, spatial patterns guiding scRNA-seq analysis can identify potential mediators of node status (Fig. 6e).
Fig. 6 |. scRNA-seq analysis guided by spatial biology reveals cell–cell interactions unique to primary HNSCC associated with lymph node metastasis.
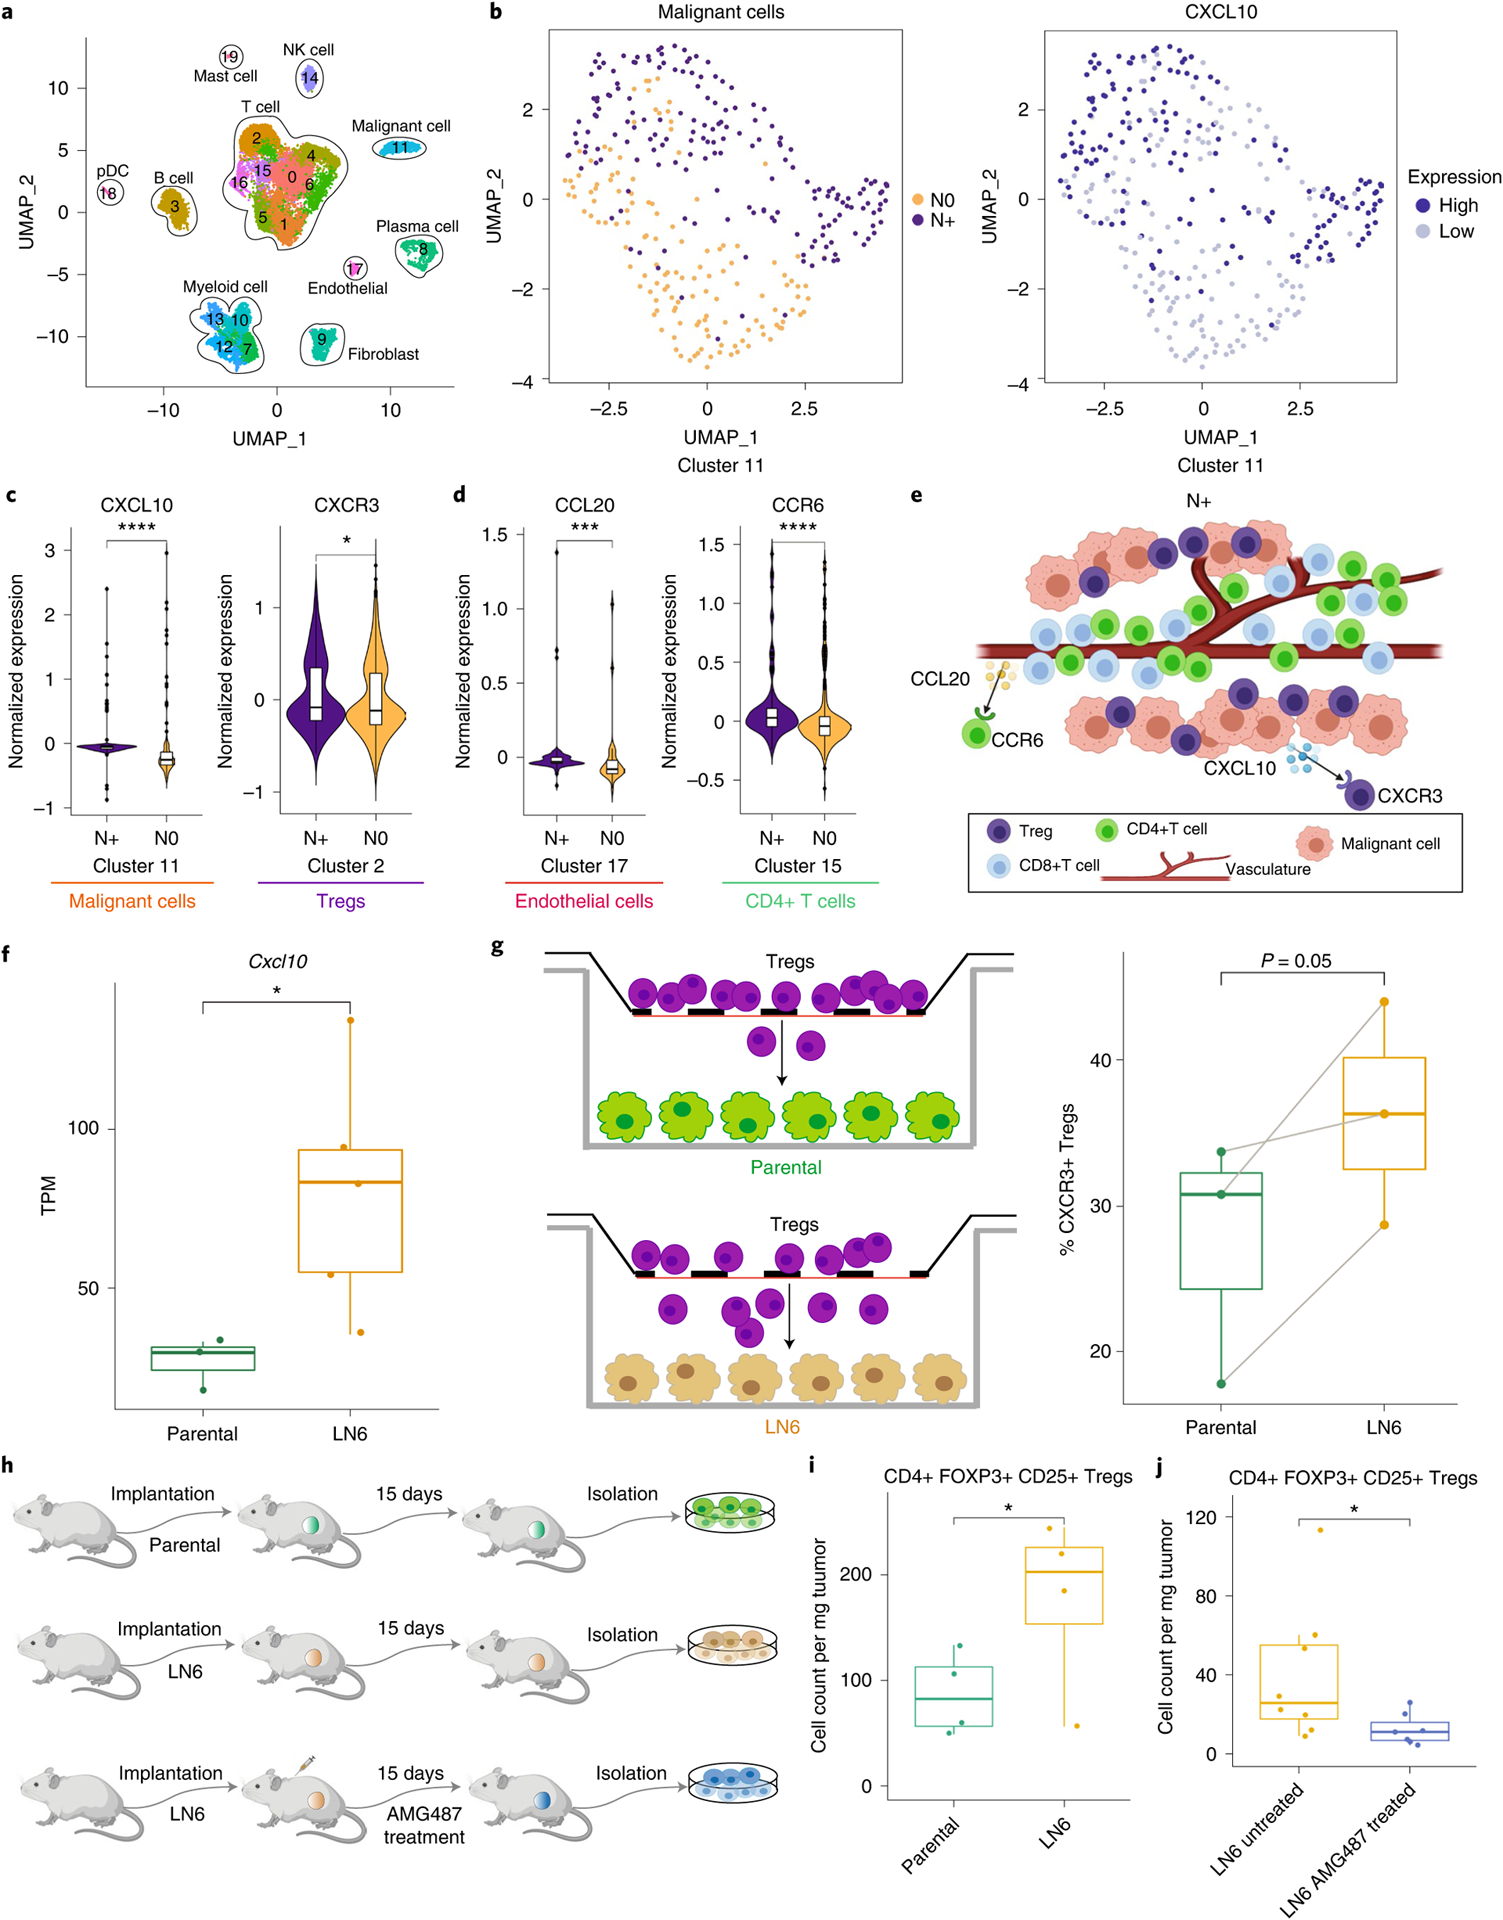
a, UMAP (Uniform Manifold Approximation and Projection; an algorithm for dimension reduction) of identified cell type clusters using HNSCC scRNA-seq data. b, UMAP of malignant cells (cluster 11) by node status (left) and CXCL10 expression (right). c,d, Violin plots showing the differential expression of CXCL10 and CXCR3 in malignant and Treg cell clusters (c) and CCL20 in an endothelial cell cluster and CCR6 in a CD4+ T cell cluster (d) between N+ (n = 2) and N0 (n = 2) samples. Differentially expressed genes were identified using SAMR (Significance Analysis of Microarrays in R) and the false discovery rate was used to adjust the P values. Violin plots show density distributions of the data. Center line of the box defines median. The white box in the center of the violin defines the interquartile range. The black line stretched above from the box defines 1.5 times interquartile range above the 75th percentile, and the black line stretched below from the box defines 1.5 times interquartile range below the 25th percentile. e, Graphical illustration showing the cell–cell crosstalk with identified chemokine ligand–receptor pairs mediating the cellular spatial co-localization in N+ samples. Created with BioRender. com. f, CXCL10 expression is significantly higher (two-sided non-parametric Wilcoxon test) in the sixth generation of a lymph node tumor cell line (LN6) in a mouse model (n = 5) than in the parental (n = 3) tumor cell lines (P = 0.036). TPM, Transcripts Per Kilobase Million. g, Transwell experiment showing that LN6 tumor cells attract more CXCR3+ Tregs through the membrane than parental tumor cell lines (paired t-test right-tailed, P = 0.05). Tregs were plated in the upper chambers; the bottom chambers were plated with either the parental cells (control group, n = 3) or LN6 cells (study group, n = 3). h, Schematic diagram of the in vivo experiments. Created with BioRender.com. i, LN6 (n = 4) tumors recruit more Tregs than parental (n = 4) tumors (paired t-test right-tailed, P = 0.034). j, AMG487 treatment significantly reduces the number of Tregs recruited into the LN6 tumors (two-sided non-parametric Wilcoxon test, P = 0.029). Untreated samples, n = 8, and treated samples, n = 7. The center line of the box plot defines the median, the top whisker indicates the largest value within 1.5-fold the interquartile range from the 75th percentile, the bottom whisker indicates the smallest value within 1.5-fold the interquartile range below the 25th percentile, and the upper and lower bounds of the box indicate the 75th and 25th percentiles, respectively. *adjusted P < 0.05, **adjusted P < 0.01, ***adjusted P < 0.005, ****adjusted P < 0.001.
Functional validation of CXCL10–CXCR3 crosstalk.
To validate the association of CXCL10–CXCR3 crosstalk between malignant cells and Tregs with node status, we leveraged a murine model of lymph node metastasis35 developed for melanoma. In this model, we created multiple generations of lymph node metastatic cell lines (LN1–LN6), with each generation exhibiting increased frequency of lymph node metastases. RNA sequencing showed that later generations (LN6) expressed significantly higher CXCL10 than the parental line (P = 0.036, Wilcoxon signed-rank test) (Fig. 6f).
We tested the hypothesis that CXCR3+ Tregs are more attracted to CXCL10+ malignant cells in a transwell experiment in which we found that LN6 cells induced more migration of CXCR3+ Tregs than parental cells (Fig. 6g and Extended Data Fig. 10). This finding supports the hypothesis that CXCR3–CXCL10 crosstalk promotes Treg migration toward lymph node-tropic malignant cells. Given the existence of an antagonist AMG487 blocking CXCR3 (refs36–38), we compared the migration of Tregs into parental tumor versus LN6 tumor with and without AMG487 treatment in vivo (Fig. 6h). We found that LN6 tumors recruited more Tregs than the parental tumors (Fig. 6i). Following AMG487 treatment on LN6 tumors, the number of Tregs recruited into the tumor was reduced (Fig. 6j).
Discussion
Spatial biology is a new frontier that has become accessible through advances in multiplexed in situ imaging. Exploring this frontier often involves converting pixel-based images into an interpretable cell-based format. This poses numerous technical challenges, among which is cell type identification. We developed CELESTA, an unsupervised machine learning method, for facilitating cell type identification on multiplexed images. CELESTA can process a tissue sample with 100,000 cells in the order of minutes on a typical laptop.
CELESTA has several important features. To determine whether a marker expression is high or low in a cell in a more reproducible manner than commonly used methods, CELESTA converts a marker expression into a probability of expression and allows the user to identify a threshold of high versus low expression. CELESTA leverages neighborhood enrichment, which is ignored in common cell type identification methods. Using a benchmark image dataset, however, we show that cells with the same cell types are enriched in each other’s nearest spatial neighborhoods. Because CELESTA is not based on manual gating or clustering and instead assigns the cell type to individual cells based on probabilities, it preserves single-cell resolution in cell type assignments. CELESTA uses a cell type resolution strategy that incorporates cell lineage information to improve computational speed and robustness. Users define the inputs required by CELESTA, and the effect of these inputs can be transparently evaluated through sensitivity analyses. Although our current analysis prioritized accuracy over the number of cells classified, the users can choose the parameters that trade-off accuracy and quantity of cells classified. We applied CELESTA to images generated on CODEX, but CELESTA could also be extended to other imaging platforms.
CELESTA still has several limitations. CELESTA requires segmented cells as input and thereby relies on the performance of the segmentation algorithm. For rare cell types, because their neighborhoods could be enriched with a different cell type with larger abundance, we recommend using smaller neighborhood sizes (5 cells or less). Technical artifacts from the imaging platform could add noise to the marker expression39,40; in such cases, some manual intervention may still be needed after CELESTA’s fast assessment. CELESTA relies on markers in the user-defined initial cell type signature matrix. A poorly informed initial cell type signature matrix will negatively affect the results, as would the mislabeling of a cell cluster. In addition, too few anchor cells assigned for a cell type may not provide sufficient spatial information to identify non-anchor cells for that cell type. Currently, CELESTA does not account for morphological features. Future additions to improve CELESTA could include morphological features for each cell.
After using CELESTA for cell type identification in HNSCC imaging, we performed spatial analysis by adapting a geospatial statistic and identified cell type pair co-localizations of primary HNSCC associated with node status. Integrating this analysis with tissue-proximal scRNA-seq data, we identified CXCL10 and CXCR3 as having higher expression in malignant cells and Tregs, respectively, in N+ than in N0 HNSCC. This implicates CXCL10–CXCR3 crosstalk in the mediation of HNSCC lymph node metastasis, and supports prior work associating CXCL10–CXCR3 crosstalk with T cell trafficking and metastasis41,42. Using an antagonist of CXCR3 to reduce Treg tumor infiltration, we show that the CXCL10–CXCR3 axis is a potential therapeutic target. Our integrative spatial and scRNA-seq analysis also identified the CCR6–CCL20 axis as mediating immune–endothelial crosstalk in node-positive disease, which is consistent with prior work associating this interaction with cancer progression43–45.
In summary, we propose CELESTA as a fast and robust cell type identification method for multiplexed in situ images. Using CELESTA, we demonstrate the power of spatial biology to guide the discovery of clinically relevant cell–cell interactions.
Methods
CELESTA.
Marker-scoring function.
The marker-scoring function assesses how well a cell’s marker expression profile matches the cell type markers defined by the cell type signature matrix. To apply the marker-scoring function, we first need to quantify whether a marker has high or low expression in a cell. We apply a two-mode Gaussian mixture model to fit each marker’s expressions across the cells in a sample:
| (1) |
where M is total number of markers, xm is the expression across cells for marker m, ϕ is the mixing probabilities that sum up to 1, μ is the mean and Σ is the variance. Assuming that a marker with high expression is in state a = 1 and a marker with low expression is in state a = 0, the posterior distribution for a marker with high expression is p(a = 1|xm) and that for a marker with low expression is p(a = 0|xm). At the decision boundary we have:
| (2) |
Using Bayes’ theorem:
| (3) |
where p (xm|a = 1) = g(xm|μ1, Σ1) and p (xm|a = 0) = g(xm|μ0, Σ0). p (a = 1) and p (a = 0) are the mixing probabilities ϕ1 and ϕ0. By solving equation 3, we identify the decision critical point xc at which a marker has equal probability of high versus low expression. We use a logistic function to quantify a marker expression probability (EP) for each marker in each cell as:
| (4) |
We repeat the process for every marker; thus, for each cell, every marker expression is converted into a probability of marker expression scaled between 0 and 1. Next, we define the cell type score F for a cell i and cell type k as 1 minus the mean squared error between cell i’s marker expression probability profile and the marker reference profile in the cell type signature matrix for cell type k normalized for all cell types as follows:
| (5) |
where M is total number of markers, EP is the expression probability and SP is the reference probability in the cell type signature matrix. For each cell i we calculate the scores for each cell type k for k = 1, …, K, where K is the total number of cell types in the cell type signature matrix in a resolution round. When a cell has one dominant cell type score that satisfies the cell type probability threshold, and the cell’s marker expression probability satisfies the high and low expression probability thresholds for that cell type, CELESTA assigns the corresponding cell type to that cell and defines it as an anchor cell. For example, by setting the cell type probability threshold as 0.5 and the high and low expression probability thresholds as 0.7 and 0.3, for a cell to be a tumor cell it needs have a marker score of 0.5 or greater in equation 5. In addition, it needs to have a cytokeratin expression probability of 0.7 or greater, and the marker expression probability for all other measured markers needs to be 0.3 or lower. The high and low thresholds for expression probability provide the user with the flexibility to reduce artifacts due to, for example, doublets or noise from non-specific staining. Once the anchor cells are identified, the cell type signature matrix is updated to represent the average marker probabilities of the anchor cells. The cell type signature matrix becomes updated as non-anchor cells are assigned to specific cell types.
Markov random field.
For the cells whose marker expression probability profile is ambiguous (non-anchor cells), CELESTA is designed to maximize the joint probability distribution using a Markov random field46 that includes a spatial-scoring function component to account for cell spatial information and a marker-scoring function component to account for the marker expression profile. For non-anchor cells, we assume each cell i is a node in an undirected graph and each cell has connected neighboring cells that are stochastically dependent. We model the stochastic spatial dependency defined on the undirected graph G with the edges connecting each cell to its N nearest neighboring cells. Based on the sensitivity analysis, we recommend N = 5–10. We associate each node with an unknown state S, which is the cell type to be inferred. The spatial dependency is modeled by a hidden Markov random field with joint probability distribution:
| (6) |
where I is the total number of unassigned cells after anchor cell assignment, β is a set of model parameters to be estimated, W(β) is a normalization constant, F is the marker-scoring function and E is the spatial-scoring function defined next.
Spatial-scoring function.
We use the Potts model energy function defined as:
| (7) |
where N is the number of nearest spatial neighboring cells of cell i based on the x and y coordinates of the cells obtained from the image. Each time a neighbor cell j has cell type k, the energy function is increased by 1 for the cell type k. For each non-anchor cell i, we calculate the spatial scores for each cell type k based on its neighborhood cell types. β is a set of model parameters that captures the distances between cells. β is used to decide how much information to include from the neighboring cells, and is defined as a triangular kernel multiplied by a scale factor γ as follows:
| (8) |
where dik is the distance between unassigned cell i and its nearest cell that has cell type k assigned, and h is a user-defined bandwidth. γ is set at 5. The closer a cell i to its nearest cell assigned to cell type k, the higher the βik. If there are no cells of cell type k assigned within distance h to the unassigned cell, no neighborhood information from cell type k is used. A cell could be isolated if it is too far away from other cells with cell types identified.
Optimization of objective function for cell type identification.
Because our objective function in equation 6 is non-convex, we use a pseudo-expectation–maximization algorithm to iteratively solve it. For each unassigned cell, we approximate the probability of cell type k for an unassigned cell i using a mean field approximation by:
| (9) |
where K is the total number of cell types in the cell type signature matrix. If multiple rounds are used with the cell type resolution strategy, K is the total number of cell types in a round. For each cell i, the probabilities for all of the cell types K should sum up to 1. Essentially, we approximate the probabilities of each cell type for cell i and assign the cell type with the highest probability provided that the cell type probability threshold is satisfied. For example, if there are four cell types defined in a round, this probability threshold should be set higher than 0.25. We recommend that this threshold value is no greater than 0.5, otherwise it could result in too many unassigned cells. If the cell type probabilities do not pass the threshold then no cell type is assigned for that cell in the current iteration and the cell is carried over to the next iteration. In the following iterations, as more cell types are assigned, that cell may have increased neighborhood information. After each iteration we update the cell type signature matrix β and the neighborhood cell types based on the newly assigned cells. The algorithm converges when the percentage of additional assigned cells is smaller than a user-defined threshold. The default convergence threshold is 1%. After convergence a cell is assigned to the ‘unknown’ category if it has not been assigned with a cell type.
Human tumor specimens.
All patients from Stanford Hospital who were included in the study gave consent to take part in the study with no participant compensation following Institutional Review Board (IRB) approval (IRB protocol no. 11402). The patient information is summarized in Supplementary Table 2. Fresh HNSCC tissue was collected within 6 h after surgical resection. A 2–3 mm piece of tissue was cut from the sample. Samples from patients 7153 and 7155 were immediately frozen in OCT (optimal cutting temperature) freezing media, while the other samples were placed in 30% sucrose for 1 h at 4 °C and frozen in OCT freezing media (Fisher Healthcare) on a metal block chilled in liquid nitrogen. The OCT samples were stored at −80 °C for CODEX processing and sequencing. The remaining tissue was placed on ice and processed in 50 μl tissue digestion media (DMEM-F12+ with magnesium and calcium (Corning Cellgro), 1%FBS (heat inactivated), 10 units ml−1 Penicillin–10 μg ml−1 Streptomycin (Gibco), 25 mM HEPES (Gibco)).
CODEX image acquisition and segmentation.
Multiplexed CODEX analysis of HNSCC samples was performed using а panel of antibodies (Supplementary Table 3) conjugated to custom DNA barcodes and detector oligos and common buffers, with a robotic imaging setup, according to the instructions for CODEX staining of frozen specimens from Akoya Biosciences (https://www.akoyabio.com/). The 7 μm sections were cut with a cryostat after the OCT blocks were equilibrated to the cryostat temperature for at least 30–40 min. Tissue sections were placed on the surface of cold poly-l-lysine-coated coverslips and adhered by touching a finger to the bottom surface to transiently warm up the coverslip. Frozen sections on coverslips can be stored at −70 °C for 1–2 months. Prior to staining the sections, frozen sections removed from the freezer were dried for 5 min on the surface of Drierite. Dried coverslips with sections on them were dipped for 10 min into room temperature acetone, then fully dried for 10 min at room temperature (20 °C). Sections were then rehydrated for 5 min in S1 (5 mM EDTA (Sigma), 0.5% w/v BSA (Sigma)) and 0.02% w/v NaN3 (Sigma) in PBS (Thermo Fisher Scientific), then fixed for 20 min at room temperature (20 °C) in S1 with 1.6% formaldehyde. Formaldehyde was rinsed off twice with S1. Sections were equilibrated in S2 (61 mM Na2HPO4 • 7H2O (Sigma)), 39 mM Na2HPO4 (Sigma) and 250 mM NaCl (Sigma) in a 1:0.7 v/v solution of S1 and doubly distilled H2O (ddH2O) with a final pH of 6.8–7.0 for 10 min, and placed in blocking buffer for 30 min. All steps followed the Akoya CODEX instructions. Automated image acquisition and fluidics exchange were performed using an Akoya CODEX instrument driven by CODEX driver software and a Keyence BZ-X710 fluorescent microscope configured with four fluorescent channels (DAPI, FITC, Cy3, Cy5) and equipped with a CFI Plan Apo λ ×20/0.75 objective (Nikon). Hoechst nuclear stain (1:3,000 final concentration) was imaged in each cycle at an exposure time of 1/175 s. Biotinylated CD39 detection reagent was used at a dilution of 1:500, and visualized in the last imaging cycle using DNA streptavidin–phycoerythrin (1:2,500 final concentration). DRAQ5 nuclear stain (1:500 final concentration) was added and visualized in the last imaging cycle. Each tissue was imaged with a ×20 objective in a 7 × 9 tiled acquisition at 1,386 × 1,008 pixels per tile and a resolution of 396 nm per pixel, with 13 z-planes per tile (axial resolution 1,500 nm). Images were chosen with the best focus from the z-planes, and out-of-focus light was removed using deconvolution. Acquired images were preprocessed (alignment and deconvolution with Microvolution software http://www.microvolution.com/) and segmented (including lateral bleed compensation) using a publicly available CODEX image processing pipeline available at https://github.com/nolanlab/CODEX.
Manual assessment of CELESTA performance on the HNSCC cohort.
CELESTA performance on the HNSCC cohort was assessed manually by mapping CELESTA-assigned cell types onto the original images using the x and y coordinates with the ImageJ plugin from https://github.com/nolanlab/CODEX (Extended Data Figs. 6 and 7). For each cell type, CELESTA-assigned cells were plotted as yellow crosses on the canonical marker staining images. Marker staining was shown as a white signal on a black background. Key marker staining for each cell type is shown in Extended Data Figs. 6 and 7. Assessment for each cell was defined as positive canonical marker signals for that cell type.
Manual gating of the HNSCC cohort.
The segmented dataset was uploaded onto the Cytobank analysis platform and transformed with an inverse hyperbolic sine (cofactor of 5). The gating strategy was as follows: cells were defined using DRAQ5 nuclear expression and size, followed by endothelial (CD31+) and malignant cells (cytokeratin+). CD4+ T cells (CD4+ CD8− CD3+ CD31− cytokeratin−), CD8+ T cells (CD8+ CD4− CD3+ CD31− cytokeratin−) and Tregs (FOXP3+ CD25+ CD4+ CD8− CD3+ CD31− cytokeratin−) were defined. To adjust for the variability between sample image collection, each gate was tailored to each individual sample.
Spatial co-localization analysis.
We used the co-location quotient to identify cell spatial co-localization. By denoting cell type a as the target cells and cell type b as the neighboring cells, the co-location quotient shows the degree to which cell type b co-locates spatially with cell type a as a ratio of the observed to the expected number of cell type b among the set of nearest neighbors of cell type a, defined as:
| (10) |
where C is the number of cells of cell type b among the defined nearest neighbors of cell type a. N is the total number of cells and Na and Nb are the numbers of cells for cell type a and cell type b. Cell types with fewer than 20 cells were excluded for each sample. We calculated the co-location quotient for the pairwise cell types identified, and compared the co-location quotients for each pair between N+ and N0 samples.
HNSCC Tumor tissue dissociation.
Tumor tissue was thoroughly minced with a sterile scalpel and placed in a gentleMACS C-tube (Miltenyi Biotec) containing 1.5 ml tissue digestion media. Tissue was mechanically digested on the GentleMACS dissociator five times under the human tumor tissue program h_tumor_01. Tissue was filtered with a 40 μm nylon cell strainer (Falcon) into a 14 ml tube that was then filled up to 14 ml with tissue digestion media and spun at 4 °C for 10 min at 514 r.c.f. The mechanically digested cell pellet was re-suspended for 2 min on ice in 1–4 ml ACK (ammonium-chloride-potassium) lysis buffer (Gibco) depending on the pellet size and number of red blood cells present. Cells were filtered with a 40 μm nylon cell strainer (Falcon) into a 14 ml tube that was then filled up to 14 ml with FACS buffer (PBS without calcium or magnesium (Corning), 2%FBS (heat inactivated), 10 units ml−1 Penicillin–10 μg ml−1 Streptomycin (Gibco) and 1 mM Ultra Pure EDTA (Invitrogen)) and spun at 4 °C for 10 min at 514 r.c.f. Cells were washed one more time with FACS buffer and re-suspended in 25 μl FACS buffer. Solid tissue in the strainer was collected and placed back in the C-tube with 2 ml tissue digestion media of 1 ml 3,000 U ml−1 collagenase/1,000 U ml−1 hyaluronidase (StemCell Technologies) and 1 ml 5 U ml−1 dispase (StemCell Technologies). The solid tissue in the C-tube was incubated at 37 °C on a rotator for 1 h, and then filtered with a 40 μm nylon cell strainer (Falcon) into a 14 ml tube that was then filled up to 14 ml with tissue digestion media and spun at 4 °C for 10 min at 514 r.c.f. The enzymatically digested cell pellet was re-suspended in 1–4 ml ACK lysis buffer (Gibco) (depending on the pellet size and number of red blood cells present) for 2 min on ice. Cells were filtered with a 40 μm nylon cell strainer (Falcon) into a 14 ml tube that was then filled up to 14 ml with FACS buffer (PBS without calcium or magnesium (Corning), 2%FBS (heat inactivated), 10 units ml−1 Penicillin–10 μg ml−1 Streptomycin (Gibco) and 1 mM Ultra pure EDTA (Invitrogen)) and spun at 4 °C for 10 min at 514 r.c.f. Cells were re-suspended in FACS buffer, counted on a hemacytometer and washed one more time with FACS buffer. Cells were kept in FACS buffer on ice until flow cytometry staining. The sorting panel is listed in Supplementary Table 5.
Single-cell RNA sequencing.
RNA and library preparations were performed according to the 10x Genomics v2.0 handbook. Single cells were obtained from tissue dissociation. Cells were stained with 4′,6-diamidino-2-phenylindole dihydrochloride (DAPI) for live–dead detection and sorted for up to 500,000 live cells on a BD Aria II. Cells were counted after sorting and before 10x chip preparation. The 10x/Abseq (BD Biosciences) library preparation followed the same protocol as the 10x Genomics samples except the addition of Fc Block and Abseq antibody staining according to the manufacturer’s handbook. Reads were aligned using CellRanger. Preprocessing, data normalization and batch correction were done following the Seurat SCTransform integration pipeline. Cells were clustered by shared nearest neighbor modularity optimization. The cell types present were identified using canonical markers.
HNSCC tissue microarray.
Formalin-fixed paraffin-embedded tissue blocks of HNSCC from 79 patients were pulled from the Stanford Health Care Department of Pathology archives. The area of malignancy was marked by a board-certified pathologist (C.S.K.). The TMA was constructed from 1-mm-diameter cores punched from the tissue blocks. The 4-μm-thick sections were stained with hematoxylin and eosin, FOXP3 (clone 236A/E7, 1:100 dilution; Leica BOND epitope retrieval solution 2) and cytokeratin mix (AE1/AE3, 1:75 dilution and CAM5.2, 1:25 dilution; Ventana Ultra; protease retrieval). The slides were digitized using a Leica whole-slide scanner with ×40 magnification. Three samples with unknown node status were excluded from analysis. To assess the co-localization of FOXP3 and cytokeratin immunohistochemistry staining, the whole-slide images were dearrayed to obtain each core image. We ran color deconvolution to quantify DAB staining using the scikit-image package in Python. We thresholded the staining based on pixel intensity distributions of the DAB staining to quantify the positively stained pixels in the images. We used a sliding window of 100 × 100 pixels to quantify the positive pixel densities for cytokeratin and FOXP3 in each window and moved the sliding window to cover the whole core area. We correlated the densities of cytokeratin staining and FOXP3 staining across the whole core area for each sample. We then compared the density correlations between the N0 and N+ samples.
Statistical analysis and figure creation.
Statistical analyses were performed and the corresponding figures were generated in R or Python. Student’s t-test was used for comparisons of co-location quotient and comparisons of TMA density correlation between HNSCC N0 and N+ samples. For in vitro and in vivo functional experiments the non-parametric Wilcoxon rank-sum test was used for comparisons. In addition, when comparing paired conditions with equal sample sizes, we used the paired t-test. For multiple testing of differentially expressed gene expressions in scRNA-seq data, the permutation test (SAMR)47 was used, and the false discovery rate was used to adjust the P values. Results were considered statistically significant for P < 0.05 or adjusted P < 0.05 for multiple testing.
For cell neighborhood enrichment analysis (Extended Data Fig. 1a), for the five nearest neighbor cells for each cell, the number of cells of each cell type was calculated and the observed total number of cell types in the neighborhood of another cell type could be calculated. Using 1,000 permutations of the cell labels, the distribution of the randomly expected number of neighboring cells for each cell type could be constructed, and a right-tailed P value was used to confirm that the observed number was larger than 95% of the randomly expected number for enrichment. The Benjamini–Hochberg procedure was used to adjust the P values. A statistically significant neighborhood enrichment of cells was confirmed when both the P value and the adjusted P value were less than 0.05.
For the public colorectal cancer dataset the ground truth was defined using the published annotations. For the HNSCC study cohort dataset the ground truth is defined using manual gating. For the public colorectal cancer dataset, cell types with fewer than 5 cells in a sample region in the annotations were excluded. For each cell type, the true positive (TP) is the number of cells assigned by both CELESTA and the ground truth benchmark, the false positive (FP) is the number of cells assigned by CELESTA but not by the ground truth benchmark, the false negative (FN) is the number of cells assigned by the benchmark but not by CELESTA, and the true negative (TN) is the number of cells not assigned by both CELESTA and the benchmark. For the HNSCC cohort the adjusted Rand index was calculated using the adjustedRandIndex function in the R package mclust. Precision is defined as TP/(TP + FP), and recall is defined as TP/(TP + FN). F1 score is defined as 2(precision × recall)/(precision + recall). The Rand index, a measure of accuracy, is defined as (TP + TN)/(TP + TN + FP + FN).
Parts of Figs. 5 and 6 were created using the Biorender online tool (https://biorender.com). Multichannel overlay images were created using ImageJ.
Cell lines and animals.
Cells were cultured in DMEM supplemented with 4 mM l-glutamine, 10% FBS and 1% Penicillin Streptomycin. The tumor lines were routinely tested for Mycoplasma using polymerase chain reaction, and all tests were negative. All animal studies were performed in accordance with the Stanford University Institutional Animal Care and Use Committee under protocol APLAC-17466. All mice were housed in an American Association for the Accreditation of Laboratory Animal Care-accredited animal facility and maintained in specific pathogen-free conditions.
Transwell migration assays.
FoxP3EGFP mice48 were acquired from The Jackson Laboratory (catalog no. 006772) and bred at Stanford University. Splenocytes were collected from tumor-naive female FoxP3EGFP mice. All studies were performed in female mice between 7 and 9 weeks of age. Mice were housed in facilities maintained at a temperature of 18–24 °C, with humidity between 40% and 60% and with 12–12 light–dark cycles (07:00–19:00 hours). Spleens underwent mechanical dissociation on 70 μm cell strainers and were washed with HBSS supplemented with 2% FBS and 2 mM EDTA (HBSSFE). Erythrocytes were lysed with ACK. Magnetic isolation of Tregs was performed using the EasySep Mouse CD25 Regulatory T cell Positive Selection Kit (StemCell, catalog no. 18782) according to the manufacturer’s instructions. Tregs were cultured in RPMI-1640 supplemented with 10% FBS, 2 mM l-glutamine, 15 mM HEPES, 14.3 mM 2-mercaptoethanol, 1 mM Sodium Pyruvate, 1× MEM Non-Essential Amino Acids Solution and 300 IU hIL-2 (Peprotech) for 72 h.
Tumor cell line suspensions were prepared by washing with PBS followed by treatment with StemPro Accutase (Thermo, catalog no. A1110501). A total of 105 tumor cells were plated in the bottom chamber of the 24-well transwell plates 24 h prior to the assay. The 5 μm transwell membranes (Costar, catalog no. 3421) were incubated in complete RPMI for 24 h prior to the assay. Membranes were transferred to the tumor-containing wells and suspensions of 5 × 10⁴ Tregs were added to the top chambers of the transwells. Cells were cultured for 2 h at 37 °C in 5% CO2, after which the membranes were removed, and cells from the bottom chamber were processed for analysis by flow cytometry.
Cell suspensions were washed in HBSSFE and stained with the following antibodies: Mouse Fc Block (BD, 2.4G2, 553142, 1:200), CD4 (BioLegend, RM4–5, 100563, 1:200), CD25 (BioLegend, PC61, 102026, 1:75), and CXCR3 (BioLegend, CXCR3–173, 155906, 1:100). DAPI was used to stain for viability. Samples were run on an LSRFortessa cytometer (Becton Dickinson) and analyzed using FlowJo V10 (TreeStar).
In vivo Treg tumor infiltration.
Experiments were performed using either C57NL/6J (The Jackson Laboratory, catalog no. 000664) or FoxP3EGFP (The Jackson Laboratory, catalog no. 006772) female mice housed in our facility at Stanford. B16-F0 or LN6–987AL tumor cells were washed with PBS and dissociated from tissue culture plastic with StemPro Accutase (Thermo, catalog no. A1110501). Cell suspensions of 2 × 10⁵ cells in phenol-red free DMEM were injected into the subcutaneous region of the left flank of 9-week-old female mice (The Jackson Laboratory, catalog no. 000664) following removal of fur with surgical clippers. After 15 days of tumor growth the mice were euthanized and their tumors were processed for analysis by flow cytometry.
Tumors were weighed followed by digestion in RPMI-1640 supplemented with 4 mg ml−1 Collagenase Type 4 (Worthington, catalog no. LS004188) and 0.1 mg ml−1 Deoxyribonuclease I (DNAse I, Sigma, catalog no. DN25) at 37 °C for 20 min with agitation. Tumors were then dissociated on 70 μm strainers, washed with HBSSFE and stained for viability using LIVE/DEAD Fixable Blue Dead Cell Stain (Thermo, catalog no. L34962). Surface proteins were stained, samples were fixed and permeabilized using the eBioscience FoxP3 Fixation/Permeabilization kit (Thermo, 00-5521-00), and intracellular FoxP3 was stained. The following antibodies were used: Mouse Fc Block (BD, 2.4G2, 553142, 1:200), CD4 (BioLegend, RM4–5, 100563, 1:200), CD8α (BioLegend, 53–6.7, 100750, 1:200), CD3 (BioLegend, 17A2, 100237, 1:75), CD25 (BioLegend, PC61, 102026, 1:75), B220 (BioLegend, RA3–6B2, 103255, 1:200), CD45.2 (BioLegend, 104, 109806, 1:100) and FoxP3 (Thermo/eBiosciences, NRRF-30, 12-4771-82, 1:20). AccuCount fluorescent particles (Spherotec, catalog no. ACFP-50–5) were added to each sample to determine absolute cell counts. Samples were run on an LSRFortessa cytometer (Becton Dickinson) and analyzed using FlowJo V10 (TreeStar).
For CXCR3-blockade studies, LN6–987AL cells were prepared as above and injected into 7-week-old FoxP3EGFP mice. Mice were treated with AMG487 (R&D Systems, catalog no. 4487) at 5 mg kg−1 every 48 h starting on day 1 following tumor implantation. After 9 days of tumor growth the mice were euthanized and their tumors were processed for analysis by flow cytometry (BD FACS Diva 8.0.2) as described above.
Reporting summary.
Further information on research design is available in the Nature Research Reporting Summary linked to this article.
Extended Data
Extended Data Fig. 1 |. Neighborhood enrichment analysis, expression distributions of protein markers and illustration of final updated prior knowledge cell type signature matrix.
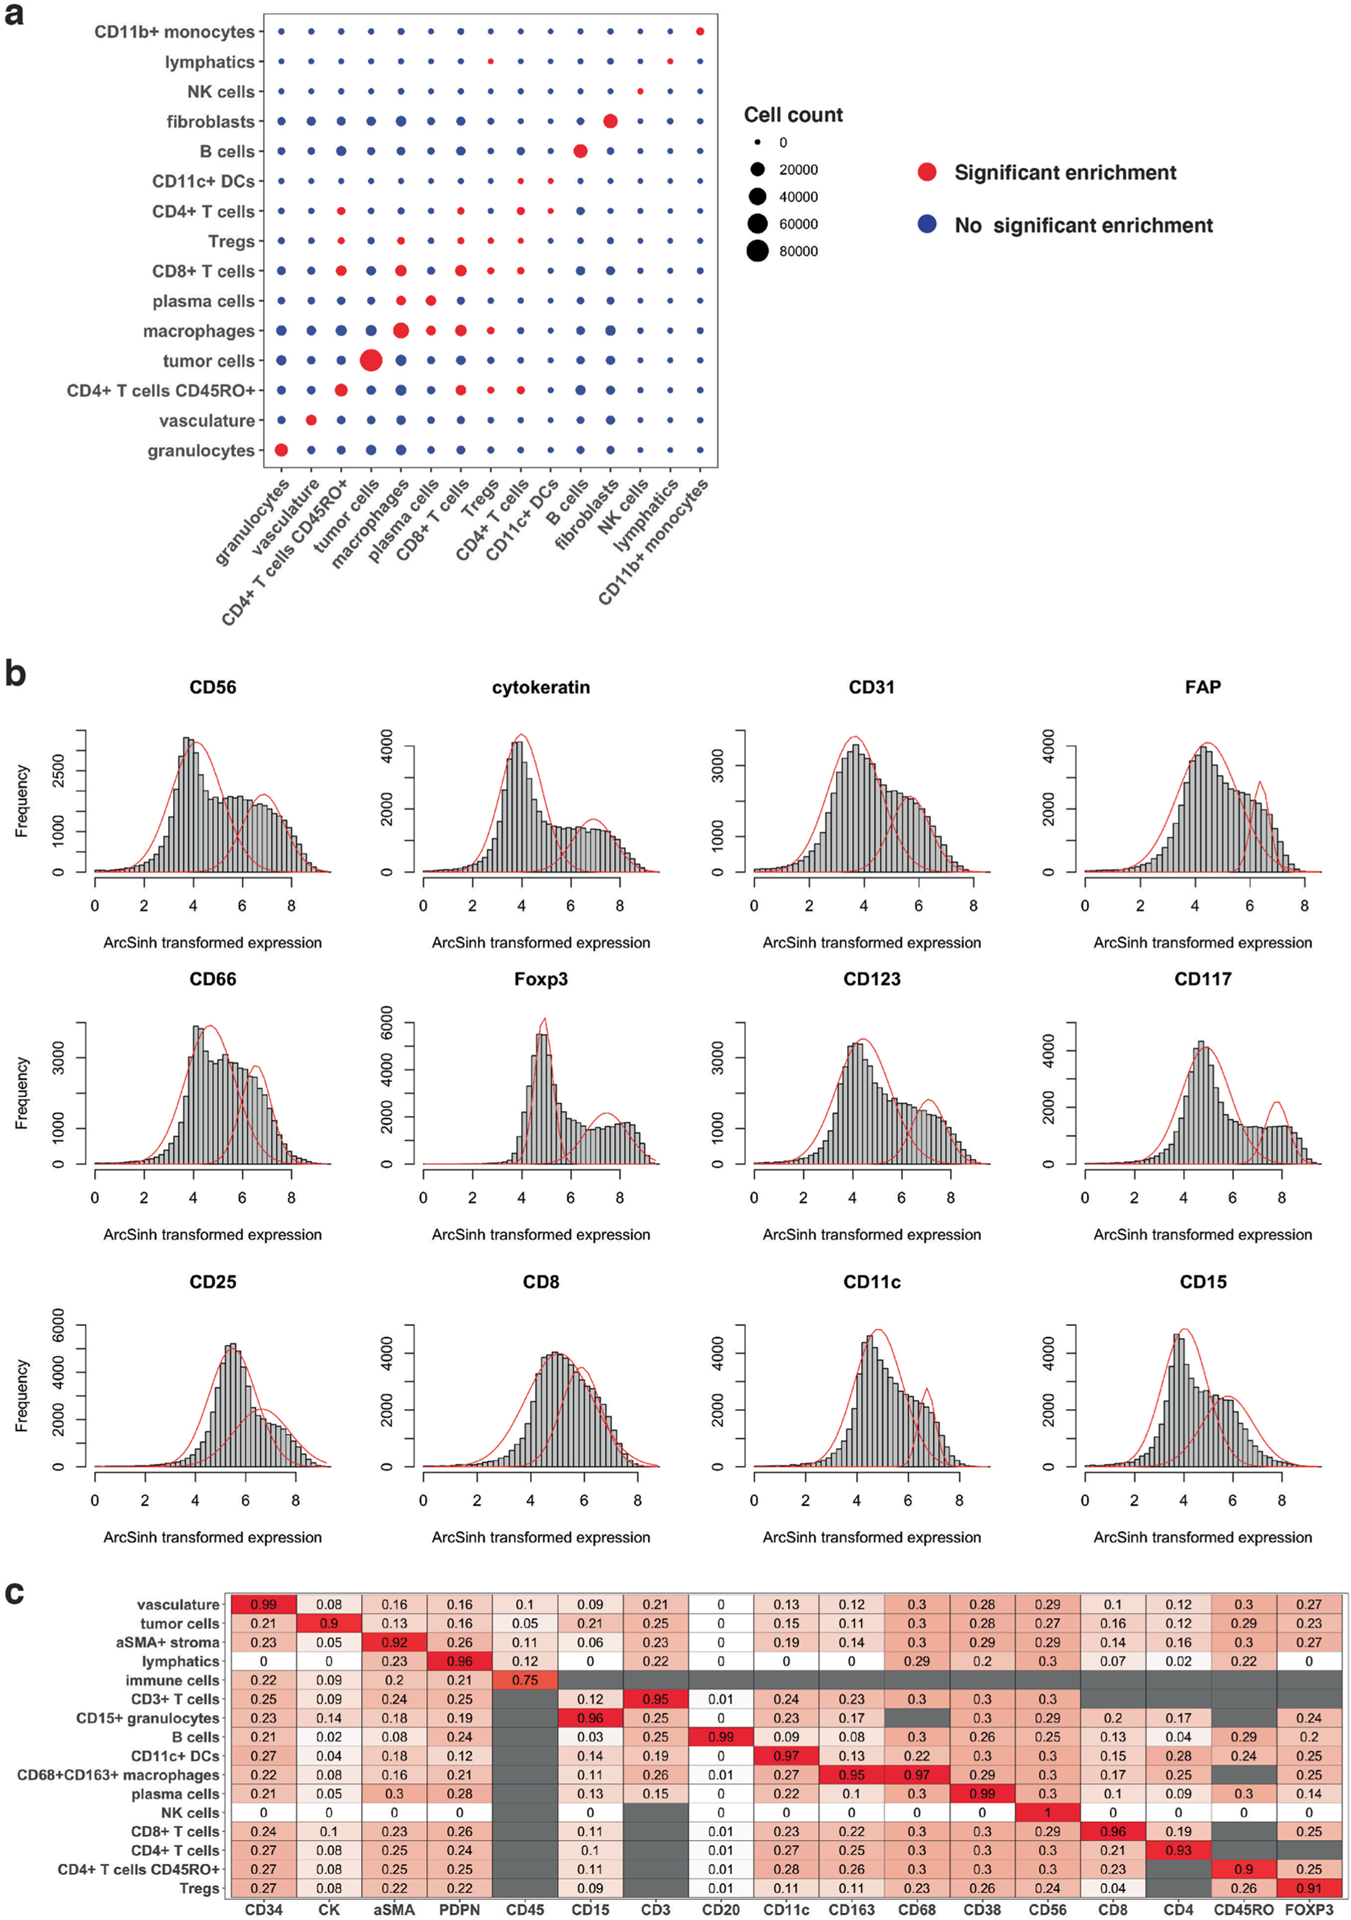
(a) Cell neighborhood enrichment analysis using Schurch et al.6 cell type annotations. Red versus blue indicates that cells of a given cell type (columns) are significantly enriched versus are not enriched, respectively, in the 5-nearest neighborhood of a cell type of interest (rows). Cells of the same or similar cell type are enriched in each other’s neighborhoods. Statistical significance is determined with p-value right tail < 0.05 and Benjamini–Hochberg adjusted p-value < 0.05. Legend for cell count indicates the number of cells below 2,000, (2,000–4,000), (4,000–6,000), (6,000–8,000) and over 8,000 for each cell type across the 70 samples. (b) Histograms of protein expressions in a representative sample. Red curves illustrate fitted bimodal Gaussian mixture model. The protein expression levels were ArcSinh transformed. (c) Illustration of final updated prior knowledge cell type signature matrix on a representative sample from Schurch et al. data. The initial user-defined cell type signature matrix is shown in Supplementary Table 1. There were no NK cells identified in this sample, and thus information on NK cells is not updated in the cell type signature matrix. White to red color indicates values from 0 to 1. Gray color indicates NA values.
Extended Data Fig. 2 |. Comparison between CELESTA and Schurch et al.6 annotations on the colorectal cancer dataset.
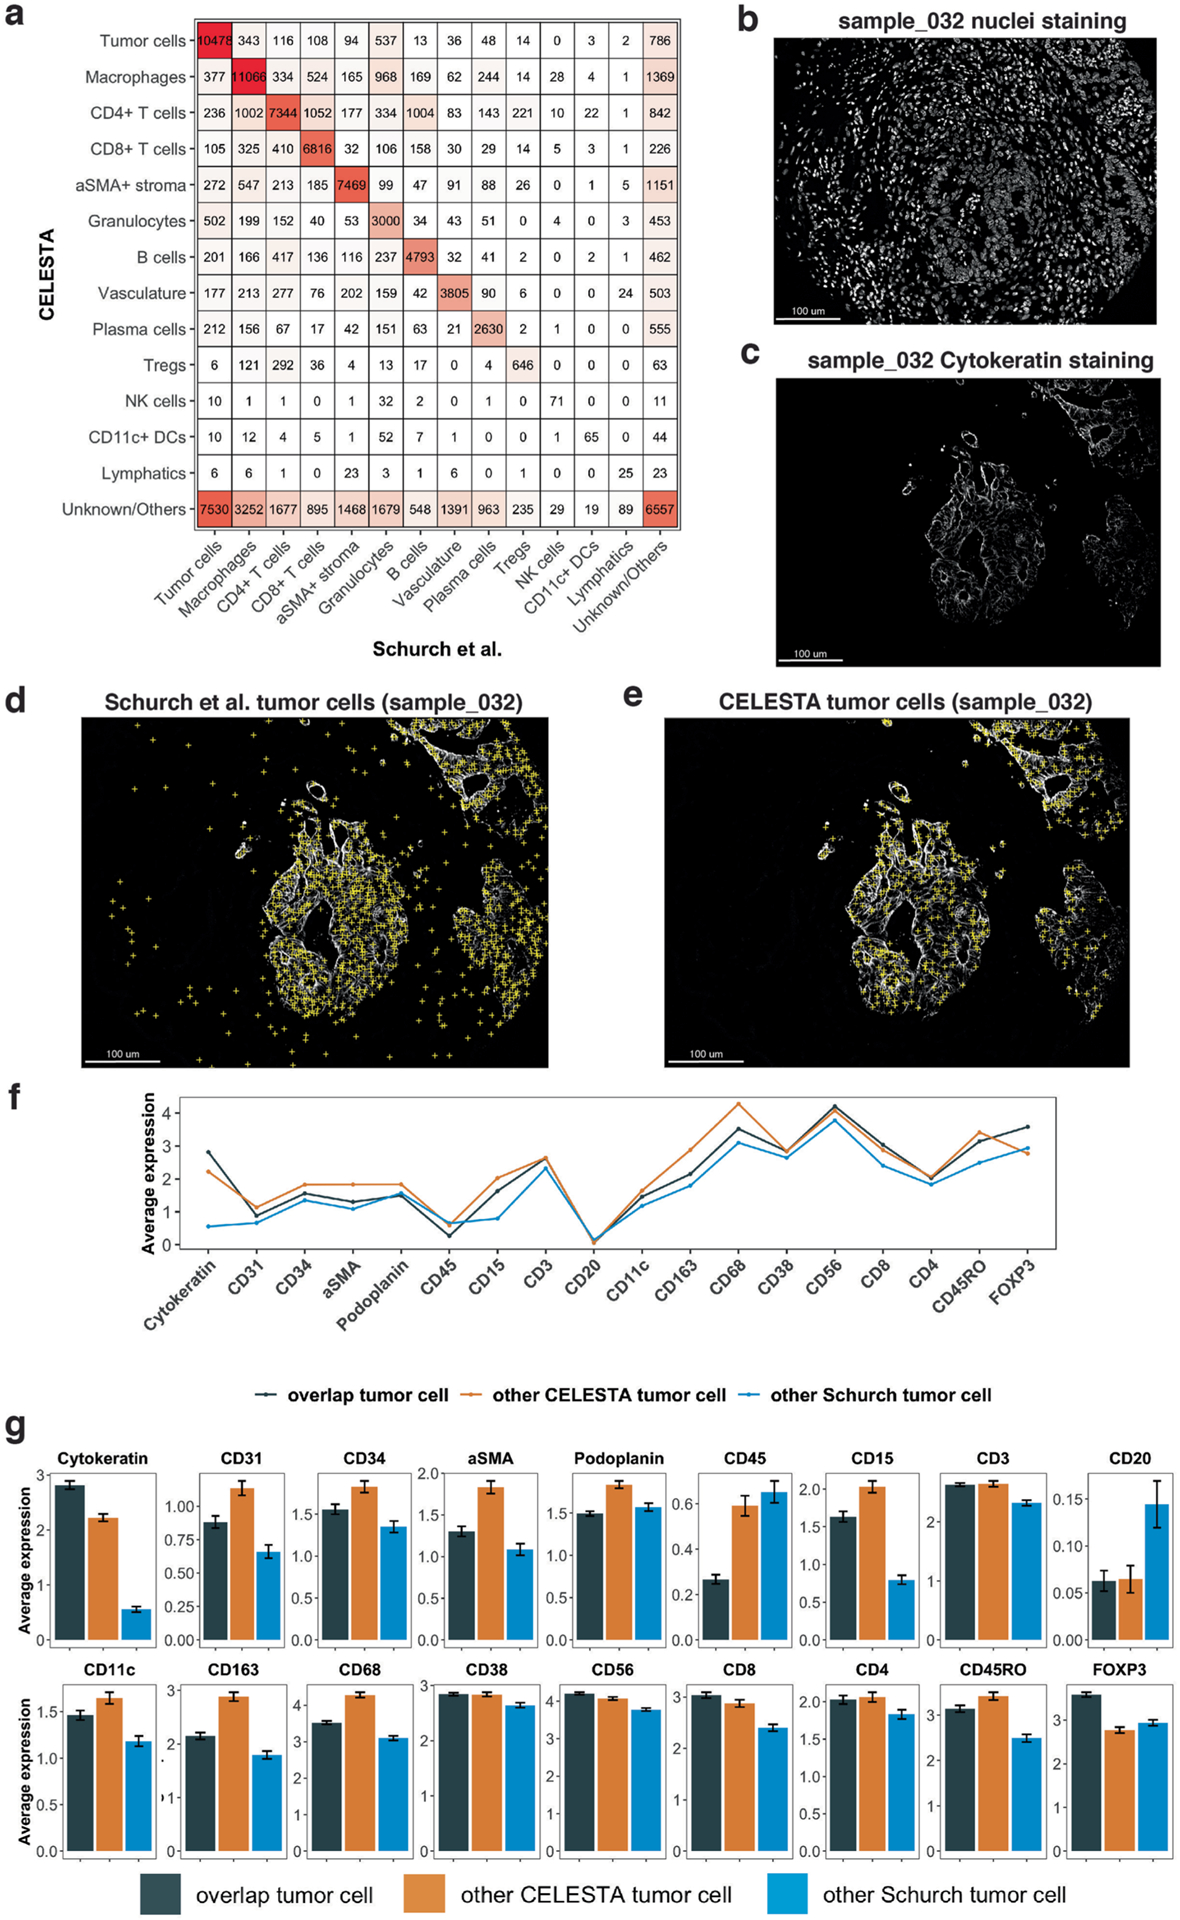
(a) Confusion matrix for each cell type identified by CELESTA (rows) versus Schurch et al.6 (column) for 70 samples. White to red color indicates values from low to high. (b) Nuclei staining for sample core 032. (c) Cytokeratin staining for sample core 032. (d) Tumor cells identified by Schurch et al. (yellow crosses) overlaid on cytokeratin staining for sample core 032. (e) Tumor cells identified by CELESTA overlaid on cytokeratin staining for sample core 032. (f) Average canonical cell type marker expressions across all the 70 samples on cells identified to be tumor cells by (i) both CELESTA and Schurch et al. (black), (ii) only CELESTA (orange), and (iii) only Schurch et al. (blue). (g) Similar to (f) but with error bars indicating 95% confidence interval based on sampling the same number of cells from each category across n = 70 samples and center values indicate mean values.
Extended Data Fig. 3 |. Testing leave-one-out marker and cell type resolution strategy and sensitivity analysis of user-defined parameters (hyperparameters) in CELESTA using the Schurch et al.6 dataset.
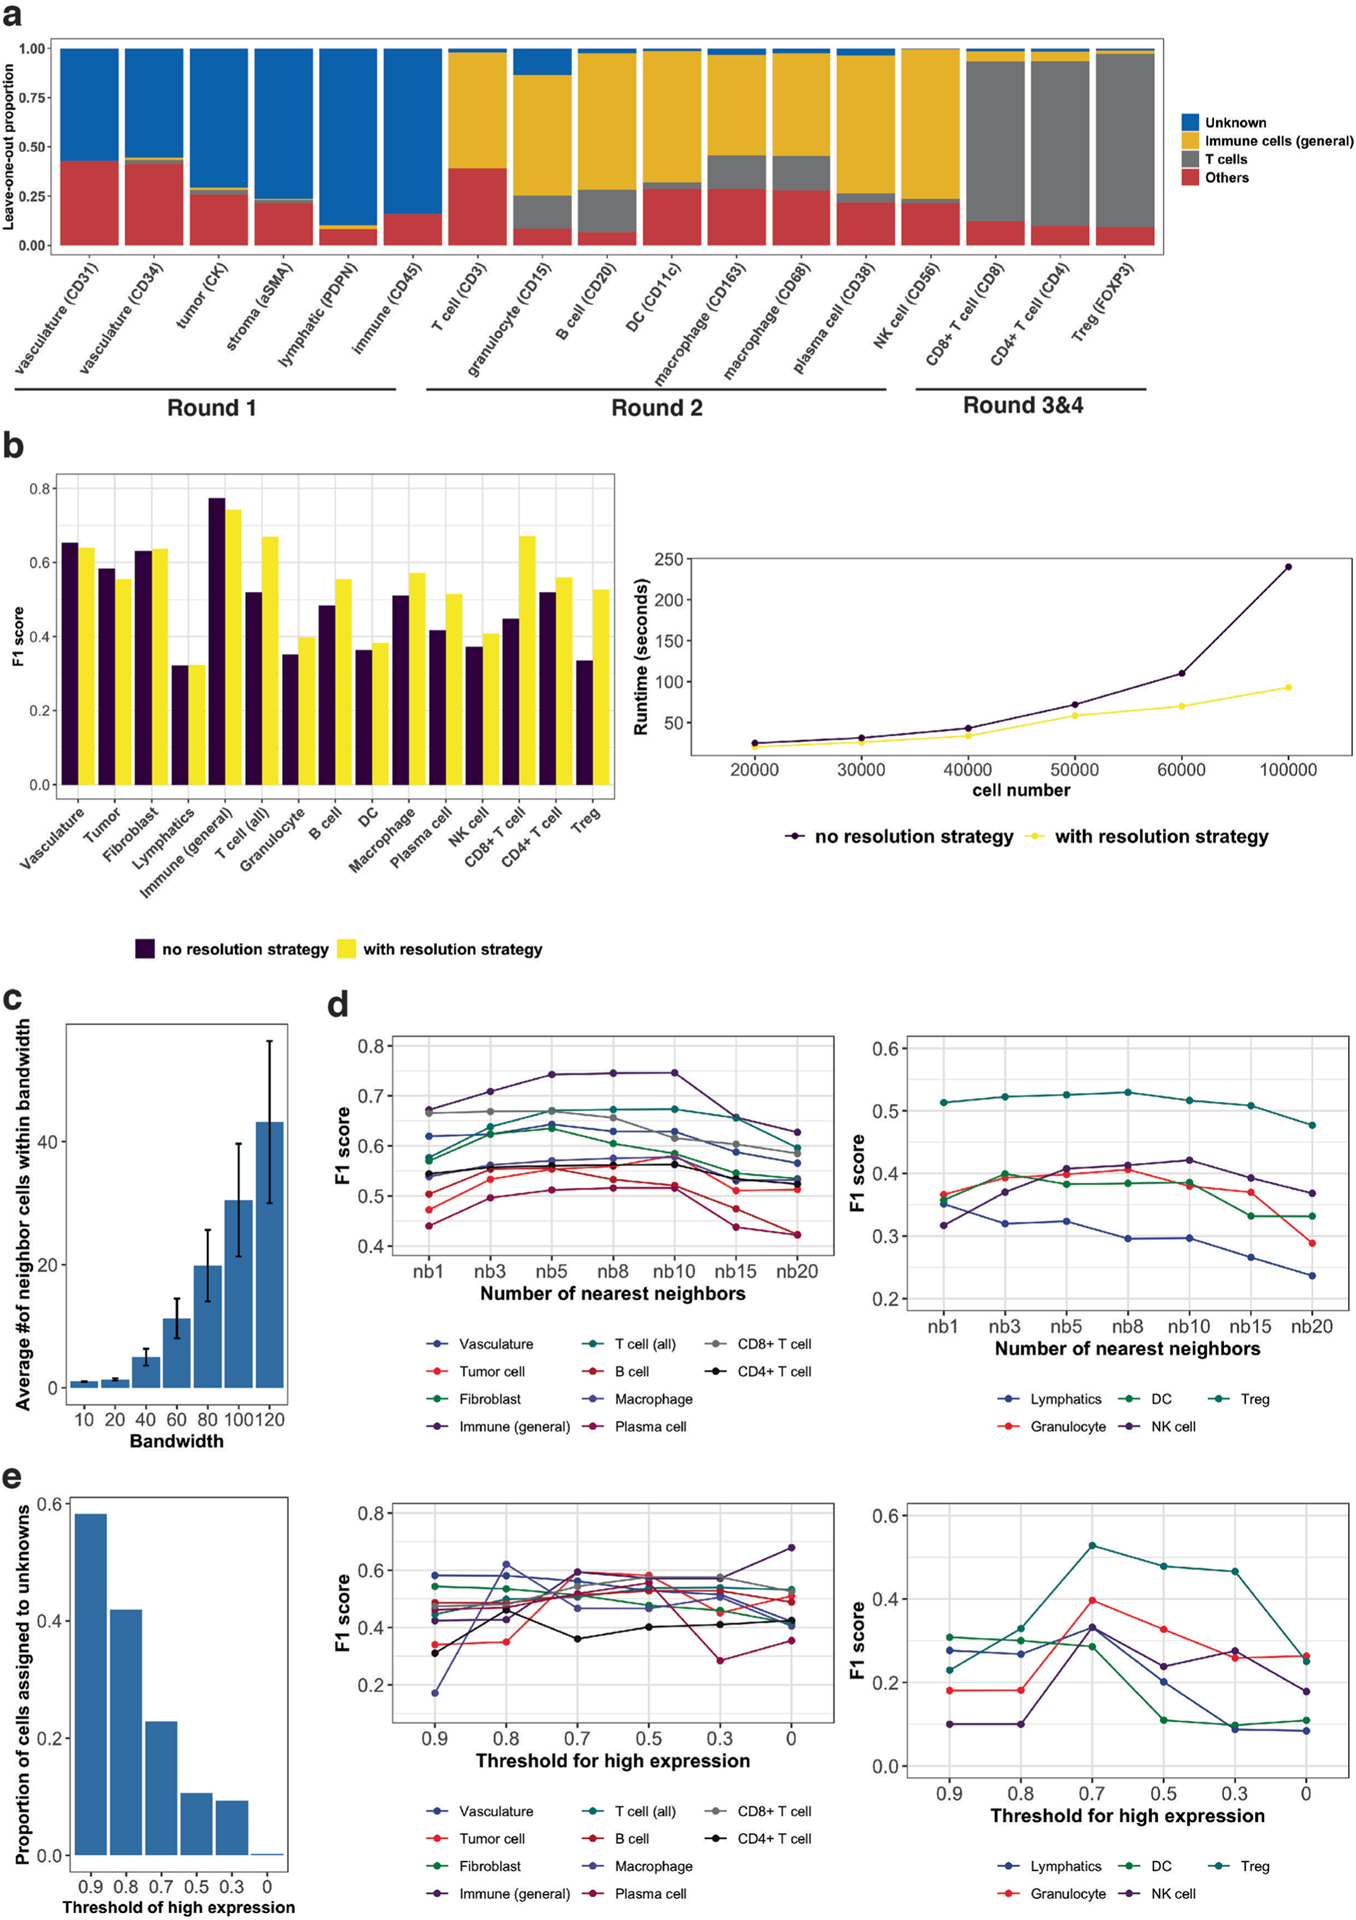
(a) Assigned cell type proportions for testing of different cell type signature matrices with each time leaving one cell type marker and corresponding cell type out. (b) Comparison of CELESTA’s performance with (yellow) and without (purple) cell type resolution strategy. (c) Average numbers of neighboring cells as a function of the bandwidth parameter across n = 70 samples. Error bar indicates standard deviation, and center value indicates mean values. (d) F1 score as a function of the number of nearest neighbors. Left panel: major cell populations. Right panel: cell types with smaller populations. (e) Effect of different values for the threshold of high marker probability expression. Left panel: Number of cells assigned to unknown cell types as a function of the threshold for high marker probability expression. Middle panel: F1 scores as a function of the threshold for high marker probability expression, for major cell types. Right panel: F1 scores as a function of the threshold for high marker probability expression, for cell types with smaller populations.
Extended Data Fig. 4 |. Comparison of expression probabilities versus original staining across a representative sample.
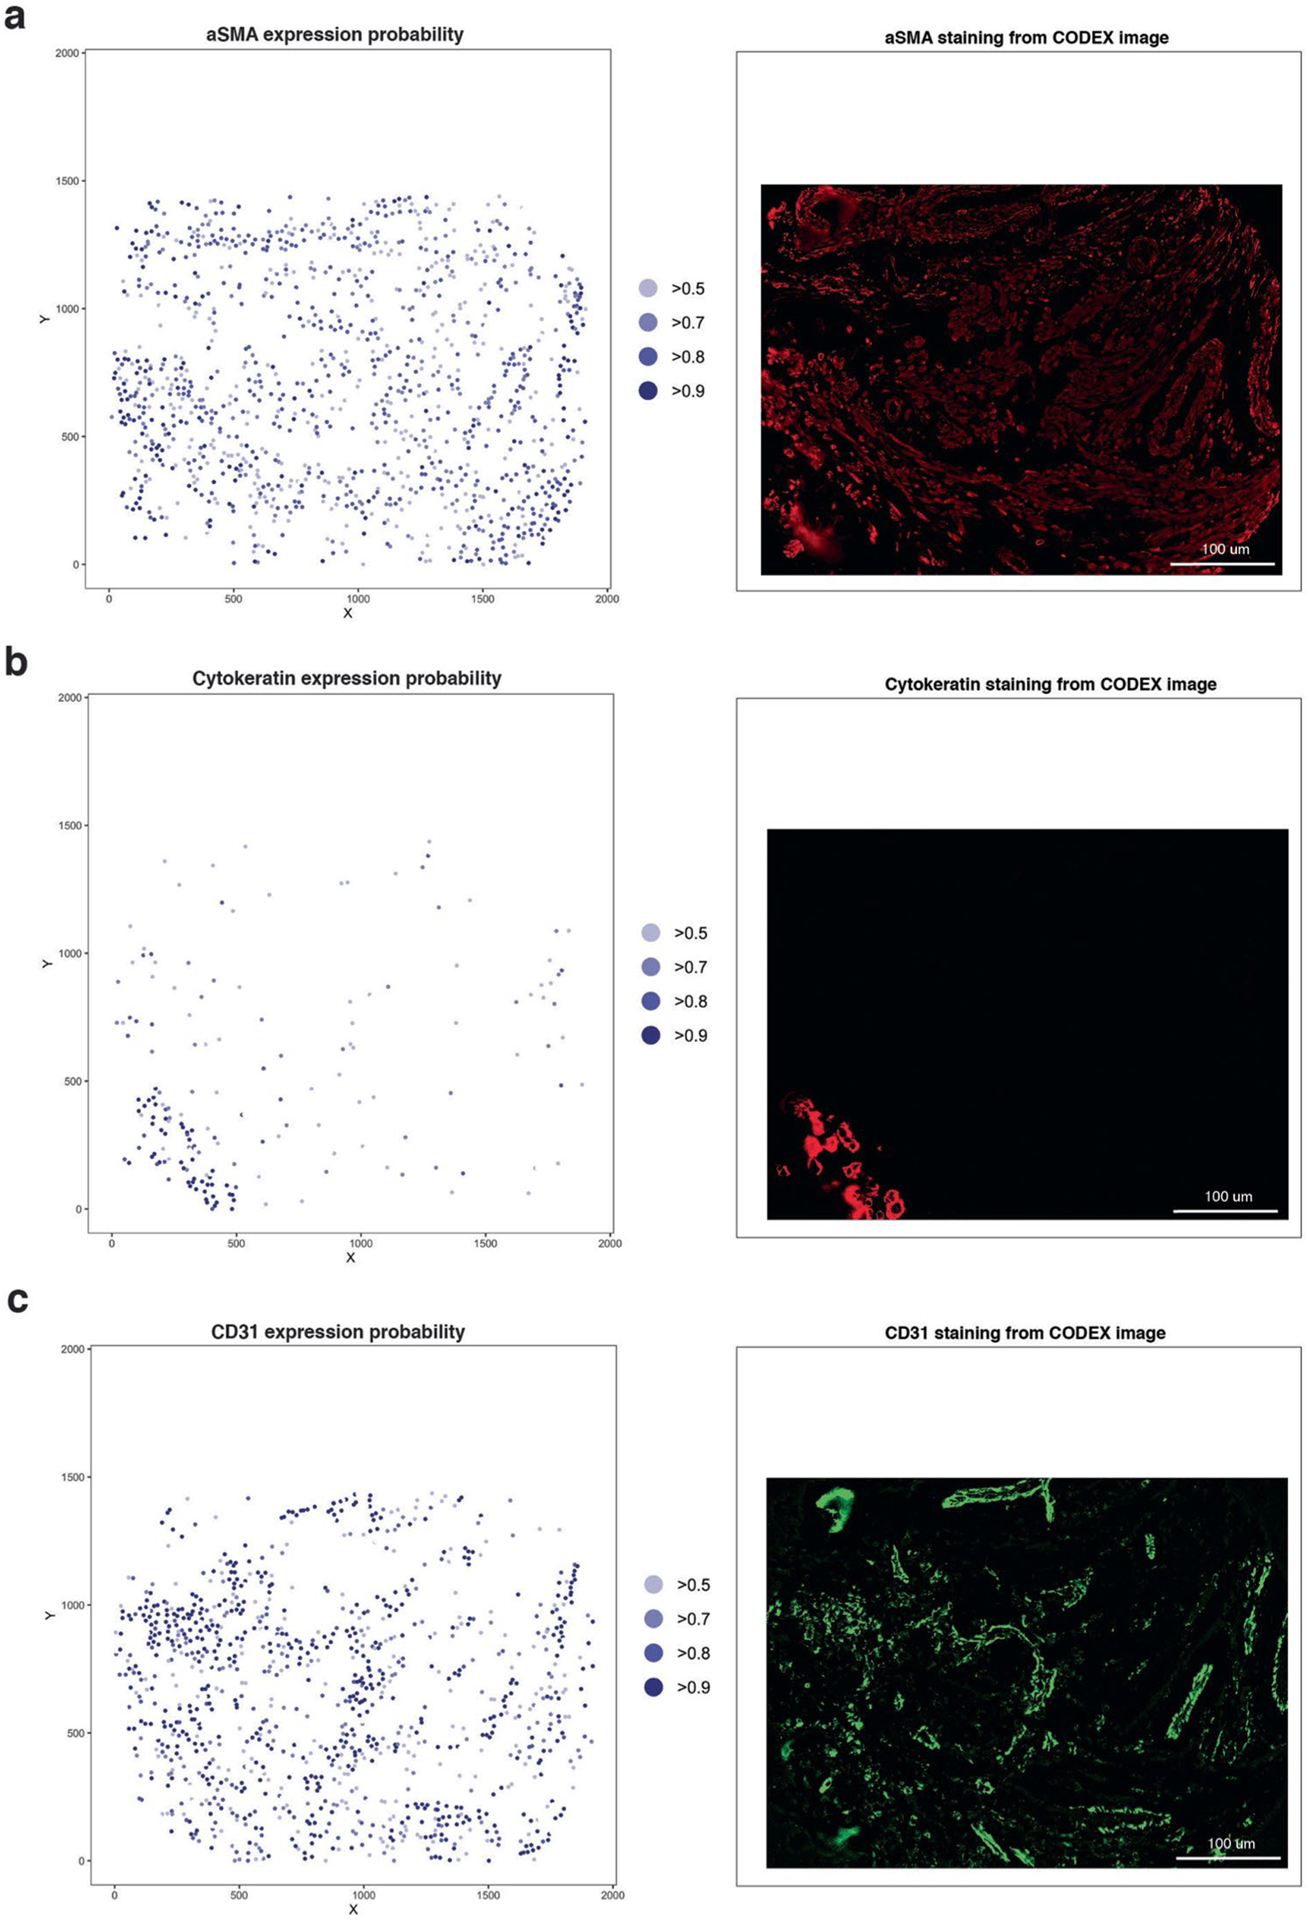
Expression probability for a given marker for each cell CELESTA (left) compared to marker staining on the original image (right). For the CELESTA result, the marker expression probability is shown at the XY coordinates of the cell, where the XY coordinates represents the cell’s center; marker expression probabilities are color-coded for values over 0.5 in light blue to over 0.9 in dark blue. Markers illustrated are: (a) aSMA, a mesenchymal marker, (b) cytokeratin, a tumor marker and (c) CD31, an endothelial marker.
Extended Data Fig. 5 |. Analysis of two different clustering-based methods (namely, flowMeans and FlowSoM) used to assign cell types on the Schurch et al.6 dataset.
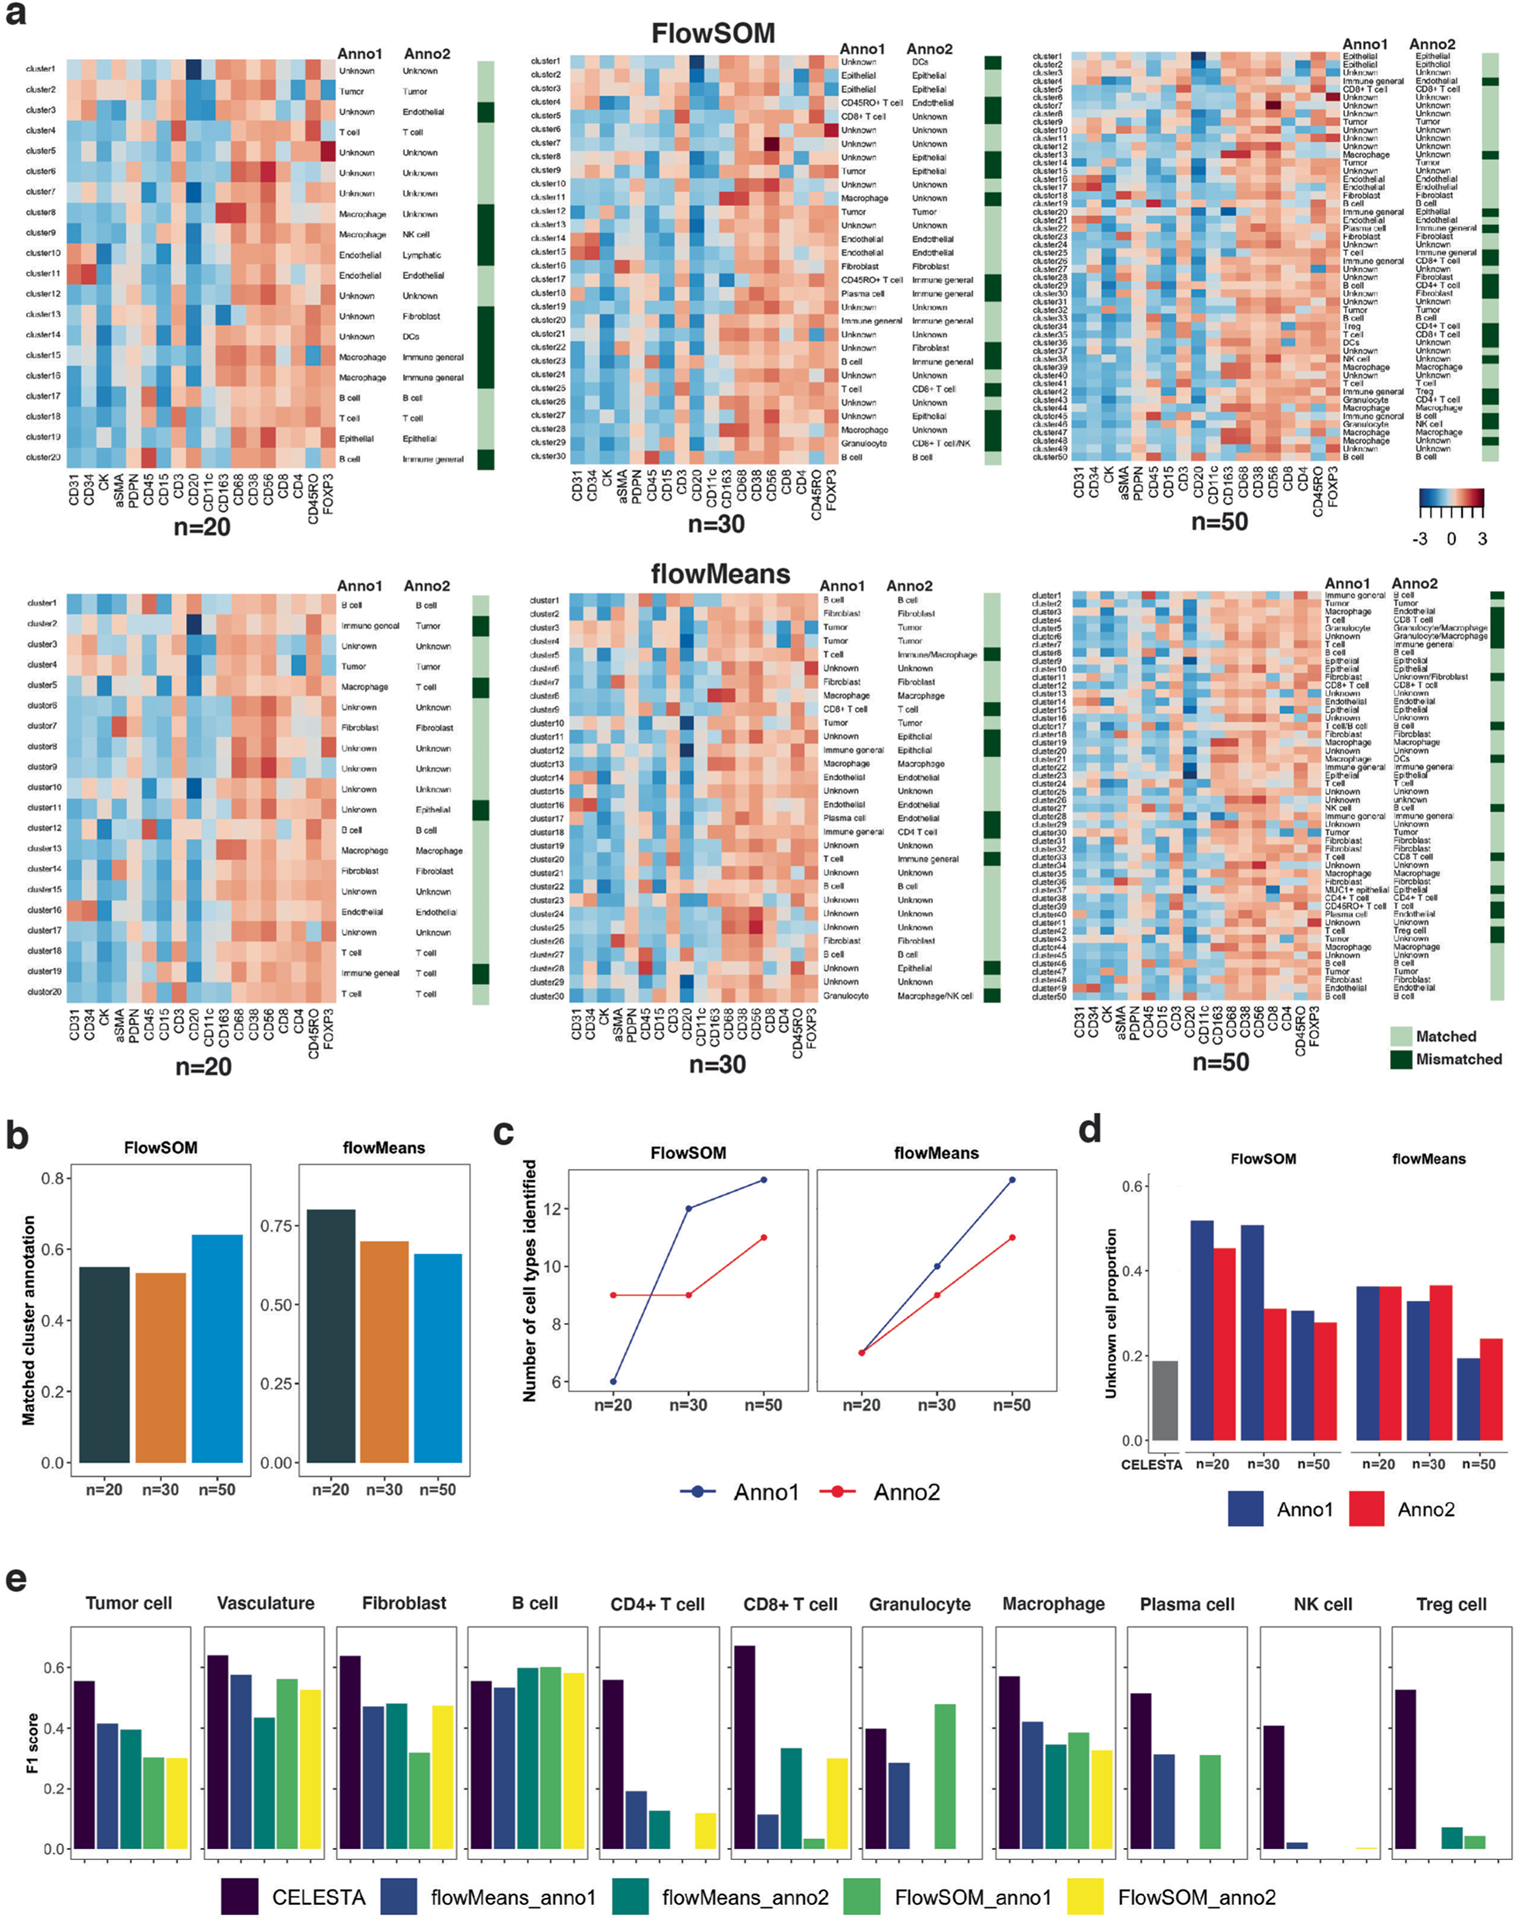
(a) Heatmaps of cluster marker expressions on different numbers of clusters (n = 20, 30, 50) with two independent annotators (Anno1 and Anno2) to assign cluster cell types based on manual assessment of cluster protein marker expressions; light green indicates matched annotations and dark green indicates mismatched annotations. (b) Percentage of matched cluster annotations between the two annotators as a function of the number of clusters, for two different clustering methods. (c) Number of cell types identified by the two annotators as a function of the number of clusters, for the two different clustering methods. (d) The percentage of cells assigned to unknown cell types with CELESTA and the two different clustering methods, as a function of the number of clusters and the annotator. (e) F1 scores per cell type, comparing CELESTA and cell type assignments from the two annotators using the two different clustering methods, where annotations from Schurch et al. are used as ground truth. Abbreviations: Anno1 for Annotator 1; Anno2 for Annotator 2.
Extended Data Fig. 6 |. Visual assessment of CELESTA’s performance for a representative HNSCC sample.
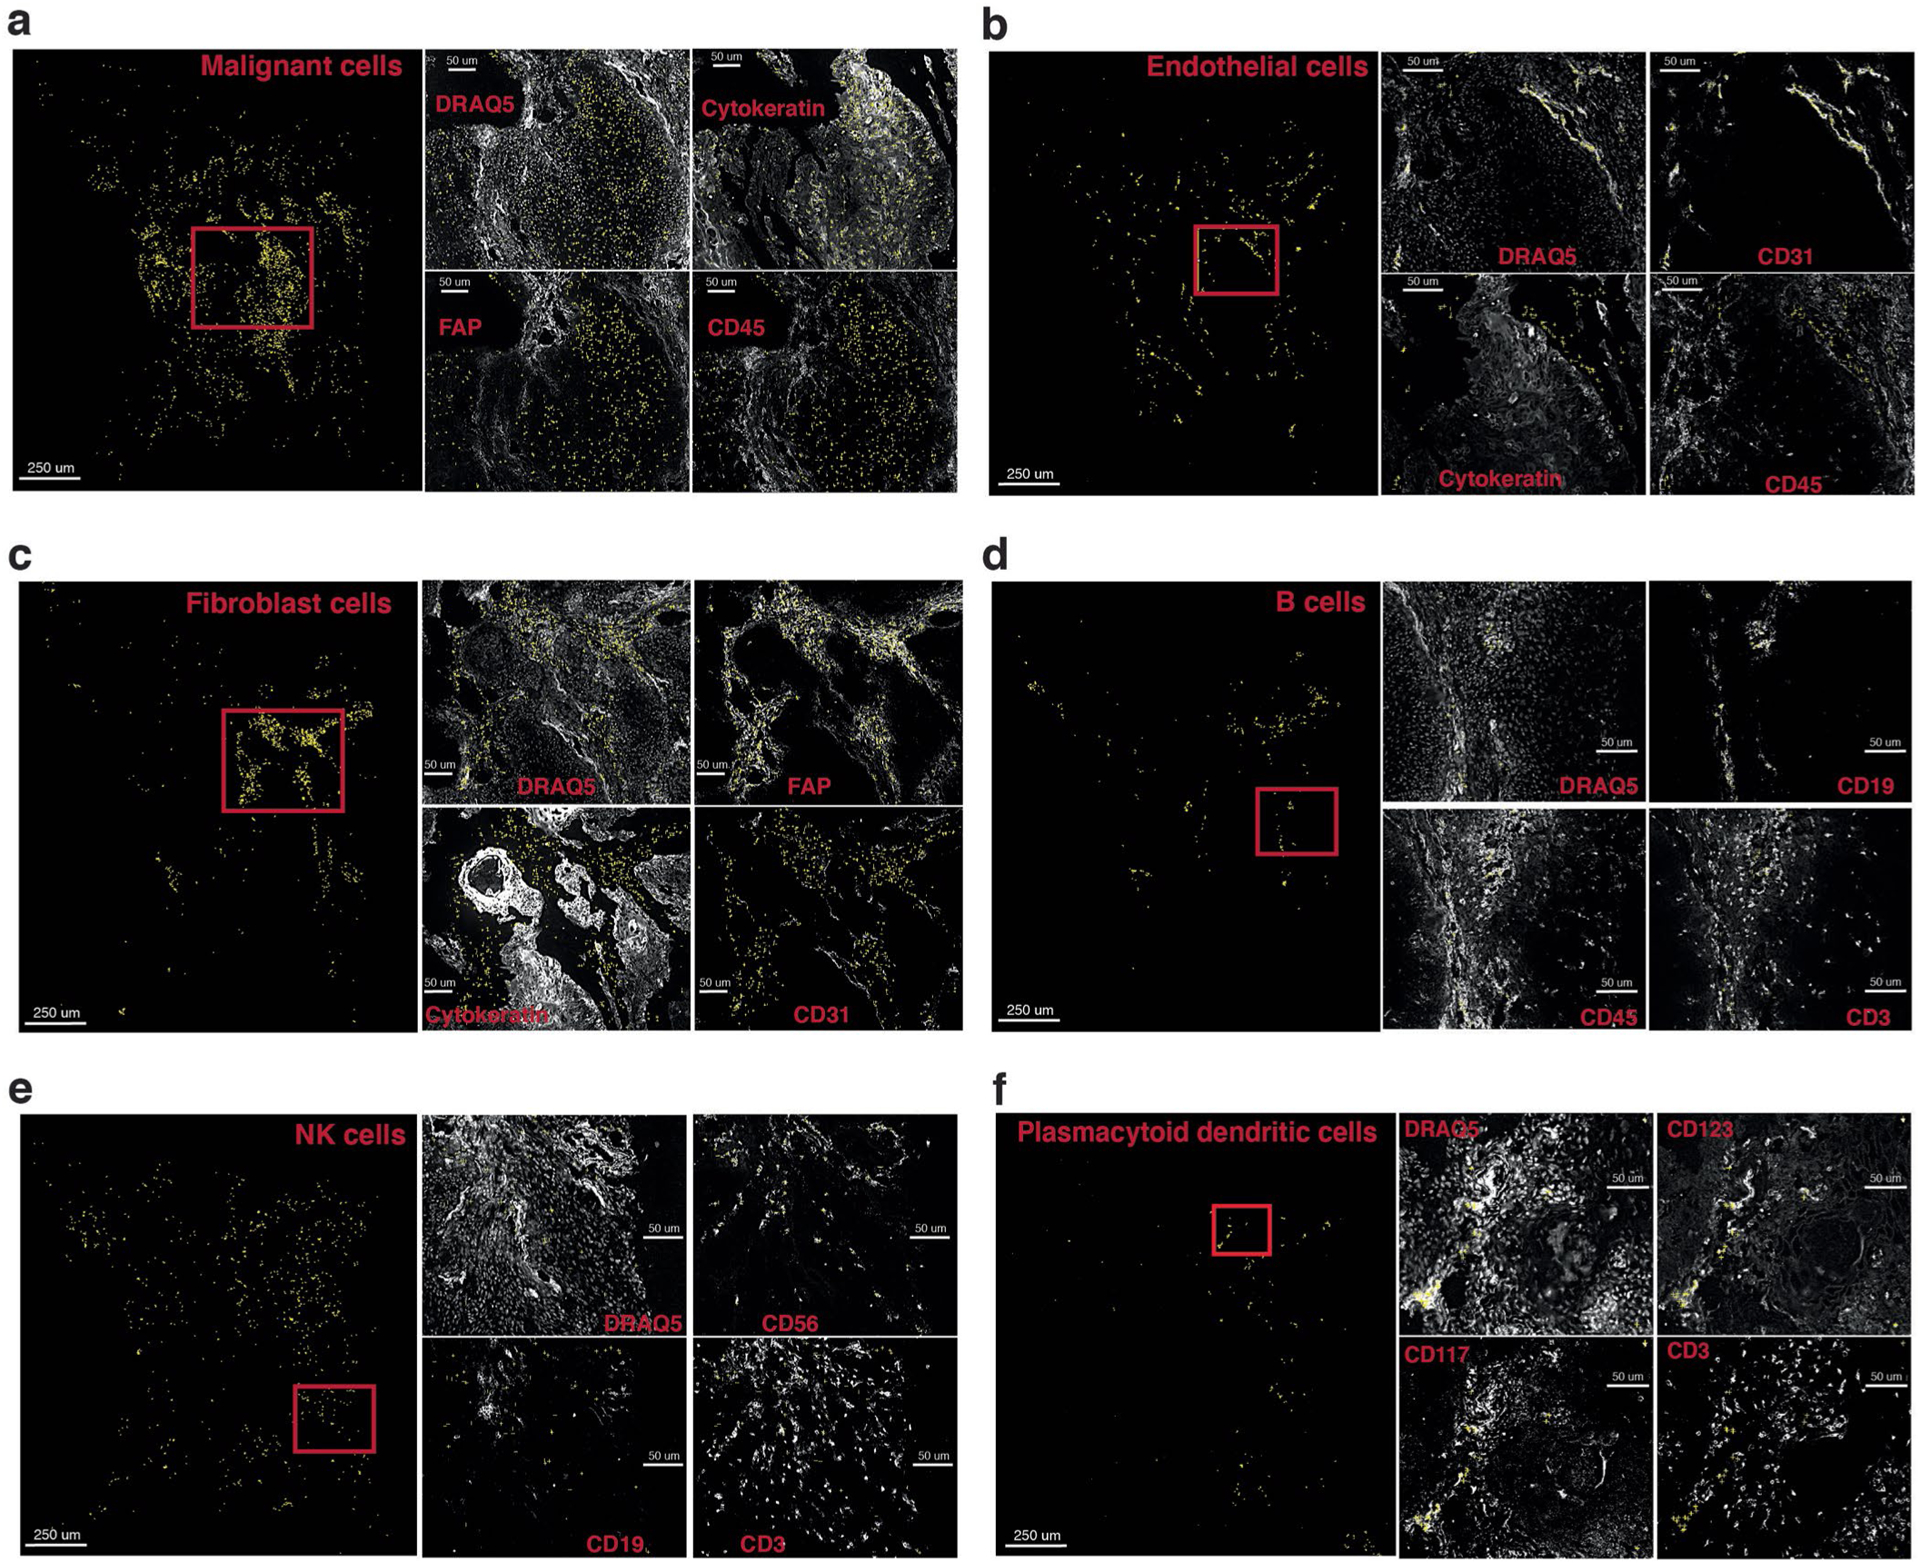
(a)–(f) Identified cells are shown as yellow crosses using the x and y coordinates overlaid on canonical marker staining (white) CODEX images. For each cell type, nuclei staining and three example markers (positive and negative) important for the cell type are shown. Cell types shown (a)–(f): malignant cells, endothelial cells, fibroblast cells, B cells, NK cells, plasmacytoid dendritic cells.
Extended Data Fig. 7 |. Additional visual assessment of CELESTA’s performance for a representative HNSCC sample.
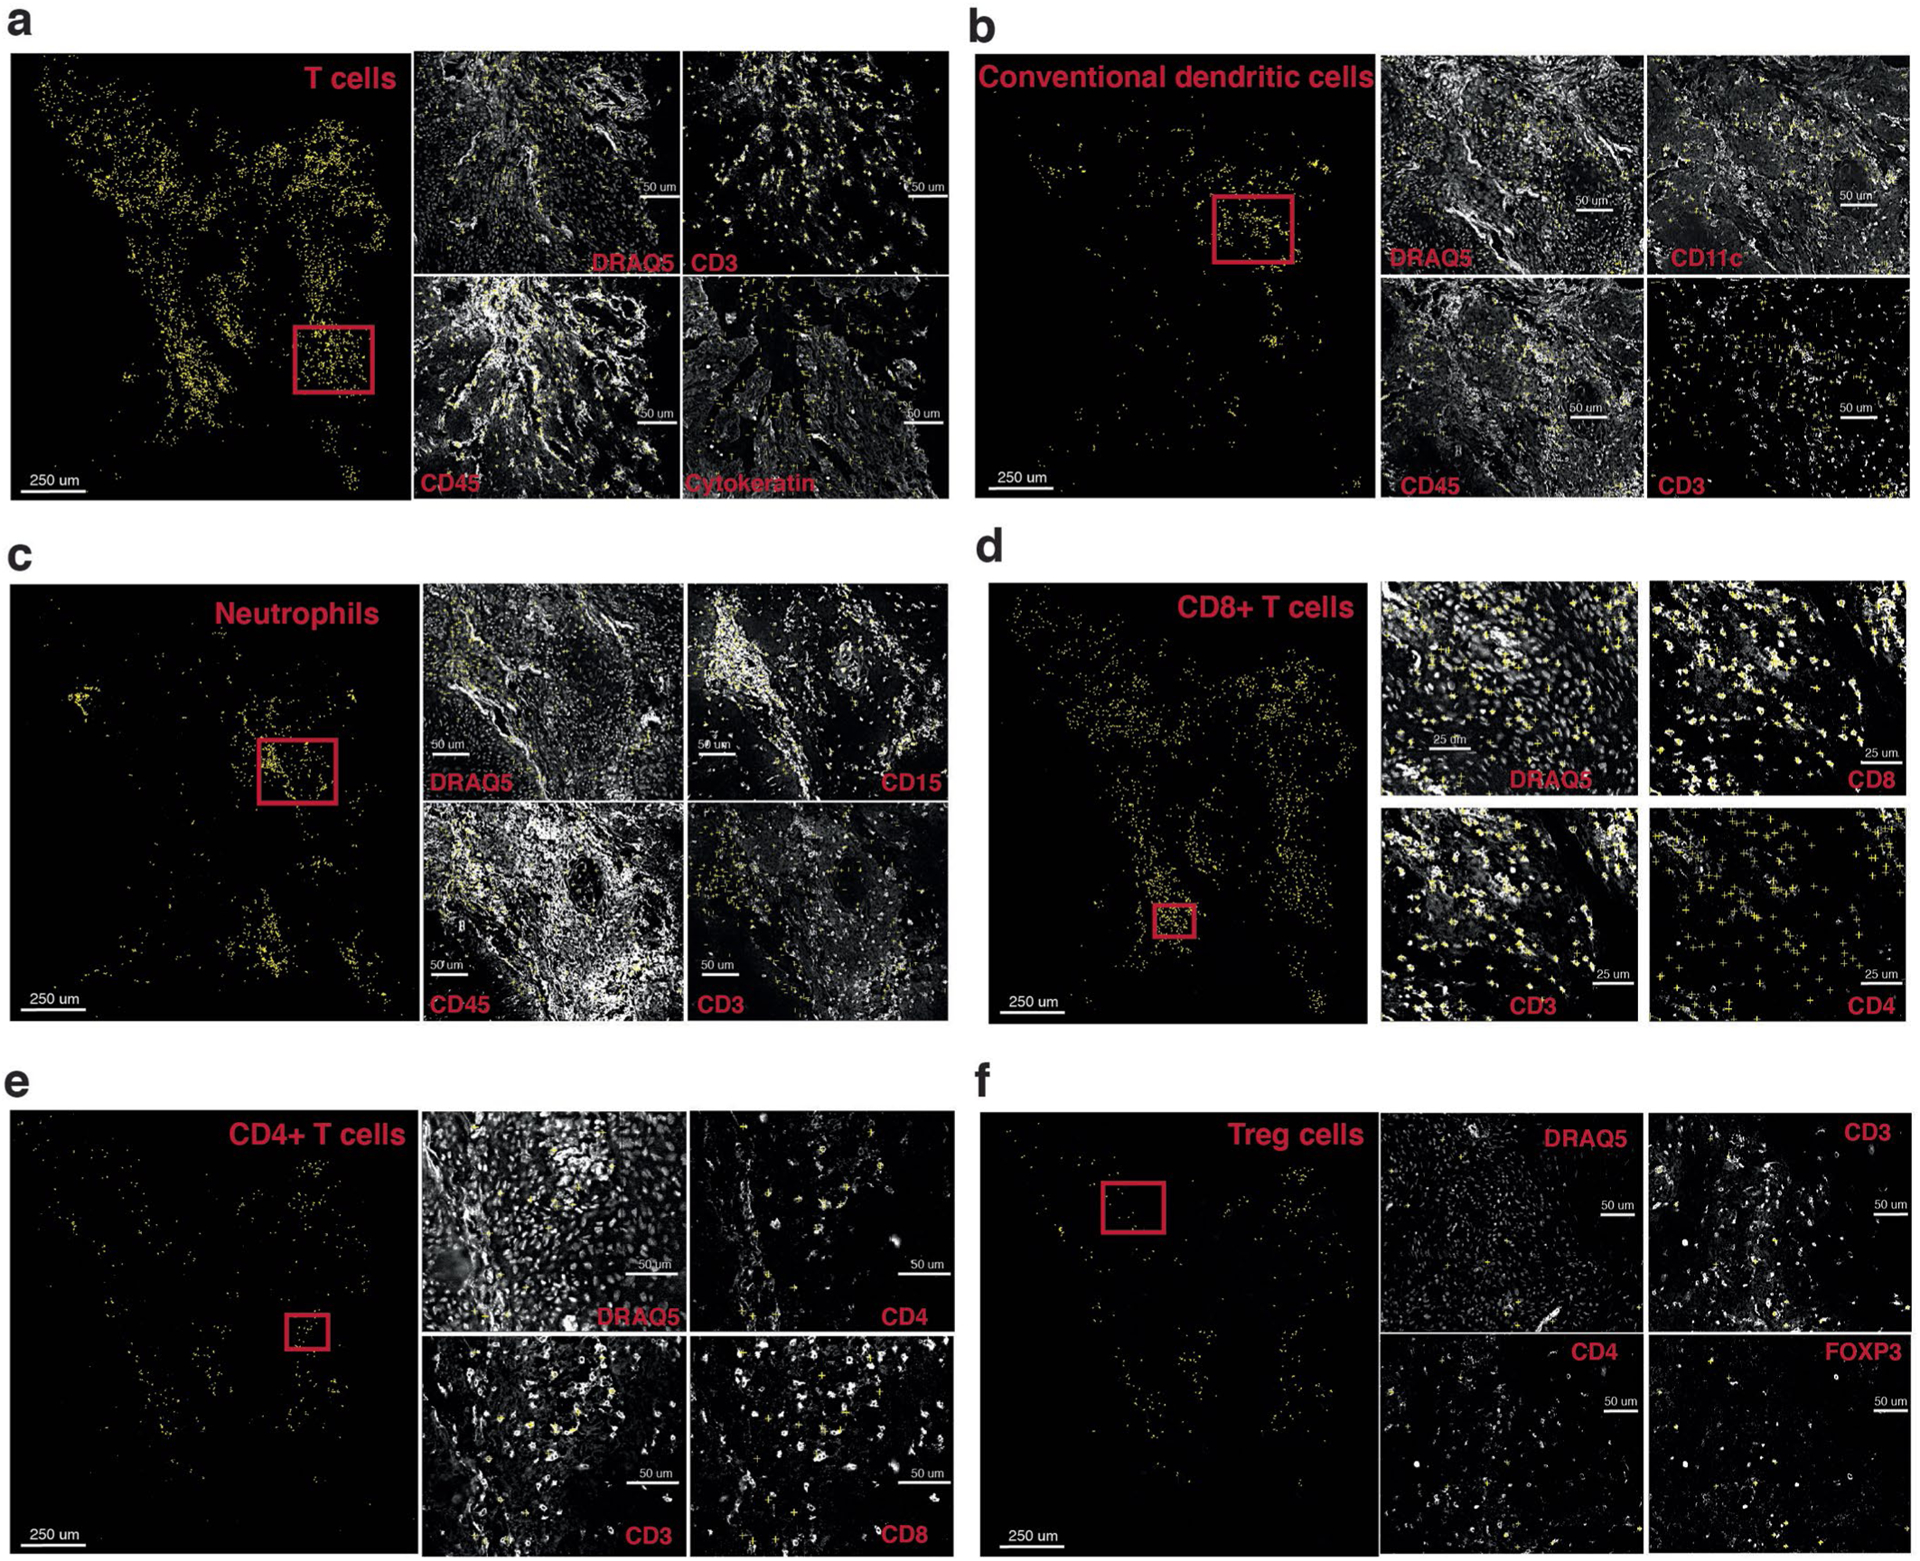
(a)–(f) Identified cells are shown as yellow crosses using the x and y coordinates overlaid on canonical marker staining (white) CODEX images. For each cell type, nuclei staining and three example markers (positive and negative) important for the cell type are shown. Cell types shown (a)–(f): T cells, conventional dendritic cells, neutrophils, CD8 + T cells, CD4 + T cells, Treg cells.
Extended Data Fig. 8 |. Gating strategies on the head and neck squamous cell carcinoma (HNSCC) samples.
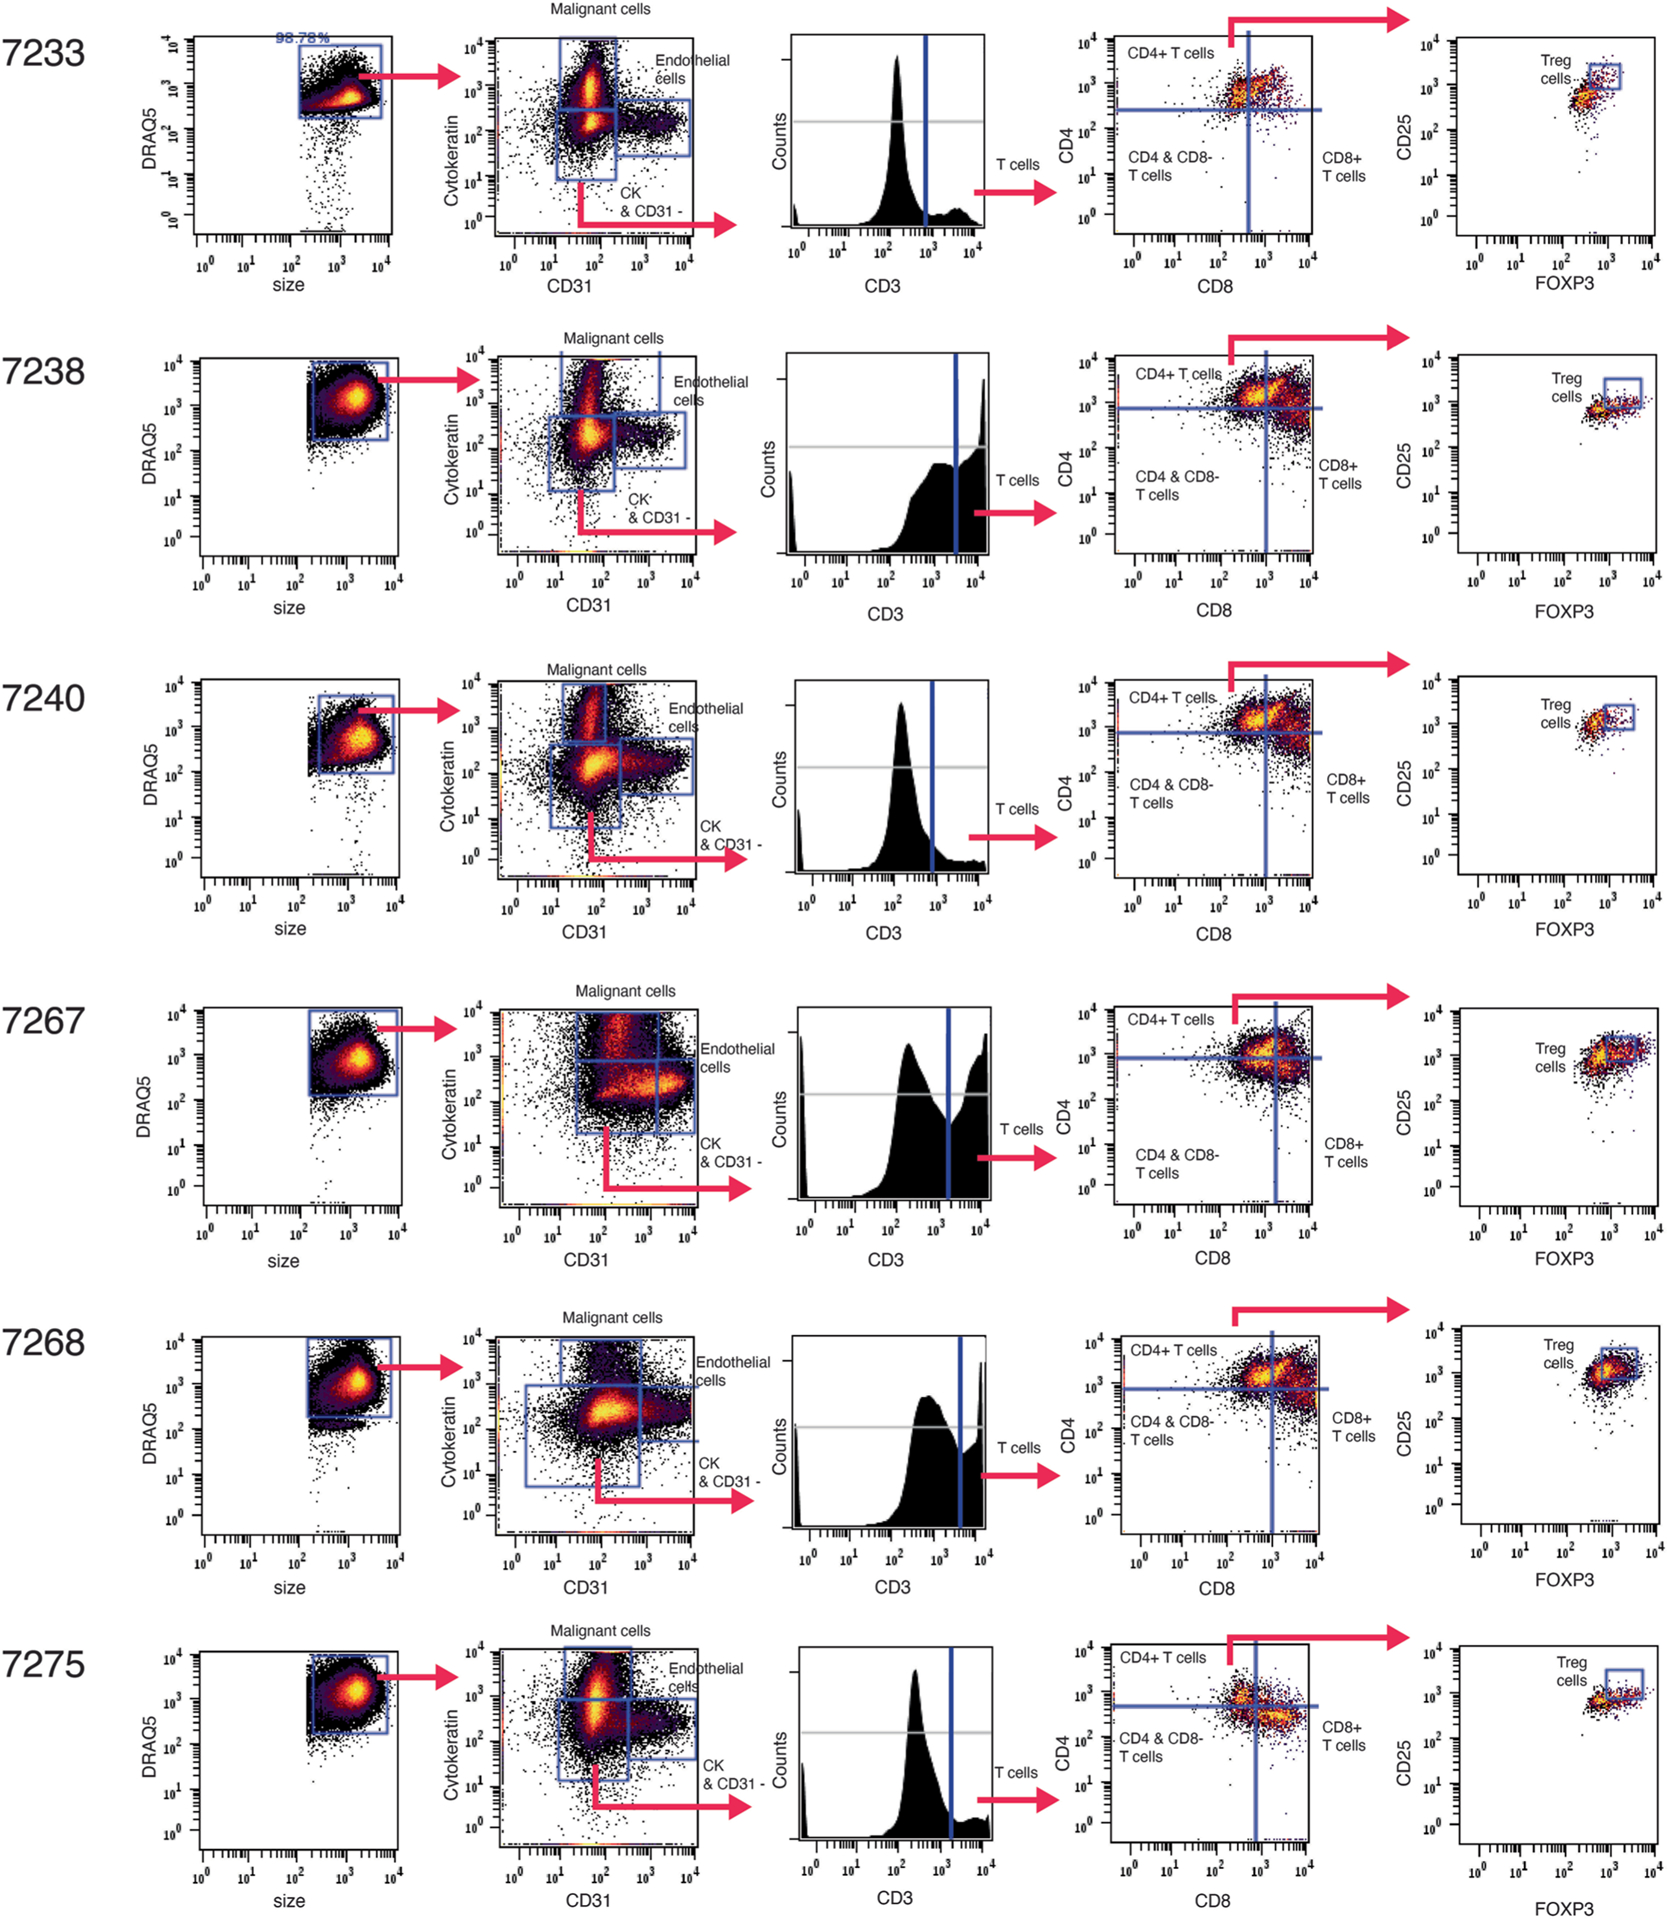
Gating strategies used to identify key cell types relevant to the HNSCC study including malignant cells, endothelial cells and subtypes of T cells.
Extended Data Fig. 9 |. Additional scRNA-seq analysis of primary HNSCC samples and scRNA-seq analysis using public domain data from Puram et al. (2017)34.
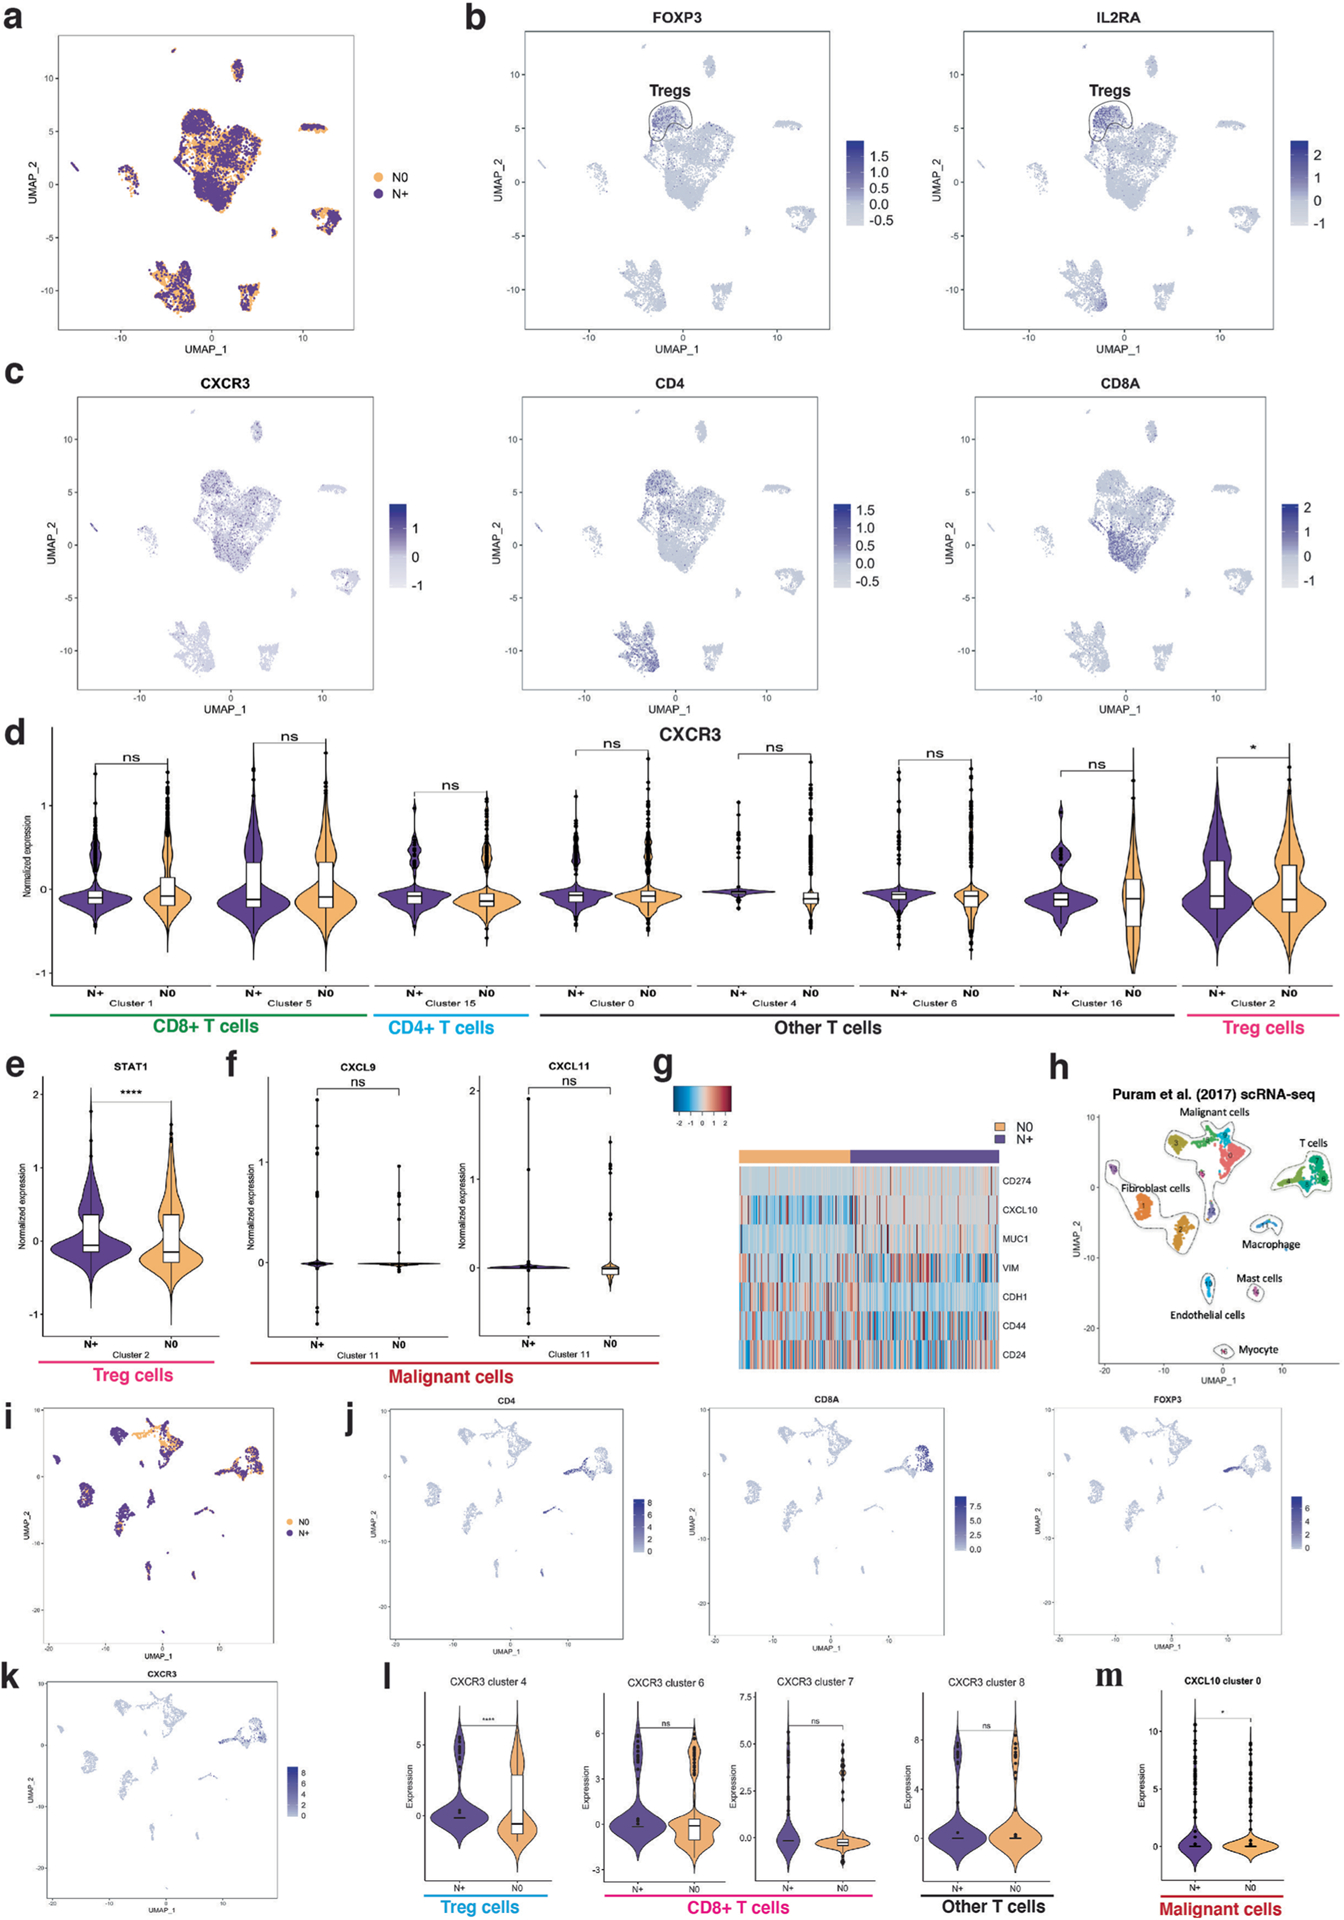
(a) UMAP plot of identified cell clusters with node status on the study HNSCC cohort. (b)–(c) UMAP plots highlighting expression of FOXP3, IL2RA, CXCR3, CD4 and CD8A. (d) CXCR3 expression in different T cell clusters showing that CXCR3 is differentially expressed in N0 (n = 2) versus N + (n = 2) samples only in the Treg cells. (e) Violin plot of STAT1 expression in the Treg cluster between N + (n = 2) and N0 (n = 2) samples. STAT1 is a CXCR3 inducer. (f) Violin plot of CXCL9 and CXCL11 in the malignant cell cluster between N + (n = 2) and N0 (n = 2) samples. CXCL9 and CXCL11 are both ligands of CXCR3, but they are not differentially expressed in our data. (g) Heatmap shows expressions of CD274 (PD-L1), MUC1, EMT markers (CDH1 and VIM) and stemness markers (CD44 and CD24). (h) UMAP of identified cell clusters using the Puram et al. dataset. (i) UMAP of identified cell type clusters with node status color-coded. (j) UMAP plots of CD4, CD8A, and FOXP3. (k) UMAP plot of CXCR3. (l) Violin plots of CXCR3 in the T cell clusters between N + (n = 12) and N0 (n = 6) samples. (m) Violin plot of CXCL10 in malignant cell cluster 0 between N + (n = 12) and N0 (n = 6) samples. Differentially expressed genes were identified using SAMR and false discovery rate was used to adjust p-values. Center line of box plot defines data median, top value indicates largest value within 1.5 times interquartile range above 75th percentile, bottom value indicates smallest value within 1.5 times interquartile range below 25th percentile, and upper and lower bounds of the box plot indicate 75th and 25th percentile respectively. *: adjusted p-value < 0.05, **: adjusted p-value < 0.01, ***: adjusted p-value < 0.005, ****: adjusted p-value < 0.001.
Extended Data Fig. 10 |. Gating strategies used for mouse model studies.
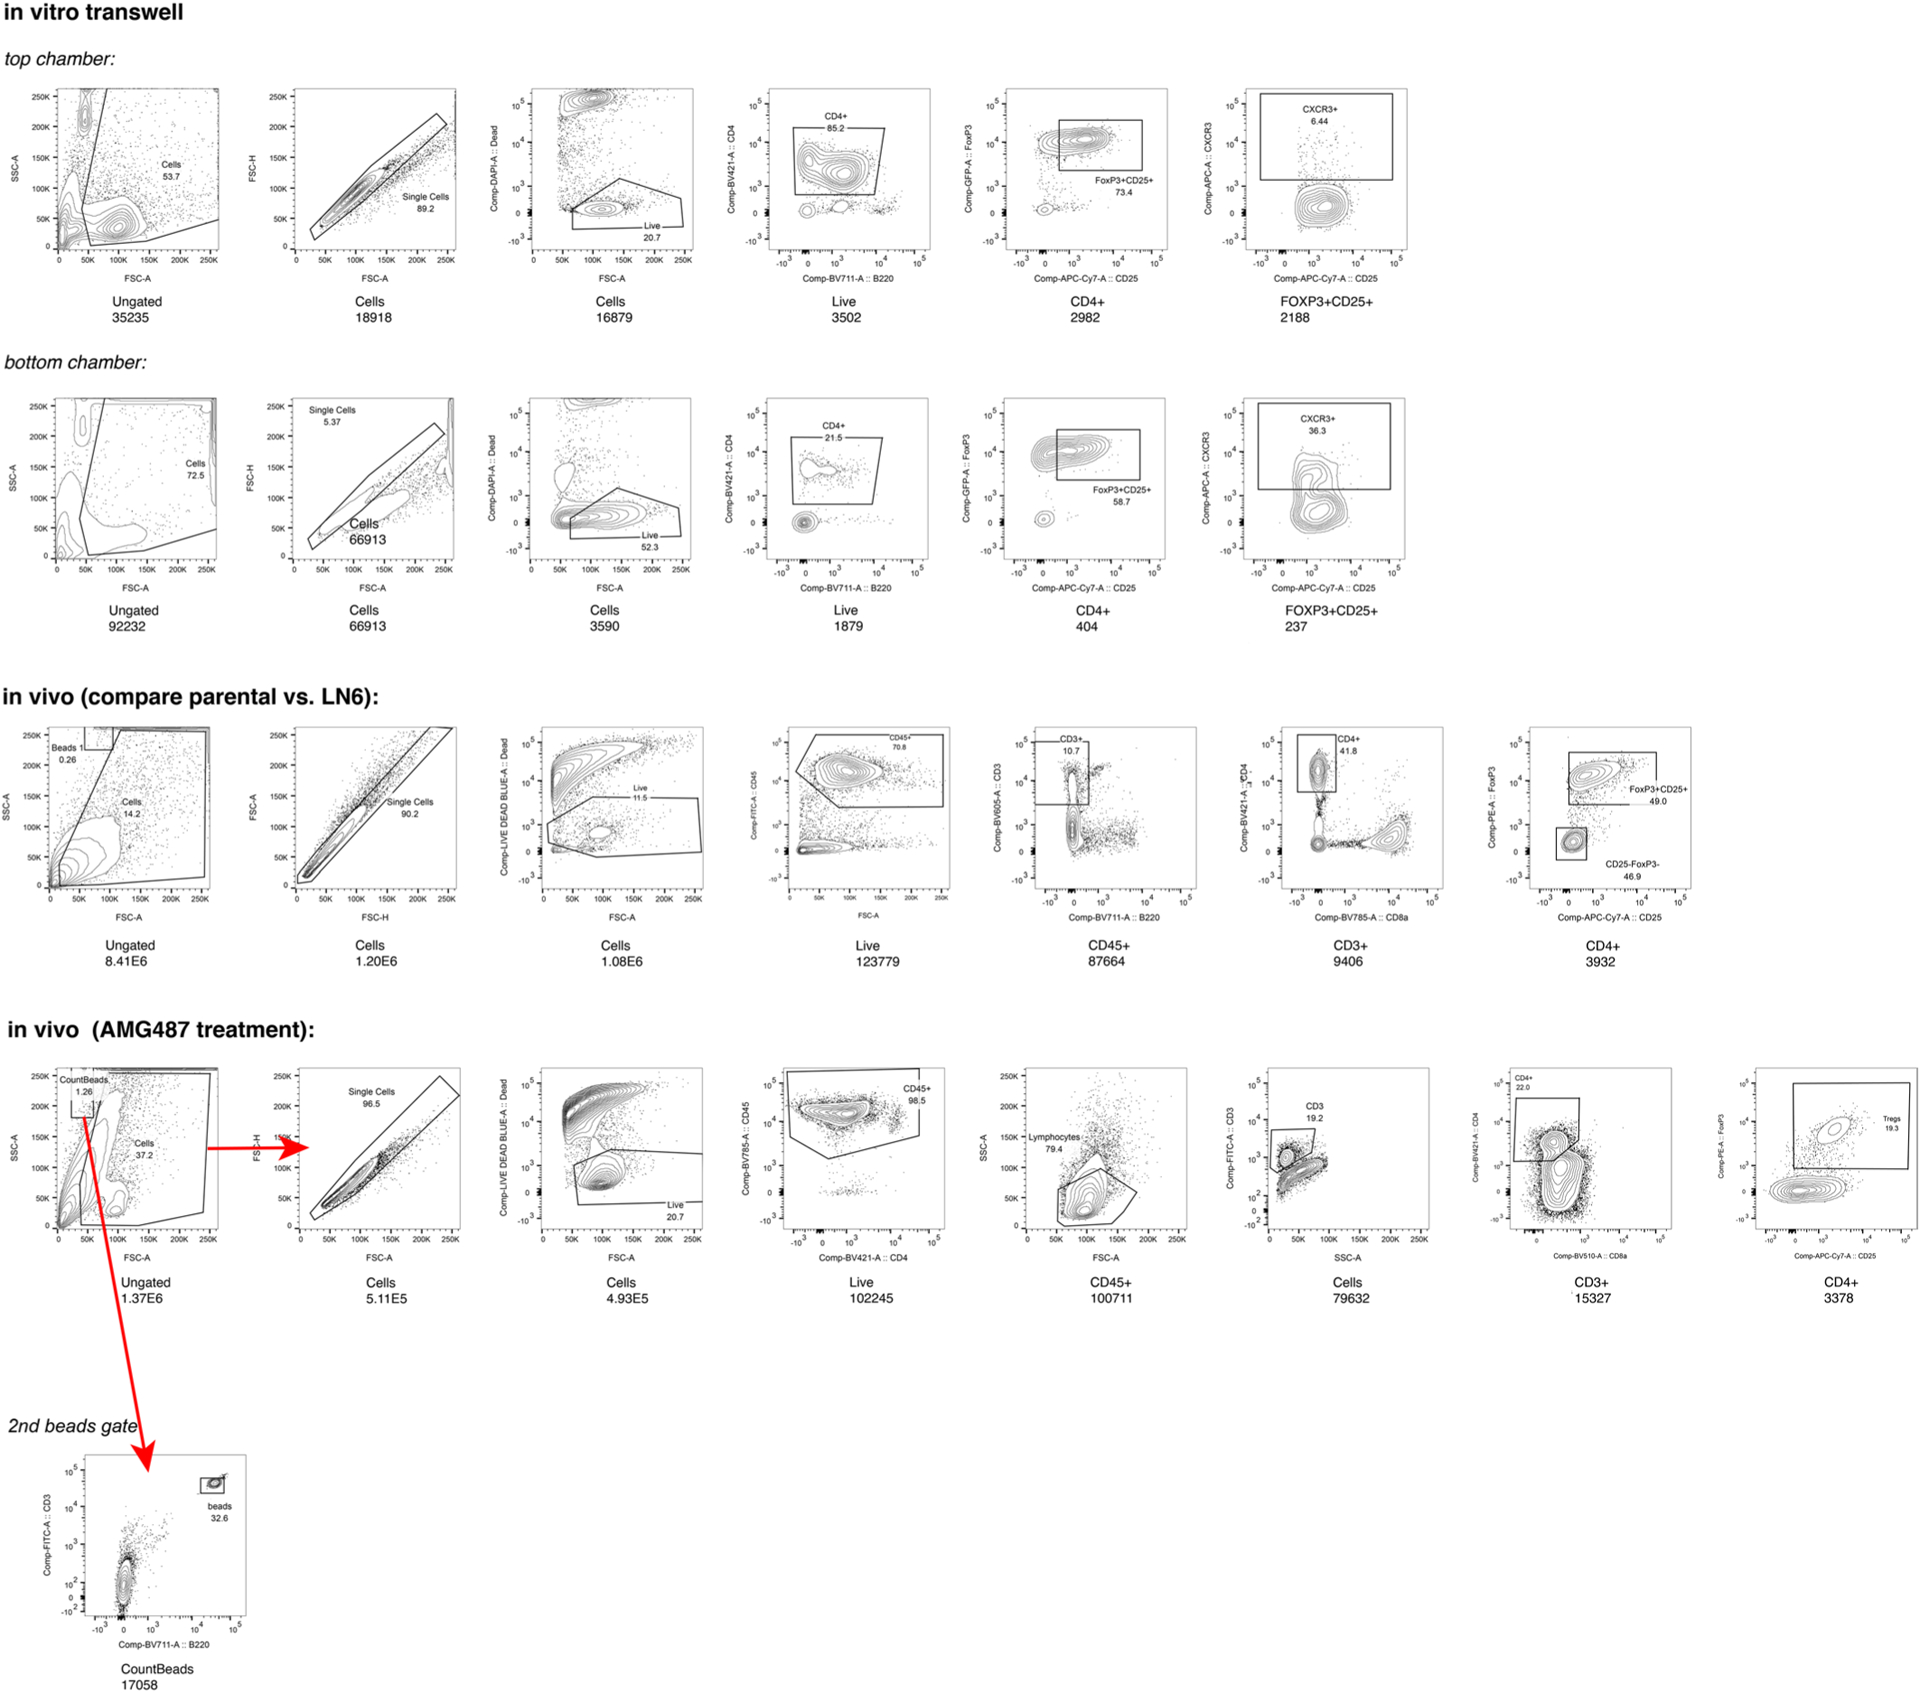
Gating strategies used to study CXCL10–CXCR3 crosstalk between malignant and Treg cells in the functional studies.
Supplementary Material
Acknowledgements
This work was supported by the National Institute of Health, National Cancer Institute U54 CA209971. In addition, Q.-T.L. was supported by T31IP1598 from the TRDRP (Tobacco-Related Disease Research program). Q.-T.L., R.L. and E.G.E. were additionally supported by NIH grant R01 DE029672-01A1. Z.G. was supported by funding from Parker Institute for Cancer Immunotherapy at San Francisco, CA, USA and Stanford Cancer Institute, CA, USA. The authors are grateful to the Nolan Lab of Stanford University for their input on CODEX imaging data.
Competing interests
Z.G. is an inventor on two patent applications and an investor in Boom Capital Ventures, and a consultant for Mubadala Ventures, GLG and Atheneum Partners. Q.-T.L. has received grants from Varian and serves as a consultant for Nanobiotix, Coherus, Merck and Roche. All other authors have no competing interests.
Footnotes
Online content
Any methods, additional references, Nature Research reporting summaries, source data, extended data, supplementary information, acknowledgements, peer review information; details of author contributions and competing interests; and statements of data and code availability are available at https://doi.org/10.1038/s41592-022-01498-z.
Extended data is available for this paper at https://doi.org/10.1038/s41592-022-01498-z.
Supplementary information The online version contains supplementary material available at https://doi.org/10.1038/s41592-022-01498-z.
Data availability
The scRNA-seq data are deposited at GEO: GSE140042. HNSCC imaging data are hosted at Synapse.org SageBionetworks at https://doi.org/10.7303/syn26242593. The benchmark public imaging data can be found at https://doi.org/10.7937/tcia.2020.fqn0-0326. Source data are provided with this paper.
Code availability
All codes related to CELESTA can be found at https://github.com/plevritis/CELESTA. The source codes are also hosted at Code Ocean at https://doi.org/10.24433/CO.0677810.v1 (ref.49).
References
- 1.Stack EC, Wang C, Roman KA & Hoyt CC Multiplexed immunohistochemistry, imaging, and quantitation: a review, with an assessment of tyramide signal amplification, multispectral imaging and multiplex analysis. Methods 70, 46–58 (2014). [DOI] [PubMed] [Google Scholar]
- 2.Angelo M et al. Multiplexed ion beam imaging (MIBI) of human breast tumors. Nat. Med 20, 436–442 (2014). [DOI] [PMC free article] [PubMed] [Google Scholar]
- 3.Wang YJ et al. Multiplexed in situ imaging mass cytometry analysis of the human endocrine pancreas and immune system in type 1 diabetes. Cell Metab. 29, 769–783 (2019). [DOI] [PMC free article] [PubMed] [Google Scholar]
- 4.Ptacek J et al. Multiplexed ion beam imaging (MIBI) for characterization of the tumor microenvironment across tumor types. Lab. Invest 100, 1111–1123 (2020). [DOI] [PubMed] [Google Scholar]
- 5.Parra ER, Francisco-Cruz A & Wistuba II State-of-the-art of profiling immune contexture in the era of multiplexed staining and digital analysis to study paraffin tumor tissues. Cancers (Basel) 11, 247 (2019). [DOI] [PMC free article] [PubMed] [Google Scholar]
- 6.Schürch CM et al. Coordinated cellular neighborhoods orchestrate antitumoral immunity at the colorectal cancer invasive front. Cell 182, 1341–1359 (2020). [DOI] [PMC free article] [PubMed] [Google Scholar]
- 7.Gillies RJ, Verduzco D & Gatenby RA Evolutionary dynamics of carcinogenesis and why targeted therapy does not work. Nat. Rev. Cancer 12, 487–493 (2012). [DOI] [PMC free article] [PubMed] [Google Scholar]
- 8.Heindl A, Nawaz S & Yuan Y Mapping spatial heterogeneity in the tumor microenvironment: a new era for digital pathology. Lab. Invest 95, 377–384 (2015). [DOI] [PubMed] [Google Scholar]
- 9.Alfarouk KO, Ibrahim ME, Gatenby RA & Brown JS Riparian ecosystems in human cancers. Evol. Appl 6, 46–53 (2013). [DOI] [PMC free article] [PubMed] [Google Scholar]
- 10.Little SE et al. Receptor tyrosine kinase genes amplified in glioblastoma exhibit a mutual exclusivity in variable proportions reflective of individual tumor heterogeneity. Cancer Res. 72, 1614–1620 (2012). [DOI] [PubMed] [Google Scholar]
- 11.Herzenberg LA, Tung J, Moore WA, Herzenberg LA & Parks DR Interpreting flow cytometry data: a guide for the perplexed. Nat. Immunol 7, 681–685 (2006). [DOI] [PubMed] [Google Scholar]
- 12.Aghaeepour N et al. Critical assessment of automated flow cytometry data analysis techniques. Nat. Methods 10, 228–238 (2013). [DOI] [PMC free article] [PubMed] [Google Scholar]
- 13.Shekhar K, Brodin P, Davis MM & Chakraborty AK Automatic classification of cellular expression by nonlinear stochastic embedding (ACCENSE). Proc. Natl Acad. Sci. USA 111, 202–207 (2014). [DOI] [PMC free article] [PubMed] [Google Scholar]
- 14.Goltsev Y et al. Deep profiling of mouse splenic architecture with CODEX multiplexed imaging. Cell 174, 968–981 (2018). [DOI] [PMC free article] [PubMed] [Google Scholar]
- 15.Black S et al. CODEX multiplexed tissue imaging with DNA-conjugated antibodies. Nat. Protoc 16, 3802–3835 (2021). [DOI] [PMC free article] [PubMed] [Google Scholar]
- 16.Ren X et al. Reconstruction of cell spatial organization from single-cell RNA sequencing data based on ligand-receptor mediated self-assembly. Cell Res. 30, 763–778 (2020). [DOI] [PMC free article] [PubMed] [Google Scholar]
- 17.Lee HC, Kosoy R, Becker CE, Dudley JT & Kidd BA Automated cell type discovery and classification through knowledge transfer. Bioinformatics 33, 1689–1695 (2017). [DOI] [PMC free article] [PubMed] [Google Scholar]
- 18.Wu FY The Potts model. Rev. Mod. Phys 54, 235–268 (1982). [Google Scholar]
- 19.Storath M, Weinmann A, Frikel J & Unser M Joint image reconstruction and segmentation using the Potts model. Inverse Probl. 31, 025003 (2015). [Google Scholar]
- 20.Celeux G, Forbes F & Peyrard N EM-based image segmentation using Potts models with external field. [Research Report] RR-4456 INRIA (2002). https://hal.inria.fr/inria-00072132 [Google Scholar]
- 21.Pettit JB et al. Identifying cell types from spatially referenced single-cell expression datasets. PLoS Comput. Biol 10, e1003824 (2014). [DOI] [PMC free article] [PubMed] [Google Scholar]
- 22.Li Q, Yi F, Wang T, Xiao G & Liang F Lung cancer pathological image analysis using a hidden Potts model. Cancer Inform. 16, 1176935117711910 (2017). [DOI] [PMC free article] [PubMed] [Google Scholar]
- 23.Celeux G, Forbes F & Peyrard N EM procedures using mean field-like approximations for Markov model-based image segmentation. Pattern Recogn. 36, 131–144 (2003). [Google Scholar]
- 24.Samusik N, Good Z, Spitzer MH, Davis KL & Nolan GP Automated mapping of phenotype space with single-cell data. Nat. Methods 13, 493–496 (2016). [DOI] [PMC free article] [PubMed] [Google Scholar]
- 25.Van Gassen S et al. FlowSOM: using self-organizing maps for visualization and interpretation of cytometry data. Cytometry A 87, 636–645 (2015). [DOI] [PubMed] [Google Scholar]
- 26.Aghaeepour N, Nikolic R, Hoos HH & Brinkman RR Rapid cell population identification in flow cytometry data. Cytometry A 79, 6–13 (2011). [DOI] [PMC free article] [PubMed] [Google Scholar]
- 27.Liu X et al. A comparison framework and guideline of clustering methods for mass cytometry data. Genome Biol. 20, 297 (2019). [DOI] [PMC free article] [PubMed] [Google Scholar]
- 28.Denisenko E et al. Systematic assessment of tissue dissociation and storage biases in single-cell and single-nucleus RNA-seq workflows. Genome Biol. 21, 130 (2020). [DOI] [PMC free article] [PubMed] [Google Scholar]
- 29.Leslie TF & Kronenfeld BJ The colocation quotient: a new measure of spatial association between categorical subsets of points. Geogr. Anal 43, 306–326 (2011). [Google Scholar]
- 30.Arnol D, Schapiro D, Bodenmiller B, Saez-Rodriguez J & Stegle O Modeling cell–cell interactions from spatial molecular data with spatial variance component analysis. Cell Rep. 29, 202–211 (2019). [DOI] [PMC free article] [PubMed] [Google Scholar]
- 31.Ramilowski JA et al. A draft network of ligand-receptor-mediated multicellular signalling in human. Nat. Commun 6, 7866 (2015). [DOI] [PMC free article] [PubMed] [Google Scholar]
- 32.Butler A, Hoffman P, Smibert P, Papalexi E & Satija R Integrating single-cell transcriptomic data across different conditions, technologies, and species. Nat. Biotechnol 36, 411–420 (2018). [DOI] [PMC free article] [PubMed] [Google Scholar]
- 33.Stuart T et al. Comprehensive integration of single-cell data. Cell 177, 1888–1902 (2019). [DOI] [PMC free article] [PubMed] [Google Scholar]
- 34.Puram SV et al. Single-cell transcriptomic analysis of primary and metastatic tumor ecosystems in head and neck cancer. Cell 171, 1611–1624 (2017). [DOI] [PMC free article] [PubMed] [Google Scholar]
- 35.Reticker-Flynn N et al. Lymph node colonization induces tumor-immune tolerance to promote distant metastasis. Cell (2022). 10.1016/j.cell.2022.04.019 [DOI] [PMC free article] [PubMed] [Google Scholar]
- 36.Zhu G et al. CXCR3 as a molecular target in breast cancer metastasis: inhibition of tumor cell migration and promotion of host anti-tumor immunity. Oncotarget 6, 43408–43419 (2015). [DOI] [PMC free article] [PubMed] [Google Scholar]
- 37.Cambien B et al. Organ-specific inhibition of metastatic colon carcinoma by CXCR3 antagonism. Br. J. Cancer 100, 1755–1764 (2009). [DOI] [PMC free article] [PubMed] [Google Scholar]
- 38.Walser TC et al. Antagonism of CXCR3 inhibits lung metastasis in a murine model of metastatic breast cancer. Cancer Res. 66, 7701–7707 (2006). [DOI] [PubMed] [Google Scholar]
- 39.Kim D, Curthoys NM, Parent MT & Hess ST Bleed-through correction for rendering and correlation analysis in multi-colour localization microscopy. J. Opt 15, 094011 (2013). [DOI] [PMC free article] [PubMed] [Google Scholar]
- 40.Rich RM et al. Elimination of autofluorescence background from fluorescence tissue images by use of time-gated detection and the AzaDiOxaTriAngulenium (ADOTA) fluorophore. Anal. Bioanal. Chem 405, 2065–2075 (2013). [DOI] [PMC free article] [PubMed] [Google Scholar]
- 41.Groom JR & Luster AD CXCR3 in T cell function. Exp. Cell Res 317, 620–631 (2011). [DOI] [PMC free article] [PubMed] [Google Scholar]
- 42.Wightman SC et al. Oncogenic CXCL10 signalling drives metastasis development and poor clinical outcome. Br. J. Cancer 113, 327–335 (2015). [DOI] [PMC free article] [PubMed] [Google Scholar]
- 43.Ranasinghe R & Eri R Modulation of the CCR6-CCl20 axis: a potential therapeutic target in inflammation and cancer. Medicina 54, 88 (2018). [DOI] [PMC free article] [PubMed] [Google Scholar]
- 44.Rubie C et al. CCL20/CCR6 expression profile in pancreatic cancer. J. Transl. Med 8, 45 (2010). [DOI] [PMC free article] [PubMed] [Google Scholar]
- 45.Osuala KO & Sloane BF Many roles of CCL20: emphasis on breast cancer. Postdoc J. 2, 7–16 (2014). [PMC free article] [PubMed] [Google Scholar]
- 46.Kindermann R & Snell JL Markov Random Fields and their Applications (American Mathematical Society, 1980). [Google Scholar]
- 47.Tusher VG, Tibshirani R & Chu G Significance analysis of microarrays applied to the ionizing radiation response. Proc. Natl Acad. Sci. USA 98, 5116–5121 (2001). [DOI] [PMC free article] [PubMed] [Google Scholar]
- 48.Haribhai D et al. Regulatory T cells dynamically control the primary immune response to foreign antigen. J. Immunol 178, 2961–2972 (2007). [DOI] [PubMed] [Google Scholar]
- 49.Zhang W, Lim T, Li I & Plevritis S CELESTA (automate machine learning cell type identification for multiplexed in situ imaging data) [Source Code]. Code Ocean 10.24433/CO.0677810.v1 (2022). [DOI] [Google Scholar]
Associated Data
This section collects any data citations, data availability statements, or supplementary materials included in this article.
Supplementary Materials
Data Availability Statement
The scRNA-seq data are deposited at GEO: GSE140042. HNSCC imaging data are hosted at Synapse.org SageBionetworks at https://doi.org/10.7303/syn26242593. The benchmark public imaging data can be found at https://doi.org/10.7937/tcia.2020.fqn0-0326. Source data are provided with this paper.


