

Abstract
The mechanical wear and tear of soft connective tissue from repetitive joint loading is a primary factor in degenerative joint disease, and therefore methods are needed to accurately characterize wear in joint structures. Here, we evaluate the accuracy of using a structured light 3D optical scanning system and modeling software to quantify and visualize volume loss in whole human meniscus subjected to in vitro joint loading. Using 3D printed meniscus replicas with known wear volumes, we determined that this novel imaging method has a mean accuracy of approximately 13 mm3, corresponding to a mean error of less than 7% when measuring meniscal volumetric changes of 0.2 cm3 (size of a pea). The imaging method was then applied to measure the in vitro wear of whole human menisci at four time points when a single cadaveric knee was subjected to one million cycles of controlled joint loading. The medial and lateral menisci reached steady state volumetric reductions of 0.72 cm3 and 0.34 cm3 per million cycles, respectively. Colorimetric maps of linear wear depth revealed high wear and deformation in the posterior regions of both the medial and lateral menisci. For the first time, this study has developed a method to accurately characterize volume loss in whole meniscus subjected to in vitro joint loading. This 3D scanning method offers researchers a new investigative tool to study mechanical wear and joint degeneration in meniscus, and other soft connective tissues.
Keywords: 3D optical scanning, Fatigue testing, Tribology, Meniscus degeneration, Knee biomechanics, Soft tissue
1. Introduction
The knee menisci are composed of two semicircular fibrocartilaginous structures that distribute and attenuate 40–70% of contact forces across the knee joint (Gelbart and Firer, 2009; Makris et al., 2011). Over time, repetitive physical activity and mechanical wear contribute to meniscal degeneration (Rao et al., 2015); a retrogressive breakdown of meniscal fibrous tissue that affects over half of individuals above 70 years of age (Englund et al., 2008). These microstructural changes to the collagen fiber networks increase the risk of multiplanar tears, joint instability, and progression of osteoarthritis (Gelbart and Firer, 2009; Makris et al., 2011; Rao et al., 2015). In order to advance prevention and intervention strategies for meniscal degeneration, it is imperative to characterize the physiological wear behavior of meniscus to ultimately identify specific loading conditions and activities that alter meniscal wear rates.
A significant challenge to characterizing meniscal wear behavior is the lack of an established method for measuring wear parameters in soft tissue. Mechanical wear is defined as the removal of material from a solid surface as a result of mechanical action exerted by another solid surface, and is most commonly characterized by calculating the mass or volume of material removed for specific loading conditions (Bayer, 2004; Verberne et al., 2009). Mechanical wear is dependent on the contact conditions and the type of lubricant at the interface. For the human knee joint, contact conditions include axial compression, torsion, and sliding motion, with synovial fluid acting as an essential lubricant to reduce cartilage friction and wear (Ghosh et al., 2014; Verberne et al., 2009). Gravimetric analysis is a standard wear measurement technique used to quantify mass loss in conventional materials, however, this method requires vacuum desiccation at various time points and thus would not be suitable for hydrated soft tissue (Elsner et al., 2015; Hollar et al., 2018; ISO 14242–2, 2006). Pin-on-plate and pin-on-disk devices are commonly used to measure wear parameters in biological materials (Bowland et al., 2018; Northwood and Fisher, 2007; Warnecke et al., 2019), but these methods are designed for small sectioned specimens and are unable to characterize the wear and deformation that occurs in whole tissue structures during physiological joint loading. On the other hand, pendulum systems are used to evaluate the tribological performance (in terms of friction) of whole synovial joints while maintaining natural joint conditions and interactions (Akelman et al., 2013; Cai et al., 2017; de Roy et al., 2021). However, these systems are unable to measure volumetric changes due to wear and deformation. Alternatively, micro-computed tomography (μCT) and magnetic resonance imaging (MRI) can detect volumetric changes in soft tissue (Bowers et al., 2007; Das Neves Borges et al., 2014; Fukuta et al., 2009), yet these methods are time consuming, costly, and MRI has limited imaging resolution for detecting microscale changes (Fukuta et al., 2009; Hollar et al., 2018). A more recent study utilized an optical profilometry technique to measure localized volume loss in porcine meniscus subjected to in vitro joint loading (Bowland et al., 2018), but no in vitro study has measured volume loss and deformation in whole meniscus.
An imaging technology that has the potential to accurately measure volume loss in whole meniscus, and other tissues with complex morphology, is structured light 3D optical scanning (3D scanning). 3D scanning technology utilizes a projector to emit parallel lines onto a 3D object of interest. High resolution cameras capture the distorted light pattern and the displacements of the distorted lines are converted to surface coordinates that are used to generate full 3D reconstructions of the object geometry. 3D scanning has been proven to be fast, cost effective, and capable of detecting small surface irregularities (Affatato et al., 2017; Hollar et al., 2018; Valigi et al., 2017). While 3D scanning has successfully measured wear behavior in hip implants (Hollar et al., 2018) and mobile meniscus inserts (Affatato et al., 2020), no study has yet developed a method to use this imaging technology to measure wear behavior in human meniscus, or any soft tissue. The objective of this work was to develop and evaluate an in vitro procedure for accurate characterization and visualization of volumetric changes using a 3D scanner. This procedure was then used in a feasibility study to quantify the volume loss of whole human menisci in a single cadaveric knee subjected to quasi-physiological joint loading conditions.
2. Materials and methods
This study was done in three parts. Parts I and II evaluated the accuracy of the proposed methodology through surrogate models of known dimensions. Part III utilized this method to quantify volume loss in the medial and lateral menisci of a single cadaveric knee subjected to one million cycles of controlled joint loading.
2.1. Experimental scanning procedure to characterize volume loss
The 3D optical scanner consisted of a projector, rotary table, and two high-resolution cameras (LMI Technologies, Delta, Canada; HDI Advance R3 projector with 16 mm lenses; 2.8 megapixels) (Fig. 1A). The system was operated through FlexScan3D software (LMI Technologies, v3.3.2) on a computer with a 2.4 GHz processor. The scanner was calibrated following an established protocol (Hollar et al., 2018) using a calibration card consisting of a 6 × 4.5 cm grid of 5 × 5 mm black and white squares. The procedure to quantify and visualize volumetric wear can be divided into two main steps: data acquisition and post processing. For data acquisition, 3D rendered models were generated at three different time points: pre-wear, post-wear, and tibia only (Fig. 1B). Scanning was done in a dark room with the only light source coming from the projector. This was done to minimize the amount of ambient light that could influence scan quality (Hollar et al., 2018). In the scanning software, the exposure settings were set to high dynamic range (HDR), which automatically determined the optimum exposure by scanning the object of interest multiple times at varying exposure levels (exposure time = 16.67 ms-150 ms). This advanced exposure setting was necessary to capture high contrast variances between light and dark patterns of the tibia and menisci. The object of interest was scanned every 30-degrees using the rotary table (Fig. 1A) for a total of 12 scans resulting in a full 360-degree captured view. The data acquisition step took approximately 10 min to complete.
Fig. 1.
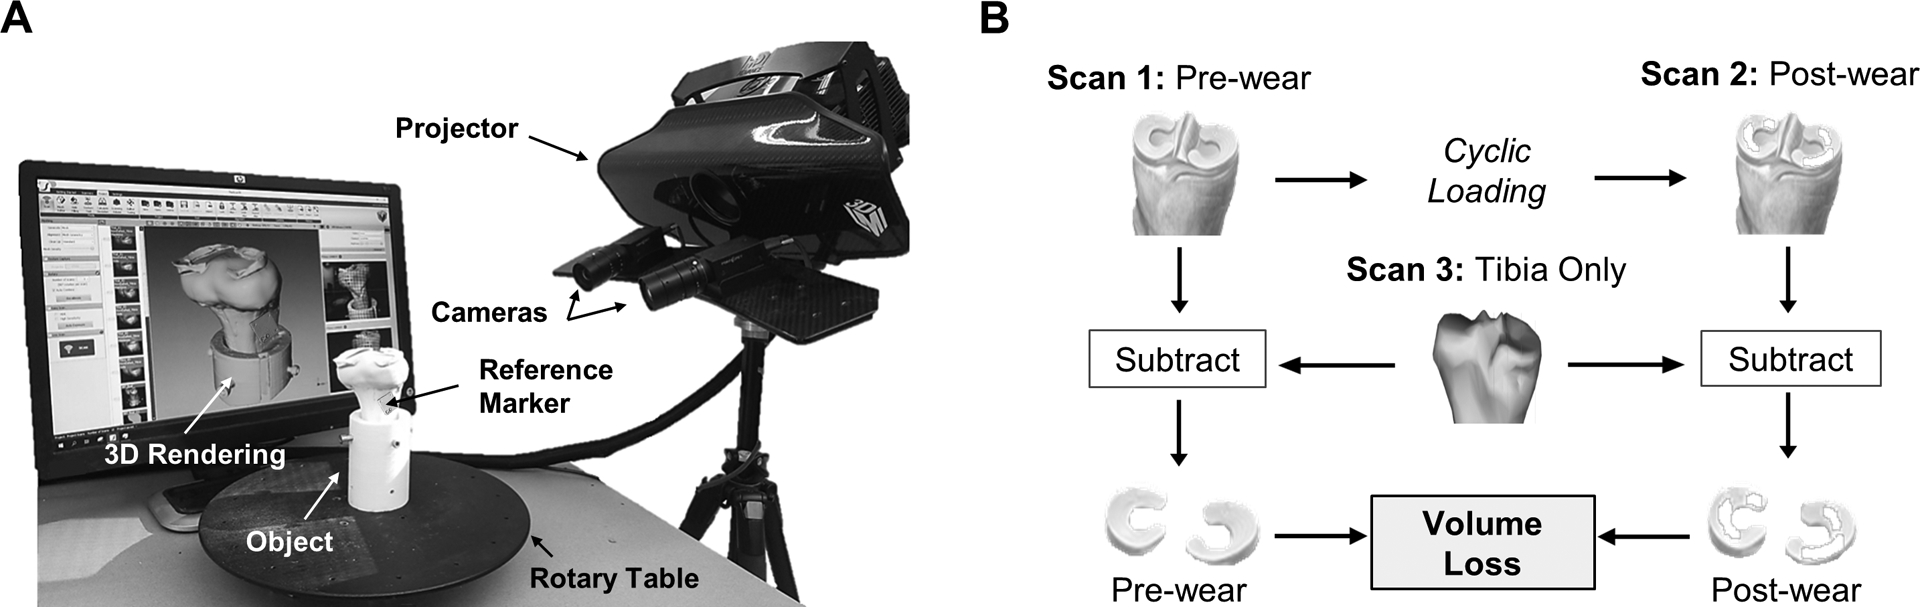
The 3D scanner system and imaging method. A) Two cameras record the distortion of projected light patterns upon a rotated object, and the scanner software converts this data into surface coordinates to generate a 3D rendering. B) Flowchart of the experimental method used to calculate volumetric loss by first subtracting the tibia from the pre- and post-wear scans to isolate the meniscus, and then subtracting the pre- and post-wear meniscal volumes.
During post-processing, all 12 scans were combined into a 3D model by automatically fine aligning each scan based on common geometry. This was done to generate models of the tibia-only, pre-wear, and post-wear conditions (Fig. 1B). A common geometry subtraction (CGS) technique was used to isolate the menisci from the pre- and post-wear 3D models. This was done by subtracting common geometry (i.e. the tibia) between the tibia-only 3D model and the pre- and post-wear 3D models following the experimental method (Fig. 1B). Prior to CGS, the pre- and post-wear models were merged (registered) with the tibia-only model using the fixed geometry of a reference marker (Fig. 1A). This merging process is described in detail in Hollar et al. (2018), and resulted in average surface deviations of 26 ± 4 μm between the reference markers of the tibia-only 3D model and pre- and post-wear 3D models. Open-source software, CloudCompare (Telecom Paris, v2.10.3) was then used to perform CGS using the Mesh Boolean Operations with the Cork feature and the Difference function to isolate the menisci. After CGS was performed, non-meniscus artifacts were removed and holes were filled to create a water tight model. The total volume of each meniscus was then measured. The wear volume (Vmeasured) was calculated by subtracting the post-wear meniscal volume from the pre-wear meniscal volume (Fig. 1B). The post processing step of CGS took approximately 15 min to complete. The surface wear between pre- and post-wear models was then visualized through 3D colorimetric maps generated within the scanning software. These maps were created by merging the pre- and post-wear models and displaying the surface deviation (linear wear depth).
2.2. Calculation of imaging method accuracy using surrogates
Two surrogate models with known volumes were tested to quantify the accuracy of measuring volumetric wear with the imaging method (Fig. 2). A simple surrogate model determined the best-case accuracy by using machined geometric blocks (Fig. 2A), while a complex surrogate model determined a more realistic accuracy for the intended application by using 3D printed replicas of the menisci and tibia (Fig. 2B).
Fig. 2.
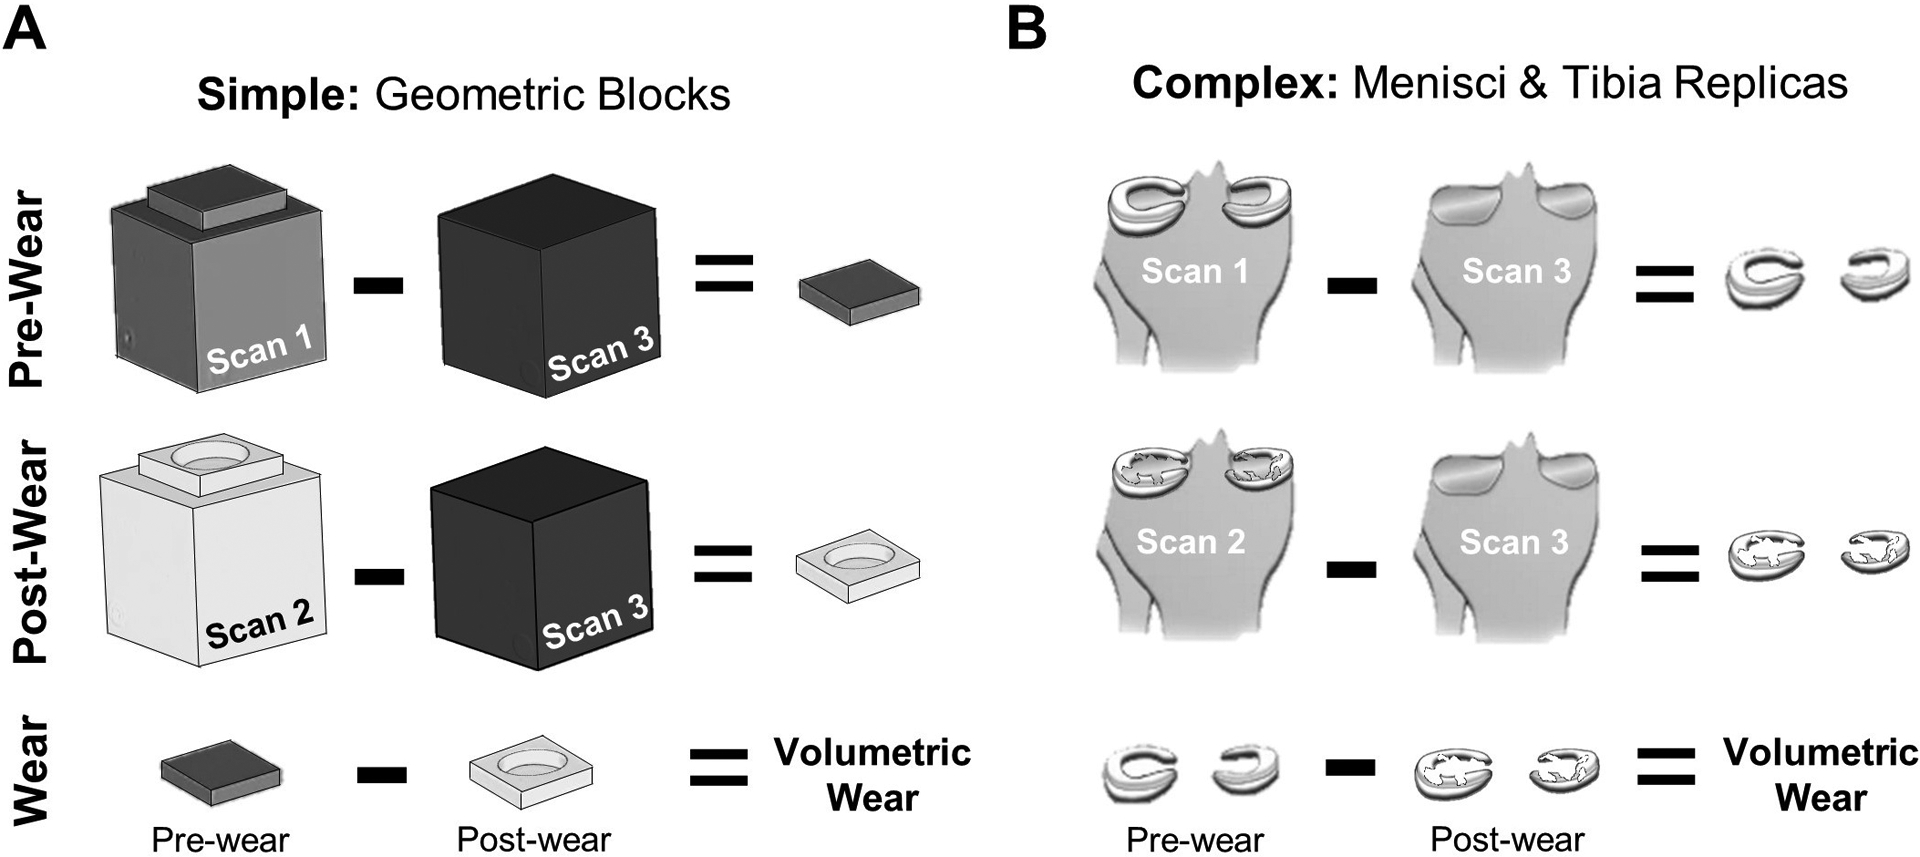
Accuracy of the imaging method was evaluated using A) simple and B) complex surrogates with known wear volumes between pre- and post-wear structures.
2.2.1. Simple surrogate model: geometric blocks
A total of seven delrin blocks were machined for the simple surrogate model (Fig. 2A). The “post-wear” blocks consisted of six thin delrin blocks machined with cylindrical defect depths of 3.8, 1.3, 0.25, 0.13, 0.05, and 0.025 mm, corresponding to known defect volumes (Vactual) of 1058, 356.2, 72.4, 36.2, 14.5 and 7.24 mm3, respectively. Defect depths were verified using a surface gauge with a dial indicator (Starrett, Athol, MA; resolution = ± 0.5 μm). The “post-wear” blocks were turned upside down to create a “pre-wear” block with no cylindrical defect. The “tibia-only” block was a single delrin cube (16.4 cm3, Fig. 2A).
2.2.2. Complex surrogate model: menisci and tibia replicas
A 3D reconstruction of healthy menisci (29 yrs, male, 23 kg/m2 BMI) was obtained via MRI data (Shriram et al., 2019). The medial and lateral menisci were 3D printed using masked stereolithography (mSLA, Siraya Tech Blu, resolution ± 25 μm) for both the pre-wear and post-wear cases (Fig. 3). For pre-wear, the menisci were printed with no defect (Fig. 3, left). For post-wear, physiological defects of varying depths were created using modeling software (Meshmixer, Autodesk, v3.5) (Fig. 3, right). The defects were positioned within the anterior and posterior regions of each meniscus corresponding to regions subjected to high compressive and shear stresses in a healthy knee joint (Peña et al., 2005; Zhang et al., 2019). A span of defect depths was selected to determine the sensitivity of the method, which corresponded to known defect volumes (Vactual) of 189, 93.9, 38.6, 19.3, and 0 mm3 in the medial meniscus and 150, 74.6, 30.5, 15.2, and 0 mm3 in the lateral meniscus. The medial and lateral meniscus were adhered to a 3D printed replica of a human tibia (PLA, Pursa Research, fine detail, 15% infill) using double-sided tape.
Fig. 3.
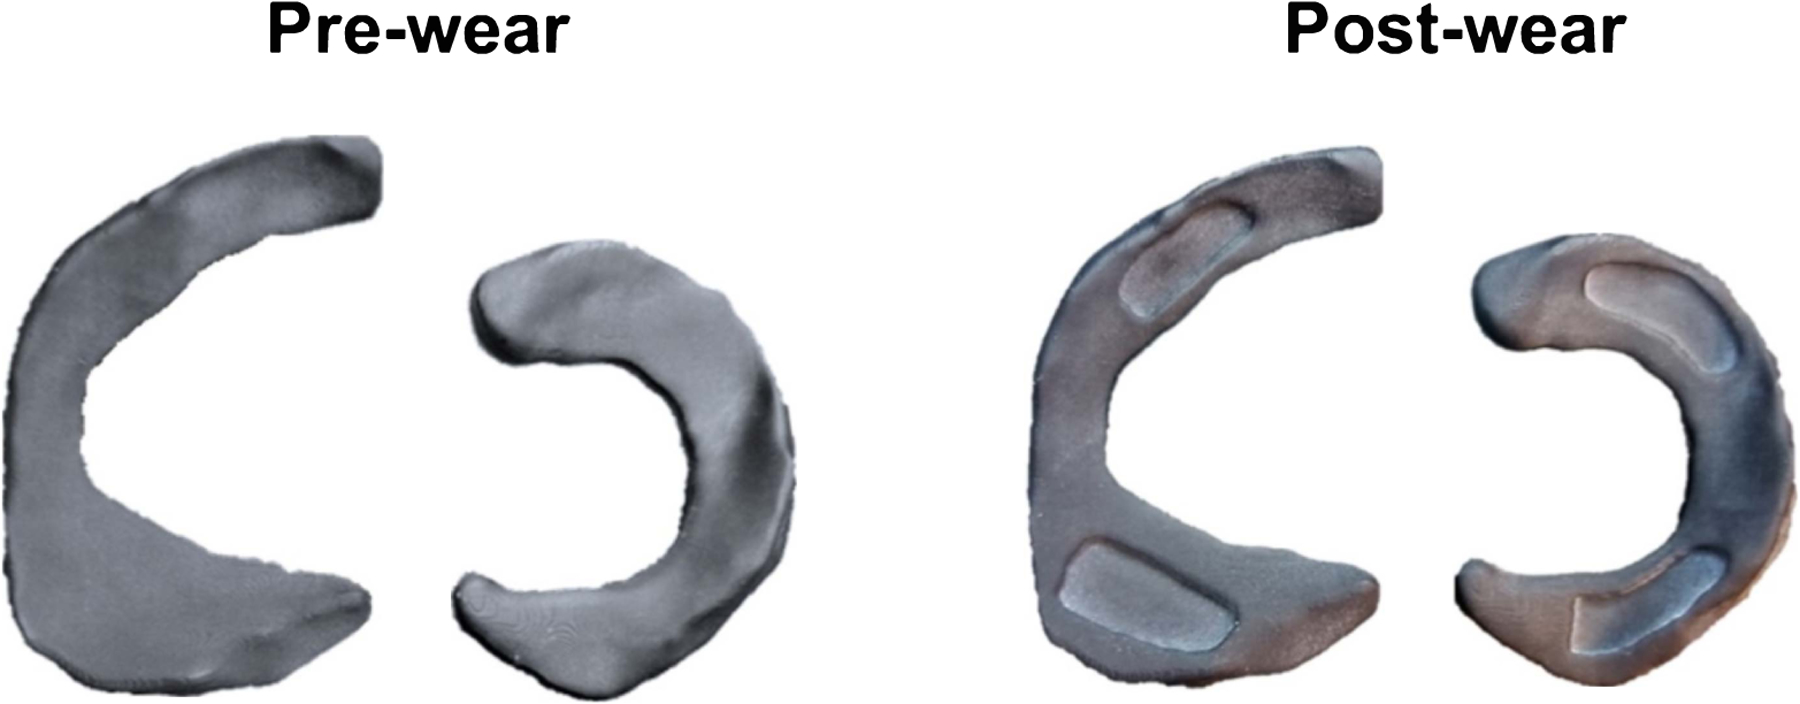
Complex surrogate models were fabricated by 3D printing an MRI reconstruction of a healthy human menisci (pre-wear) and generating defects in the surface (post-wear). Images above are photographs.
2.2.3. Wear analysis of surrogates
The aforementioned 3D scanning procedure was utilized for the surrogate models (Fig. 2) and was done in triplicate for each defect depth. This resulted in the generation of three different 3D models for the pre- and post-wear menisci at each defect size that were analyzed to measure volume loss (Vmeasured). The projector field of view (FOV) for scanning the surrogate models was 200 mm diagnoal (resolution = 0.12 mm), and the optimized exposure setting was 33.33 ms and 66.67 ms for the simple and complex surrogates, respectively. The accuracy in measuring volumetric wear was defined as the absolute mean difference between measured and known defect volumes (|Vmeasured - Vactual|), while error was defined as the absolute mean percentage error (100 * | Vmeasured - Vactual|/Vactual)
2.3. Measurement of in vitro volume loss in human meniscus
2.3.1. Specimen preparation
A human cadaveric knee (30 yrs, male, 32 kg/m2 BMI) was dissected to remove all skin, fascia, and muscle surrounding the joint capsule. The tibia and femur were transected 17 cm distal to the joint line using a custom-made cutting guide. This guide allowed for each bone to be cut perpendicular to the anatomical axis of the tibia, which preserved natural joint angles during potting (Cherian et al., 2014; Luo, 2004). The tibia was potted in a custom-made cylindrical mounting pot using a catalyzed polymer resin (Bondo Mar-Hyde, Atlanta, GA) with the bony end flush with the base of the pot (Sutton et al., 2010). The tibia pot was inserted into a custom knee fixture attached to a mechanical test system (Instron, Norwood, MA; El 0000) (Fig. 4A). The knee fixture allowed for adjustments to clinical rotations and translations following the Grood-Suntay convention (Grood and Suntay, 1983; Lujan et al., 2007), while also allowing for the tibia and femur to be fixed in a static position during joint loading. In order to prescribe physiological loads during fatigue testing, the menisci, ligaments, and joint capsule were initially left intact to determine the natural (in situ) position of the tibia and femur during full extension. Additional details regarding the custom knee fixture and the in situ positioning of the tibia and femur within the knee fixture after disarticulation can be found in the supplemental material.
Fig. 4.
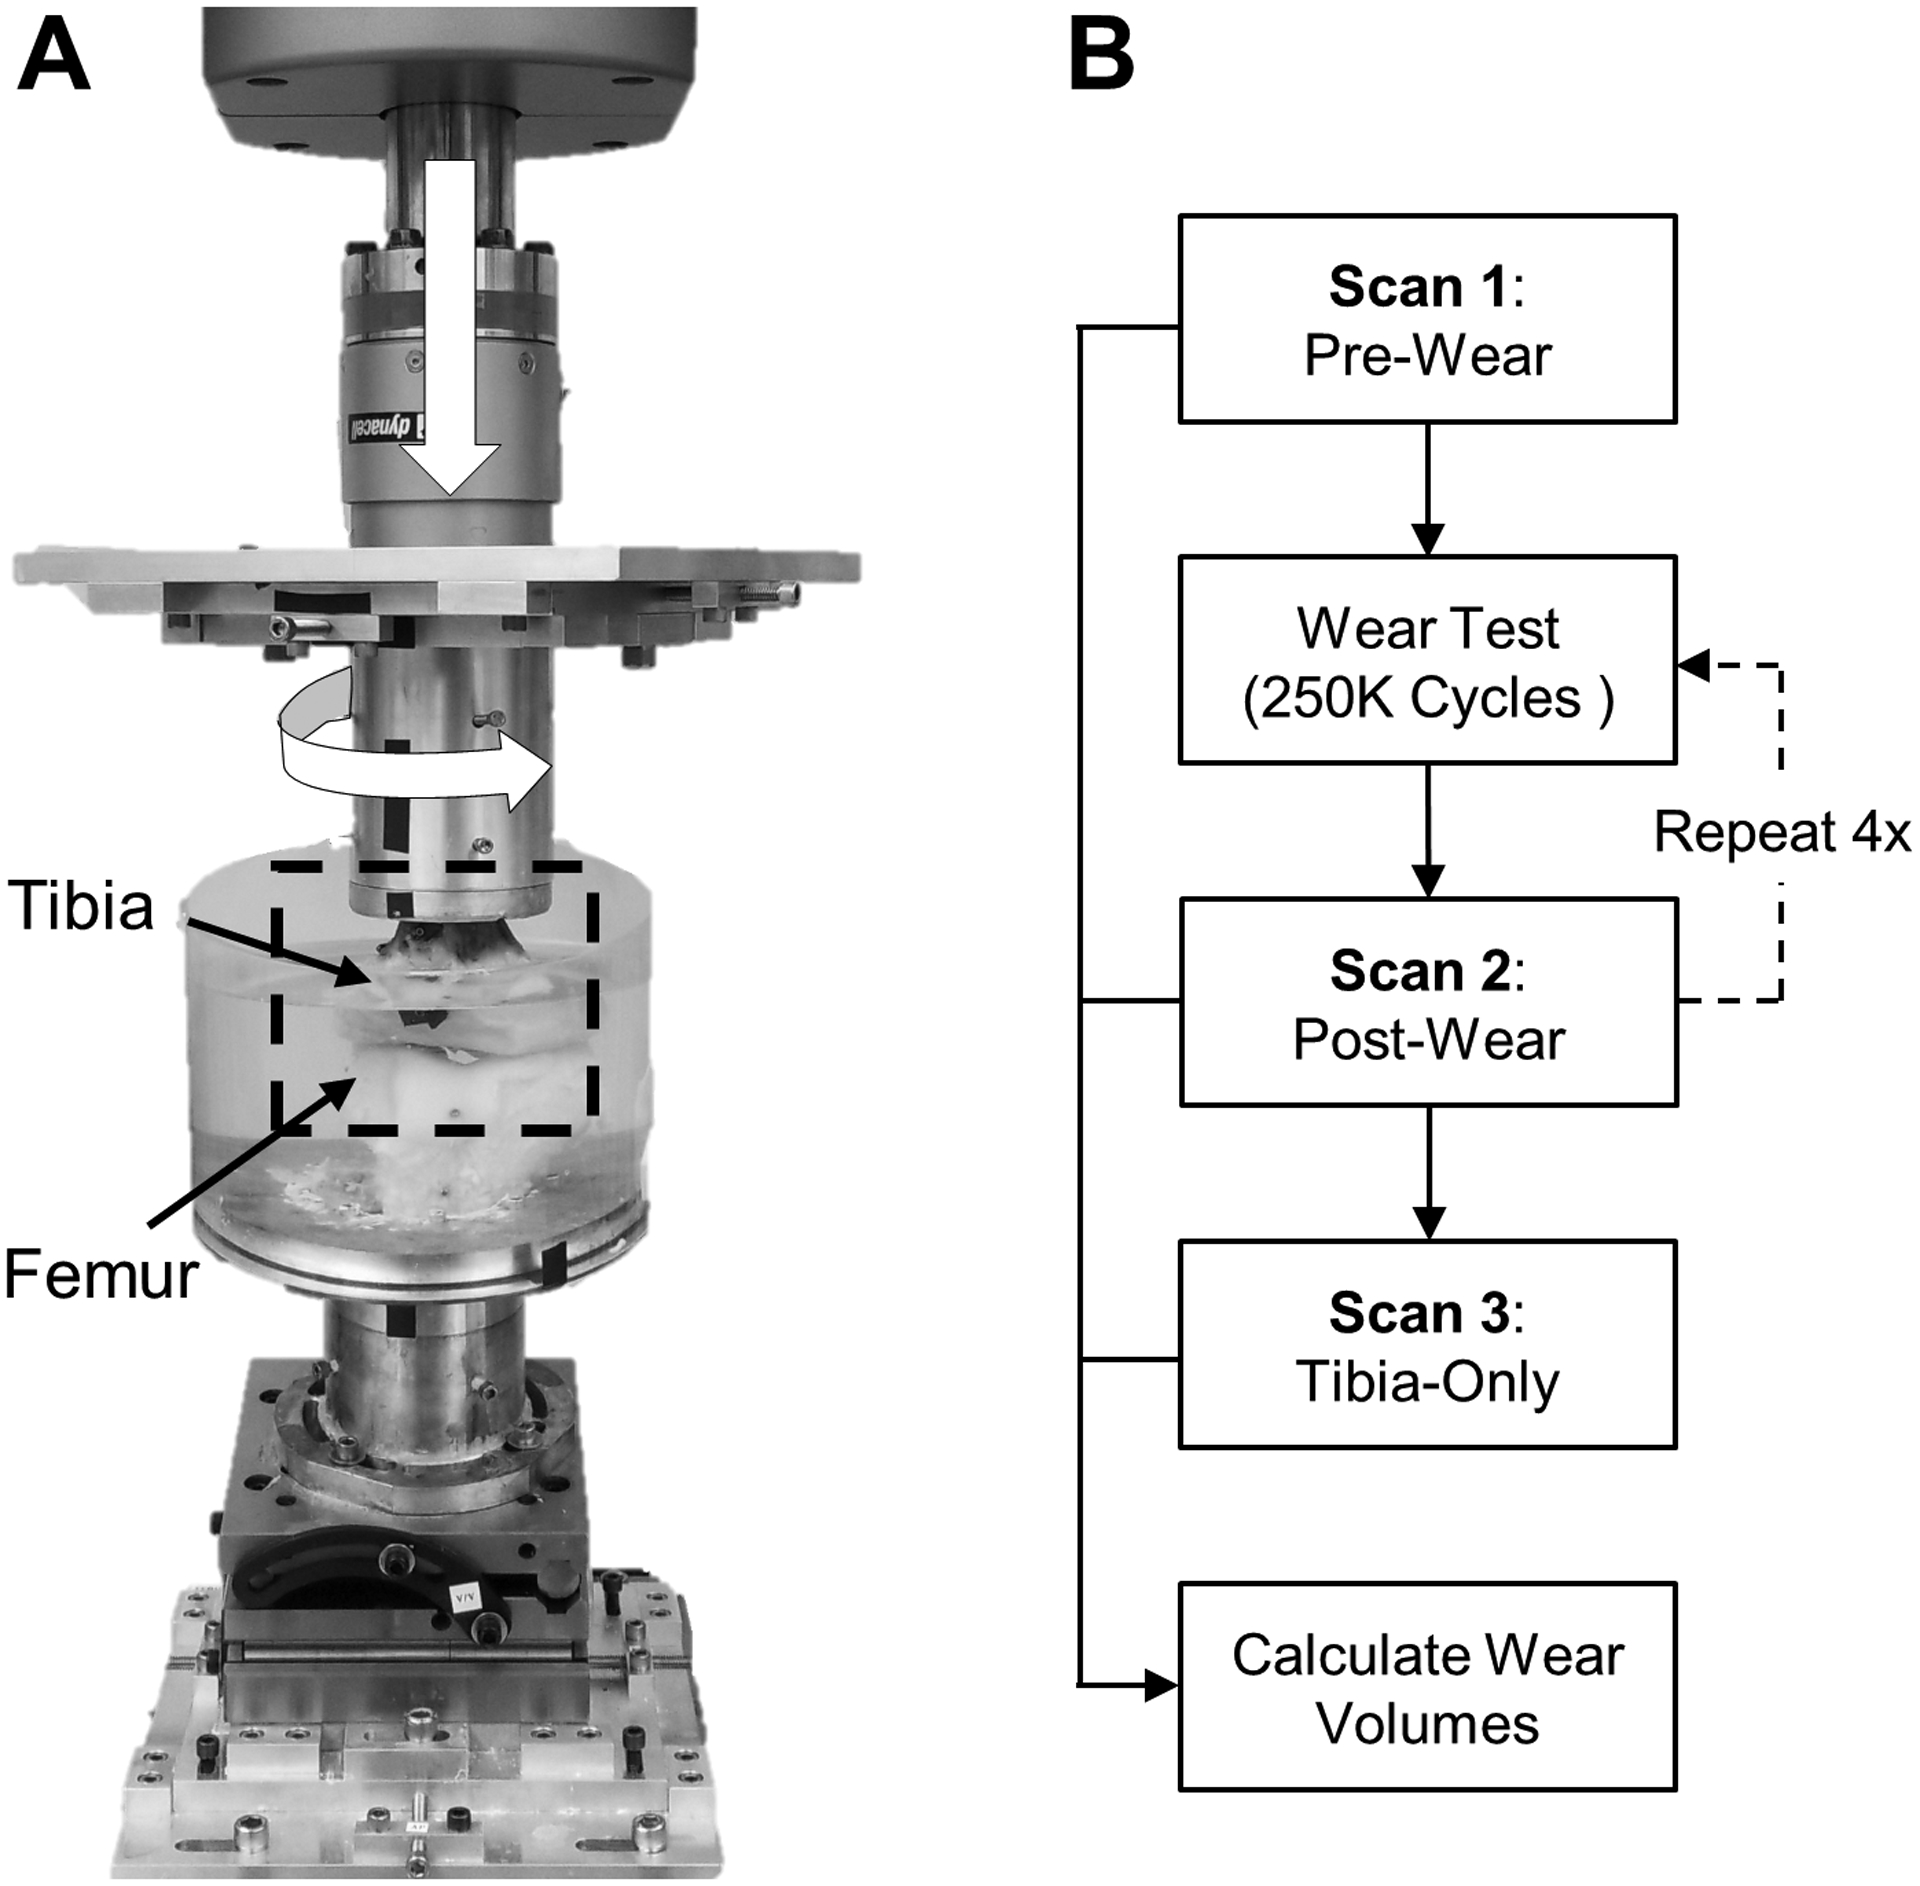
In-vitro fatigue testing of a human knee. A) Axial and torsional joint loads (white arrows) where applied for one million cycles to induce meniscal wear. B) Scans were taken at several time points to measure volume loss evely 250K cycles.
2.3.2. Mechanical fatigue testing and 3D scanning
Prior to taking the first 3D scan (Fig. 4B), the tibia-menisci and femur were allowed to pre-soak for 4 h in an acrylic immersion chamber that was filled with 0.9% saline solution at room temperature (Fig. 4A). This was done to mitigate artifacts during 3D scanning due to tissue swelling between time points. After the pre-soak, the tibia-menisci was removed from the mechanical test system and scanned to generate the pre-wear model (Fig. 4B). The menisci were hydrated throughout the scanning process by spraying with 0.9% saline solution. A gauze pad was used to lightly absorb any saline solution droplets that may have been present after spraying to reduce the potential of scanning artifacts and impaired scan quality. The tibia-menisci was then re-inserted into the mechanical test system (in situ position) with the addition of fresh saline solution in the immersion chamber. Combined cyclic axial loading (force control) and torsional rotation (position control) (Bowland et al., 2018) was then applied. To match the ISO recommended parameters at 45% of the gait cycle, flexion was fixed at 10-degrees, a sinusoidal axial force was applied from 0.2 to 2.4 kN, and a sinusoidal tibial rotation was applied from −0.55 to 0.55° to ensure that the torque did not exceed the ISO recommended load of 5.7 N-m (ISO 14243–1, 2009). Four loading stages of 250,000 continuous cycles were run at 2 Hz, resulting in a loading time of approximately 36 h per stage. Following each 250,000-cycle loading stage, the tibia-menisci was scanned via the 3D optical scanner to generate the ‘post-wear’ scans (Fig. 4B). Five sets of 12 scans in various tilted positions were acquired to generate a complete 3D rendered model with a projector FOV of 400 mm diagonal (resolution = 0.25 mm) and an optimal exposure of 66.67 ms. A custom built stand was used to tilt the tibia-menisci by 20-degrees relative to the rotation plate, allowing for the scanner to capture the underside of the condyles. All five scanning sets were combined into a complete 360-degree model of the tibia-menisci within the scanning software. Additional details regarding the various tilt positions can be found in the supplemental material. Following the scanning process, the tibia-menisci was reinserted into the test system with fresh saline-solution and the next 250,000-cycle loading stage was started. Once all four loading stages and post-wear scans were complete, the medial and lateral menisci were dissected from the tibia bone. The tibia was then scanned in the same manner as the pre- and post-wear procedures to generate the ‘tibia-only’ scan (Fig. 4B).
2.3.3. Wear analysis of human meniscus
The aformentioned post-processing procedure was applied to the human menisci with one additional analysis step. After the menisci were isolated using CGS, all soft tissue outside the peripheral ridge of the medial and lateral menisci was removed by using a snipping pattern created in CloudCompare software. This snipping pattern was based on the pre-wear menisci morphology, and was identically applied to all post-wear menisci models. This step ensured consistency in measuring volumetric changes between each time point. Volumetric loss, due to wear and time dependent creep, was calculated at each time point by subtracting the post-wear menisci volume from the pre-wear menisci volume.
2.4. Statistical analysis
Statistical software SPSS (IBM v26.0) was utilized for all data analysis. The correlation between the size of the defect volume in each surrogate model and the 3D scanning method’s accuracy or error in measuring the defect volume was evaluated using Pearson’s coefficient. A repeated measures ANOVA was done to assess the effect of cycle stages on volumetric loss for the medial and lateral human menisci. Significance was set at p < 0.05 for all statistical analyses, and data are reported as mean ± standard error, unless otherwise stated.
3. Results
3.1. Simple surrogate model: geometric blocks
The scanning procedure resulted in 3D models that closely resembled the real-life geometric blocks (Fig. 5A). For all defect sizes, mean system accuracy was 8.1 mm3 (95% CI of 5.9–10.2) (Fig. 5B), with errors of less than 10% when detecting blocks with volumetric defects greater than 80 mm3 (0.08 cm3) (Table 1). There was no correlation between defect volume and measurement accuracy (Fig. 5B; p = 0.98, R2 = 0.005, semi-log scale), but a correlation did exist between defect volume and percent error (Fig. 5C; p = 0.003, R2 = 0.67, semi-log scale), where larger defects had less percent error.
Fig. 5.
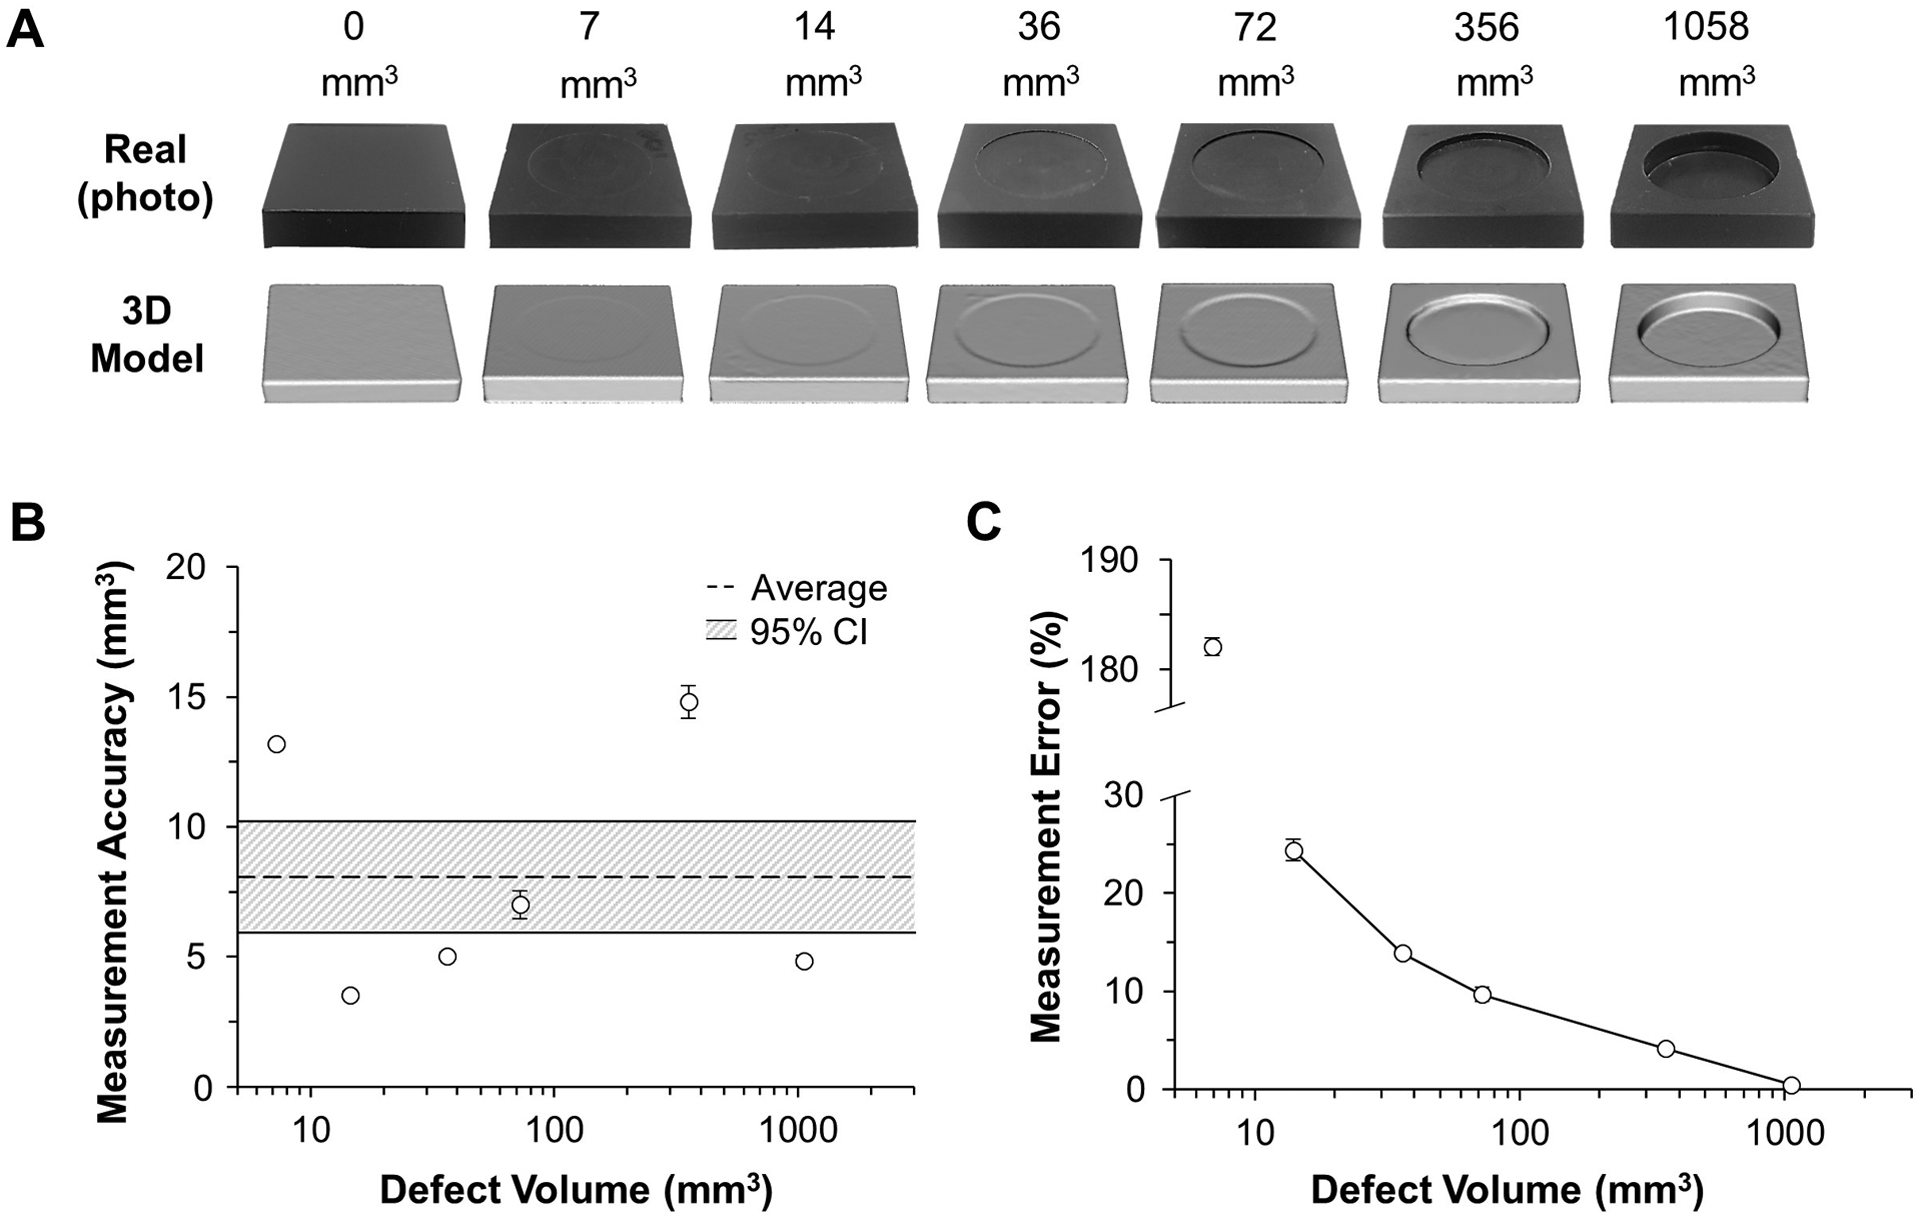
Method accuracy in measuring defect volume in simple geometry. A) 3D models closely resembled the real-life blocks. B) Accuracy was relatively consistent for different defect volumes, C) resulting in less error for larger defects, where defects greater than 80 mm3 (0.08 cm3) had less than 10% error.
Table 1.
Comparison of actual and measured defect volumes for the simple surrogate model (geometric blocks).
| Actual Defect Vol. (mm3) | Measured Defect Vol. (mm3) | Accuracy (mm3) | Error (%) |
|---|---|---|---|
| 7.2 | 20.4 ± 0.1 | 13.2 ± 0.1 | 182.1 ± 0.8 |
| 14.5 | 13.5 ± 1.0 | 3.5 ± 0.2 | 24.4 ± 1.1 |
| 36.2 | 37.6 ± 1.4 | 5.0 ± 0.1 | 13.9 ± 0.4 |
| 72.4 | 75.6 ± 1.9 | 7.0 ± 0.5 | 9.7 ± 0.7 |
| 356.2 | 349 ± 3.8 | 14.8 ± 0.6 | 4.2 ± 0.2 |
| 1057.7 | 1059 ± 1.4 | 4.9 ± 0.2 | 0.5 ± 0.02 |
3.2. Complex surrogate: menisci and tibia replicas
The wear patterns for varying defect volumes were successfully visualized with the 3D optical scanner (Fig. 6A). The average accuracy of the imaging technique in measuring all defect volumes for the complex surrogate was 12.7 mm3 (95% CI of 9.37–15.9) (Fig. 6B). There was no significant correlation between defect volume and measurement accuracy (p = 0.31, R2 = 0.19). Percent error decreased as defect volume increased for both menisci (p = 0.016, R2 = 0.48), with errors less than 10% when detecting volumetric defects close to 200 mm3 (0.20 cm3) (Fig. 6C; Table 2). A volume of 0.20 cm3 corresponds to the approximate volume of a single garden pea (Nelson, 2002), and is approximately 7% of the total volume of human medial meniscus (Bowers et al., 2007).
Fig. 6.
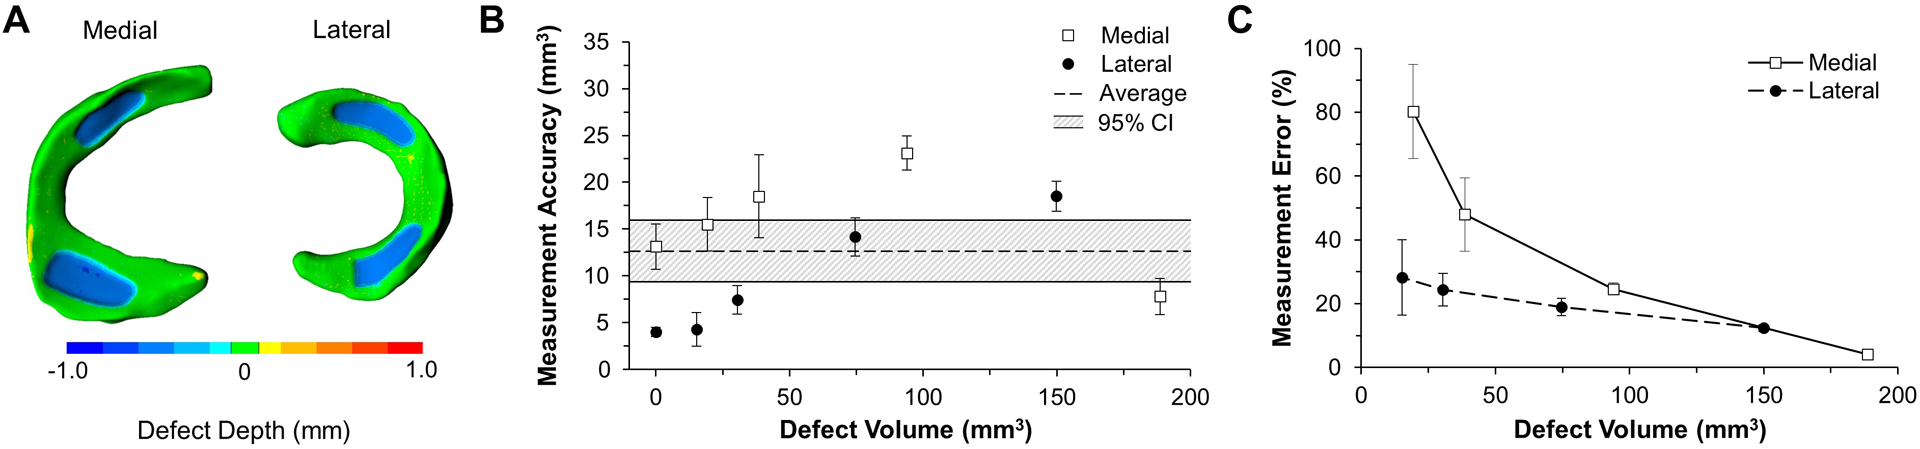
Method accuracy in measuring defect volume in complex geometry. A) Colorimetric mapping allows for the visualization of deviations between pre- and post-wear surrogate menisci, where the blue regions highlight the “wear”. B) Measurement accuracy is relevantly consistent across all defect sizes while C) measurement error increases as defect depth decreases for both lateral and medial menisci (p = 0.016).
Table 2.
Comparison of actual and measured defect volumes for the complex surrogate model (menisci and tibia replicas).
| Meniscus | Actual Defect Vol. (mm3) | Measured Defect Vol. (mm3) | Accuracy (mm3) | Error (%) |
|---|---|---|---|---|
| Lateral | 15.2 | 10.9 ± 1.8 | 4.3 ± 1.8 | 28.2 ± 11.7 |
| Medial | 19.3 | 34.8 ± 2.8 | 15.5 ± 2.8 | 80.2 ± 14.7 |
| Lateral | 30.5 | 37.9 ± 1.5 | 7.4 ± 1.5 | 24.4 ± 5.0 |
| Medial | 38.6 | 57.1 ± 4.4 | 18.5 ± 4.4 | 48.0 ± 11.5 |
| Lateral | 74.6 | 60.5 ± 2.0 | 14.2 ± 2.0 | 19.0 ± 2.7 |
| Medial | 93.9 | 117.1 ± 1.8 | 23.1 ± 1.8 | 24.6 ± 1.9 |
| Lateral | 149.9 | 131.4 ± 1.6 | 18.5 ± 1.6 | 12.4 ± 1.1 |
| Medial | 188.6 | 181.1 ± 2.1 | 7.8 ± 2.0 | 4.2 ± 1.0 |
3.3. In vitro human application
Fatigue testing of one million cycles (Mc) resulted in meniscal discoloration (Fig. 7A), and caused the inner peripheral meniscal regions to recede (Fig. 7B). Reductions in meniscus thickness were most concentrated in the posterior horns (Fig. 8A). Volume loss increased during cyclic loading (p = 0.001; Fig. 8B) as the initial volumes of the medial meniscus (4.0 ± 0.09 cm3) and lateral meniscus (2.6 ± 0.03 cm3) were reduced by 59.7% and 55.3%, respectively. Steady state volume loss was achieved after 250,000 cycles (Fig. 8B), where the steady state volumetric wear rate for the medial meniscus was 0.72 cm3/Mc (R2 = 0.93) and for the lateral meniscus was 0.34 cm3/Mc (R2 = 0.35). The mechanical fatigue data is included in the supplemental data (e.g. cyclic creep from axial loading).
Fig. 7.
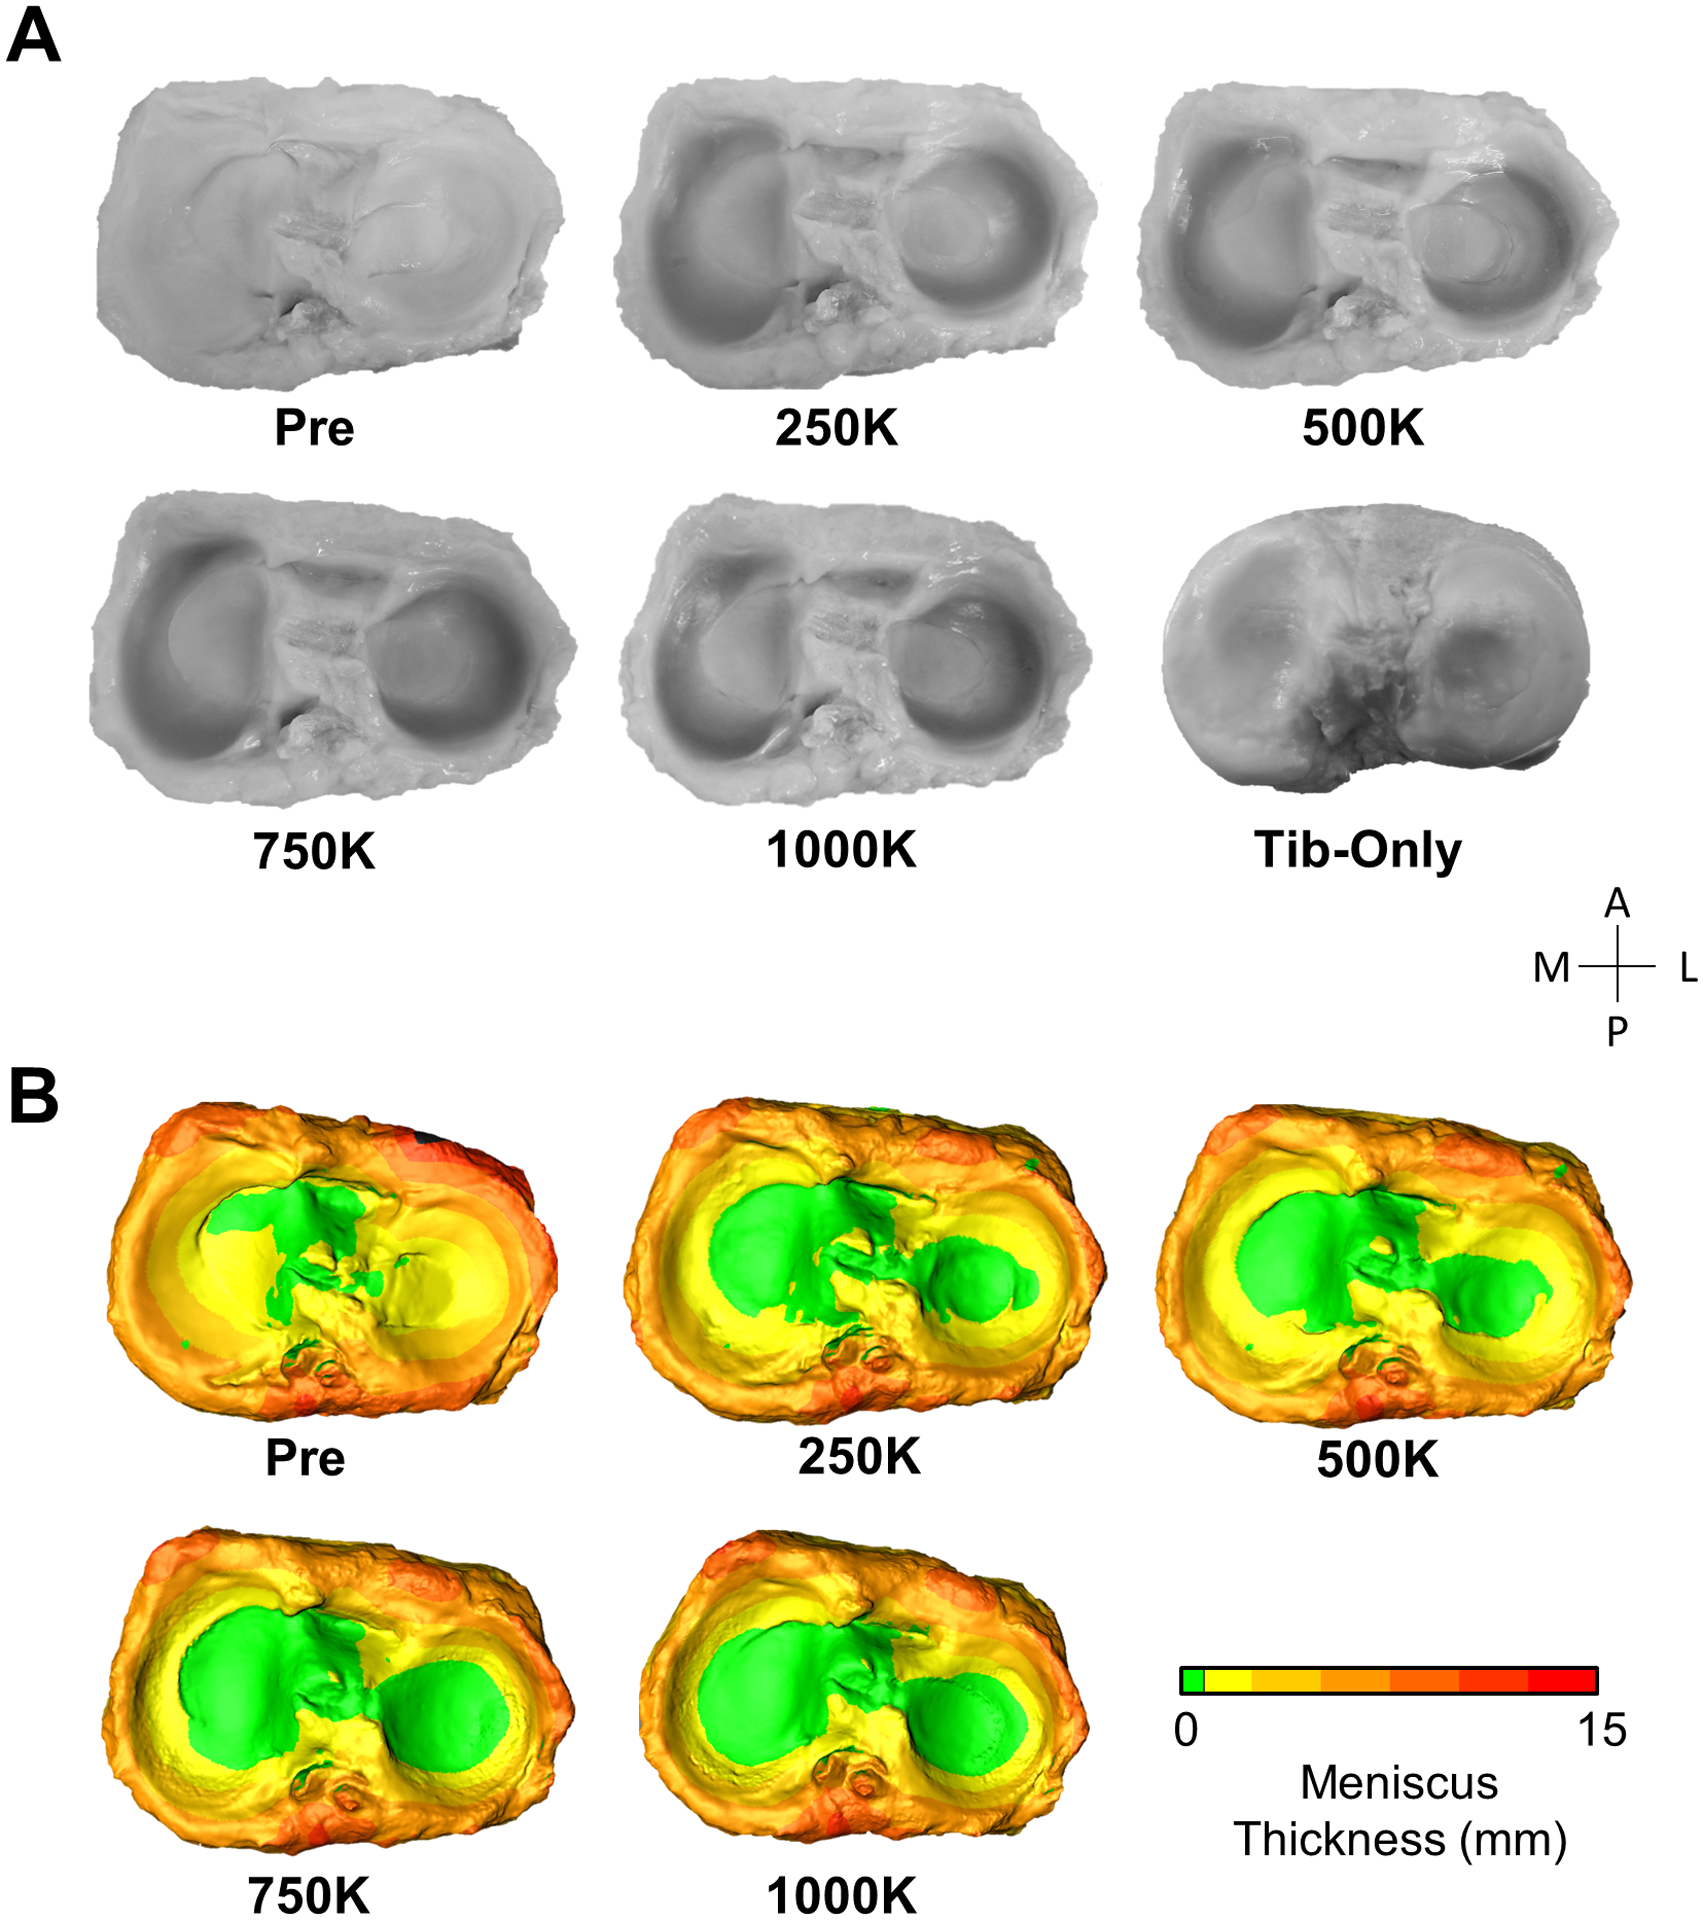
Photos and generated models of human menisci at each stage of fatigue testing. A) The photos and B) color maps of meniscus thickness show the inner periphery of the menisci receding with cyclic loading.
Fig. 8.
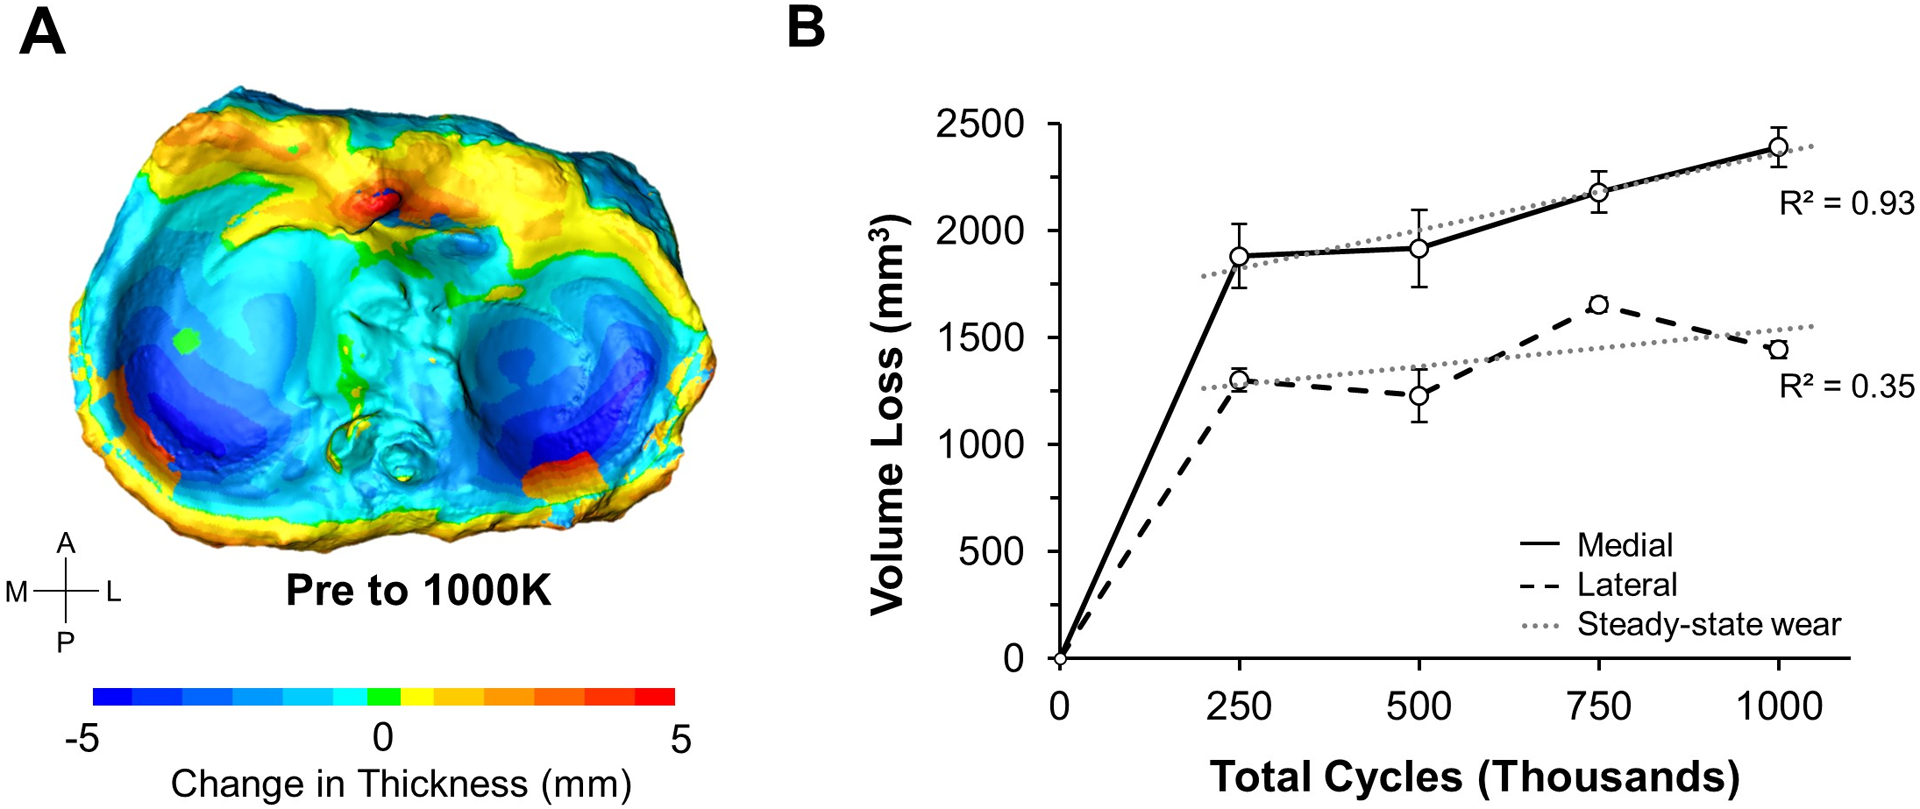
Analysis of volume loss in human menisci. A) After one million loading cycles, the color map shows prominent volume loss in the posterior regions of the menisci (darker blue) with extrusion occurring at the posterior ridge (red). B) After 250,000 cycles, a steady-state volumetric reduction is observed (dashed gray line). Error bars show standard deviation.
4. Discussion
Given the high prevalence of meniscal degeneration, characterizing meniscal wear behavior is vital to understanding disease pathomechanics and to develop effective strategies to prevent, delay, and treat this disease. In this study, an advanced 3D scanning method was developed and evaluated to quantify and visualize wear behavior in whole human meniscal tissue.
The accuracy of our 3D scanning method was determined through two surrogate models with known wear volumes. Using the simple surrogate model (best-case scenario), we determined that our 3D scanning method is capable of detecting volumetric defects with a mean accuracy of approximately 8 mm3 (Fig. 5B). This mean accuracy worsened to 13 mm3 when measuring volume loss in a surrogate model that replicated the complex tibia-menisci morphology (Fig. 6B). The slight loss of accuracy in the complex surrogate is most likely due to concave regions on the meniscal surface creating artifacts in the 3D renderings due to light reflectance. Importantly, the accuracy of our 3D scanning method was shown to be independent of defect size for both surrogates (Figs. 5B and 6B). This allows for an easy way to estimate the measurement error for a given defect size. For example, if we measured a meniscal volumetric reduction of 0.2 cm3 (size of a garden pea), we can estimate an associated error of approximately 7% [100 * (0.013/0.2)]. Our use of 3D printed replicas of biological structures was an innovative approach to quantifying the accuracy of the imaging method. After trying various 3D printers and filaments, we determined that masked stereolithography (z resolution ± 25 μm) generated 3D meniscus prints with superior quality. Masked stereolithography had a volumetric error of 2.8% relative to the CAD model used to generate the print, while more commonly used fused deposited modeling printers (z resolution ± 50 μm) generated prints with 6.1% error. Therefore, we selected masked stereolithography to print precise physical replicas of the 3D meniscus models (Fig. 3).
The feasibility of using our novel imaging method on real meniscus was tested by applying one million loading cycles to a human cadaveric knee and scanning the tibia-menisci at four time points (Fig. 4B). For this simulation, the axial and torsional loading parameters were selected to simulate joint loads at 45% of the gait cycle. For the first time, this imaging method allowed us to generate colorimetric maps to visualize cycle-dependent regional changes in meniscal thickness (Fig. 7B). Reductions in thickness imply either material loss or cyclic creep (hydrostatic deformation) due to repetitive compressive and torsional forces on the joint. Interestingly, these reductions were concentrated in the posterior horns of the medial and lateral menisci (Fig. 8A; dark blue regions). This result was surprising, since prior studies found that the anterior horns experience higher contact pressure than the posterior horns when the knee is near full extension (Ahmed and Burke, 1983; Gilbert et al., 2014; Walker et al., 2015), and our study was conducted near full extension. Relatedly, the substantial loss of meniscal volume we measured during cyclic testing indicates that the meniscus is transferring considerable load at 45% of the gait cycle. This agrees with a prior experimental study that used thin-filmed pressure sensors to measure compressive loads on the menisci (Walker et al., 2015), but appears to contradict a prior computational study that estimated the menisci transmit less than 5% of tibiofemoral loads at 45% of the gait cycle (Guess et al., 2015). Additionally, the presence of orange regions around the rim of the menisci (Fig. 8A) indicates meniscal extrusion from the tibial surface. Such extrusion has been found to be a strong risk factor for the progression of osteoarthritis in conjunction with increasing meniscal degeneration (Adams et al., 1999; Aoki et al., 2020). It is important to note that for this feasibility experiment we only tested one knee joint, and therefore our human meniscus wear testing results (Fig. 8) are not adequately powered and should be interpreted accordingly.
The medial and lateral menisci experienced volume reductions of approximately 60% and 55% after one million cycles of loading, respectively (Fig. 8B). Based on the accuracy of the imaging method (Fig. 6B) and the scanner setup (FOV = 400 mm diagonal), we estimate that these volumetric reductions are accurate to within 3.0%. Most of the volume loss occurred during the first 250,000 cycles, which could be caused by run-in wear observed and discussed in joint simulator studies of polyethylene components (Trommer and Maru, 2017; Warburton et al., 2018), or could be an artifact from meniscal extrusion beyond the defined snipping pattern. After 250,000 cycles, the volumetric wear rate leveled off to 0.72 cm3/Mc for the medial meniscus (Fig. 8B), corresponding to a volume loss of approximately 3.6 peas per million cycles (Nelson, 2002). The lateral meniscus was less linear in the steady state region (R2 = 0.35), due to unexpected increases in volume relative to the prior time point (Fig. 8B). This volumetric increase could have been caused by swelling, but another likely factor is the tissue not sitting completely flush to the tibial surface when scanning, which would artificially increase meniscal volume. This could potentially be avoided by using a tool to gently and systematically press down the tissue prior to 3D scanning (Hollar et al., 2018). The measured meniscal volume for this knee was within 10% of average human meniscal volumes reported from water displacement techniques (Bowers et al., 2007). Overall, our results indicate that the developed method can successfully visualize and quantify meniscal wear behavior during fatigue loading of human knees.
Our 3D scanning method can be compared to established imaging methods used to measure volume loss in biomaterials. A study by Elsner et al. utilized μCT to measure volume loss in synthetic meniscus implants (Elsner et al., 2015). When volume loss calculated from μCT was compared to volume loss calculated from gravimetric analysis (conversion of mass loss to volume loss using density), a measurement accuracy for μCT of 15 mm3 was estimated, which is similar to the mean accuracy of 13 mm3 we determined for our 3D scanning method (Fig. 6B). Drawbacks to μCT include restrictive scanning volumes, time-intensive generation of 3D models, and high equipment costs (Hollar et al., 2018). MRI is another imaging technology that can create volumetric renderings of soft tissue, and has previously been used to evaluate undamaged meniscal volume with an accuracy of 125 mm3 (Bowers et al., 2007). Although MRI has the functional advantage of in vivo application, the accuracy is nearly ten times worse than our 3D scanning method, and it also has disadvantages related to time and cost. A recent study by Bowland et al., which can be considered the most comparable to our current study, utilized a knee simulator and Alicona optical profiler to analyze tribological performance of osteochondral grafts within a whole porcine knee model (Bowland et al., 2018). This work nicely demonstrated the capability of optical profilometry to quantify volume loss in meniscal tissue, but the accuracy in detecting volume loss was not reported and only a small region of interest was analyzed. Moreover, unlike our 3D scanning method, this profilometry study did not generate 3D color maps to visualize changes in thickness (Fig. 8A).
There are several notable limitations to our study and the 3D scanning method. First, since this is an optical imaging method, its use is limited to in vitro studies of cadaveric joints. Second, in order to acquire 3D scans, the human knee joint needed to be disarticulated prior to fatigue loading, and therefore was missing important soft-tissue constraints that likely contributed to high (non-physiological) wear rates. This limitation can be overcome using advanced joint simulators (e.g. VIVO; AMTI, Watertown, MA) that can apply virtual soft tissue con-straints during fatigue loading. Third, we substituted synovial fluid with saline solution, which would likely contribute to increased knee joint friction, both for the cartilage-cartilage and meniscus-cartilage contact, thus resulting in higher wear rates. Fourth, it should be noted that tissue extrusion (Fig. 8A) may have been influenced by tissue autolysis occurring throughout the duration of testing. The impact of autolysis could be mitigated through the use of protease inhibitors within the lubricant (Lujan et al., 2009). Fifth, although we maintained tissue hydration during the scanning process by spraying the cadaveric menisci with saline solution, undesired dehydration may still have occurred. Users could further reduce the risk of dehydration during scanning by taking fewer sets of scans than the five sets taken in the present study. Additionally, we defined a snipping pattern to trim the 3D rendered menisci by outlining the outer ridge of the pre-wear menisci. While there is subjectivity when defining this pattern, it was objectively and precisely applied at each time point. Last, an inherent limitation with our 3D scanning method is that the measured volume loss may be caused by material wear, time dependent creep, or a combination of the two. One method to overcome this challenge is to use the contralateral knee as a load-soak control. The volume loss measured in the load-soak control (axial loading only) will be due to creep and swelling, and this can be used to isolate volume loss due to mechanical wear when articulating the joint (axial loading + sliding + torsion) versus viscoelastic creep behavior (axial loading only) (Warburton et al., 2018).
In summary, this study developed and evaluated an accurate 3D scanning method to measure and visualize volumetric changes in whole human meniscal tissue. This method can now be paired with joint simulators to identify specific activities (e.g. running, cutting, stair-climbing), joint morphologies, and clinical interventions, that reduce or increase meniscal wear rates and the risk of joint degeneration. Additionally, this technique could be used for joint prosthesis, such as total knee replacement or artificial meniscus, to characterize the tribological performance of the implant.
Supplementary Material
Acknowledgments
This project was supported by the National Science Foundation under award number 1554353 and the National Institute of General Medical Sciences under award number P20GM109095. A special thanks to Phil Boysen and the Boise State machine shop.
Footnotes
CRediT authorship contribution statement
Kate J. Benfield: Writing – review & editing, Writing – original draft, Visualization, Validation, Software, Project administration, Methodology, Investigation, Formal analysis, Data curation, Conceptualization. Zachary A. Pinkley: Methodology, Investigation. Dylan E. Burruel: Methodology, Investigation. Kirk J. Lewis: Supervision, Resources. Daniel S. Ferguson: Resources. Trevor J. Lujan: Writing – review & editing, Supervision, Project administration, Funding acquisition, Conceptualization.
Declaration of competing interest
The authors declare the following financial interests/personal relationships which may be considered as potential competing interests: author DF is a paid employee for Global Inspection Solutions.
Data availability
Data will be made available on request.
References
- Adams JG, McAlindon T, Dimasi M, Carey J, Eustace S, 1999. Contribution of meniscal extrusion and cartilage loss to joint space narrowing in osteoarthritis. Clin. Radiol 54, 502–506. 10.1016/S0009-9260(99)90846-2. [DOI] [PubMed] [Google Scholar]
- Affatato S, Valigi MC, Logozzo S, 2020. Knee wear assessment: 3D scanners used as a consolidated procedure. Materials 13, 2349. 10.3390/ma13102349. [DOI] [PMC free article] [PubMed] [Google Scholar]
- Affatato S, Valigi MC, Logozzo S, 2017. Wear distribution detection of knee joint prostheses by means of 3D optical scanners. Materials 10. 10.3390/ma10040364. [DOI] [PMC free article] [PubMed] [Google Scholar]
- Ahmed AM, Burke DL, 1983. In-Vitro Measurement of Static Pressure Distribution in Synovial Joints - Part I: Tibial Surface of the Knee. J. Biomech. Eng 105 (3), 216–225. 10.1115/1.3133409. [DOI] [PubMed] [Google Scholar]
- Akelman MR, Teeple E, Machan JT, Crisco JJ, Jay GD, Fleming BC, 2013. Pendulum mass affects the measurement of articular friction coefficient. J. Biomech 46, 615–618. 10.1016/J.JBIOMECH.2012.09.034. [DOI] [PMC free article] [PubMed] [Google Scholar]
- Aoki H, Ozeki N, Katano H, Hyodo A, Miura Y, Matsuda J, Takanashi K, Suzuki K, Masumoto J, Okanouchi N, Fujiwara T, Sekiya I, 2020. Relationship between medial meniscus extrusion and cartilage measurements in the knee by fully automatic three-dimensional MRI analysis. BMC Muscoskel. Disord 21 10.1186/s12891-020-03768-3. [DOI] [PMC free article] [PubMed] [Google Scholar]
- Bayer RJ, 2004. Mechanical wear fundamentals and testing, revised and expanded. In: Mechanical Wear Fundamentals and Testing, Revised and Expanded, second ed. CRC Press. 10.1201/9780203021798. [DOI] [Google Scholar]
- Bowers ME, Tung GA, Fleming BC, Crisco JJ, Rey J, 2007. Quantification of meniscal volume by segmentation of 3 T magnetic resonance images. J. Biomech 40, 2811–2815. 10.1016/j.jbiomech.2007.01.016. [DOI] [PMC free article] [PubMed] [Google Scholar]
- Bowland P, Ingham E, Fisher J, Jennings LM, 2018. Development of a preclinical natural porcine knee simulation model for the tribological assessment of osteochondral grafts in vitro. J. Biomech 77, 91–98. 10.1016/j.jbiomech.2018.06.014. [DOI] [PubMed] [Google Scholar]
- Bowland Philippa, Ingham Eileen, Fisher John, Jennings Louise, 2018. Simple geometry tribological study of osteochondral graft implantation in the knee. Proceedings of the Institution of Mechanical Engineers, Part H: Journal of Engineering in Medicine 232 (3), 249–256. 10.1177/0954411917751560. [DOI] [PMC free article] [PubMed] [Google Scholar]
- Cai H, Hao Z, Xiao L, Wan C, Tong L, 2017. The collagen microstructural changes of rat menisci and tibiofemoral cartilages under the influence of mechanical loading: an in vitro wear test of whole joints. Technol. Health Care 25, 207–217. 10.3233/THC-l71323. [DOI] [PubMed] [Google Scholar]
- Cherian JJ, Kapadia BH, Banerjee S, Jauregui JJ, Issa K, Mont MA, 2014. Mechanical, anatomical, and kinematic axis in TKA: concepts and practical applications. In: Current Reviews in Musculoskeletal Medicine. Humana Press Inc., pp. 89–95. 10.1007/s12178-014-9218-y [DOI] [PMC free article] [PubMed] [Google Scholar]
- Das Neves Borges P, Forte AE, Vincent TL, Dini D, Marenzana M, 2014. Rapid, automated imaging of mouse articular cartilage by microCT for early detection of osteoarthritis and finite element modelling of joint mechanics. Osteoarthritis Cartilage 22 (10), 1419–1428. 10.1016/j.joca.2014.07.014. [DOI] [PMC free article] [PubMed] [Google Scholar]
- de Roy L, Warnecke D, Hacker SP, Simon U, Dürselen L, Ignatius A, Seitz AM, 2021. Meniscus injury and its surgical treatment does not increase initial whole knee joint friction. Front. Bioeng. Biotechnol 9, 1190. 10.3389/FBI0E.2021.779946/BIBTEX. [DOI] [PMC free article] [PubMed] [Google Scholar]
- Elsner JJ, Shemesh M, Shefy Peleg A, Gabet Y, Zylberberg E, Linder Ganz E, 2015. Quantification of in vitro wear of a synthetic meniscus implant using gravimetric and micro-CT measurements. J. Mech. Behav. Biomed. Mater 49, 310–320. 10.1016/j.jmbbm.2015.05.017. [DOI] [PubMed] [Google Scholar]
- Englund M, Guermazi A, Gale D, Hunter DJ, Aliabadi P, Clancy M, Felson DT, 2008. Incidental meniscal findings on knee MRI in middle-aged and elderly persons. N. Engl. J. Med 359, 1108–1115. 10.1056/NEJMoa0800777. [DOI] [PMC free article] [PubMed] [Google Scholar]
- Fukuta S, Kuge A, Korai F, 2009. Clinical significance of meniscal abnormalities on magnetic resonance imaging in an older population. Knee 16, 187–190. 10.1016/j.knee.2008.11.006. [DOI] [PubMed] [Google Scholar]
- Gelbart B, Firer P, 2009. Meniscus Injuries: where Do We Stand? BR Gelbart P Firer Orthopaedic Surgeon. Netcare Linksfield Clinic, Orange Grove, Johannesburg. Honorary Consultant, Charlotte Maxeke Johannesburg Hospital Soft Tissue Knee Clinic, undefined. [Google Scholar]
- Ghosh S, Choudhury D, Das NS, Pingguan-Murphy B, 2014. Tribological role of synovial fluid compositions on artificial joints - a systematic review of the last 10 years. Lubric. Sci 26, 387–410. 10.1002/LS.1266. [DOI] [Google Scholar]
- Gilbert S, Chen T, Hutchinson ID, Choi D, Voigt C, Warren RF, Maher SA, 2014. Dynamic contact mechanics on the tibial plateau of the human knee during activities of daily living, 2006–2012 J. Biomech 47. 10.1016/j.jbiomech.2013.11.003. [DOI] [PMC free article] [PubMed] [Google Scholar]
- Grood ES, Suntay WJ, 1983. A joint coordinate system for the clinical description of three-dimensional motions: application to the knee. J. Biomech. Eng 105,136–144. 10.1115/1.3138397. [DOI] [PubMed] [Google Scholar]
- Guess TM, Razu S, Jahandar H, Stylianou A, 2015. Predicted loading on the menisci during gait: the effect of horn laxity. J. Biomech 48, 1490–1498. 10.1016/J.JBIOMECH.2015.01.047. [DOI] [PMC free article] [PubMed] [Google Scholar]
- Hollar KA, Ferguson DS, Everingham JB, Helms JL, Warburton KJ, Lujan TJ, 2018. Quantifying wear depth in hip prostheses using a 3D optical scanner. Wear 394–395, 195–202. 10.1016/j.wear.2017.10.008. [DOI] [PMC free article] [PubMed] [Google Scholar]
- ISO 14242–2, 2006. International Standard 14242-2: Implants for Surgery —Wear of Total Hip-Joint Prostheses — Part 2: Methods of Measurement. 61010–1 © Iec2001 2006, p. 13. [Google Scholar]
- ISO 14243–1, 2009. Implants for Surgery - Wear of Total Knee Joint Prostheses - Part 1: Loading and Displacement Parameters for Wear-Testing Machines with Load Control and Corresponding Environmental Conditions for testImplants for Surgery - Wear of Total Knee-Joint Prosthe 2009.
- Lujan TJ, Dalton MS, Thompson BM, Ellis BJ, Weiss JA, 2007. Effect of ACL deficiency on MCL strains and joint kinematics. J. Biomech. Eng 129, 386–392. 10.1115/1.2720915. [DOI] [PubMed] [Google Scholar]
- Lujan T, Underwood C, Jacobs N, Weiss J, 2009. Contribution of glycosaminoglycans to viscoelastic tensile behavior of human ligament. J. Appl. Physiol 106 (2), 423–431. 10.1152/japplphysiol.90748.2008. [DOI] [PMC free article] [PubMed] [Google Scholar]
- Luo CF, 2004. Reference Axes for Reconstruction of the Knee. Knee, 10.1016/j.knee.2004.03.003. [DOI] [PubMed] [Google Scholar]
- Makris EA, Hadidi P, Athanasiou KA, 2011. The knee meniscus: structure-function, pathophysiology, current repair techniques, and prospects for regeneration. Biomaterials, 10.1016/j.biomaterials.2011.06.037. [DOI] [PMC free article] [PubMed] [Google Scholar]
- Nelson SO, 2002. Dimensional and density data for seeds of cereal grain and other crops. Trans. Am. Soc. Agric. Eng 45, 165–170. 10.13031/2013.7859. [DOI] [Google Scholar]
- Northwood Ewen, Fisher John, 2007. A multi-directional in vitro investigation into friction, damage and wear of innovative chondroplasty materials against articular cartilage. Clin. Biomech 22 (7), 834–842. 10.1016/j.clinbiomech.2007.03.008. [DOI] [PubMed] [Google Scholar]
- Peña E, Calvo B, Martínez MA, Palanca D, Doblaré M, 2005. Finite element analysis of the effect of meniscal tears and meniscectomies on human knee biomechanics. Clinical Biomechanics 20 (5), 498–507. 10.1016/j.clinbiomech.2005.01.009. [DOI] [PubMed] [Google Scholar]
- Rao AJ, Erickson BJ, Cvetanovich GL, Yanke AB, Bach BR, Cole BJ, 2015. The meniscus-deficient knee: biomechanics, evaluation, and treatment options. Orthop. J. Sport. Med 10.1177/2325967115611386. [DOI] [PMC free article] [PubMed] [Google Scholar]
- Shriram D, Yamako G, Chosa E, Lee YHD, Subburaj K, 2019. Effects of a valgus unloader brace in the medial meniscectomized knee joint: a biomechanical study. J. Orthop. Surg. Res 14 10.1186/s13018-019-1085-l. [DOI] [PMC free article] [PubMed] [Google Scholar]
- Sutton LG, Werner FW, Haider H, Hamblin T, Clabeaux JJ, 2010. In vitro response of the natural cadaver knee to the loading profiles specified in a standard for knee implant wear testing. J. Biomech 43, 2203–2207. 10.1016/j.jbiomech.2010.03.042. [DOI] [PubMed] [Google Scholar]
- Trommer RM, Maru MM, 2017. Importance of preclinical evaluation of wear in hip implant designs using simulator machines. Rev. Bras. Ortop (English Ed. 52, 251–259. 10.1016/j.rboe.2016.07.004. [DOI] [PMC free article] [PubMed] [Google Scholar]
- Valigi MC, Logozzo S, Affatato S, 2017. New challenges in tribology: wear assessment using 3D optical scanners. Mater (Basel) 10. 10.3390/ma10050548. [DOI] [PMC free article] [PubMed] [Google Scholar]
- Verberne G, Merkher Y, Halperin G, Maroudas A, Etsion I, 2009. Techniques for assessment of wear between human cartilage surfaces. Wear 266, 1216–1223. 10.1016/j.wear.2009.03.042. [DOI] [Google Scholar]
- Walker PS, Arno S, Bell C, Salvadore G, Borukhov I, Oh C, 2015. Function of the medial meniscus in force transmission and stability. J. Biomech 48, 1383–1388. 10.1016/J.JBIOMECH.2015.02.055. [DOI] [PubMed] [Google Scholar]
- Warburton KJ, Everingham JB, Helms JL, Kazanovicz AJ, Hollar KA, Brourman JD, Fox SM, Lujan TJ, 2018. Wear testing of a canine hip resurfacing implant that uses highly cross-linked polyethylene. J. Orthop. Res 36, 1196–1205. 10.1002/jor.23745. [DOI] [PMC free article] [PubMed] [Google Scholar]
- Warnecke D, Meßemer M, de Roy L, Stein S, Gentilini C, Walker R, Skaer N, Ignatius A, Dürselen L, 2019. Articular cartilage and meniscus reveal higher friction in swing phase than in stance phase under dynamic gait conditions. Sci. Rep 9 10.1038/s41598-019-42254-2. [DOI] [PMC free article] [PubMed] [Google Scholar]
- Zhang Kaijia, Li Lan, Yang Longfei, Shi Jianping, Zhu Liya, Liang Huixin, Wang Xingsong, Yang Xianfeng, Jiang Qing, 2019. Effect of degenerative and radial tears of the meniscus and resultant meniscectomy on the knee joint: a finite element analysis. J. Orthop. Translat 18, 20–31. 10.1016/j.jot.2018.12.004. [DOI] [PMC free article] [PubMed] [Google Scholar]
Associated Data
This section collects any data citations, data availability statements, or supplementary materials included in this article.
Supplementary Materials
Data Availability Statement
Data will be made available on request.