

Abstract
Background:
According to computer vision syndrome (CVS). Due to constant use of computers by the students, it has become one of the growing health risks associated with technology (cell phones and tablets). CVS is a combination of eye and vision disorders associated with activities that affect near vision and is experienced in relation to or during the use of computers. The main aim of the study was to find the risk factors of CVS, its symptoms, and other factors associated with CVS.
Materials and Methods:
In this cross-sectional study, data was collected using a purposely constructed E-questionnaire. The questionnaire consisted of demographic items and items related to the usage of E-devices and the symptoms of eye problems. After data collection, data was coded and entered in the Statistical Package for the Social Sciences (SPSS) ver. 20 software for analyses. Descriptive statistics (mean and standard deviation, frequencies and percentages) were computed. To measure the significant differences, Chi-square test was used at 5% level of significance.
Results:
The mean (SD) age of 400 respondents was 22.5 (11.5) years. We computed the internal consistency, and the overall Cronbach alpha was 0.81. Also, 40% of the respondents were females, while 60% were males. Results showed that 20% of the respondents had multiple symptoms of eye problems, while 9% had no symptoms, 9% had eye pain, 8% had dryness of eye, and 6% had watering of eyes and redness of eye symptoms. The rest of the symptoms was found in less than 5% of the respondents.
Conclusion:
This worldwide issue requires immediate attention. Long-term computer use has been linked to significant visual impairments, particularly in people who use computers and similar gadgets for extended periods of time.
Keywords: Computer, diseases, symptoms, syndrome, vision
Introduction
Computer vision syndrome (CVS) is a group of symptoms caused by focusing at a computer screen for lengthy periods of time. Due to constant use of computers by the students, it has become one of the growing health risks associated with technology (cell phones and tablets).[1] CVS is a combination of eye and vision disorders associated with activities that affect near vision and is experienced in relation to or during the use of computers, as defined by the American Optometric Association. It refers to a set of visual symptoms that occur as a result of prolonged looking at the digital screen when the task’s demands surpass the viewer’s ability.[2] Dry and irritated eyes, eye strain/fatigue, blurred vision, red eyes, burning eyes, excessive tears, double vision, headache, and light/glare sensitivity are all symptoms of CVS, also known as digital eye strain.[3]
The public health burden of CVS is becoming a source of worry for policymakers and scholars alike. According to a research conducted in Abuja, Nigeria, 40% of computer users working as security and exchange commissioners have experienced at least one symptom of CVS. CVS affects more than two-thirds of computer office workers in Sri Lanka, according to a national research. According to a couple of studies conducted in Gondar, Ethiopia, over 73% of computer users working as secretaries, data processors, and bankers develop CVS.[4,5,6,7]
Computer use accounts for over 75% of a person’s everyday activity. Sixty million computer professionals around the world suffer from CVS. Nearly 45 million workers spend hours on end looking at the computer screen.[7,8] According to a survey of American optometrists, 14.25% of patients who visited an optometry clinic were experiencing symptoms related to computer use. In today’s world, university students, particularly medical students, spend more time staring at a computer screen for studying and research. Several studies have found a higher prevalence of CVS among computer users, particularly medical students. Besides the health problems, CVS causes inefficiency at workplace and deteriorates the quality of work.[1,2,3,4,5,6,7,8,9]
Although several studies have revealed the frequency of CVS and risk factors such as prolonged computer usage and improper workstation postures, the majority of them focused on western adult subjects, with just a few Asian countries being included. There is a scarcity of data on CVS and its determinants in sub-Saharan African countries, including Ethiopia.[4,5,6,7,8,9] A few studies in Ethiopia sought to establish the frequency of CVS and associated characteristics among computer users in academic and financial institutions, but their focus was on academic institutions and bank workers. These studies, however, are insufficient to investigate the nature of CVS and predictive variables in various categories of computer users. According to a research conducted in Jeddah (Saudi Arabia), the ocular and musculoskeletal discomfort linked with CVS may cause 40% of users to be less productive. Also, among the 587 students enrolled in the study, a high prevalence of CVS (558; 95%) was reported.[10]
Computer technology has advanced significantly during the last 30 years. It has practically become a necessary piece of office and household equipment. While it is undeniable that computers have greatly benefited society by making working conditions better and allowing for faster output, they have also been linked to health-related issues.[11]
The use of computers has expanded rapidly as a result of technological improvement and global socioeconomic development. The prevalence of computer use in sub-Saharan Africa is not unusual; yet, users lacked appropriate awareness of computer safety procedures. Computers are also of poor quality and are not fitted with CVS-protective mechanisms.[9,10,11]
The main aim of the study to find out the risk factors regarding CVS, its symptoms, and other factors associated with CVS.
Materials and Methods
In this cross-sectional study, data was collected using a purposely constructed E-questionnaire. The questionnaire consisted of demographic items, and items related to the usage of E-devices and the symptoms of eye problems. The questionnaire was constructed after a series of discussions were conducted among a panel of experts. This panel was composed of ophthalmologists, research methodologists, and language experts. Cronbach alpha of the questionnaire was calculated. The study was conducted in the Aseer region of Saudi Arabia.
After data collection, data was coded and entered in the Statistical Package for the Social Sciences (SPSS) ver. 20 software for analyses. Descriptive statistics (mean and standard deviation, frequencies and percentages) were computed. To measure significant differences, Chi-square test was used at 5% level of significance. Regression analysis was carried out to measure the significant impact of dependent variables over independent variables. Data was collected from the respondents (medical students, staff of the college and university). Ethical approval was obtained from King Khalid University, Saudi Arabia. The study duration was from January 2021 to June 2021. Written consent was taken from the respondents that they are willing to participate in this research. Also, the questionnaire was anonymous.
Results
The mean (SD) age of 400 respondents was 22.5 (11.5) years. We computed the internal consistency, and the overall Cronbach alpha was 0.81. Also, 40% of the respondents were females, while 60% were males. [Table 1] shows that gender had a significant impact on the responses to the following questions: How often do you think you need to take break from the screen while using digital devices? Since lockdown, has your digital device usage prevented you from going to sleep at an optimal time/caused you to fall asleep after late night usage? and What is the main purpose of most of your digital device usage? [Table 2] shows that academic levels had a significant impact on the main purpose of the usage of digital devices and occurrence of symptoms. [Table 3] shows that age had a significant impact on the timings of the usage of digital devices after coronavirus disease 2019 (COVID-19) lockdown. Further, age also played a significant role in taking a break time while using a digital device. [Figure 1] depicts that 20% of the respondents had multiple symptoms of eye problems, while 9% had no symptoms, 9% had eye pain, 8% had dryness of eye, and 6% had watering of eyes and redness of eye. The rest of the symptoms was shown by less than 5% of the respondents. [Figure 2] shows that 31.1% of the respondents felt relived on sleeping, while 68.9% feeling sense of relieve after sometime. [Table 4] shows that on comparing the usage of E-devices before COVID-19 and after COVID-19, we observed significant differences. [Figure 3] depicts that most of the respondents (49%) were using E-devices for virtual classes, while 285 were using them for multiple purposes (entertainment, virtual classes, and other study purposes). [Figure 4] depicts that 38% were using smartphones, 25% were using laptops, 12% were using iPads, 7% were using desktops, and 18% were using multiple devices for their E-needs. [Figure 5] shows that 108 respondents were using E-devices (during lockdown) for more than 10 h, while 73 respondents were using them for 6 h, 55 respondents for 5 h. [Table 5] shows that 27% of the respondents believed that they should take break after 10 min, while 29% believed that they should take break after 20 min. Also, 28.0% believed that they should take break after 30 min, while 17.0% believed that the break time will be after 40 min. We observed that 29.9% always had symptoms of eye problems, while 70.1 had rare and minor symptoms [Figure 6]. [Table 6] shows that 69% believed that the frequency and intensity with which they experienced these symptoms increased since the lockdown was implemented, while 31% believed that there was no increase in the symptoms after lockdown.
Table 1.
Influence of gender on our variables of interest
| Gender | Unstandardized coefficients | Standardized coefficients Beta |
t | Sig. | |
|---|---|---|---|---|---|
|
| |||||
| B | Std. error | ||||
| Do you wear glasses while using digital device? | −0.005 | 0.048 | −0.005 | −0.107 | 0.915 |
| Has the frequency and intensity with which you experience these symptoms increased since the lockdown was implemented?* | −0.051 | 0.055 | −0.050 | −0.939 | 0.348 |
| How many hours has your digital device usage increased after E-learning was initiated during COVID-19 lockdown?* | 0.047 | 0.007 | 0.308 | 6.391 | 0.000* |
| How often do you experience these symptoms?* | −0.099 | 0.053 | −0.091 | −1.858 | 0.064 |
| How often do you think you need to take break from the screen while using digital devices? | −0.006 | 0.002 | −0.120 | −2.497 | 0.013* |
| Since the lockdown, has your digital device usage prevented you from going to sleep at an optimal time/caused you to fall asleep after late night usage? | −0.129 | 0.052 | −0.124 | −2.467 | 0.014* |
| What is the main purpose of most of your digital device usage? | 0.037 | 0.016 | 0.108 | 2.245 | 0.025* |
| What is the severity of these symptoms?* | 0.054 | 0.052 | 0.050 | 1.049 | 0.295 |
*significant at 95% level of significance
Table 2.
Influence of academic levels on our variables of interest
| Academic level | Unstandardized coefficients | Standardized coefficients Beta |
t | Sig. | |
|---|---|---|---|---|---|
|
| |||||
| B | Std. error | ||||
| Do you wear glasses while using digital device? | −0.014 | 0.291 | −0.002 | −0.048 | 0.961 |
| Has the frequency and intensity with which you experience these symptoms increased since the lockdown was implemented?* | −0.045 | 0.333 | −0.008 | −0.135 | 0.893 |
| How many hours has your digital device usage increased after E-learning was initiated during COVID-19 lockdown?* | 0.063 | 0.045 | 0.072 | 1.405 | 0.161 |
| How often do you experience these symptoms?* | 0.814 | 0.323 | 0.132 | 2.517 | 0.012* |
| How often do you think you need to take break from the screen while using digital devices?* | −0.008 | 0.014 | −0.027 | −0.535 | 0.593 |
| Since the lockdown, has your digital device usage prevented you from going to sleep at an optimal time/caused you to fall asleep after late night usage?* | −0.330 | 0.317 | −0.056 | −1.042 | 0.298 |
| What is the main purpose of most of your digital device usage? | 0.229 | 0.100 | 0.117 | 2.289 | 0.023* |
| What is the severity of these symptoms?* | −0.109 | 0.315 | −0.018 | −0.347 | 0.729 |
*significant at 95% level of significance
Table 3.
Influence of age groups on our variables of interest
| Coefficients | |||||
|---|---|---|---|---|---|
|
| |||||
| Age | Unstandardized coefficients | Standardized coefficients Beta |
t | Sig. | |
|
| |||||
| B | Std. error | ||||
| Do you wear glasses while using digital device? | 0.070 | 0.094 | 0.036 | 0.745 | 0.457 |
| Has the frequency and intensity with which you experience these symptoms increased since the lockdown was implemented?* | −0.003 | 0.109 | −0.002 | −0.031 | 0.975 |
| How many hours has your digital device usage increased after E-learning was initiated during COVID-19 lockdown?* | 0.052 | 0.015 | 0.180 | 3.379 | 0.001* |
| How often do you experience these symptoms?* | −0.010 | 0.108 | −0.005 | −0.095 | 0.924 |
| How often do you think you need to take break from the screen while using digital devices?* | 0.014 | 0.005 | 0.146 | 2.948 | 0.003* |
| Since the lockdown, has your digital device usage prevented you from going to sleep at an optimal time/caused you to not fall asleep after late night usage?* | 0.009 | 0.103 | 0.005 | 0.091 | 0.927 |
| What is the severity of these symptoms?* | 0.180 | 0.102 | 0.087 | 1.752 | 0.081 |
*significant at 95% level of significance
Figure 1.

Symptoms
Figure 2.
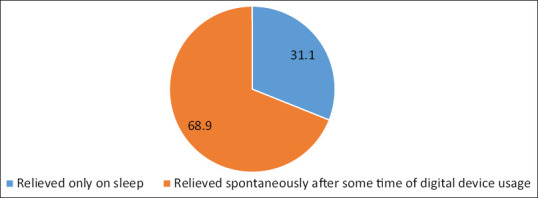
Severity of the symptoms
Table 4.
Comparison of usage of electronic devices before and after lockdown
| 12-14 hours | 15-17 hours | 3-5 hours | 6-8 hours | 9-11 hours | less than 3 hours | more than 18 hours | |
|---|---|---|---|---|---|---|---|
|
| |||||||
| After | |||||||
| Before | |||||||
| 12-14 hours | 13 | 0 | 22 | 15 | 24 | 1 | 0 |
| 15-17 hours | 19 | 7 | 3 | 6 | 11 | 4 | 6 |
| 3-5 hours | 0 | 0 | 16 | 3 | 4 | 8 | 2 |
| 6-8 hours | 2 | 0 | 32 | 6 | 4 | 11 | 1 |
| 9-11 hours | 3 | 0 | 40 | 72 | 4 | 1 | 1 |
| less than 3 hours | 0 | 1 | 3 | 6 | 0 | 8 | 12 |
| more than 18 hours | 1 | 5 | 8 | 9 | 4 | 0 | 2 |
P=0.0001 (significant)
Figure 3.
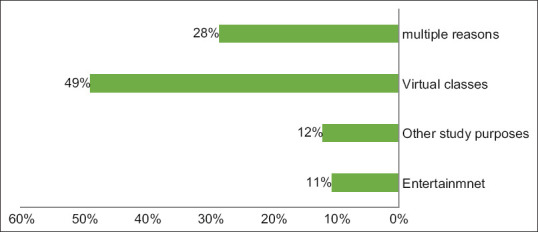
Purpose of using E- devices
Figure 4.
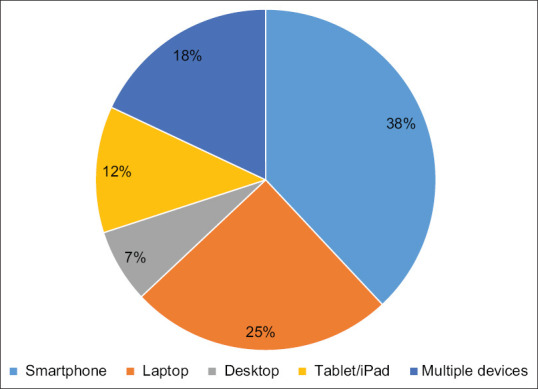
Type of digital device used
Figure 5.
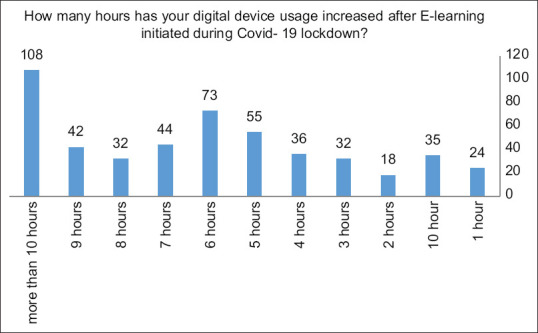
How many hours has your digital device usage increased after E-learning initiated during Covid- 19 lockdown? COVID-19 = coronavirus disease 2019
Table 5.
How often do you think you need to take break from the screen while using digital devices?
| How often do you think you need to take break from the screen while using digital devices? | Frequency | Percentage |
|---|---|---|
| 10 min | 106 | 27 |
| 20 min | 115 | 29 |
| 30 min | 110 | 28.0 |
| 40 min | 69 | 17.00 |
| Total | 400 | 100.0 |
Figure 6.
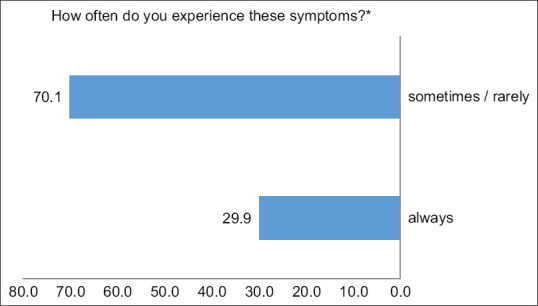
Symptoms’ frequency
Table 6.
Has the frequency and intensity with which you experience these symptoms increased since the lockdown was inedited??
| Has the frequency and intensity with which you experience these symptoms increased since the lockdown was inedited?? | Frequency | Percent |
|---|---|---|
| no | 125 | 31 |
| yes | 375 | 69 |
| Total | 400 | 100.0 |
Discussion
The main aim of the study was to find the risk factors of CVS, its symptoms, and other associated factors with CVS. In this study, we observed that 20% of the respondents have multiple symptoms of eye problems, while 9% have no symptoms, 9% have eye pain, 8% have dryness of eye, and 6% have watering of eyes and redness of eye. The rest of the symptoms was found in less than 5% of the respondents, which is comparable with the findings of a Jeddah-based study which stated that excessive tears was the most commonly reported ocular symptom (20.6%), followed by a sense of dryness (20.3%).[10]
In our study, after applying the regression test, we discovered that gender had a substantial impact on the responses to the following questions: How often do you think you should take a break from using digital devices? Has your digital device usage since the shutdown prevented you from sleeping at a reasonable hour or forced you to fall asleep after late night use? What is the primary goal of your digital device usage? in our study we have observed age and gender have significant impact on several variables (regression analysis). These findings were supported by Hassan et al.[11,12] who discovered that taking 30-min breaks per hour reduces the visual symptoms. In our study, the goal of usage of E-device was also correlated significantly with gender. Further, age also played a significant role in taking a break time while using a digital device, which is supported by the findings of a review article by Goswami and Dutta[12,13,14] which reported that gender played a role in the usage of E-technology and devices. Academic levels had a significant impact on the main purpose of the usage of digital devices and the occurrence of symptoms. We found that as different academic levels required different lengths of study hours, they caused a significant impact over usage of digital devices and occurrence of symptoms.
In our study, we noticed that 31.1% of the respondents felt relieved on sleeping, while 68.9% felt a sense of relief spontaneously after some time of digital device usage. This is in accordance with the findings of a study conducted in Ghana[15] which stated that there was also a link between sleep disturbance and the number of years spent using digital devices.
Following the implementation of the COVID-19 shutdown, there was a significant increase in the usage of digital devices, as well as a gradual deterioration of ocular health across all age categories. It is important to raise awareness about how to avoid digital eye strain, and solutions to reduce the negative impacts should be investigated in the future. In our study, most of the respondents (49%) were using E-devices for virtual classes, while 285 were using them for multiple purposes (entertainment, virtual classes, and other study purposes).[16,17,18,19,20,21,22]
On comparing the usage of E-devices before COVID-19 and after COVID-19, we observed significant differences. This is quite obvious in the current E-education and distance learning scenario.
In our study, 27% of the respondents believed that they should take break after 10 min, while 29% believed that they should take break after 20 min. Also, 28.0% believed they should take break after 30 min, while 17.0% believed that the break time will be after 40 min. Students should be encouraged to take breaks when using electronic devices, and occupational and environmental health experts should do the same for themselves. Breaks allow them to perform at their best and reduce the risk of developing eye diseases.
Conclusion
CVS is an increasing public health issue that causes a wide range of complaints and symptoms. As a result, preventative actions as well as education programs about these risks are required. Computers and other visual display technologies have unquestionably changed people’s lives, yet there is an alarmingly high rate of major vision issues connected with prolonged usage of such equipment. This worldwide issue requires immediate attention. Long-term computer use has been linked to significant visual impairments, particularly in people who use computers and similar gadgets for extended periods of time.
Declaration of patient consent
The authors certify that they have obtained all appropriate patient consent forms. In the form the patient (s) has/have given his/her/their consent for his/her/their images and other clinical information to be reported in the journal. The patients understand that their names and initials will not be published and due efforts will be made to conceal their identity, but anonymity cannot be guaranteed.
Financial support and sponsorship
Nil.
Conflicts of interest
There are no conflicts of interest.
References
- 1.Tauste Francés A, Ronda-Pérez E, SeguíCrespo Mdel M. Ocular and visual alterations in computer workers contact lens wearers: Scoping review. Rev Esp Salud Publica. 2014;88:203–15. doi: 10.4321/S1135-57272014000200004. [DOI] [PubMed] [Google Scholar]
- 2.Bali J, Neeraj N, Bali RT. Computer vision syndrome: A review. J Clin Ophthalmol Res. 2014;2:61–8. [Google Scholar]
- 3.American Optometric Association. The Effects of Computer Use on Eye Health and Vision. St. Louis, MO, USA: American Optometric Association; 1997. Available from: https://www.aoa.org/Documents/optometrists/effects-of-computer-use.pdf . [Google Scholar]
- 4.Lemma MG, Beyene KG, Tiruneh MA. Computer vision syndrome and associated factors among secretaries working in ministry offices in Addis Ababa, Ethiopia. Clin Optom (Auckl) 2020;12:213–22. doi: 10.2147/OPTO.S284934. [DOI] [PMC free article] [PubMed] [Google Scholar]
- 5.Salibello C, Nilsen E. Is there a typical VDT patient?A demographic analysis. J Am Optometry Assoc. 1995;66:479–83. [PubMed] [Google Scholar]
- 6.Ranasinghe P, Wathurapatha W, Pereraetal YS. Computer vision syndrome among computer office workers in a developing country: An evaluation of prevalence and risk factors. BMC Res Notes. 2016;9:150–8. doi: 10.1186/s13104-016-1962-1. [DOI] [PMC free article] [PubMed] [Google Scholar]
- 7.Bahkir FA, Grandee SS. Impact of the COVID-19 lockdown on digital device-related ocular health. Indian J Ophthalmol. 2020;68:2378–83. doi: 10.4103/ijo.IJO_2306_20. [DOI] [PMC free article] [PubMed] [Google Scholar]
- 8.Sheppard AL, Wolffsohn JS. Digital eye strain: Prevalence, measurement and amelioration. BMJ Open Ophthalmol. 2018;3:e000146. doi: 10.1136/bmjophth-2018-000146. doi: 10.1136/bmjophth-2018-000146. [DOI] [PMC free article] [PubMed] [Google Scholar]
- 9.Moon JH, Kim KW, Moon NJ. Smartphone use is a risk factor for pediatric dry eye disease according to region and age: A case control study. BMC Ophthalmol. 2016;16:188. doi: 10.1186/s12886-016-0364-4. [DOI] [PMC free article] [PubMed] [Google Scholar]
- 10.Abudawood GA, Ashi HM, Almarzouki NK. Computer vision syndrome among undergraduate medical students in King Abdulaziz University, Jeddah, Saudi Arabia. Hindawi J Ophthalmol. 2020;2020:2789376. doi: 10.1155/2020/2789376. [Google Scholar]
- 11.Hassan HMJ, Ehsan S, Arshad HS. Frequency of computer vision syndrome &ergonomic practices among computer engineering students. Int J Sci Res. 2016;5:121–5. [Google Scholar]
- 12.Logaraj M, Priya V, Seetharaman N, Hedge S. Practice of ergonomic principles and computer vision syndrome (CVS) among undergraduates students in Chennai. Natl J Med Res. 2013;3:111–6. [Google Scholar]
- 13.Goswami A, Dutta S. Gender differences in technology usage—A literature review. Open J Business Manag. 2016;4:51–9. [Google Scholar]
- 14.Shah S, Jani H. Prevalence and associated factors of dry eye: Our experience in patients above 40 years of age at a tertiary care center. Oman J Ophthalmol. 2015;8:151–6. doi: 10.4103/0974-620X.169910. [DOI] [PMC free article] [PubMed] [Google Scholar]
- 15.Boadi-Kusi SB, Abu SL, Acheampong GO, Adueming POW, Abu EK. Association between poor ergophthalmologic practices and computer vision syndrome among university administrative staff in Ghana. Hindawi J Environ Public Health. 2020;2020:7516357. doi: 10.1155/2020/7516357. doi: 10.1155/2020/7516357. [DOI] [PMC free article] [PubMed] [Google Scholar]
- 16.Yogesh S, Abha S, Priyanka S. Mobile usage and sleep patterns among medical students. Indian J Physiol Pharmacol. 2014;58:100–3. [PubMed] [Google Scholar]
- 17.Messmer EM. The pathophysiology, diagnosis, and treatment of dry eye disease. Dtsch Arztebl Int. 2015;112:71–82. doi: 10.3238/arztebl.2015.0071. [DOI] [PMC free article] [PubMed] [Google Scholar]
- 18.Hayes JR, Sheedy JE, Stelmack JA, Heaney CA. Computer use, symptoms, and quality of life. Optom Vis Sci. 2007;84:E739–56. doi: 10.1097/OPX.0b013e31812f7546. [DOI] [PubMed] [Google Scholar]
- 19.Subcommittee E. The epidemiology of dry eye disease: Report of the epidemiology subcommittee of the international dry eye workshop. Ocul Surf. 2007;5:93–107. doi: 10.1016/s1542-0124(12)70082-4. [DOI] [PubMed] [Google Scholar]
- 20.Zenbaba D, Sahiledengle B, Bonsa M, Tekalegn Y, Azanaw J, Chattu VK. Prevalence of computer vision syndrome and associated factors among instructors in Ethiopian Universities: A web-based cross-sectional study. ScientificWorldJournal. 2021;2021:3384332. doi: 10.1155/2021/3384332. doi: 10.1155/2021/3384332. [DOI] [PMC free article] [PubMed] [Google Scholar]
- 21.Derbew H, Nega A, Tefera W, Zafu T, Tsehaye K, Haile K, et al. Assessment of computer vision syndrome and personal risk factors among employees of commercial bank of Ethiopia in Addis Ababa, Ethiopia. J Environ Public Health. 2021;2021:6636907. doi: 10.1155/2021/6636907. doi: 10.1155/2021/6636907. [DOI] [PMC free article] [PubMed] [Google Scholar]
- 22.Li R, Ying B, Qian Y, Chen D, Li X, Zhu H, et al. Prevalence of self-reported symptoms of computer vision syndrome and associated risk factors among school students in china during the COVID-19 pandemic. Ophthalmic Epidemiol. 2021 doi: 10.1080/09286586.2021.1963786. doi: 10.1080/09286586.2021.1963786. [DOI] [PubMed] [Google Scholar]