

Abstract
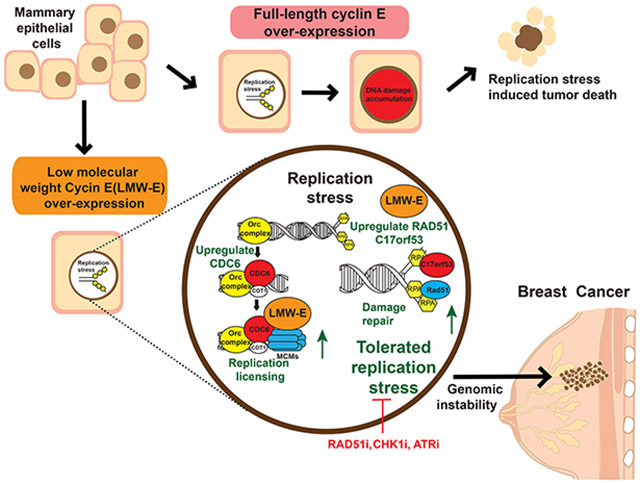
Low-molecular-weight cyclin E (LMW-E) is an N-terminus deleted (40 amino acid) form of cyclin E detected in breast cancer, but not in normal cells or tissues. LMW-E overexpression predicts poor survival in breast cancer patients independent of tumor proliferation rate, but the oncogenic mechanism of LMW-E and its unique function(s) independent of full-length cyclin E (FL-cycE) remain unclear. In the current study, we found LMW-E was associated with genomic instability in early-stage breast tumors (n = 725) and promotes genomic instability in human mammary epithelial cells (hMECs). Mechanistically, FL-cycE overexpression inhibits the proliferation of hMECs by replication stress and DNA damage accumulation, but LMW-E facilitates replication stress tolerance by upregulating DNA replication and damage repair. Specifically, LMW-E interacted with chromatin and upregulated the loading of minichromosome maintenance complex proteins (MCMs) in a CDC6 dependent manner and promoted DNA repair in a RAD51- and C17orf53-dependent manner. Targeting the ATR-CHK1-RAD51 pathway with ATR inhibitor (ceralasertib), CHK1 inhibitor (rabusertib), or RAD51 inhibitor (B02) significantly decreased the viability of LMW-E–overexpressing hMECs and breast cancer cells. Collectively, our findings delineate a novel role for LMW-E in tumorigenesis mediated by replication stress tolerance and genomic instability, providing novel therapeutic strategies for LMW-E–overexpressing breast cancers.
Graphical Abstract
Introduction
Breast cancer is the most commonly diagnosed cancer and the second most common cause of cancer-related deaths in women in US, accounting for 30% of all cancers diagnosed and 15% of cancer related deaths in women in 2022 [1]. Based on the presence or absence of the estrogen receptor (ER), progesterone receptor (PR), and human epidermal growth factor receptor 2 (HER-2) receptor and levels of the proliferation marker Ki67, breast cancer is divided into four subtypes [2 , 3]: i) Luminal A; hormone receptor-positive (ER+/PR+/HER2−) and Ki67 low (<20%), ii) Luminal B; hormone receptor-positive, and HER2-positive or negative (ER+/PR+/HER2+/−) and Ki67 high (>20%), iii) HER2 amplified (ER−/PR−/HER2+) and Ki67 high (>20%), and iv) triple negative (ER−/PR−/HER2−) and Ki67 high (>20%) [4]. Although endocrine therapies and HER2-targeted therapies are used successfully to treat the ER+/PR+ and HER2+ breast cancers [5], respectively, there are no targeted therapies available for triple negative breast cancers (TNBC) [6], emphasizing the need for further understanding of molecular alterations in key genes that deregulate the cell cycle leading to unabated cell proliferation in breast cancers.
As a core regulatory protein in cell cycle, cyclin E binds with CDK2 and drives G1/S transition [7]. Cyclin E-CDK2 kinase complex hyper-phosphorylates pRB and promotes S phase gene transcription by releasing E2F transcription factors [7]. Cyclin E-CDK2 also directly regulates DNA synthesis by inhibiting pre-replication complex (pre-RC) formation and stimulating pre-initiation complex (pre-IC) formation [8]. In normal cells, over-expression of full-length cyclin E (FL-cycE, cyclin E1) results in enhanced CDK2 activity and replication stress response (RSR), leading to cell cycle arrest/senescence and ultimately cell death [8, 9]. In cancer cells with impaired RSR, activation of cyclin E-CDK2 interferes with DNA replication dynamics including time and location of origin activation, resulting in insufficient DNA replication, DNA re-replication, conflicts between replication and transcription, enhancing genomic instability [8-12]. In experimental models, cyclin E overexpression is sufficient to induce tumorigenesis in vivo. Approximately 10% of transgenic mice with over- expression of human FL-cycE in the mammary gland develop mammary carcinomas [13, 14]. Low-molecular-weight cyclin E (LMW-E), a post-translationally modified isoform of cyclin E, is found in 50% of ER+/PR+ breast cancers, 75% of HER2+ breast cancers and 80% of TNBCs [13, 15]. Distinct from its full-length counterpart, LMW-E is predominantly detected in tumor tissues but not in adjacent normal tissues [13, 15]. We previously reported that LMW-E, but not FL-cycE was sufficient to disrupt acinar development of human mammary epithelial cells (hMECs) and generated tumors in vivo [16]. In transgenic mouse models, LMW-E drives early oncogenic events in the pre-neoplastic mammary glands, leading to hyperplastic lesions and spontaneous mammary tumors in > 70% of mice with high metastatic capacity in 54% of mice [13, 14]. LMW-E also hyperactivates CDK2 and the LMW-E - CDK2 kinase complex is resistant to natural CDK inhibitors such as p21 and p27 [17]. However, whether or not LMW-E facilitates unique molecular functions apart from FL-cycE remains unclear.
In the current study, we show a significant correlation between LMW-E expression and genomic instability in tumors from early-stage breast cancer patients (n = 725). In addition, expression of LMW-E independently predicts worse clinical outcomes. We tested the hypothesis that LMW-E promotes genomic instability in human mammary epithelial cells by comparing the functions of LMW-E and FL-cycE, where the endogenous cyclin E has been knocked out. Mechanistically, our data reveals the distinct features of LMW-E and FL-cycE in regulating DNA replication and DNA damage repair. Specifically, LMW-E, but not FL-cycE leads to DNA damage repair pathways which can be targeted by small molecule inhibitors targeting ATR-CHK1-RAD51 pathway.
Materials and Methods
Cell lines and culture conditions
The immortalized human mammary epithelial cell lines (hMECs) 76NE6 and 76NF2V were previously described [18] and maintained in DFCI-1 media [19]. MDA-MB-157 and MDA-MB-231 were obtained from ATCC, and maintained in α-MEM (HyClone). All cells were free of Mycoplasma contamination and were authenticated regularly (every 6 months) by karyotype and short tandem repeat analysis at The University of Texas MD Anderson Cancer Center (MDACC) Characterized Cell Line Core Facility (Houston, TX). Detailed procedures for all in vitro assays (cell proliferation, cell viability, western blot, immunoprecipitation followed by immunoblotting, cell cycle analysis, kinase assays, immunofluorescence staining, DNA fiber assays, comet assay for DNA damage, RNA sequencing and gene set enrichment analysis, metaphase spread assays, and molecular inversion probe-based arrays for copy number measurement) were described previously [16, 20-25] and are also included in the Supplementary Materials and Methods.
Vectors and lentiviral production
CRISPR/sgRNA-mediated human cyclin E (hCCNE1) knockout was performed as previously published [21]. sgRNA targeting hCCNE1 was provided by the Toronto Knockout Library (http://tko.ccbr.utoronto.ca/crispr_targets.pl) and cloned into pX330 vector, which also expresses Cas9 protein. After transfection into 76NE6 or 76NF2V cells, single-cell clones were isolated and expanded. Successful knockout of hCCNE1 in 76NE6-EKO or 76NF2V-EKO lines was confirmed by Sanger sequencing for sgRNA targeting sites and western blot analysis using anti-cyclin E antibody.
Empty-vector, FL-cycE, and LMW-E inducible cells were established using the pLVX-TRE3G-C-eGFP vector [21], derived from LVX-TRE3G (Clontech Laboratories, Inc). The constructs were co-transfected with pCMV-deltaR8.9 and pMD2.G-VSVG plasmids into HEK-293T cells for packaging lentivirus, and the packaged lentivirus was infected into 76NE6-EKO or 76NF2V-EKO cell lines as recommended by the Lenti-X Tet-on 3G inducible expression system protocol (Clontech, #631187). After brief induction (12 hours) with doxycycline, EGFP-high clones (top 10%) were sorted by FACS into 96-well plates and expanded. Doxycycline-induced expression of FL-cycE and LMW-E was confirmed by western blot analysis for similar expression levels between FL-cycE and LMW-E and fluorescent microscopy for subcellular expression localization.
Patients and tissue samples
The study was approved by the Institutional Review Board of MDACC. Each participant signed an Institutional Review Board-approved, protocol-specific informed consent form in accordance with federal and institutional guidelines. The retrospective cohort was comprised of 725 patients with stage I-II breast cancer treated at MDACC between 1985 and 1999 [26, 27]. Clinical information, including patient age, T category, nodal status, tumor grade, subtype, and low molecular weight cyclin E (LMW-E) status, were abstracted from previous reports [26, 27]. In brief, clinical information and follow-up data were identified from the Early Stage Breast Cancer Repository (ESBCR) at MDACC. To determine the status of LMW-E, the formalin-fixed, paraffin-embedded (FFPE) breast tumor samples were deparaffinized, rehydrated, and treated with 3% hydrogen peroxide and methanol to block the peroxidase activity and nonspecific protein-protein interactions. Cyclin E staining was performed by using rabbit polyclonal antibody to cyclin E (Santa Cruz, C-19, sc-198) and the signals were detected by VECTASTAIN Elite ABC kit (PK6101 and PK6102; Vector Laboratories). For each tumor sample, LMW-E status was assigned as follows: LMW-E negative (no staining or just nuclear staining), LMW-E positive (nuclear + cytoplasmic or just cytoplasmic staining) [27].
For copy number (CN) analysis, tumor DNA was extracted from FFPE tissues blocks and DNA from non-tumor-bearing lymph nodes was applied as an internal germline reference. Raw data of molecular inversion probe (MIP)-based arrays from tumor DNA isolated from patient tissues in formalin-fixed, paraffin-embedded blocks (n = 725) and matched non–tumor-bearing lymph node formalin-fixed, paraffin-embedded blocks (n = 129 cases) were abstracted from a previous study [26]. Based on data from the MIP assay, we generated the raw copy number data consisting of total copy number and B-allele frequencies for 201,032 molecular inversion probe arrays. Among the 725 samples, 683 were diploid, 25 were triploid, and 17 were tetraploid tumors. The allele-specific copy number analysis of tumors (ASCAT) algorithm was provided by Van Loo et al.[28]. We obtained 48,623 intervals to generate the copy number gains and losses for each of the sample (within each interval, the copy number did not change for any of the samples).
Genomic instability index (G2I)
The G2I algorithm was performed on copy number data using previously reported R scripts [29]. G2I used copy number data for a two-parameter index representing the overall level of genomic alteration and the number of altered genomic regions. The overall level of genomic alteration (A) is computed as the mean value of the altered probes divided by total probes. The number of altered regions (N) is computed by local score statistics counting altered genomic regions along the genome. For a given sample i, if Ai < a1 and Ni < n1, then genomic instability index = 1; if Ai > a3 and Ni > n3, then genomic instability index = 3; otherwise genomic instability index = 2. The thresholds (a1, a3, n1, and n3) were determined by the algorithm g2i.learn provided by Bonnet et al [29].
Statistical analysis
Each cell culture experiment was performed at least three times. Continuous outcomes were summarized with means and SDs. Comparisons among groups were analyzed by two-sided t test and Wilcoxon rank-sum test These analyses were performed using SPSS software and Prism version 12.0.
Univariate and multivariate logistic regression was performed to determine whether LMW-E status and other clinical information, including patient age, T stage, lymph node status, nuclear grade, and tumor subtype (based on estrogen receptor and progesterone receptor status), were associated with genomically stable (G2I = 1, G2I = 2) or unstable (G2I = 3) samples and with breast cancer freedom from recurrence (FFR). FFR is modified from guidelines reported by Hudis et al for recurrence-free survival [30], calculating only recurrences (locoregional or distant) and not including deaths as events, regardless of cause of death. The Kaplan–Meier method was used to calculate 15-year freedom from recurrence for each factor. Differences in survival between LMW-E–positive and LMW-E–negative samples were evaluated using the log-rank test.
Results
LMW-E predicts genomic instability and poor clinical outcome in breast cancer patients.
To study genomic instability in LMW-E positive breast cancers, we analyzed a retrospective cohort of 725 patients with stage I-II breast cancer, of which 420 (57%) are hormone receptor (HR) positive, 158 (21.8%) are HER2+, and 140 (19.3%) are TNBC (Supplementary Fig. 1A, Supplementary Table 1). LMW-E levels predicted for worse clinical outcomes regardless of breast cancer subtype [27]. The LMW-E positive patient cohort (n = 427) had a higher proportion of HER2+ and TNBC subtypes compared with the LMW-E negative subgroup (n = 298) and showed significantly increased rates of tumor recurrence and worse clinical outcomes compared to the LMW-E negative patient cohort (Fig. 1A, Supplementary Fig. 1A). DNA extracted from the formalin-fixed paraffin-embedded (FFPE) blocks for all the tumor samples was analyzed by high-density molecular inversion probe (MIP) array-based targeted sequencing to calculate copy number (CN) gains and losses [26]. LMW-E positive tumors showed a significantly higher frequency of CN variations (CNVs) than LMW-E negative tumors (Fig. 1B, 1C). Specifically, regions with CN gains containing oncogenes such as JUN (1p32), FOXC1 (6p25), CCNE2 (8q22), WNT5B (12p13), CCND2 (12p13), FOXM1(12p13), and ERBB2(17q12), as well as regions with CN losses containing TP53 (17p13), were strongly associated with LMW-E positive tumors (Fig. 1C). CN gains in CCNE1 (cyclin E1) were also significantly associated with LMW-E positive tumors (p = 0.0023). We also found that LMW-E positive tumors harbored significantly higher CN gains in genes involved in the DNA pre-replication complex (i.e. CDC6 and MCMs) and DNA damage repair (i.e. RAD51B, RAD51AP1, RAD52, and RAD54B) and had both CN gains and CN losses in multiple genes involved in the nonhomologous end joining pathway compared with LMW-E negative tumors (Fig. 1C and Supplementary Fig. 1B).
Figure 1. Low-molecular-weight cyclin E (LMW-E) independently predicts for genomic instability in breast cancer patients.

A. Kaplan-Meier survival curves showing the association between LMW-E status and freedom from recurrence (FFR) survival rates in a cohort of 725 patients with stage I and II breast cancer. B. Copy number variation (CNV) frequency in LMW-E negative and LMW-E positive groups. C. Association plot demonstrating the frequency of CNVs in LMW-E negative (n = 298) and LMW-E positive (n = 427) tumors compared with normal tissue control. The colored patches highlight the significantly different CN gains (red) and losses (blue) in the LMW-E positive group compared with LMW-E negative group based on Bonferroni correction (adjusted p < 0.05). D. Association plot showing CNV frequency stratified by genomic instability index (G2I): stable genomes (G2I = 1, n = 137), intermediately stable genomes (G2I = 2, n = 425), and unstable genomes (G2I = 3, n = 163). E. Distribution of LMW-E negative tumors and LMW-E positive tumors stratified by G2I. The proportions of genomic stability status were compared between LMW-E negative and LMW-E positive subgroups using the Fisher test (p = 4.9 ×10⁻¹⁴). F. LMW-E status, tumor subtype, and T stage were independently associated with higher genomic instability. Odds ratios and 95% confidence intervals from the multivariate logistic regression model are shown in the forest plot, and the p value for each variable is listed on the right and highlighted in red if p < 0.05. TNBC, triple-negative breast cancer subtype.
To further examine the association between LMW-E status and genomic instability, we applied the genomic instability index (G2I), an established method to calculate overall levels of genomic alteration and numbers of altered genomic regions [29]. The entire cohort (n = 725) was stratified into three groups with stable genomes (G2I = 1; n = 137), intermediately stable genomes (G2I = 2; n = 425), and unstable genomes (G2I = 3; n = 163; Fig. 1D). The majority (>84%) of the samples with unstable genomes (G2I = 3), were LMW-E positive (Fig. 1E, Supplementary Fig. 1C). In addition, LMW-E positive status and the TNBC tumor subtype were both strongly associated with tumors harboring unstable genomes (G2I = 3) on univariate analysis [odds ratio (OR) 4.94 for LMW-E–positive status and 7.4 for TNBC; Supplementary Table 2]. Multivariate analysis revealed that cyclin E status independently predicted genomic instability (OR 3.08, p = 7.38×10⁻⁶; Fig. 1F, Supplementary Table 3). Additionally, LMW-E positive status, unstable genome, and TNBC subtype were associated with worse freedom from recurrence (FFR) in univariate analysis (Supplementary Fig. 1D, Supplementary Table 4). However, on multivariate analysis, LMW-E status, but not TNBC, served as an independent predictor for poor clinical outcomes (Supplementary Fig. 1E, Supplementary Table 5). Collectively, these results show a positive correlation between LMW-E expression and genomic instability in early-stage breast tumors, and that LMW-E is an independent predictor of genomic instability and poor clinical outcome in breast cancer patients.
LMW-E induces genomic instability in hMECs
We next directly examined whether LMW-E and FL-cycE have distinct roles in driving genomic instability in hMECs. Previously, we found LMW-E overexpression in transgenic mice leads to the disruption of the ARF-p53 pathway in MMTV-LMW-E induced mammary adenocarcinomas [14]. To discern if p53 expression can cooperate with either LMW-E or FL-cycE to modulate genomic instability, in this study we used two syngeneic hMECs with either p53–wild-type (76NF2V) or p53-deficient (76NE6) backgrounds [18] as our cell line models. In each cell line, we first deleted the endogenous CCNE gene using gRNA/CRISPR knock out (hereafter referred to as 76NE6-EKO and 76NF2V-EKO; Supplementary Fig. 2A, 2B), followed by inducible (Tet-on) expression of FL-cycE or LMW-E (Fig. 2A). Cell sorting for EGFP, which was fused to the C-terminus of inducible FL-cycE or LMW-E protein, confirmed doxycycline induced FL-cycE and LMW-E were over-expressed in more than 95% of total cell population (Supplementary Fig. 2C). Doxycycline-induced expression of LMW-E and FL-cycE was validated by western blot analysis in 76NE6-EKO and 76NF2V-EKO cells (Fig. 2B, Supplementary Fig. 2D). In vitro cyclin E associated–kinase assay revealed similar kinase activity between LMW-E and FL-cycE, using GST-RB as a substrate [17] (Fig. 2C). However, induced expression of FL-cycE or LMW-E in hMECs showed distinct cell proliferation and viability features. FL-cycE expression significantly inhibited cell proliferation and decreased cell viability in a doxycycline dose-dependent manner, whereas cell proliferation and viability in LMW-E–expressing cells remained robust in both 76NE6-EKO and 76NF2V-EKO cells (Fig. 2D, 2E, Supplementary Fig. 2E, 2F).
Figure 2. Low-molecular-weight cyclin E (LMW-E) causes genomic instability in human mammary epithelial cells (hMECs).

A. Schematic representation of the model systems applied to test the cause-effect relationship between LMW-E and genomic instability. The CCNE1 gene was knocked out in 76NE6 hMECs (p53-deficient) and 76NF2V hMECs (p53–wild-type). C-terminus eGFP-tagged LMW-E, full-length cyclin E (FL-cycE), or empty vector driven by a Tet-on/rtta system were introduced into the cells, followed by clonal selection using EGFP tag to establish stable cell lines for inducible LMW-E, FL-cycE, or empty vector expression. B. LMW-E and FL-cycE expression were examined by western blot analysis in the inducible 76NE6-EKO cell lines following 36 hours of treatment with doxycycline at indicated concentrations. C. Kinase activity of LMW-E and FL-cycE were examined by in vitro kinase assay using GST-RB as the substrate. LMW-E and FL-cycE were pulled down by anti–cyclin E antibody using the lysates of the inducible 76NE6-EKO cell lines treated with doxycycline at the indicated concentrations for 24 hours. D. Cell doubling times were calculated based on cell confluency mask from live cell imaging (Incucyte) with or without induced expression of LMW-E, FL-cycE, or empty vector by doxycycline at the indicated concentrations or vehicle (DMSO) (n = 4, mean with standard deviation]. E. Cell viability calculated by MTT assay, with or without induced expression of LMW-E or FL-cycE after treatment with doxycycline at the indicated concentrations, normalized by empty vector control (n = 4, mean with standard deviation). F and G. After 24 hours of doxycycline (100ng/mL) treatment to induce expression of LMW-E or FL-cycE, DNA synthesis in the inducible 76NE6-EKO cells was monitored by bromodeoxyuridine (BrdU) incorporation (30 minutes) followed by immunofluorescence assay using the anti-BrdU antibody (scale bar = 20 μm; F), and the percentage of BrdUhigh cells in 76NE6-EKO with or without induced FL-cycE or LMW-E expression was quantified (n = 3, cell number > 600, mean with standard deviation; G). H and I. Comet assay was used to measure DNA breaks in 76NE6-EKO cells after 48 hours of doxycycline (100ng/mL) treatment to induce expression of LMW-E or FL-cycE (scale bar = 100 μm; H), and the intensity of DNA damage was quantified by tail moment (n = 2, cell number > 100, mean with standard deviation; I). J. Representative images of chromosomal structural aberrations found in 76NE6-EKO cells after 36 hours of treatment with doxycycline (100ng/mL) to induce LMW-E or FL-cycE expression. (Representative images empty vector controls or un-induced controls are shown in Supplementary Fig. 2I.). K. Quantification of chromosomal breaks frequency in inducible 76NE6-EKO cells under the indicated conditions. (n = 2, metaphases examined per condition = 35). L - N. Representative images of nuclear abnormalities found in 76NE6-EKO cells after 36 hours of treatment with doxycycline (100ng/mL) to induce LMW-E or FL-cycE expression (L) and quantification of cells containing micronuclear (M) and/or multinuclear (N) abnormalities under the indicated conditions (n = 3, cell number > 750, mean with standard deviation). For all statistical analyses, *p < 0.05, **p < 0.01, ***p < 0.001, and ****p < 0.0001; n.s. indicates not significant; Student t test.
To determine whether the growth inhibitory effect of FL-cycE was mediated by DNA replication stress, we initially compared DNA replication between FL-cycE– and LMW-E–expressing hMECs using the bromodeoxyuridine (BrdU) incorporation assay. Results showed that although BrdU signal was reduced significantly by 3-fold in FL-cycE–expressing cells, that the signal was significantly increased by 2.5-fold in LMW-E–expressing cells compared to the un-induced controls (Fig. 2F, 2G). Further analysis of DNA content using BrdU/propidium iodide (PI) double staining suggested that during S-phase (2n < DNA content < 4n), DNA replication was inhibited in FL-cycE– but not LMW-E–expressing cells, indicated by a left-shifted BrdU signal intensity curve (Supplementary Fig. 2G).
To further compare DNA damage between FL-cycE– and LMW-E–expressing hMECs, we measured DNA strand breaks in individual cells using the comet assay. Results revealed that DNA damage indexed by the migration and the fraction of total DNA in the comet tail (tail moment) in 76NE6-EKO cells with FL-cycE expression was 7.1-fold higher than in un-induced cells and 3.0-fold higher than in LMW-E-expressing cells (Fig. 2H, 2I). Although DNA damage was also induced in the LMW-E–expressing cells (tail moment increased 2.8-fold compared with un-induced cells; Fig. 2H, 2I), the BrdU incorporation was not reduced (Fig. 2G), indicating that DNA replication remained robust in the presence of DNA damage in the LMW-E–expressing cells.
We next assessed if there were differential changes in chromosomal integrity between FL-cycE and LMW-E–expressing cells. Metaphase spread assays consistently showed that the frequency of chromosomal breaks was more than 2-fold higher in FL-cycE-expressing cells (1.80 breaks per metaphase) than LMW-E–expressing cells (0.82 breaks per metaphase; Fig. 2J, 2K). Chromosome fusions were similarly induced by FL-cycE and LMW-E, however, the overall frequency of chromosomal structural aberrations was 2-fold higher in FL-cycE (1.98 per metaphase) compared to LMW-E cells (1.09 per metaphase) (Supplementary Fig. 2H - J). In addition, the ratio of cells showing abnormal nuclear phenotypes, such as cells with micro-nuclear or multi-nuclear phenotypes, increased 3.5-fold in FL-cycE-expressing cells and 8.4-fold in LMW-E-expressing cells (Fig. 2L - N). These results suggest that expression of FL-cycE and LMW-E both induced DNA damage and chromosomal abnormalities in hMECs. However, FL-cycE-expressing cells inhibited DNA replication and cell proliferation, while LMW-E-expressing cells continued to replicate their DNA and maintain their cell proliferation, leading to accumulated genomic instability.
LMW-E facilitates replication stress tolerance.
To further examine replicative stress mediated by FL-cycE and LMW-E, we analyzed replication stress markers in a time-course dependent manner by western blot following doxycycline-induction. We found that ATR-dependent phosphorylation of CHK1 (Ser 345), but not total CHK1, was upregulated by both FL-cycE and LMW-E, suggesting that the ATR-CHK1 pathway was activated by cyclin E isoforms in response to replicative stress. However, phosphorylation of Replication Protein A (RPA) component RPA32, on Ser 33 and Ser4/8 was strongly induced by FL-cycE but not LMW-E (Fig. 3A), suggesting that FL-cycE–expressing cells are likely to harbor more replication stress lesions than LMW-E–expressing cells, as RPA is recruited and phosphorylated at replication stress produced single-strand DNA [31]. Consistently, immunofluorescent localization of replication stress lesions detected by nuclear RPA foci (Fig. 3B, 3C), and DNA damage lesions detected by γ-H2AX foci and 53BP1 foci (Fig. 3D - F) revealed that while both FL-cycE and LMW-E expression induced the formation of foci at similar levels at 24 hours post-induction (~40% with FL-cycE and 30% with LMW-E), that only FL-cycE–expressing cells showed persistent foci accumulation at later time points: levels increased to ~65% at 36 hours and ~75% at 48 hours. In contrast, the levels of these proteins in LMW-E-expressing cells had not changed at 24 hours post-induction and remained at around 30-45% from 24-48 hours post induction (Fig. 3C, 3E, 3F). Consistent results were also observed in p53-intact 76NF2V-EKO cell lines (Supplementary Fig. 3A-C), suggesting that different DNA damage phenotypes induced by FL-cycE and LMW-E expression are p53-independent. These data suggest that while expression of both FL-cycE and LMW-E can initiate replicative stress, that in LMW-E–expressing cells the replicative stress is either inhibited or tolerated at later time points.
Figure 3. Low-molecular-weight cyclin E (LMW-E) facilitates replication stress tolerance.

A. Western blot analysis of replication stress markers in inducible 76NE6-EKO cells with or without expression of LMW-E or full-length cyclin E (FL-cycE). Cells were treated with 100ng/mL doxycycline in a time course manner to induce the expression of LMW-E or FL-cycE. Uninduced controls (Dox 0 hours) were treated with DMSO for 48 hours. B and C. Time course analysis of RPA-positive cells (nuclear foci>5) in the inducible 76NE6-EKO cell lines. Doxycycline (100 ng/mL) was used to induce expression of FL-cycE or LMW-E, and un-induced controls (Dox 0 hours) were treated with DMSO for 48 hours. Representative images of immunofluorescence analysis of RPA foci in the indicated conditions (scale bar = 10 μm; B) and quantification of RPA-positive cells (foci > 5) at the indicated time points (cell number > 600, mean with standard deviation; C) are shown. D-F. Time course analysis of DNA damage markers γ-H2AX and 53BP1 foci in the inducible 76NE6-EKO cell lines. Doxycycline (100 ng/mL) was used to induce expression of FL-cycE or LMW-E, and un-induced controls (Dox 0 hours) were treated with DMSO for 48 hours. Representative images of immunofluorescent analysis of γ-H2AX and 53BP1 foci in a time course manner (scale bar = 10 μm; D) and quantification of γ-H2AX-positive cells (nuclear foci > 5; E) and 53BP1-positive cells (nuclear foci > 5; F) at the indicated time points are shown in panels E and F respectively (cell number > 600, mean with standard deviation). G and H. DNA fiber assay using inducible 76NE6-EKO cells under the indicated IdU-CldU labeling and treatment conditions (G) and the calculated replication fork speed (n = 4, fiber number > 400, mean with standard deviation; H). I and J. DNA fiber assays to examine replication fork restart in inducible 76NE6-EKO LMW-E cells. The cells were initially grouped into those expressing LMW-E (100 ng/mL doxycycline for 24 hours; Dox+) or not (DMSO for 24 hours; Dox-). This was followed by 20-minute IdU labeling, hydroxyurea (HU, 5mM, 1 hours) treatment, and 20-minute CldU labeling. Representative DNA fibers (I) and calculated CldU/IdU ratio (n = 3, fiber number > 450, mean with standard deviation; (J) are shown. For all statistical analyses, *p < 0.05, **p < 0.01, ***p < 0.001, and ****p < 0.0001; n.s. indicates not significant; Student t test.
Since cyclin E is involved in maintaining normal DNA replication and fork progression [8], we next examined whether the progression of DNA replication is different between FL-cycE– and LMW-E–expressing cells by measuring DNA fork speeds using DNA fiber assays (Fig. 3G, 3H). 76NE6-EKO inducible cells were induced to express FL-cycE and LMW-E for 0, 24 and 48 hours and just before harvest, cells were pulse-labeled with iododeoxyuridine (IdU) for 30 minutes followed by Chlorodeoxyuridine (CldU) labeling for 30 minutes, and the lengths of ongoing DNA fibers (IdU-CldU, green-red color) were quantified to calculate the fork speed as a function of total labeling time (1 hour; Fig. 3G, 3H). Compared to un-induced cells (~ 40 μm/hour), DNA replicative fork progression decreased at 24 hours after induction to a similar level (by ~ 35%) in both FL-cycE– and LMW-E-expressing cells. However, at 48 hours post induction, the fork progression was further attenuated in FL-cycE (by 72% that of un-induced cells to 11 μm/hour), while the fork speed was significantly higher in LMW-E–expressing cells (at 23 μm/hour; Fig. 3G, 3H). These results suggest two possibilities: (i) LMW-E induces less DNA replication stress at later time points or (ii) LMW-E actively promotes replication stress tolerance.
To test whether LMW-E can mediate tolerance towards replication stress induced by hydroxyurea (HU), an inhibitor of ribonucleotide reductase, we labeled the cells with IdU for 20 minutes, followed by 60 minutes treatment with HU (5mM), and then labeled the cells with CldU for 20 minutes after the wash-out of HU. We analyzed the ratio of CldU fiber lengths compared to IdU to determine the effect of LMW-E on fork restart after HU induced replication stress. Our results showed that the CldU/IdU ratio was 37% higher in LMW-E-expressing cells than in cells without LMW-E over-expression, suggesting LMW-E may actively facilitate replication stress tolerance to replication stress challenge by promoting fork restart (Fig. 3I, 3J).
Collectively, these results suggest that both FL-cycE and LMW-E can induce replication stress and DNA damage. However, LMW-E plays an active role in facilitating replication stress tolerance, whereas the replication stress and subsequent DNA damage accumulating in FL-cycE-expressing cells is irreparable.
LMW-E expressing cells harbor altered transcriptomic expression of DNA replication and DNA damage repair pathways
To interrogate the molecular mechanisms by which LMW-E promotes replication stress tolerance, we compared transcriptional profiles in inducible 76NE6-EKO hMECs with or without FL-cycE or LMW-E expression. LMW-E but not FL-cycE-expressing cells showed significant enrichment of DNA replication and other types of DNA damage repair pathways, such as mismatch repair, nucleotide excision repair and base excision repair in KEGG Gene Set Enrichment Analysis (GSEA; Fig. 4A, 4B, Supplementary Fig. 4A). GSEA of the HALLMARK pathways also suggest DNA damage repair pathway was only associated with LMW-E–expressing cells, but not FL-cycE–expressing cells (Fig. 4C, 4D, Supplementary Fig. 4B). The enrichment plots for KEGG DNA replication and HALLMARK DNA repair pathways show significant enrichment in LMW-E expressing cells (p = 0.0017 and p = 0.0015, respectively) but not for FL-cycE expressing cells (p = 0.41 and p = 0.99, respectively) (Fig. 4B, 4D), although gene sets associated with the cell cycle and E2F targets were enriched in both FL-cycE– and LMW-E–expressing cells (Supplementary Fig. 4C, 4D), In comparing the specific gene expression changes mediated by the induction of LMW-E with those altered by FL-cycE, we identified CDC6, RAD51 and C17orf53 genes, which are essential to DNA replication and damage repair in response to replication stress [12, 32, 33], as strongly upregulated by LMW-E but not FL-cycE (Fig. 4E, Supplementary Fig. 4C). These results led to the hypothesis that LMW-E mediated upregulation of CDC6, RAD51, and C17orf53 may be required for replication stress tolerance and cell viability in the 76NE6-EKO-LMW-E–expressing cells.
Figure 4. Low-molecular-weight cyclin E (LMW-E) deregulates DNA replication and DNA damage pathways.

A. KEGG pathways significantly enriched in inducible 76NE6-EKO LMW-E cells treated with 100ng/mL doxycycline for 36 hours to induce LMW-E expression (dox+), followed by RNA sequencing and transcriptional profiling. Inducible 76NE6-EKO LMW-E cells cultured without doxycycline (dox-, DMSO added) served as a reference (adjusted p <0.05). B. Enrichment plot for the KEGG DNA replication gene set in the LMW-E dox+ group compared with the LMW-E dox- group (upper panel) and the full-length cyclin E (FL-cycE) dox+ group compared with the FL-cycE dox- group (lower panel). C. HALLMARK pathways significantly enriched in the LMW-E dox+ group compared with the LMW-E dox- group in inducible 76NE6-EKO cells (adjusted p < 0.05). D. Enrichment plot for the HALLMARK DNA repair gene set in the LMW-E dox+ group compared with the LMW-E dox- group (upper panel) and FL-cycE dox+ group compared to FL-cycE dox- group (lower panel). E. Volcano plot highlighting differentially expressed genes in the LMW-E dox+ group compared to LMW-E dox- group. CDC6, RAD51, and C17orf53 were among the top genes up-regulated by LMW-E.
LMW-E facilitates pre-replication complex assembly
We next set out to examine the role of CDC6 and MCM proteins in LMW-E–mediated replication stress tolerance in both 76NE6-EKO and U2OS cells expressing LMW-E since CDC6 and MCM complex components promote replication licensing (Fig. 5A) [12], essential for cells to recover from replication stress [34, 35].
Figure 5. Low-molecular-weight cyclin E (LMW-E) promotes the pre-replication complex assembly.

A. Schematic of pre-replication complex components including minichromosome maintenance (MCM) complex, CDC6 and CDT1. B. Western blot analysis of CDC6, RAD51, and C17orf53 in inducible 76NE6-EKO cell lines treated with doxycycline (100 ng/mL) at different time intervals to induce expression of LMW-E or FL-cycE. C. Western blot analysis of cyclin E (FL-cycE or LMW-E) and DNA pre-replication complex proteins using chromatin-bound fraction samples using the inducible 76NE6-EKO cell lines with the same treatment strategy as (A). D. Analysis of the binding between cyclin E (FL-cycE or LMW-E) and CDC6. Inducible 76NE6-EKO cells were treated with 100ng/mL doxycycline for 24 hours to induce the expression of FL-cycE or LMW-E, followed by co-immunoprecipitation (co-IP) with an anti-cyclin E and western blot analysis using the indicated antibodies. Un-induced cells (DMSO-treated) and co-IP using IgG were used as negative controls. E. Analysis of the binding between LMW-E and CDC6, MCM2 in chromatin-bound fraction. Inducible 76NE6-EKO-LMW-E cells were treated with 100ng/mL doxycycline for 24 hours to induce the expression of LMW-E. Co-immunoprecipitation (co-IP) with an anti-cyclin E using chromatin bound fraction samples, and western blot analysis using the indicated antibodies were performed. Un-induced cells (DMSO-treated) and co-IP using IgG were used as negative controls. F. Western blot analysis of LMW-E and DNA pre-replication complex proteins in the chromatin bound protein fraction with or without transfection of siRNAs targeting CDC6 or non-target siRNA control. These cells were transfected with the indicated siRNAs, followed by 24 hours of treatment with 100 ng/mL doxycycline to induce LMW-E expression. G and H. Representative images of DNA damage assay of immunofluorescent γ-H2AX and 53BP1 foci in inducible 76NE6-EKO-LMWE cells, with or without CDC6 knock-down and/or induction of LMW-E expression (scale bar = 10 μm). The ratio of cells positive for γ-H2AX and 53BP1 foci (foci > 5) was then calculated (cell number > 400, mean with standard deviation; H). I. Analysis of cell viability by MTT assay in inducible 76NE6-EKO-LMWE cells transfected with siRNAs targeting CDC6 or non-targeting (NT) siRNA controls, treated with or without 100 ng/mL doxycycline for 48 hours to induce LMW-E expression. For all statistical analyses, **p < 0.01, ***p < 0.001, and ****p < 0.0001, Student t test.
We collected whole cell lysates from 76NE6-EKO cells induced to express FL-cycE or LMW-E for 0, 12, 24, 36, or 48 hours, and examined the expression levels of CDK6 by western blot analysis. Results suggested LMW-E expression upregulated CDC6 in inducible 76NE6-EKO cells (increased to ~ 1.5-fold after 24 to 48 hours of expression), whereas FL-cycE expression decreased CDC6 expression (by 30 - 50% following 24 to 48 hours of continuous induction; Fig. 5B; Supplementary Fig. 5A, 5B). Consistent results were observed in U2OS cells transfected with FL-cycE or LMW-E overexpressing plasmids, where CDC6 level were upregulated by LMW-E and down-regulated by FL-cycE (Supplementary Fig. 5C). Although both LMW-E and FL-cycE promoted CDC6 binding to the chromatin, only the induction of LMW-E (but not FL-cycE) expression promoted chromatin loading of MCMs complex components (MCM2, MCM4, and MCM7) in a time-course dependent manner (increased ~ 50% after 24 hours of expression), whereas FL-cycE expression decreased MCMs loading (Fig. 5C, Supplementary Fig. 5D). Consistent results were observed both p53 intact 76NE6 background and in p53 deficient 76NF2V cells, suggesting the differential effect of LMW-E and FL-cycE on CDC6 expression and MCMs chromatin loading were p53 independent (Supplementary Fig. 5E).
Additionally, chromatin-bound LMW-E was 4 times higher than FL-cycE, suggesting that LMW-E is interacting with chromatin more strongly than FL-cycE (Fig. 5C, Supplementary Fig. 5E). To further validate this finding, we used breast cancer cell line MDA-MB-157, which endogenously show over-expression of both FL-cycE and LMW-E, and analyzed the levels of these protein in cell fractionation preparations. We observed that despite higher level of FL-cycE than LMW-E was detected in total cell lysates, the level of LMW-E was 4 times that of FL-cycE in the chromatin bound fractions (Supplementary Fig. 5F).
To determine if the binding of CDC6 to LMW-E differs from binding of CDC6 to FL-cycE, we conducted co-immunoprecipitation/western blot experiments with CDC6/cyclin E in HEK293T cells transiently transfected with plasmids encoding CDC6, FL-cycE, and/or LMW-E (Supplementary Fig. 5G), as well as in 76NE6-EKO cells with induced LMW-E (or FL-cycE) and endogenous CDC6 (Fig. 5D). Results showed that in both models, LMW-E interacted more strongly with CDC6 compared with FL-cycE. Using chromatin bound fraction from inducible LMW-E cells, we further confirmed the binding between LMW-E with both CDC6 and MCM2, suggesting LMW-E may form a protein complex with pre-RC loaded on chromatin (Fig. 5E).
Next, to examine the role of CDC6 in LMW-E–mediated replication stress tolerance, we knocked down CDC6 using specific siRNAs (Supplementary Fig. 5H) and siRNA smart pools (Supplementary Fig. 5I). We observed that CDC6 knockdown reduced both LMW-E and MCM complex components chromatin loading levels (Fig. 5F), significantly enhanced DNA damage in hMECs by 2-fold after 24 hours of LMW-E–expressing (Fig. 5G, 5H), and subsequently reduced cell viability by 60% (Fig. 5I). These results show that CDC6 is upregulated by LMW-E and facilitates LMW-E chromatin loading and the LMW-E–mediated pre-replication complex assembly, suggesting that CDC6 maybe an essential down-stream effector of LMW-E in mitigating DNA damage and sustaining cell viability under replication stress.
LMW-E facilitates DNA damage repair
We next examined whether the changes in RAD51 and C17orf53, induced transcriptionally by LMW-E (Fig. 4E), are required for replication stress tolerance. RAD51 functions downstream of the ATR-CHK1 pathway to facilitate lesion repair by stabilizing or remodeling of the stalled forks, and C17orf53 facilitates lesion repair by binding with single strand DNA and RPA [32, 33, 36] (Fig. 6A). Time interval analysis of RAD51 and C17orf53 following induction of FL-cycE and LMW-E for 12-48 hours revealed that while induction of LMW-E or FL-cycE can upregulate the levels of RAD51 and C17orf53 in 76NE6-EKO cells, that LMW-E induction resulted in 2 fold higher upregulation of these proteins compared to FL-cycE (Fig. 5B, Supplementary Fig. 5B). Consistent results were observed in U2OS cells transfected with FL-cycE or LMW-E overexpressing plasmids (Supplementary Fig. 5C). Moreover, expression of FL-cycE, but not LMW-E, in U2OS cells significantly increased replication stress, as indicated by the increase in RPA32 phosphorylation (pS33 and pS4/8 is increased by 4.5-fold and 6.4-fold in FL-cycE and rescued by LMW-E cells following co-expression; Supplementary Fig. 5C). DNA damage as measured by γ-H2AX and 53BP1 foci were also significantly increased in FL-cycE expressing cells compared with LMW-E expressing cells (Supplementary Fig. 6A-C). Co-expression of LMW-E with FL-cycE can rescue the replication stress and DNA damage induced by FL-cycE expression (Supplementary Fig. 6A-C).
Figure 6. Low-molecular-weight cyclin E (LMW-E) facilitates DNA damage repair.

A. Schematic of DNA damage repair mediated by RAD51 and C17orf53 at replication stress lesions. B. Western blot analysis of RAD51 in inducible 76NE6-EKO LMW-E cells (treated with 100 ng/mL doxycycline for 24 hours after siRNA transfection to induce LMW-E expression; DMSO was used as a control) with or without transfection with specific siRNAs targeting RAD51. Nontarget (NT) siRNA was used as a control. C. Western blot analysis of C17orf53 in inducible 76NE6-EKO cells (treated with 100 ng/mL doxycycline for 24 hours after siRNA transfection to induce LMW-E expression; DMSO was used as a control) with or without transfection with specific siRNAs targeting C17orf53. Non-target siRNA was used as a control. D. Analysis of DNA damage intensity by immunofluorescence assay for γ-H2AX and 53BP1 foci in inducible 76NE6-EKO-LMWE cells (scale bar=10 μm). Cells were treated with siRNA targeting RAD51, followed 24 hours of treatment with 100 ng/mL doxycycline to induce LMW-E expression. Non-target siRNA and DMSO were used as controls. E. Quantification of γ-H2AX and 53BP1 foci in D (cell number > 400, mean with standard deviation). F. Analysis of cell viability by MTT assay in inducible 76NE6-EKO-LMWE cells after transfection with specific siRNAs targeting RAD51, followed by treatment with 100 ng/mL doxycycline to induce LMW-E expression for 4 days (mean with standard deviation). Non-target siRNA and DMSO (dox-) were used as controls. G. Analysis of DNA damage intensity by immunofluorescence assay for γ-H2AX and 53BP1 foci in inducible 76NE6-EKO-LMWE cells (scale bar=10 μm). Cells were treated with siRNA targeting C17orf53, followed by 24h hours of treatment with 100 ng/mL doxycycline to induce LMW-E expression. Non-target siRNA and DMSO were used as controls. H. Quantification of γ-H2AX and 53BP1 foci in panel G (cell number > 400, mean with standard deviation). I. Analysis of cell viability by MTT assay in inducible 76NE6-EKO cells after transfection with specific siRNAs targeting C17orf53, followed by 100 ng/mL doxycycline to induce LMW-E expression for 4 days. Nontarget siRNA and DMSO (dox-) were used as controls. For all statistical analyses, ***p < 0.001 and ****p < 0.0001, Student t test.
To further confirm that LMW-E promotes DNA damage repair, we used a GFP based DNA damage repair-reporter system (EJ5-GFP) [32, 37]. In U2OS cell line harboring EJ5-GFP, double strand breaks can be induced by expression of transiently transfected I-SceI enzyme, and end joining between two distal tandem I-SceI recognition sites may restore an GFP expression cassette; thus the DNA damage repair efficiency is estimated by the ratio of GFP positive cells. Our results revealed that upon the induction of LMW-E but not FL-cycE, the ratio of GFP positive cells increased by 6.6 fold, suggesting repair of double strand breaks by LMW-E (Supplementary Fig. 6D). Co-expression of LMW-E with FL-cycE increased DNA damage repair in U2OS reporter cells by 4.3-fold, suggesting that the effect of LMW-E on replication stress tolerance is dominant over FL-cycE (Supplementary Fig. 6D).
To examine if LMW-E facilitates DNA damage repair in a RAD51- and C17orf53-dependent manner, we treated the inducible 76NE6-EKO cells with siRNAs to specifically knock-down RAD51(Fig. 6B, Supplementary Fig. 6E) or C17orf53 (Fig. 6C, Supplementary Fig. 6F). Compared with nontarget (NT) siRNA controls, RAD51 knockdown elevated DNA damage signals in the LMW-E expressing 76NE6-EKO cells by 2.93-fold (Fig. 6D and 6E), and decreased cell viability by 60% (Fig. 6F). Similarly, C17orf53 knockdown enhanced DNA damage in LMW-E expressing 76NE6-EKO cells by 2.1-fold (Fig. 6G and 6H), and inhibited cell viability by 50% (Fig. 6I). We also knocked-down RAD51 or C17orf53 by siRNAs in inducible FL-cycE cells (Supplementary Fig. 7 A, B). When RAD51 was knocked down, FL-cycE over-expression induced DNA damage in ~ 60% of the cells and reduced cell viability to ~45% (Supplementary Fig. 7 C-E). Similarly, in C17orf53 depleted cells, FL-cycE over-expression induced DNA damage in ~ 56% of the cells and reduced cell viability to ~50% (Supplementary Fig. 7 F-H). However, in control cells transfected with non-targeted siRNAs, over-expression of FL-cycE by itself induced DNA DNA damage in ~50% of the cells and decreased cell viability by ~ 50% (Supplementary Fig 7C-H). Compared to non-targeted siRNAs, the effect of RAD51 or C17orf53 knock down on DNA damage and cell viability were not statistically significant following FL-cycE induction.
Collectively, these results suggest that LMW-E. but not FL-cycE, plays an active role in facilitating DNA damage repair, and that RAD51 and C17orf53 serve as essential downstream effectors in LMW-E–mediated DNA damage repair.
LMW-E expression increases sensitivity to drugs targeting the ATR-CHK1-RAD51 pathway.
Since the DNA repair in LMW-E expressing cells is RAD51-dependent (Fig. 6 D-F) and concomitant with increased CHK1 phosphorylation (Fig. 3A, Supplementary Fig. 3B, Supplementary Fig. 5C), we hypothesized that small molecule inhibitors targeting the ATR-CHK1-RAD51 pathway may cause growth inhibition in LMW-E–expressing cells. We tested this hypothesis by using the RAD51 inhibitor B02, the CHK1 inhibitor rabusertib, and the ATR inhibitor ceralasertib in inducible 76NE6-EKO cells and the LMW-E–overexpressing MDA-MB-231 breast cancer cell line. Compared with un-induced cells, LMW-E–expressing cells significantly reduced the half-maximal inhibitory concentrations (IC50) of B02 (by 37%), rabusertib (by 84%) and ceralasertib (by 75%) in the inducible 76NE6-EKO cells (Fig. 7A). DNA damage signals measured by γ-H2AX and 53BP1 foci were also significantly elevated in LMW-E–expressing 76NE6-EKO cells following treatment with B02 (3μM), rabusertib (70nM), or ceralasertib (125nM) at their respective IC50 concentrations (Fig. 7B, C). Western blot analysis showed increased levels of cleaved PARP, a marker for apoptosis, in B02-treated LMW-E–expressing 76NE6-EKO cells compared with cells without drug treatment and/or LMW-E expression (Fig. 7D).
Figure 7. Low-molecular-weight cyclin E (LMW-E) increased sensitivity to drugs targeting the ATR-CHK1-RAD51 pathway.

A-D. Inducible 76NE6-EKO-LMWE cells were cultured in media containing DMSO (Dox-) or 100ng/mL doxycycline (Dox+, to induce LMW-E expression) for 24 hours, followed by increasing concentrations of RAD51 inhibitor (B02), CHK1 inhibitor (rabusertib), or ATR inhibitor (ceralasertib) which were added to the media containing DMSO or doxycycline. After 96 hours of inhibitor exposure, cells were processed for MTT assay to calculate the half-maximal inhibitory concentration (IC50) for each of the inhibitors (IC50 is the mean value from 3 biological repeats, and 4 technical repeats; A). After 24 hours of inhibitor exposure (total of 48 hours with or without doxycycline-induced LMW-E expression), DNA damage was analyzed by immunofluorescence assay for γ-H2AX foci and 53BP1 foci (scale bar = 10 μm; B), and the ratios of γ-H2AX- and 53BP1-positive cells (foci > 5) were calculated (cell number > 400, mean with standard deviation; C). Protein levels of LMW-E, phospho-CHK1, and cleaved PARP were measured by Western blot analysis in the inducible 76NE6-EKO cell lines treated with Rad51 inhibitor (B02), CHK1 inhibitor (rabusertib), or ATR inhibitor (ceralasertib; D). E-H. MDA-MB-231 cells stably expressing empty-vector of LMW-E were treated with increasing concentrations of RAD51 inhibitor (B02), CHK1 inhibitor (rabusertib), or ATR inhibitor (ceralasertib). After 96 hours of inhibitor exposure, cells were processed for MTT assay to calculate the IC50 for each of the inhibitors (IC50 is the mean value from 3 biological repeats and 4 technical repeats; E). After 48 hours of inhibitor exposure, DNA damage was analyzed by immunofluorescence assay for γ-H2AX foci and 53BP1 foci (scale bar=10 μm; F), and the ratios of γ-H2AX- and 53BP1-positive cells (foci > 5) were calculated (cell number > 400, mean with standard deviation; G). Protein levels of LMW-E, phospho-CHK1 and cleaved PARP were measured by Western blot analysis in the inducible 76NE6-EKO cell lines, treated with RAD51 inhibitor (B02), CHK1 inhibitor (rabusertib), or ATR inhibitor (ceralasertib; H). For all statistical analyses, *p < 0.05, **p < 0.01, ***p < 0.001, and ****p < 0.0001, Student t test.
In uninduced 76NE6-EKO cells, both rabusertib and ceralasertib treatment up-regulated the expression of CDC6, RAD51 and C17orf53, but inhibited chromatin loading of CDC6 and MCMs (Supplementary Fig. 8A, 8B). The effect of rabusertib and ceralasertib remained dominant when LMW-E was induced (24 and 48 hours), leading to reduced chromatin bound CDC6, MCMs as well as LMW-E. When LMW-E was induced (48 hours), the expression of RAD51 were also decreased by rabusertib and ceralasertib. Additionally, western blot analysis showed increased levels of cleaved PARP, a marker for apoptosis, in B02-treated LMW-E–expressing cells compared to cells without drug treatment and/or LMW-E expression (Fig. 7D). These results suggest that ATR-CHK1-RAD51 pathway is required for LMW-E mediated pre-RC assembly and cell survival.
Consistently, LMW-E–overexpressing MDA-MB-231 cells had significantly increased sensitivity to B02 (by 1.5-fold), rabusertib (by 2.4-fold), and ceralasertib (by 2-fold) compared with empty vector controls (Fig. 7E). Enhanced DNA damage signals assessed by γ-H2AX and 53BP1 foci were found in MDA-MB-231 LMW-E–overexpressing cells treated with B02, rabusertib, or ceralasertib, compared with DMSO controls (Fig. 7F, 7G) . Treatment with CHK1 inhibitor showed the most significant change (5-fold increase for both DNA damage makers) in targeting LMW-E–overexpressing MDA-MB-231 cells, (Fig. 7G) and treatment with B02 greatly enhanced the levels of cleaved PARP (Fig. 7H). Collectively, these results suggest LMW-E–expressing hMECs and breast cancer cells are sensitive to drugs targeting the ATR-CHK1-RAD51 pathway, which not only confirms the role of Rad51 as one of the downstream effectors of LMW-E in replication stress tolerance, but also provides potential therapeutic strategies targeted against breast cancer cells with LMW-E overexpression.
Discussion
In the current study, we show that LMW-E predicts genomic instability and tumor recurrence regardless of breast cancer subtypes in patients with early-stage breast cancer and we established a cause-and-effect relationship between LMW-E and genomic instability in hMECs. LMW-E expression results in cell proliferation with damaged DNA, driven by LMW-E–induced replication stress tolerance. Our results suggest that LMW-E but not FL-cycE plays an active role in promoting DNA licensing in a CDC6-dependent manner and DNA damage repair in a RAD51- and C17orf53-dependent manner. Lastly, we show that targeting DNA damage repair by RAD51 inhibitor B02, CHK1 inhibitor rabusertib, and ATR inhibitor ceralasertib can specifically increase DNA damage in LMW-E–expressing hMECs and breast cancer cells, thereby reducing cell viability.
By comparing LMW-E and FL-cycE in an inducible cellular model deficient in endogenous cyclin E, our results provide a better understanding of the distinct roles that FL-cycE and the LMW-E isoforms play in mediating genomic instability in breast cancer models. While both LMW-E and FL-cycE expression can enhance G1/S transition by hyperphosphorylating the Rb protein, FL-cycE expression inhibits DNA replication in S phase, leading to DNA damage lesions with limited damage repair capabilities that ultimately cause cell death. In contrast, DNA replication remains robust in LMW-E–expressing cells, because LMW-E can actively promote replication stress tolerance and damage repair in cells, resulting in cells that can continue to survive with enhanced genomic instability.
Previous studies using HeLa cells had already hinted that the forms of cyclin E that are bound to the chromatin may be the LMW-E forms [38]. In those studies, the authors showed that cyclin E was stabilized at the replication origins under replication stress induced by treatment with mitomycin-C (MMC). The chromatin bound cyclin E exhibited lower molecular weight bands in western blotting [38]. Our findings that LMW-E, but not FL-cycE, is recruited to the chromatin in a CDC6 dependent manner, suggests that LMW-E may be the predominant form of cyclin E that is stabilized under replication stress to facilitate stress tolerance. Furthermore, our results showing that MCM loading to the chromatin is positively regulated by LMW-E, but negatively regulated by Fl-cycE provides mechanistic insight that the discrepancy in the role of cyclin E on MCMs loading to chromatin may be dependent on whether it is FL-cycE or LMW-E [39, 40]. Additional evidence is provided by Geng et al, who knocked out total cyclin E (resulting in lack of expression of both FL-cycE and LMW-E) and these cyclin E deficient cells were incapable of loading MCMs to the chromatin when exiting the G0 phase, however the loading of MCMs in continuously proliferating cells was unaffected [41]. These findings may also be explained by the higher protein stability of LMW-E compared to FL-cycE, as we previously reported [13, 42].
We also found LMW-E plays a dominant role over FL-cycE in facilitating DNA damage repair. RAD51 and C17orf53 were shown to be essential downstream factors in sustaining DNA damage repair under LMW-E induced replication stress. As a result of replication stress, replication fork may slow down or stall, followed by uncoupling of DNA polymerases from the MCMs complex, and the coating of RPAs on exposed ssDNA. Subsequently, ATR-CHK1 DNA damage repair pathway is activated through RPAs phosphorylation and RAD51 recruitment, replacing RPA on ssDNA to facilitate lesion repair by stabilizing or remodeling of the stalled forks[43]. At the replication stress lesions, C17orf53 (a ssDNA/RPA binding proteins required for cell survival under MMC induced replication stress) directly interacts with RPA as a ssDNA-binding protein, promoting the repair of DNA double strand breaks from fork collapse [32]. Our findings that LMW-E upregulates the level of RAD51 and C17orf53, suggest possible co-operation between cell cycle proteins, DNA replication and DNA damage repair pathways[43].
Our results also suggest the ATR-CHK1-RAD51 pathways are important for the survival of LMW-E expressing hMECs and breast cancer cells as the RAD51 inhibitor B02, the ATR inhibitor ceralasertib and the CHK1 inhibitor rabusertib showed significant therapeutic potency in LMW-E expressing cells. Ceralasertib is currently being evaluated in clinical trials in treating lung, gastric, breast and ovarian cancer, osteosarcoma and melanoma, in combination with carboplatin, PARP inhibitor or ani-PD1 durvalumab[44-46]. However, clinical trials using rabusertib plus gemcitabine did not show superior results over gemcitabine alone in patients with pancreatic cancer, possibly due to the lack of biomarker selection in these patients[47]. Our results suggest that LMW-E can be used as a biomarker to stratify the cancer patients who may benefit from treatment with rabusertib and ceralasertib.
In summary, we highlight the unique functions of LMW-E over FL-cycE in promoting replication licensing and DNA damage repair and show that LMW-E expression leads to increased genomic instability and replication stress, which can be exploited therapeutically. We identified RAD51, ATR and CHK1 as potential targets in LMW-E overexpressing breast tumors. Blocking this DNA damage repair pathway could induce cancer cell death through replication catastrophe.
Supplementary Material
Acknowledgements
We thank Erica Goodoff, Senior Scientific Editor in the Research Medical Library at The University of Texas MD Anderson Cancer Center, for editing this article. Funding sources: Research reported in this manuscript was supported by Cancer Prevention Research Institute of Texas - Multi-Investigator Research Award (CPRIT-MIRA # RP180712) to KK and KKH, by the National Cancer Institute (NCI) R01CA223772 to KK, CPRIT Research Training Program grant RP170067 and RP210028 to ML and by the NCI through MD Anderson's Cancer Center Support Grant (P30CA016672).
Footnotes
Competing interests: Kelly K. Hunt declares – Armada Health medical advisory board; research funding to MD Anderson Cancer Center from Cairn Surgical, Eli Lilly & Co., and Lumicell.
Data Availability Statement:
The RNA-seq data have been deposited in the NCBI Sequence Read Archive (accession code PRJNA885484). Resources and reagents used in the current study are available from the corresponding author on reasonable request.
References:
- 1.Siegel RL, Miller KD, Fuchs HE, Jemal A. Cancer statistics, 2022. CA Cancer J Clin 2022; 72: 7–33. [DOI] [PubMed] [Google Scholar]
- 2.Sims AH, Howell A, Howell SJ, Clarke RB. Origins of breast cancer subtypes and therapeutic implications. Nat Clin Pract Oncol 2007; 4: 516–525. [DOI] [PubMed] [Google Scholar]
- 3.Loibl S, Poortmans P, Morrow M, Denkert C, Curigliano G. Breast cancer. Lancet 2021; 397: 1750–1769. [DOI] [PubMed] [Google Scholar]
- 4.Onitilo AA, Engel JM, Greenlee RT, Mukesh BN. Breast cancer subtypes based on ER/PR and Her2 expression: comparison of clinicopathologic features and survival. Clin Med Res 2009; 7: 4–13. [DOI] [PMC free article] [PubMed] [Google Scholar]
- 5.Masoud V, Pages G. Targeted therapies in breast cancer: New challenges to fight against resistance. World J Clin Oncol 2017; 8: 120–134. [DOI] [PMC free article] [PubMed] [Google Scholar]
- 6.Bianchini G, De Angelis C, Licata L, Gianni L. Treatment landscape of triple-negative breast cancer - expanded options, evolving needs. Nat Rev Clin Oncol 2022; 19: 91–113. [DOI] [PubMed] [Google Scholar]
- 7.Chu C, Geng Y, Zhou Y, Sicinski P. Cyclin E in normal physiology and disease states. Trends Cell Biol 2021; 31: 732–746. [DOI] [PMC free article] [PubMed] [Google Scholar]
- 8.Fagundes R, Teixeira LK. Cyclin E/CDK2: DNA Replication, Replication Stress and Genomic Instability. Front Cell Dev Biol 2021; 9: 774845. [DOI] [PMC free article] [PubMed] [Google Scholar]
- 9.Hills SA, Diffley JF. DNA replication and oncogene-induced replicative stress. Curr Biol 2014; 24: R435–444. [DOI] [PubMed] [Google Scholar]
- 10.Teixeira LK, Wang X, Li Y, Ekholm-Reed S, Wu X, Wang P et al. Cyclin E deregulation promotes loss of specific genomic regions. Curr Biol 2015; 25: 1327–1333. [DOI] [PMC free article] [PubMed] [Google Scholar]
- 11.Jones RM, Mortusewicz O, Afzal I, Lorvellec M, Garcia P, Helleday T et al. Increased replication initiation and conflicts with transcription underlie Cyclin E-induced replication stress. Oncogene 2013; 32: 3744–3753. [DOI] [PubMed] [Google Scholar]
- 12.Fragkos M, Ganier O, Coulombe P, Mechali M. DNA replication origin activation in space and time. Nat Rev Mol Cell Biol 2015; 16: 360–374. [DOI] [PubMed] [Google Scholar]
- 13.Caruso JA, Duong MT, Carey JPW, Hunt KK, Keyomarsi K. Low-Molecular-Weight Cyclin E in Human Cancer: Cellular Consequences and Opportunities for Targeted Therapies. Cancer Res 2018; 78: 5481–5491. [DOI] [PMC free article] [PubMed] [Google Scholar]
- 14.Akli S, Van Pelt CS, Bui T, Multani AS, Chang S, Johnson D et al. Overexpression of the low molecular weight cyclin E in transgenic mice induces metastatic mammary carcinomas through the disruption of the ARF-p53 pathway. Cancer Res 2007; 67: 7212–7222. [DOI] [PubMed] [Google Scholar]
- 15.Keyomarsi K, Tucker SL, Buchholz TA, Callister M, Ding Y, Hortobagyi GN et al. Cyclin E and survival in patients with breast cancer. N Engl J Med 2002; 347: 1566–1575. [DOI] [PubMed] [Google Scholar]
- 16.Duong MT, Akli S, Wei C, Wingate HF, Liu W, Lu Y et al. LMW-E/CDK2 deregulates acinar morphogenesis, induces tumorigenesis, and associates with the activated b-Raf-ERK1/2-mTOR pathway in breast cancer patients. PLoS Genet 2012; 8: e1002538. [DOI] [PMC free article] [PubMed] [Google Scholar]
- 17.Akli S, Zheng PJ, Multani AS, Wingate HF, Pathak S, Zhang N et al. Tumor-specific low molecular weight forms of cyclin E induce genomic instability and resistance to p21, p27, and antiestrogens in breast cancer. Cancer Res 2004; 64: 3198–3208. [DOI] [PubMed] [Google Scholar]
- 18.Band V, Sager R. Distinctive traits of normal and tumor-derived human mammary epithelial cells expressed in a medium that supports long-term growth of both cell types. Proc Natl Acad Sci U S A 1989; 86: 1249–1253. [DOI] [PMC free article] [PubMed] [Google Scholar]
- 19.Caruso JA, Hunt KK, Keyomarsi K. The neutrophil elastase inhibitor elafin triggers rb-mediated growth arrest and caspase-dependent apoptosis in breast cancer. Cancer Res 2010; 70: 7125–7136. [DOI] [PMC free article] [PubMed] [Google Scholar]
- 20.Kettner NM, Vijayaraghavan S, Durak MG, Bui T, Kohansal M, Ha MJ et al. Combined inhibition of STAT3 and DNA repair in palbociclib-resistant ER-positive breast cancer. Clin Cancer Res 2019. [DOI] [PMC free article] [PubMed] [Google Scholar]
- 21.Chen X, Low KH, Alexander A, Jiang Y, Karakas C, Hess KR et al. Cyclin E Overexpression Sensitizes Triple-Negative Breast Cancer to Wee1 Kinase Inhibition. Clin Cancer Res 2018; 24: 6594–6610. [DOI] [PMC free article] [PubMed] [Google Scholar]
- 22.Carey JPW, Karakas C, Bui T, Chen X, Vijayaraghavan S, Zhao Y et al. Synthetic Lethality of PARP Inhibitors in Combination with MYC Blockade Is Independent of BRCA Status in Triple-Negative Breast Cancer. Cancer Res 2018; 78: 742–757. [DOI] [PMC free article] [PubMed] [Google Scholar]
- 23.Vijayaraghavan S, Karakas C, Doostan I, Chen X, Bui T, Yi M et al. CDK4/6 and autophagy inhibitors synergistically induce senescence in Rb positive cytoplasmic cyclin E negative cancers. Nat Commun 2017; 8: 15916. [DOI] [PMC free article] [PubMed] [Google Scholar]
- 24.Nanos-Webb A, Jabbour NA, Multani AS, Wingate H, Oumata N, Galons H et al. Targeting low molecular weight cyclin E (LMW-E) in breast cancer. Breast Cancer Res Treat 2012; 132: 575–588. [DOI] [PMC free article] [PubMed] [Google Scholar]
- 25.Jabbour-Leung NA, Chen X, Bui T, Jiang Y, Yang D, Vijayaraghavan S et al. Sequential Combination Therapy of CDK Inhibition and Doxorubicin Is Synthetically Lethal in p53-Mutant Triple-Negative Breast Cancer. Mol Cancer Ther 2016; 15: 593–607. [DOI] [PMC free article] [PubMed] [Google Scholar]
- 26.Thompson PA, Brewster AM, Kim-Anh D, Baladandayuthapani V, Broom BM, Edgerton ME et al. Selective genomic copy number imbalances and probability of recurrence in early-stage breast cancer. PLoS One 2011; 6: e23543. [DOI] [PMC free article] [PubMed] [Google Scholar]
- 27.Hunt KK, Karakas C, Ha MJ, Biernacka A, Yi M, Sahin AA et al. Cytoplasmic Cyclin E Predicts Recurrence in Patients with Breast Cancer. Clin Cancer Res 2017; 23: 2991–3002. [DOI] [PMC free article] [PubMed] [Google Scholar]
- 28.Van Loo P, Nordgard SH, Lingjaerde OC, Russnes HG, Rye IH, Sun W et al. Allele-specific copy number analysis of tumors. Proc Natl Acad Sci U S A 2010; 107: 16910–16915. [DOI] [PMC free article] [PubMed] [Google Scholar]
- 29.Bonnet F, Guedj M, Jones N, Sfar S, Brouste V, Elarouci N et al. An array CGH based genomic instability index (G2I) is predictive of clinical outcome in breast cancer and reveals a subset of tumors without lymph node involvement but with poor prognosis. BMC Med Genomics 2012; 5: 54. [DOI] [PMC free article] [PubMed] [Google Scholar]
- 30.Hudis CA, Barlow WE, Costantino JP, Gray RJ, Pritchard KI, Chapman JA et al. Proposal for standardized definitions for efficacy end points in adjuvant breast cancer trials: the STEEP system. J Clin Oncol 2007; 25: 2127–2132. [DOI] [PubMed] [Google Scholar]
- 31.Toledo L, Neelsen KJ, Lukas J. Replication Catastrophe: When a Checkpoint Fails because of Exhaustion. Mol Cell 2017; 66: 735–749. [DOI] [PubMed] [Google Scholar]
- 32.Wang C, Chen Z, Su D, Tang M, Nie L, Zhang H et al. C17orf53 is identified as a novel gene involved in inter-strand crosslink repair. DNA Repair (Amst) 2020; 95: 102946. [DOI] [PMC free article] [PubMed] [Google Scholar]
- 33.Petermann E, Orta ML, Issaeva N, Schultz N, Helleday T. Hydroxyurea-stalled replication forks become progressively inactivated and require two different RAD51-mediated pathways for restart and repair. Mol Cell 2010; 37: 492–502. [DOI] [PMC free article] [PubMed] [Google Scholar]
- 34.Ge XQ, Jackson DA, Blow JJ. Dormant origins licensed by excess Mcm2–7 are required for human cells to survive replicative stress. Genes Dev 2007; 21: 3331–3341. [DOI] [PMC free article] [PubMed] [Google Scholar]
- 35.Petropoulos M, Champeris Tsaniras S, Taraviras S, Lygerou Z. Replication Licensing Aberrations, Replication Stress, and Genomic Instability. Trends Biochem Sci 2019; 44: 752–764. [DOI] [PubMed] [Google Scholar]
- 36.Zellweger R, Dalcher D, Mutreja K, Berti M, Schmid JA, Herrador R et al. Rad51-mediated replication fork reversal is a global response to genotoxic treatments in human cells. J Cell Biol 2015; 208: 563–579. [DOI] [PMC free article] [PubMed] [Google Scholar]
- 37.Mao Z, Jiang Y, Liu X, Seluanov A, Gorbunova V. DNA repair by homologous recombination, but not by nonhomologous end joining, is elevated in breast cancer cells. Neoplasia 2009; 11: 683–691. [DOI] [PMC free article] [PubMed] [Google Scholar]
- 38.Lu X, Liu J, Legerski RJ. Cyclin E is stabilized in response to replication fork barriers leading to prolonged S phase arrest. J Biol Chem 2009; 284: 35325–35337. [DOI] [PMC free article] [PubMed] [Google Scholar]
- 39.Geng Y, Lee YM, Welcker M, Swanger J, Zagozdzon A, Winer JD et al. Kinase-independent function of cyclin E. Mol Cell 2007; 25: 127–139. [DOI] [PubMed] [Google Scholar]
- 40.Ekholm-Reed S, Mendez J, Tedesco D, Zetterberg A, Stillman B, Reed SI. Deregulation of cyclin E in human cells interferes with prereplication complex assembly. J Cell Biol 2004; 165: 789–800. [DOI] [PMC free article] [PubMed] [Google Scholar]
- 41.Geng Y, Yu Q, Sicinska E, Das M, Schneider JE, Bhattacharya S et al. Cyclin E ablation in the mouse. Cell 2003; 114: 431–443. [DOI] [PubMed] [Google Scholar]
- 42.Delk NA, Hunt KK, Keyomarsi K. Altered subcellular localization of tumor-specific cyclin E isoforms affects cyclin-dependent kinase 2 complex formation and proteasomal regulation. Cancer Res 2009; 69: 2817–2825. [DOI] [PMC free article] [PubMed] [Google Scholar]
- 43.Saldivar JC, Cortez D, Cimprich KA. The essential kinase ATR: ensuring faithful duplication of a challenging genome. Nat Rev Mol Cell Biol 2017; 18: 622–636. [DOI] [PMC free article] [PubMed] [Google Scholar]
- 44.Kim ST, Smith SA, Mortimer P, Loembe AB, Cho H, Kim KM et al. Phase I Study of Ceralasertib (AZD6738), a Novel DNA Damage Repair Agent, in Combination with Weekly Paclitaxel in Refractory Cancer. Clin Cancer Res 2021; 27: 4700–4709. [DOI] [PMC free article] [PubMed] [Google Scholar]
- 45.Kim R, Kwon M, An M, Kim ST, Smith SA, Loembe AB et al. Phase II study of ceralasertib (AZD6738) in combination with durvalumab in patients with advanced/metastatic melanoma who have failed prior anti-PD-1 therapy. Ann Oncol 2022; 33: 193–203. [DOI] [PubMed] [Google Scholar]
- 46.Yap TA, Krebs MG, Postel-Vinay S, El-Khouiery A, Soria JC, Lopez J et al. Ceralasertib (AZD6738), an Oral ATR Kinase Inhibitor, in Combination with Carboplatin in Patients with Advanced Solid Tumors: A Phase I Study. Clin Cancer Res 2021. [DOI] [PMC free article] [PubMed] [Google Scholar]
- 47.Gorecki L, Andrs M, Korabecny J. Clinical Candidates Targeting the ATR-CHK1-WEE1 Axis in Cancer. Cancers (Basel) 2021; 13. [DOI] [PMC free article] [PubMed] [Google Scholar]
Associated Data
This section collects any data citations, data availability statements, or supplementary materials included in this article.
Supplementary Materials
Data Availability Statement
The RNA-seq data have been deposited in the NCBI Sequence Read Archive (accession code PRJNA885484). Resources and reagents used in the current study are available from the corresponding author on reasonable request.