

Abstract
Chronic beryllium disease (CBD) is a Th1 granulomatous lung disease preceded by sensitization to beryllium (BeS). We profiled the methylome, transcriptome, and selected proteins in the lung to identify molecular signatures and networks associated with BeS and CBD. BAL cell DNA and RNA were profiled using microarrays from CBD (n = 30), BeS (n = 30), and control subjects (n = 12). BAL fluid proteins were measured using Olink Immune Response Panel proteins from CBD (n = 22) and BeS (n = 22) subjects. Linear models identified features associated with CBD, adjusting for covariation and batch effects. Multiomic integration methods identified correlated features between datasets. We identified 1,546 differentially expressed genes in CBD versus control subjects and 204 in CBD versus BeS. Of the 101 shared transcripts, 24 have significant cis relationships between gene expression and DNA methylation, assessed using expression quantitative trait methylation analysis, including genes not previously identified in CBD. A multiomic model of top DNA methylation and gene expression features demonstrated that the first component separated CBD from other samples and the second component separated control subjects from remaining samples. The top features on component one were enriched for T-lymphocyte function, and the top features on component two were enriched for innate immune signaling. We identified six differentially abundant proteins in CBD versus BeS, with two (SIT1 and SH2D1A) selected as important RNA features in the multiomic model. Our integrated analysis of DNA methylation, gene expression, and proteins in the lung identified multiomic signatures of CBD that differentiated it from BeS and control subjects.
Keywords: DNA methylation, gene expression, protein profiling, multiomics
Beryllium (Be) is a commonly used material in defense, nuclear weapons, and other industries resulting in exposure for up to a million workers, although the exact number is not known (1, 2). Chronic beryllium disease (CBD) is a rare granulomatous lung disorder caused by beryllium exposure in the workplace. Depending on exposure, CBD can occur in up to 20% of exposed workers (1). The disease is characterized by granulomatous inflammation in the lung with the accumulation of Be-specific CD4+ T cells and pathogenic macrophages. Severe CBD can result in impaired quality of life, end-stage fibrotic lung disease, and death, especially in those with higher Be exposure.
The precursor to CBD is beryllium sensitization (BeS), a cell-mediated immune response in peripheral blood that progresses to CBD at a rate of 6–8% per year. The mechanisms by which BeS develops and progresses to CBD are incompletely understood. Both BeS and CBD are associated with genetic variants, Glu69-containing HLA-DPB1, as well as HLA-DRB1 alleles with an analogous glutamic acid residue that complexes with Be to present self-peptides to pathogenic CD4+ T cells and results in an exuberant Th1 immune response in CBD (3). These HLA variants do not fully explain the onset of BeS or progression from BeS to CBD. DPB1 Glu69 is found in up to 40% of Be workers without BeS or CBD (4, 5). In addition, the frequency of this variant does not differ between BeS and CBD. Thus, other yet unidentified factors and mechanisms are potentially involved in the onset of BeS and the progression of BeS to CBD.
Currently, the Be lymphocyte proliferation test (BeLPT) is the standard assay for the detection of BeS in the workplace. To reduce disease, the U.S. Occupational Safety and Health Administration has recently revised the Be standard in the workplace to reduce exposure and require monitoring with the BeLPT or other tests in workplaces. However, the BeLPT has limitations, including a need for in vitro culture that introduces technical variability, exposure to radiation for individuals performing BeLPT, and delayed results because of 4–6 days of culture. In addition, BeLPT is performed only at a few certified laboratories in the United States and is not easily accessible in many other countries. Importantly, the BeLPT is incapable of distinguishing between BeS and CBD. CBD is diagnosed on the basis of the presence of a Be-specific immune response in blood or lung cells as indicated by an abnormal BeLPT and the presence of granulomatous inflammation and/or mononuclear cell infiltration on lung biopsy (6), requiring an invasive procedure.
As compartment-specific changes occur in CBD, investigators have primarily focused on molecular alterations in the lung. Because of limited access to lung tissue and the patchy nature of granulomatous involvement, BAL cells and BAL fluid (BALF), the most proximate samples to the site of injury, are ideal biological specimens to examine changes in the lung. Furthermore, BAL predominantly contains T cells and macrophages, the primary cell types involved in CBD inflammation reflecting the innate and adaptive immune response, whereas lung tissue studies involve nonleukocytic cells such as epithelium and endothelium. In this study, we aimed to identify molecular signatures of BeS and CBD by integrating BAL cell DNA methylation and gene expression and BALF protein abundances. We used DIABLO (Data Integration Analysis for Biomarker discovery using Latent cOmponents), which we recently applied to lung tissue from idiopathic pulmonary fibrosis to perform integrative multiomic analysis (7). We hypothesized that DNA methylation, gene expression, and protein signatures differing between BeS and CBD would define important cellular mechanisms in the Be immune response and progression from BeS and CBD and could be potential biomarkers.
Methods
Study Population
Study subjects were recruited at National Jewish Health using standard case criteria under an approved Institutional Review Board protocol to collect leftover cells from clinical or research bronchoscopy (HS-2466). BeS was established on the basis of abnormal blood and/or BAL BeLPT and the absence of granulomatous inflammation on biopsy. CBD diagnosis required the presence of granulomatous inflammation on lung biopsy (6). BAL cells from healthy control subjects were obtained as described previously (8). Briefly, deidentified donor lungs not suitable for transplant were obtained through the NDRI (National Disease Research Interchange) and the IIAM (International Institute for the Advancement of Medicine). Demographic data were obtained on all subjects and from the NDRI and IIAM for control subjects. Cases and control subjects were frequency matched by age, sex, and race. The case clinical data were extracted from medical records (see data supplement).
Sample Preparation
BAL was conducted using well-established protocols (9) and described in the data supplement. Cells were stored in RLT buffer at −80°C, and genomic DNA and RNA were extracted using Qiagen AllPrep DNA/RNA extraction mini kit. BALF was stored in 3.5 ml aliquots at −80°C.
Gene Expression, DNA Methylation, and Protein Profiling and Analysis
Gene expression was measured using Agilent G3 SurePrint (v3) microarrays (10, 11). Linear models were fit testing for the effect of diagnosis and adjusting for age, sex, and smoking status using limma (10). DNA methylation was assayed using Illumina Infinium HumanMethylationEPIC BeadChips. Linear mixed models were used, adjusting for age, sex, smoking, six ReFACTor (Reference-Free Adjustment for Cell-Type composition) components, one EPISTRUCTURE component, and a covariance matrix as a random effect using GLINT (11–13). BALF proteins were profiled on the Olink Immune Response Panel (14) and tested using linear models adjusting for age, sex, smoking, and total protein. P values from analyses were adjusted for a false discovery rate (FDR) of 5% using the Benjamini-Hochberg method (15). To confirm results, the top targets were evaluated using qRT-PCR in BAL cells stimulated with Be. Additional details are available in the data supplement.
Expression Quantitative Trait Methylation (eQTM) Analysis
An eQTM model was implemented using Matrix eQTL (Matrix expression quantitative trait loci), testing for the effect of methylation on gene expression while adjusting for diagnosis, age, sex, smoking, and five surrogate variables to adjust for effects of uncaptured variation and cell proportions (16). We tested for associations between differentially expressed genes in CBD versus control subjects using all CpG probes within 1 Mb of gene boundaries (14).
DIABLO
Methylation M values and normalized gene expression values were used as input for a DIABLO (17) multiomics model in the mixOmics R package (18). This integrative model extends sparse multiple canonical correlations to find a subset of omic features correlated with one another and the phenotype of interest. Gene expression values were normalized using limma (19, 20). A total of 100 features from each dataset for two model components were selected using L1 regularization.
Analyses of Differential Features
Enrichr (21) was used for enrichment analyses, and IPA (Ingenuity Pathway Analysis) (22) was used for canonical pathway analyses. We used the STRING (Search Tool for the Retrieval of Interacting Genes/Proteins) interactome (23) (v11.5) to build a protein–protein interaction network from eQTM genes that were also differentially expressed in CBD versus BeS. Genes were seeded using a medium (0.4) confidence score threshold, and a zero-order network was constructed. STRING confidence scores for relevant interactions from a variety of evidence sources are available in Table E1 in the data supplement.
Results
Demographics of Cases and Control Subjects
The demographics of the control subjects, individuals with BeS, and individuals with CBD are shown in Table 1. No significant differences were observed in age, sex, or race between groups or in forced expiratory volume in 1 second, forced vital capacity, TLC, and DlCO between cases. The majority of BeS and CBD subjects were male (80%) and White, typical of Be industries.
Table 1.
Demographic Characteristics of Cases and Control Subjects and Bronchoalveolar Lavage and Clinical Characteristics of Cases
| Control (n = 12) | CBD (n = 30) | BeS (n = 30) | |
|---|---|---|---|
| Age (yr), median (range) | 58 (24–69) | 56 (41–79) | 56 (38–72) |
| Sex | |||
| Male | 8 | 24 | 22 |
| Female | 4 | 6 | 8 |
| Race | |||
| White | 12 | 30 | 29 |
| Black | 0 | 0 | 1 |
| Other | 0 | 0 | 0 |
| Smoking status | |||
| CS | 0 | 0 | 0 |
| FS | 2 | 8 | 14 |
| NS | 10 | 22 | 16 |
| HLA-DP typing (Glu69+ %) | NA | 90.0 | 86.2 |
| FEV1 (L), mean ± SD | NA | 3.0 ± 0.8 | 3.1 ± 0.7 |
| FEV1% predicted, mean ± SD | NA | 87.4 ± 17.4 | 90.9 ± 14.2 |
| FVC (L), mean ± SD | NA | 4.0 ± 1.0 | 4.0 ± 0.9 |
| FVC% predicted, mean ± SD | NA | 86.5 ± 15.5 | 91.4 ± 11.3 |
| TLC (L), mean ± SD | NA | 6.7 ± 1.3 | 6.9 ± 1.2 |
| TLC% predicted, mean ± SD | NA | 105.5 ± 14.3 | 110.7 ± 12.9 |
| DlCO, mean ± SD | NA | 27.2 ± 9.8 | 25.4 ± 5.4 |
| DlCO% predicted, mean ± SD | NA | 81.8 ± 25.1 | 79.8 ± 12.2 |
| BAL cell WBC count (×106), mean ± SD | NA | 39.8 ± 21.3 | 27.4 ± 12.7** |
| BAL cell lymphocytes (%), mean ± SD | NA | 21.6 ± 16.6 | 7.1 ± 3.7*** |
| BAL cell macrophages (%), mean ± SD | NA | 77.2 ± 16.9 | 91.9 ± 4.1**** |
Definition of abbreviations: BeS = sensitization to berrylium; CBD = chronic beryllium disease; CS = current smoker; FEV1 = forced expiratory volume in 1 second; FS = former smoker; FVC = forced vital capacity; HLA-DP = major histocompatibility complex, Class II, DP; NS = never smoker; TLC = the total volume of air in the lungs after a maximal inspiration.
P < 0.01, ***P < 0.001, and ****P < 0.0001.
BAL Characteristics of CBD and BeS Cases
There was no difference in the BAL recovery between BeS and CBD cases (data not shown). CBD subjects had a significantly higher number of BAL lymphocytes (P = 9.42 × 10⁻⁴), protein (P = 0.00455), and albumin concentration (P = 0.0224) compared with BeS (Figure E1). CBD subjects also had significantly increased BAL white blood cells and decreased macrophage percentage (Table 1). Albumin constituted approximately 95% of BALF protein content. The most likely source of the additional total protein and albumin are lymphocytes; however, protein leak into the alveolar compartment cannot be ruled out.
Transcriptional Changes in BAL Cells Are Associated with Disease Phenotype
Comparing CBD to control subjects, we identified 1,546 differentially expressed genes (DEGs) after adjustment for age, sex, and smoking (FDR-adjusted P < 0.05) (Table E2A). We identified 204 DEGs in CBD versus BeS (FDR-adjusted P < 0.05) (Table E2B), with 101 transcripts shared with the CBD versus control analysis. We identified 1,445 DEGs in BeS compared with control subjects. Of these, 986 are shared between the 2 comparisons (Figure E2). We observe a very strong correlation of effect sizes (log2 fold change) in these 986 genes between the 2 models (r2 = 0.958). We also observe a strong correlation of effect sizes of genes significant only in the BeS–control comparison (r2 = 0.933) and a weaker correlation in genes significant only in the CBD–control comparison (r2 = 0.750). Canonical pathway analysis in Ingenuity demonstrated extensive sharing of pathways in CBD versus BeS and CBD versus control comparisons (Figure 1). CBD was characterized by activation of T-cell receptor signaling, Th1 pathway, iCOS (inducible T-cell costimulator) signaling in T helper cells, natural killer cell signaling, crosstalk between dendritic cells and natural killer cells, and repression of PD-1 signaling. Because we only have lymphocyte counts for CBD and BeS, we were unable to assess the impact of cell proportions on the signal in the CBD versus control comparison. The model for CBD versus BeS, including percent lymphocytes as a covariate, resulted in no significant DEGs at FDR-adjusted P < 0.05 (Figure E3). This suggests that the changes we observed were largely driven by increased lymphocyte counts in CBD.
Figure 1.

Canonical pathways are shared by significant gene expression changes in CBD versus BeS (column A), CBD versus control subjects (column B), and BeS versus control subjects (column C). Orange denotes activation, and blue denotes repression. BeS = sensitization to beryllium; CBD = chronic beryllium disease.
DNA Methylation Signatures of CBD
We used the GLINT (11) package for association and EPISTRUCTURE (12) and ReFACTor (24) to account for genetic ancestry and inferred variation likely driven by cell type proportions, respectively. We chose ReFACTor in a data-driven fashion because this could be applied to both CBD versus control and CBD versus BeS comparisons. As demonstrated in the quantile–quantile plot in Figure E4, we achieved excellent control of inflation using this methodology. This analysis identified 17 CpGs significantly associated with CBD compared with control subjects (FDR-adjusted P < 0.05), including CpGs mapping to the cytokine TNF and C2 complement genes (Table E3). No significant CpGs were identified in the CBD versus BeS comparison.
Integration of Gene Expression and DNA Methylation
We next performed two complementary analyses to integrate DNA methylation and expression data: eQTM analysis (25) and DIABLO (17). For the eQTM analysis, we started with 1,546 genes that were differentially expressed in the CBD versus control comparison and searched for significantly associated cis CpG sites (within 1Mb of the gene). Of the 1,546 genes, we identified 155 with at least one significant eQTM (496 CpGs in total) (Table E4) with minimal inflation (λ = 1.11) (Figure E5A), suggestive of appropriate control for covariation in the statistical model. A total of 24 of these genes are also differentially expressed in CBD versus BeS. Of the 24 genes differentially expressed in both CBD versus control and CBD versus BeS, 8 genes have 5 or more CpGs that are eQTMs: CCL5 (13 CpGs), IFITM1 (20 CpGs), IKZF3 (8 CpGs), IL2RB (6 CpGs), IL32 (12 CpGs), LCK (5 CpGs), SPOCK2 (26 CpGs), and TNFRSF25 (5 CpGs). Example correlations of methylation and expression for SPOCK2 (increased methylation and decreased expression) and IFITM1 (decreased methylation and increased expression) are shown in Figure E5B.
DIABLO is a multiomics integrative method that seeks to identify common information across different data types through the selection of a subset of molecular features while discriminating between multiple phenotypic groups (17). DIABLO leverages L1 regularization, similar to LASSO (least absolute shrinkage and selection operator) regression. For feature selection, we selected the top 100 features in each dataset for two model components (Table E5). A multiomic model with these top 100 features showed that component one separated CBD from BeS and control subjects, and component two separated control subjects from CBD and BeS (Figure 2A). Enrichment analysis of the top 100 features associated with component one for Bioplanet pathways demonstrates enrichment for IL-2 signaling, IL-12–mediated signaling, T-cell receptor signaling, and PD-1 signaling, among others, as well as multiple GO (Gene Ontology) Biological Processes associated with T-lymphocyte function (Figure E6A).
Figure 2.

DIABLO (Data Integration Analysis for Biomarker discovery using Latent cOmponents) multiomic model. (A) Sample loadings on DIABLO loading components on the basis of gene expression and DNA methylation. Values represent overall sample loadings aggregating all features informing each model component. (B and C) Gene expression and DNA methylation features most significantly associated with (B) component one and (C) component two. Values represent feature weights on the component of interest. Orange denotes increased expression and/or methylation in CBD, blue in BeS, and gray in control subjects.
Among the top 10 features associated with component one (Figure 2B) are markers of T (IKZF3, LCK, CXCR6, GZMA, and IIL2RB) and B-cell (BCL11B) function. Enrichment analysis of the top 100 features associated with component two for Bioplanet pathways demonstrates enrichment for IL-4 regulation of apoptosis, innate immune signaling, and IL-1 regulation of extracellular matrix, among others, as well as GO Biological Processes associated with innate immunity (Figure E6B). Among the top 10 features associated with component two (Figure 2C) are genes associated with macrophage function, such as STAB1, a marker of alternatively activated macrophages that mediates tissue homeostasis and prevents fibrosis in chronic liver injury (26), and UNC5B, a netrin receptor, which stimulates lung fibrosis through its neuronal guidance functions (27). Other genes include antimicrobial genes (ADM and HAMP), as well as the antiinflammatory cytokine IL-10 that also plays a role in modulating the Be immune response and fibrosis. The DIABLO modeling allowed us to prioritize DNA methylation and transcript features that separate disease groups and appear to have high functional relevance to disease biology. We also observed an overlap of eQTM and DIABLO results, with 23 of the 100 transcripts associated with DIABLO component one also identified by eQTM analysis and, similarly, 37 of the 100 transcripts associated with component two identified by eQTM analysis.
Immune Response Proteins Linked to CBD
We examined BALF proteins in 22 CBD and 22 BeS subjects. Olink Immune Response panel offers an analysis of 92 protein biomarkers without crossreactivity (28). Among the 92 proteins, 70 proteins were detected in 25% or more of the samples and included in our analysis. Using models adjusting for age, sex, smoking, and total protein, six differentially abundant proteins were found with FDR-adjusted P < 0.05. SIT1 (signaling threshold regulating transmembrane adaptor 1) and SH2D1A (SH2 domain-containing protein 1A) were significantly increased in CBD, whereas MILR1, TREM1, LY75, and CD83 were decreased compared with BeS (Figure 3 and Table E6). These results complement our DIABLO model, as SIT1 and SH2D1A were selected as features from our RNA dataset to distinguish individuals with CBD from BeS and were directionally consistent with protein results.
Figure 3.
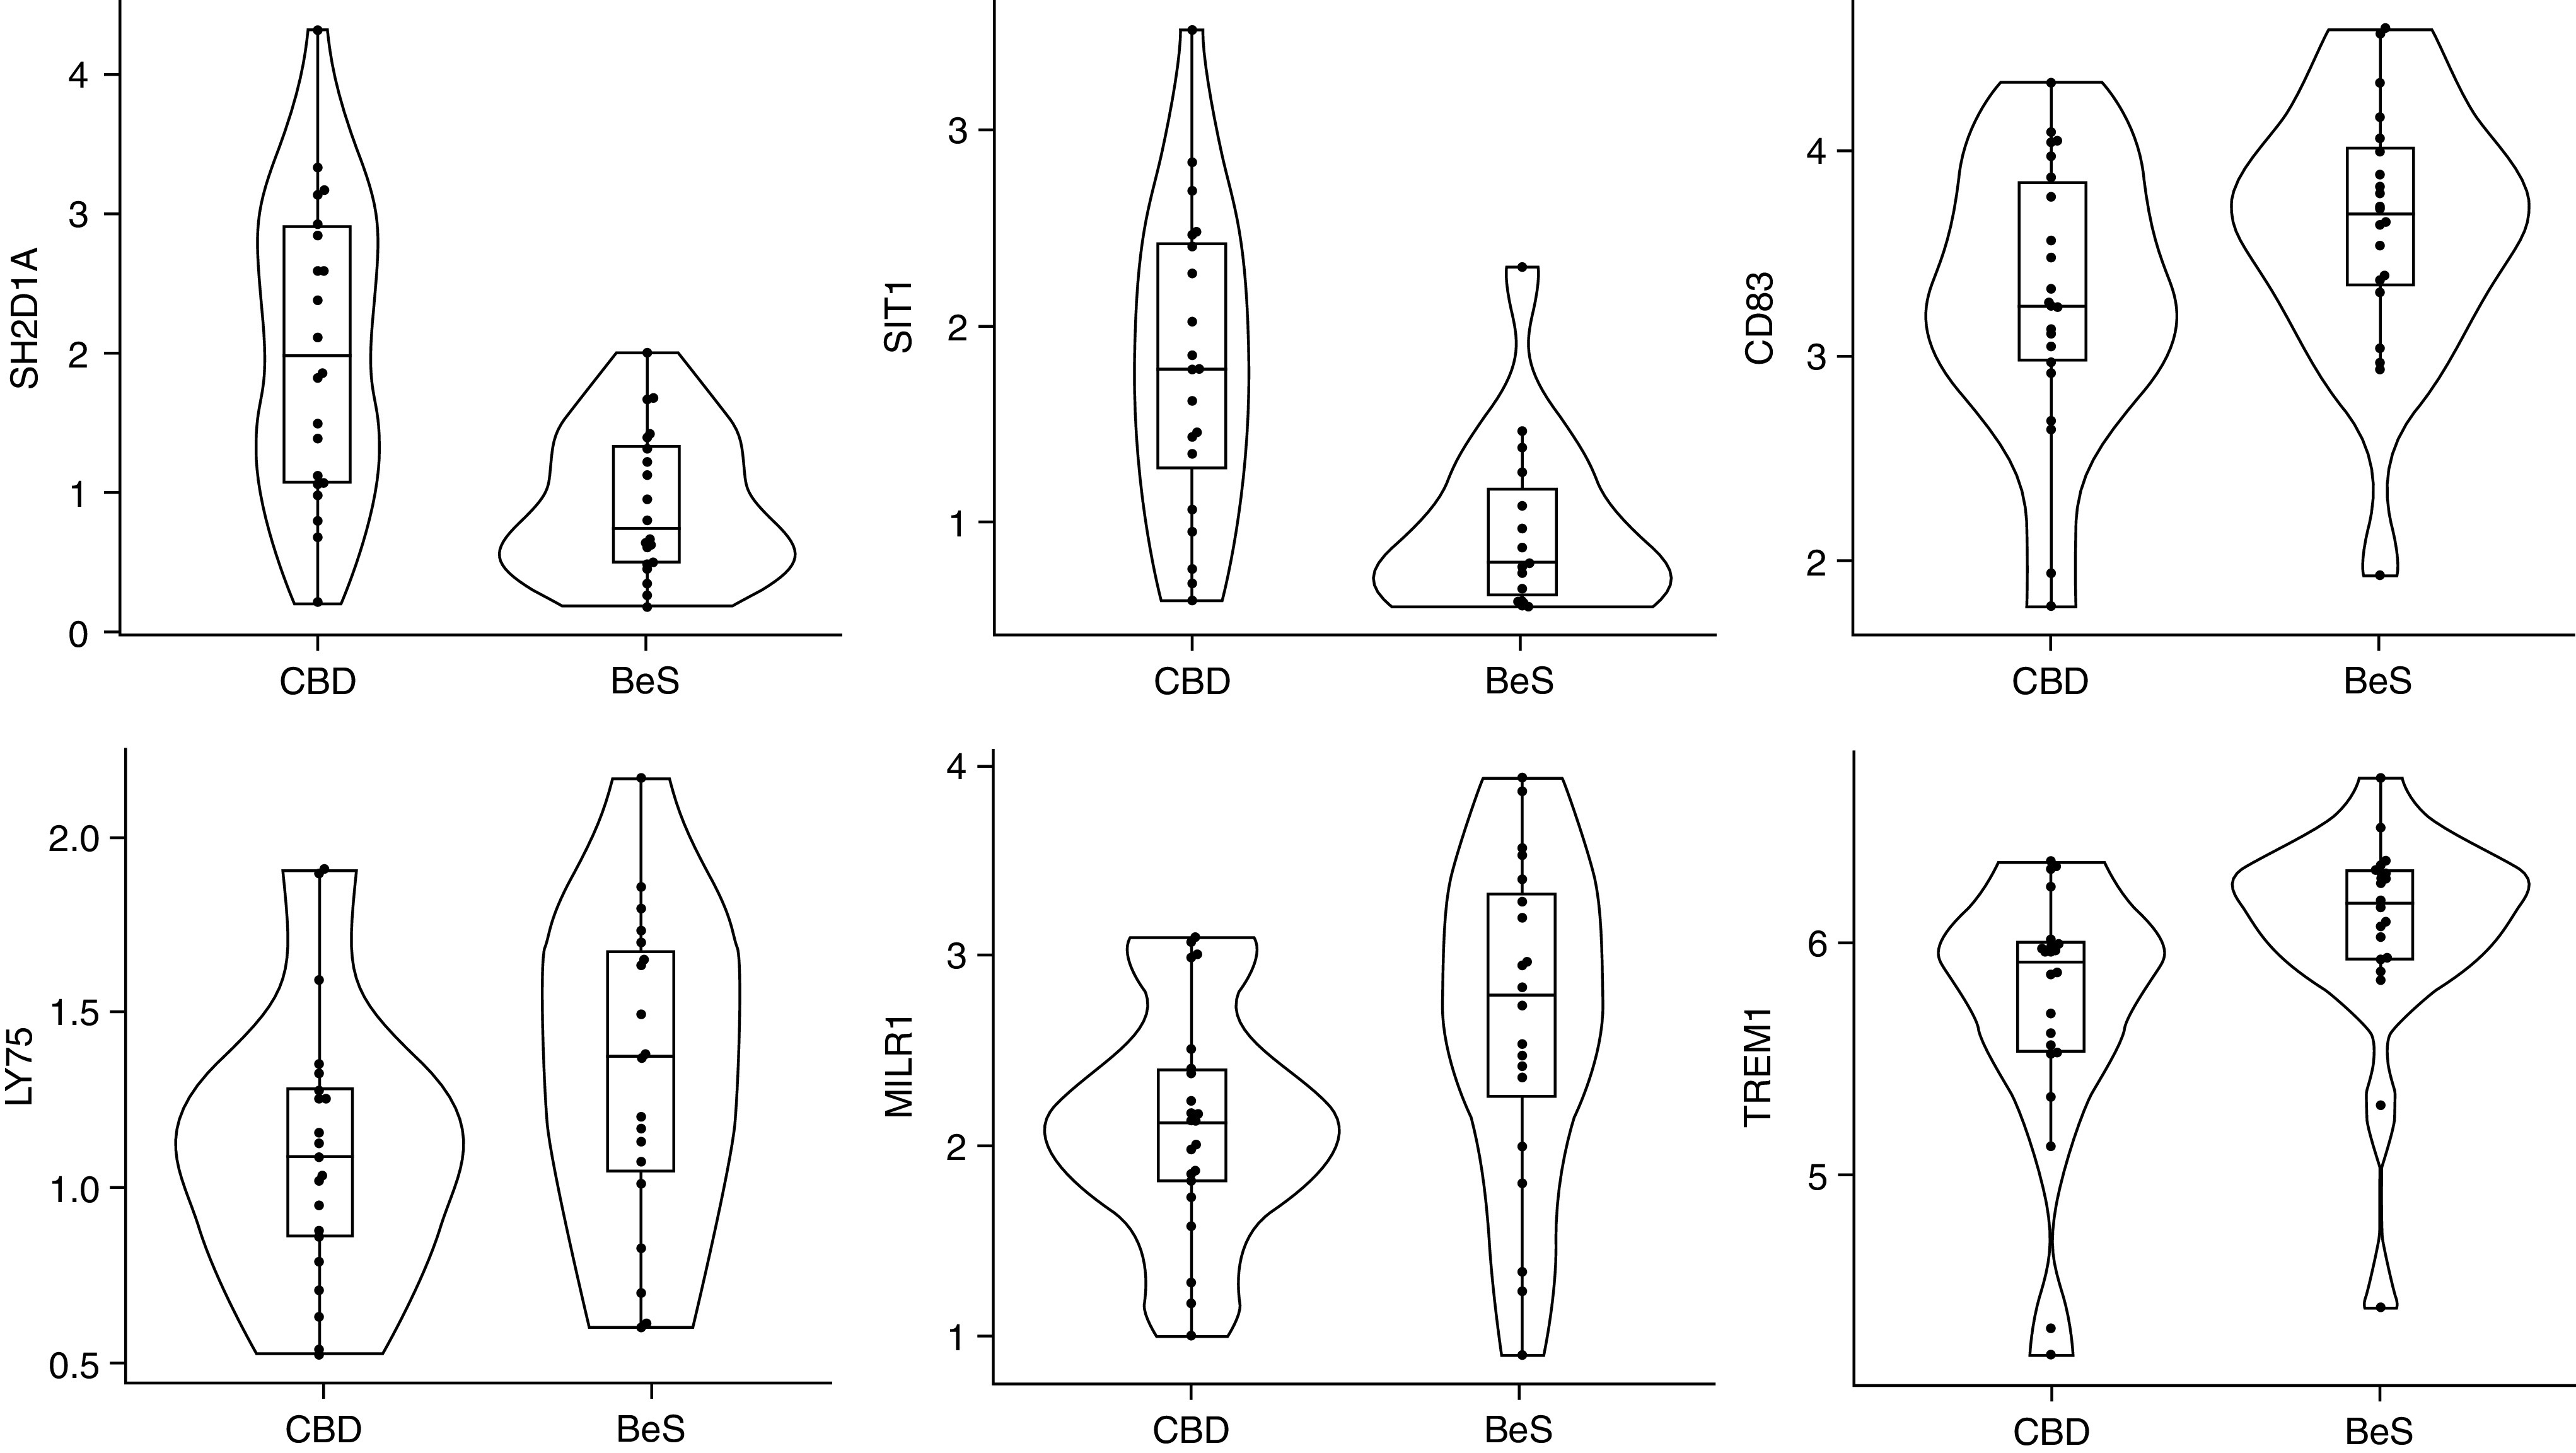
BALF protein concentrations were detected using Olink Immune Response Panel proteins proximity extension assay immune response panel. Six BALF proteins with statistically significant differences in abundance (false discovery rate-adjusted P < 0.05) in CBD compared with BeS. FDR adjusted P values: SH2D1A: 0.003; SIT1: 0.002; CD83: 0.027; LY75: 0.020; MILR1: 0.002; and TREM1: 0.004. BALF = BAL fluid; FDR = false discovery rate.
Pathways Identified by Integration of DNA Methylation, Gene Expression, and Protein Profiling
We used the STRING interactome database (23) to overlay the results of our DNA methylation, gene expression, and protein profiling data on protein–protein interactome data and identify a network of interacting molecules that may be important in disease pathogenesis for CBD compared with BeS (Table E1). eQTM genes that were also differentially expressed in CBD versus BeS were used to generate a zero-order protein–protein interactome (Figure 4). The network consisted of 19 genes that were all upregulated at the degree of RNA in CBD compared with BeS and control subjects. Genes in the network are involved in processes such as T-cell receptor signaling (CD8A, CD8B, LCK, and RASGRP1) and cytokine–cytokine receptor interactions (CCL5, CXCR3, CXCR6, IL2RB, IL32, and TNFRSF25).
Figure 4.

Zero-order protein–protein interaction network analysis of expression quantitative trait methylation genes differentially expressed in CBD versus BeS. All nodes represent upregulated RNAs. Edge thickness represents the combined STRING (Search Tool for the Retrieval of Interacting Genes/Proteins) confidence score for an interaction between two proteins. Experimentally validated interactions are represented by black edges, and the remaining edges are in gray. Genes were seeded using the STRING interactome with a medium confidence score threshold (greater than 0.4).
To explore the impact of Be exposure on a few of the top features, we compared IL2RB, CXCR6, and LCK BAL gene expression before and after Be treatment in cultured cells from CBD (n = 5), BeS (n = 5), and nondiseased control subjects (n = 3) using qRT-PCR. As shown in Figure E7 and Table E7, there was no difference in the expression of IL2RB, CXCR6, and LCK in CBD versus BeS and control subjects after Be treatment for 24 hours. However, the expression of IL2RB and CXCR6 tended to be higher. In our microarray gene expression data, expression of each of these genes was significantly higher in CBD relative to both BeS and control subjects.
Discussion
Our study provides a systematic analysis of lung compartment-specific changes involved in BeS and CBD by integrating genome-wide DNA methylation, gene expression, and protein abundance. Importantly, this is the first study to integrate epigenomics, transcriptomics, and proteomics to define biological pathways involved in BeS and CBD as well as any noninfectious granulomatous lung disease, allowing for the identification of potential novel biomarkers. Our analysis identified specific genes, proteins, networks, and pathways differentially expressed in both CBD and BeS, as well as molecules specific to each condition. We identified 1,546 DEGs in CBD versus control subjects and 204 in CBD versus BeS, with 101 transcripts in common. Of these 101 transcripts, 24 have significant cis relationships of gene expression and DNA methylation in the form of eQTM. We also identified six significantly differentially abundant proteins in CBD versus BeS and found that SIT1 and SH2D1A were differentially regulated in both gene expression and protein data.
We performed two complementary analyses to integrate DNA methylation and expression datasets: eQTM analysis and DIABLO. Importantly, we observed a high degree of overlap between the results of these models, both at the pathway and for individual features. We identified eight genes (CCL5, IFITM1, IKZF3, IL2RB, IL32, LCK, SPOCK2, and TNFRSF25) differentially expressed in both CBD versus control and CBD versus BeS with more than 5 CpGs that are eQTMs. These genes all have an important function in immunity, and our eQTM analysis suggests they are epigenetically regulated. For example, IFITM1 demonstrated decreased methylation and increased expression in CBD. IFITM1 is important for immunity, antiviral activity, and cellular functions such as adhesion and proliferation (29) and is upregulated in tuberculosis (30, 31) and alpha-1 antitrypsin deficiency (32). Until this current study, IFITM1 was not associated with CBD or other noninfectious granulomatous diseases, although it could be involved in IFN-γ signaling. Interestingly, we previously found CCL5 associated with CBD versus BeS methylation and gene expression in a smaller study of BAL cells, suggesting consistency of results with more conventional and integrative analytical approaches (33).
Our DIABLO model prioritized correlated DNA methylation and gene expression features that separated CBD, BeS, and control subjects, providing potential insight into disease mechanisms and implicating potentially targetable molecules for therapeutic intervention or monitoring. The multiomic model of top DNA methylation and gene expression features demonstrated that component one separated CBD from BeS and control subjects, and component two separated control subjects from CBD and BeS. Component one captured signals associated with T-cell function and component two with macrophage function. This result is in line with prior knowledge that T-cell proliferation and dysfunction are a hallmark of CBD and also highlights innate immune dysfunction as present in both CBD and BeS. To improve model interpretability, DIABLO employs L1 regularization, commonly used in LASSO regression, which selects a subset of input variables to generate a model. Although L1 regularization allowed us to build sparse predictive models from entire omic datasets, it will often select one of multiple colinear variables, and it is, therefore, likely that certain variables were excluded from our DIABLO model that are relevant to disease.
Investigating protein changes provides an opportunity to examine the functional outcome of epigenetic regulation and gene expression on proteins linked to BeS and CBD. SIT1 and SH2D1A were features from our RNA dataset not previously observed that distinguished individuals with CBD from BeS in addition to being differentially abundant at the degree of protein. SIT1 inhibits T-cell receptor signaling and is a regulator of thymocyte selection (34). SIT1 knockout and knockdown T cells demonstrate increased proliferation driven by enhanced Akt activation (35). SH2D1A, also known as SLAM (signaling lymphocyte activation molecule)-associated protein, is expressed in T cells and natural killer cells and binds to the cytoplasmic domains of SLAM family receptors. It has been implicated in autoimmunity (36), and mutations in this gene have been associated with X-linked lymphoproliferative disease (37, 38). SH2D1A has also been shown to interact with CD28 to inhibit T-cell signaling in vitro in rheumatoid arthritis (39). The role of SH2D1A in Be disease or other granulomatous disease has not been previously noted. The proteins participating in these biological processes could be candidate biomarkers for the prediction of disease diagnosis and progression to CBD.
Genes in the network identified using the protein–protein interactome data are involved in T-cell receptor signaling (CD8A, CD8B, LCK, and RASGRP1) and cytokine–cytokine receptor interactions (CCL5, CXCR3, CXCR6, IL2RB, IL32, and TNFRSF25). CXCR6 has been implicated in Th1 signaling as high concentrations of CXCR6 were observed on Th1-polarized T cells and T cells in inflamed tissues of Th1-mediated diseases such as rheumatoid arthritis, hepatitis C, and sarcoidosis (40–42). We also found that it was associated with CBD in our prior small study of methylation and gene expression, as we did other chemokines and ligands, like CCL5, CCR5, and CXCR4 (33). CXCR3 is involved in the infiltration of lymphocytes into inflamed tissues and diseases, such as rheumatoid arthritis, multiple sclerosis, asthma, and hepatitis (43, 44). Numerous other studies have also demonstrated a critical role in immune pathways, including cytokine–cytokine receptor interactions, T-cell receptor signaling, and chemokine signaling in CBD (45–47).
Although our study has a limited sample size, it provides valuable insights into BeS and CBD biomarkers and pathogenesis. Although ideally, similar studies would be performed in additional populations to validate our results, as noted above, we found some of the same genes epigenetically regulated as we did in our initial study. In fact, using qRT-PCR, we found trends in gene expression in Be-stimulated BAL cells from a separate population of CBD versus BeS and control subjects in two of our top features, IL2RB and CXCR6. We ultimately detected fewer epigenetic and gene expression changes relative to our previous study, and this is likely driven by the heterogeneity of individuals with BeS and CBD. In our previous study, individuals with CBD and BeS demonstrated clear differences in pulmonary function tests, with patients with CBD presenting with significantly decreased DlCO, as well as nonsignificant decreases in forced expiratory volume in 1 second, forced vital capacity, and TLC. This, coupled with the fact that 50% of individuals with CBD were on corticosteroid treatment, indicates that the previous population with CBD had advanced disease and lung involvement. In the present study, individuals with BeS present with increased BAL WBC numbers we generally expect to observe in CBD. In addition, BeS and CBD groups showed no differences in lung function measurements. These observations are contrary to expectations and likely contribute to difficulty detecting signals in this population. BAL cell differentials were only available in CBD and BeS samples but not in control subjects. As such, we were unable to evaluate how lymphocyte and macrophage content differed in CBD and BeS relative to control subjects. However, we find that including lymphocyte percentage as a covariate in our CBD–BeS expression comparison ameliorates signal, indicating that the bulk of signals we see is because of increased lymphocyte content in disease. This confounding between cell proportions and phenotype necessitates future studies that control for cell proportions, such as single-cell approaches. Despite these shortcomings, we reliably detect features that not only separate CBD from control subjects but from BeS samples as well.
We employed a targeted approach (Immune Response Panel) for the proteomics studies, resulting in a small subset of BALF proteins, biased toward detecting proteins involved in immune response as opposed to interrogating broad protein changes; examining global changes would provide a more comprehensive understanding of proteins associated with BeS and CBD, and allow detection of crossomic interactions. Furthermore, we only looked at secreted proteins in BALF and not cellular proteins present in BAL cells. As albumin constituted approximately 95% of total protein content, this likely hindered our ability to detect low abundance proteins that may be relevant to disease. Albumin removal before proteomic analysis may be a useful strategy for deeper interrogation of low- and medium-abundance proteins. Our study is at a single time point and does not allow us to investigate longitudinal changes in DNA methylation, gene expression, or protein abundance. These omes are dynamic and known to change over the course of human disease, and in fact, regulation of genes by the epigenome, as well as genes regulating protein expression, might not occur at the same time. To shed light on the temporal nature of molecular signaling in CBD and BeS pathogenesis, as well as identify whether molecular changes are stable or dynamic through disease progression, future studies will need to collect samples at multiple time points during the course of disease. There have been no omics, and only a few transcriptomic studies of peripheral blood in CBD were conducted in our group and others (47–49). We replicated some associations in blood, with the majority of implicated genes involved in T-cell and immune function. However, there are clearly different signatures of disease in blood and BAL. Because of disease heterogeneity and cell proportion confounding of omics signals, future studies should investigate omics signatures of both tissues collected in the same set of patients to truly compare signals between the two tissues.
Conclusions
Our proof-of-concept study provides a scientific premise for integrative deep molecular phenotyping across methylation, gene expression, and protein abundance in CBD and BeS. The integrative functional genomics approach we used has identified biological changes in BAL and BALF, highlighting genes and pathways unique to and shared across all three degrees of gene regulation interrogated. This study is a crucial step to narrowing the gap in our current knowledge, allowing for the identification of new regulatory genes and networks that dictate CBD and/or perpetuation of BeS that will have implications for other granulomatous and immune-mediated diseases.
Footnotes
Supported by National Institutes of Health, National Institute of Environmental Health Sciences (R01ES025722, R01ES033678, R01ES023826, and K01ES020857); National Center for Advancing Translational Sciences (TL1TR0025331 and P01ES11810); National Heart, Lung, and Blood Institute (K12HL090147); and CCTSI grant UL1TR001082. Olink proteomic data were funded by a pilot grant from the University of Colorado Genomics and Microarray Core.
Author Contributions: L.L., I.V.Y., and L.A.M. conceived and designed the study. L.A.M. and A.M. assisted in the recruitment of subjects. S.L., K.M., Z.L., and E.J.D. collected the data. I.R.K., S.-Y.L., M.B., and T.E.F. analyzed the data. P.M.M. performed clinical phenotyping of the subjects. L.L., I.R.K., I.V.Y., and L.A.M. wrote the manuscript. All authors edited and approved the manuscript.
This article has a data supplement, which is accessible from this issue’s table of contents at www.atsjournals.org.
Originally Published in Press as DOI: 10.1165/rcmb.2022-0077OC on August 16, 2022
Author disclosures are available with the text of this article at www.atsjournals.org.
References
- 1. Henneberger PK, Cumro D, Deubner DD, Kent MS, McCawley M, Kreiss K. Beryllium sensitization and disease among long-term and short-term workers in a beryllium ceramics plant. Int Arch Occup Environ Health . 2001;74:167–176. doi: 10.1007/s004200100237. [DOI] [PubMed] [Google Scholar]
- 2. MacMurdo MG, Mroz MM, Culver DA, Dweik RA, Maier LA. Chronic beryllium disease: update on a moving target. Chest . 2020;158:2458–2466. doi: 10.1016/j.chest.2020.07.074. [DOI] [PubMed] [Google Scholar]
- 3. McCanlies EC, Kreiss K, Andrew M, Weston A. HLA-DPB1 and chronic beryllium disease: a HuGE review. Am J Epidemiol . 2003;157:388–398. doi: 10.1093/aje/kwg001. [DOI] [PubMed] [Google Scholar]
- 4. Maier L, Martyny J, Mroz M, McGrath D, Lympany P, duBois R, et al. Genetic and environmental risk factors in beryllium sensitization and chronic beryllium disease. Chest . 2002;121:81S. [PubMed] [Google Scholar]
- 5. Kreiss K, Miller F, Newman LS, Ojo-Amaize EA, Rossman MD, Saltini C. Chronic beryllium disease--from the workplace to cellular immunology, molecular immunogenetics, and back. Clin Immunol Immunopathol . 1994;71:123–129. doi: 10.1006/clin.1994.1061. [DOI] [PubMed] [Google Scholar]
- 6. Balmes JR, Abraham JL, Dweik RA, Fireman E, Fontenot AP, Maier LA, et al. ATS Ad Hoc Committee on Beryllium Sensitivity and Chronic Beryllium Disease An official American Thoracic Society statement: diagnosis and management of beryllium sensitivity and chronic beryllium disease. Am J Respir Crit Care Med . 2014;190:e34–e59. doi: 10.1164/rccm.201409-1722ST. [DOI] [PubMed] [Google Scholar]
- 7. Konigsberg IR, Borie R, Walts AD, Cardwell J, Rojas M, Metzger F, et al. Molecular signatures of idiopathic pulmonary fibrosis. Am J Respir Cell Mol Biol . 2021;65:430–441. doi: 10.1165/rcmb.2020-0546OC. [DOI] [PMC free article] [PubMed] [Google Scholar]
- 8. Li L, Hamzeh N, Gillespie M, Elliott J, Wang J, Gottschall EB, et al. Beryllium increases the CD14(dim)CD16+ subset in the lung of chronic beryllium disease. PLoS One . 2015;10:e0117276. doi: 10.1371/journal.pone.0117276. [DOI] [PMC free article] [PubMed] [Google Scholar]
- 9. Maier LA, Raynolds MV, Young DA, Barker EA, Newman LS. Angiotensin-1 converting enzyme polymorphisms in chronic beryllium disease. Am J Respir Crit Care Med . 1999;159:1342–1350. doi: 10.1164/ajrccm.159.4.9806106. [DOI] [PubMed] [Google Scholar]
- 10. Ritchie ME, Phipson B, Wu D, Hu Y, Law CW, Shi W, et al. limma powers differential expression analyses for RNA-sequencing and microarray studies. Nucleic Acids Res . 2015;43:e47. doi: 10.1093/nar/gkv007. [DOI] [PMC free article] [PubMed] [Google Scholar]
- 11. Rahmani E, Yedidim R, Shenhav L, Schweiger R, Weissbrod O, Zaitlen N, et al. GLINT: a user-friendly toolset for the analysis of high-throughput DNA-methylation array data. Bioinformatics . 2017;33:1870–1872. doi: 10.1093/bioinformatics/btx059. [DOI] [PMC free article] [PubMed] [Google Scholar]
- 12. Rahmani E, Shenhav L, Schweiger R, Yousefi P, Huen K, Eskenazi B, et al. Genome-wide methylation data mirror ancestry information. Epigenetics Chromatin . 2017;10:1. doi: 10.1186/s13072-016-0108-y. [DOI] [PMC free article] [PubMed] [Google Scholar]
- 13. Rahmani E, Zaitlen N, Baran Y, Eng C, Hu D, Galanter J, et al. Correcting for cell-type heterogeneity in DNA methylation: a comprehensive evaluation. Nat Methods . 2017;14:218–219. doi: 10.1038/nmeth.4190. [DOI] [PMC free article] [PubMed] [Google Scholar]
- 14. Assarsson E, Lundberg M, Holmquist G, Björkesten J, Thorsen SB, Ekman D, et al. Homogenous 96-plex PEA immunoassay exhibiting high sensitivity, specificity, and excellent scalability. PLoS One . 2014;9:e95192. doi: 10.1371/journal.pone.0095192. [DOI] [PMC free article] [PubMed] [Google Scholar]
- 15. Benjamini Y, Hochberg Y. Controlling the false discovery rate: a practical and powerful approach to multiple testing. J R Stat Soc B . 1995;57:289–300. [Google Scholar]
- 16. Shabalin AA. Matrix eQTL: ultra fast eQTL analysis via large matrix operations. Bioinformatics . 2012;28:1353–1358. doi: 10.1093/bioinformatics/bts163. [DOI] [PMC free article] [PubMed] [Google Scholar]
- 17. Singh A, Shannon CP, Gautier B, Rohart F, Vacher M, Tebbutt SJ, et al. DIABLO: an integrative approach for identifying key molecular drivers from multi-omics assays. Bioinformatics . 2019;35:3055–3062. doi: 10.1093/bioinformatics/bty1054. [DOI] [PMC free article] [PubMed] [Google Scholar]
- 18. Rohart F, Gautier B, Singh A, Lê Cao KA. mixOmics: an R package for 'omics feature selection and multiple data integration. PLOS Comput Biol . 2017;13:e1005752. doi: 10.1371/journal.pcbi.1005752. [DOI] [PMC free article] [PubMed] [Google Scholar]
- 19. Love MI, Huber W, Anders S. Moderated estimation of fold change and dispersion for RNA-seq data with DESeq2. Genome Biol . 2014;15:550. doi: 10.1186/s13059-014-0550-8. [DOI] [PMC free article] [PubMed] [Google Scholar]
- 20. Tibshirani R. Variance stabilization and the bootstrap. Biometrika . 1988;75 [Google Scholar]
- 21. Kuleshov MV, Jones MR, Rouillard AD, Fernandez NF, Duan Q, Wang Z, et al. Enrichr: a comprehensive gene set enrichment analysis web server 2016 update. Nucleic Acids Res. . 2016;44:W90–7. doi: 10.1093/nar/gkw377. [DOI] [PMC free article] [PubMed] [Google Scholar]
- 22. Krämer A, Green J, Pollard J, Jr, Tugendreich S. Causal analysis approaches in ingenuity pathway analysis. Bioinformatics . 2014;30:523–530. doi: 10.1093/bioinformatics/btt703. [DOI] [PMC free article] [PubMed] [Google Scholar]
- 23. Szklarczyk D, Franceschini A, Wyder S, Forslund K, Heller D, Huerta-Cepas J, et al. STRING v10: protein-protein interaction networks, integrated over the tree of life. Nucleic Acids Res . 2015;43:D447–D452. doi: 10.1093/nar/gku1003. [DOI] [PMC free article] [PubMed] [Google Scholar]
- 24. Rahmani E, Zaitlen N, Baran Y, Eng C, Hu D, Galanter J, et al. Sparse PCA corrects for cell type heterogeneity in epigenome-wide association studies. Nat Methods . 2016;13:443–445. doi: 10.1038/nmeth.3809. [DOI] [PMC free article] [PubMed] [Google Scholar]
- 25. Kim S, Forno E, Zhang R, Park HJ, Xu Z, Yan Q, et al. Expression quantitative trait methylation analysis reveals methylomic associations with gene expression in childhood asthma. Chest . 2020;158:1841–1856. doi: 10.1016/j.chest.2020.05.601. [DOI] [PMC free article] [PubMed] [Google Scholar]
- 26. Rantakari P, Patten DA, Valtonen J, Karikoski M, Gerke H, Dawes H, et al. Stabilin-1 expression defines a subset of macrophages that mediate tissue homeostasis and prevent fibrosis in chronic liver injury. Proc Natl Acad Sci USA . 2016;113:9298–9303. doi: 10.1073/pnas.1604780113. [DOI] [PMC free article] [PubMed] [Google Scholar]
- 27. Gao R, Peng X, Perry C, Sun H, Ntokou A, Ryu C, et al. Macrophage-derived netrin-1 drives adrenergic nerve-associated lung fibrosis. J Clin Invest . 2021;131:136542. doi: 10.1172/JCI136542. [DOI] [PMC free article] [PubMed] [Google Scholar]
- 28. Arunachalam PS, Wimmers F, Mok CKP, Perera RAPM, Scott M, Hagan T, et al. Systems biological assessment of immunity to mild versus severe COVID-19 infection in humans. Science . 2020;369:1210–1220. doi: 10.1126/science.abc6261. [DOI] [PMC free article] [PubMed] [Google Scholar]
- 29. Bailey CC, Zhong G, Huang IC, Farzan M. IFITM-family proteins: the cell’s first line of antiviral defense. Annu Rev Virol . 2014;1:261–283. doi: 10.1146/annurev-virology-031413-085537. [DOI] [PMC free article] [PubMed] [Google Scholar]
- 30. Bloom CI, Graham CM, Berry MPR, Rozakeas F, Redford PS, Wang Y, et al. Transcriptional blood signatures distinguish pulmonary tuberculosis, pulmonary sarcoidosis, pneumonias and lung cancers. PLoS One . 2013;8:e70630. doi: 10.1371/journal.pone.0070630. [DOI] [PMC free article] [PubMed] [Google Scholar]
- 31. Gjøen JE, Jenum S, Sivakumaran D, Mukherjee A, Macaden R, Kabra SK, et al. Novel transcriptional signatures for sputum-independent diagnostics of tuberculosis in children. Sci Rep . 2017;7:5839. doi: 10.1038/s41598-017-05057-x. [DOI] [PMC free article] [PubMed] [Google Scholar]
- 32. Chu JH, Zang W, Vukmirovic M, Yan X, Adams T, DeIuliis G, et al. GRADS Investigators Gene coexpression networks reveal novel molecular endotypes in alpha-1 antitrypsin deficiency. Thorax . 2021;76:134–143. doi: 10.1136/thoraxjnl-2019-214301. [DOI] [PMC free article] [PubMed] [Google Scholar]
- 33. Yang IV, Konigsberg I, MacPhail K, Li L, Davidson EJ, Mroz PM, et al. DNA methylation changes in lung immune cells are associated with granulomatous lung disease. Am J Respir Cell Mol Biol. . 2019;60:96–105. doi: 10.1165/rcmb.2018-0177OC. [DOI] [PMC free article] [PubMed] [Google Scholar]
- 34. Simeoni L, Posevitz V, Kölsch U, Meinert I, Bruyns E, Pfeffer K, et al. The transmembrane adapter protein SIT regulates thymic development and peripheral T-cell functions. Mol Cell Biol . 2005;25:7557–7568. doi: 10.1128/MCB.25.17.7557-7568.2005. [DOI] [PMC free article] [PubMed] [Google Scholar]
- 35. Arndt B, Krieger T, Kalinski T, Thielitz A, Reinhold D, Roessner A, et al. The transmembrane adaptor protein SIT inhibits TCR-mediated signaling. PLoS One . 2011;6:e23761. doi: 10.1371/journal.pone.0023761. [DOI] [PMC free article] [PubMed] [Google Scholar]
- 36. Menard L, Cantaert T, Chamberlain N, Tangye SG, Riminton S, Church JA, et al. Signaling lymphocytic activation molecule (SLAM)/SLAM-associated protein pathway regulates human B-cell tolerance. J Allergy Clin Immunol . 2014;133:1149–1161. doi: 10.1016/j.jaci.2013.10.051. [DOI] [PMC free article] [PubMed] [Google Scholar]
- 37. Sayos J, Wu C, Morra M, Wang N, Zhang X, Allen D, et al. The X-linked lymphoproliferative-disease gene product SAP regulates signals induced through the co-receptor SLAM. Nature . 1998;395:462–469. doi: 10.1038/26683. [DOI] [PubMed] [Google Scholar]
- 38. Coffey AJ, Brooksbank RA, Brandau O, Oohashi T, Howell GR, Bye JM, et al. Host response to EBV infection in X-linked lymphoproliferative disease results from mutations in an SH2-domain encoding gene. Nat Genet . 1998;20:129–135. doi: 10.1038/2424. [DOI] [PubMed] [Google Scholar]
- 39. Sandigursky S, Philips MR, Mor A. SAP interacts with CD28 to inhibit PD-1 signaling in T lymphocytes. Clin Immunol . 2020;217:108485. doi: 10.1016/j.clim.2020.108485. [DOI] [PMC free article] [PubMed] [Google Scholar]
- 40. Agostini C, Cabrelle A, Calabrese F, Bortoli M, Scquizzato E, Carraro S, et al. Role for CXCR6 and its ligand CXCL16 in the pathogenesis of T-cell alveolitis in sarcoidosis. Am J Respir Crit Care Med . 2005;172:1290–1298. doi: 10.1164/rccm.200501-142OC. [DOI] [PubMed] [Google Scholar]
- 41. Boisvert J, Kunkel EJ, Campbell JJ, Keeffe EB, Butcher EC, Greenberg HB. Liver-infiltrating lymphocytes in end-stage hepatitis C virus: subsets, activation status, and chemokine receptor phenotypes. J Hepatol . 2003;38:67–75. doi: 10.1016/s0168-8278(02)00328-8. [DOI] [PubMed] [Google Scholar]
- 42. Kim CH, Kunkel EJ, Boisvert J, Johnston B, Campbell JJ, Genovese MC, et al. Bonzo/CXCR6 expression defines type 1-polarized T-cell subsets with extralymphoid tissue homing potential. J Clin Invest . 2001;107:595–601. doi: 10.1172/JCI11902. [DOI] [PMC free article] [PubMed] [Google Scholar]
- 43. Olson TS, Ley K. Chemokines and chemokine receptors in leukocyte trafficking. Am J Physiol Regul Integr Comp Physiol . 2002;283:R7–R28. doi: 10.1152/ajpregu.00738.2001. [DOI] [PubMed] [Google Scholar]
- 44. Moser B, Loetscher P. Lymphocyte traffic control by chemokines. Nat Immunol . 2001;2:123–128. doi: 10.1038/84219. [DOI] [PubMed] [Google Scholar]
- 45. Samuel G, Maier LA. Immunology of chronic beryllium disease. Curr Opin Allergy Clin Immunol . 2008;8:126–134. doi: 10.1097/ACI.0b013e3282f824a4. [DOI] [PubMed] [Google Scholar]
- 46. Fontenot AP, Maier LA. Genetic susceptibility and immune-mediated destruction in beryllium-induced disease. Trends Immunol . 2005;26:543–549. doi: 10.1016/j.it.2005.08.004. [DOI] [PubMed] [Google Scholar]
- 47. Li L, Silveira LJ, Hamzeh N, Gillespie M, Mroz PM, Mayer AS, et al. Beryllium-induced lung disease exhibits expression profiles similar to sarcoidosis. Eur Respir J . 2016;47:1797–1808. doi: 10.1183/13993003.01469-2015. [DOI] [PMC free article] [PubMed] [Google Scholar]
- 48. Lin NW, Maier LA, Mroz MM, Jacobson S, MacPhail K, Liu S, et al. Genomic biomarkers in chronic beryllium disease and sarcoidosis. Respir Med . 2021;187:106390. doi: 10.1016/j.rmed.2021.106390. [DOI] [PMC free article] [PubMed] [Google Scholar]
- 49. Hong-Geller E, Pardington PE, Cary RB, Sauer NN, Gupta G. Chemokine regulation in response to beryllium exposure in human peripheral blood mononuclear and dendritic cells. Toxicology . 2006;218:216–228. doi: 10.1016/j.tox.2005.10.016. [DOI] [PubMed] [Google Scholar]