

Abstract
Background and Aims:
Increased megamitochondria formation and impaired mitophagy in hepatocytes have been linked to the pathogenesis of alcohol-associated liver disease (ALD). This study aims to determine the mechanisms by which alcohol consumption increases megamitochondria formation in the pathogenesis of ALD.
Approach and Results:
Human alcoholic hepatitis (AH) liver samples were used for electron microscopy, histology, and biochemical analysis. Liver-specific dynamin-related protein 1 (DRP1; gene name DNM1L, an essential gene regulating mitochondria fission) knockout (L-DRP1 KO) mice and wild-type mice were subjected to chronic plus binge alcohol feeding. Both human AH and alcohol-fed mice had decreased hepatic DRP1 with increased accumulation of hepatic megamitochondria. Mechanistic studies revealed that alcohol feeding decreased DRP1 by impairing transcription factor EB–mediated induction of DNM1L. L-DRP1 KO mice had increased megamitochondria and decreased mitophagy with increased liver injury and inflammation, which were further exacerbated by alcohol feeding. Seahorse flux and unbiased metabolomics analysis showed alcohol intake increased mitochondria oxygen consumption and hepatic nicotinamide adenine dinucleotide (NAD+), acylcarnitine, and ketone levels, which were attenuated in L-DRP1 KO mice, suggesting that loss of hepatic DRP1 leads to maladaptation to alcohol-induced metabolic stress. RNA-sequencing and real-time quantitative PCR analysis revealed increased gene expression of the cGAS–stimulator of interferon genes (STING)–interferon pathway in L-DRP1 KO mice regardless of alcohol feeding. Alcohol-fed L-DRP1 KO mice had increased cytosolic mtDNA and mitochondrial dysfunction leading to increased activation of cGAS-STING-interferon signaling pathways and liver injury.
Conclusion:
Alcohol consumption decreases hepatic DRP1 resulting in increased megamitochondria and mitochondrial maladaptation that promotes AH by mitochondria-mediated inflammation and cell injury.
INTRODUCTION
Alcohol-associated liver disease (ALD) is a global health issue, comprising a spectrum of disorders and pathologic changes in individuals with acute and chronic alcohol consumption. The pathogenesis of ALD ranges from alcoholic steatosis to alcoholic hepatitis (AH), which can progress to cirrhosis and hepatocellular carcinoma.[1,2] Because of the profound economic and health impacts of ALD,[3] a better understanding of the pathogenesis of ALD is critical for developing novel effective treatment strategies.
Alcohol is primarily metabolized in the liver by cytosolic alcohol dehydrogenase and mitochondrial aldehyde dehydrogenase 2; both enzymes require nicotinamide adenine dinucleotide (NAD+) resulting in an initial decline of hepatic NAD+. Although some studies reported that alcohol induced mitochondrial dysfunction, increased mtDNA degradation, and oxidative stress in the liver,[4–6] other studies showed that alcohol increased mitochondrial bioenergetics/respiration and formation of megamitochondria.[7,8] In rodent ALD models, increased mitochondrial respiration leads to increased NAD+ regeneration from the oxidation of nicotinamide adenine dinucleotide hydrogen (NADH), which may serve as an adaptive response to alcohol metabolism.[7,8]
Dysfunctional mitochondria can trigger apoptosis and increase an innate and sterile inflammatory response by releasing apoptotic factors such as cytochrome c or mitochondrial DNA (mtDNA). mtDNA binds and activates cyclic guanosine monophosphate–adenosine monophosphate synthase (cGAS). Activated cGAS increases production of secondary messenger cyclic 2′3′-cGAMP that binds and activates stimulator of interferon (IFN) genes (STING), resulting in IFN regulatory factor (IRF)3 and IRF7 activation.[9,10] Recent evidence indicates that the cGAS-IRF3 pathway is activated in experimental ALD models and is positively correlated with disease severity in patients with ALD.[11]
Mitochondria constantly undergo fission and fusion, which are regulated by GTPases mitofusin (MFN)1, MFN2, optic atrophy 1 (OPA1), and dynamin-related protein (DRP1) (gene name DNM1L).[12] To maintain mitochondria homeostasis, dysfunctional mitochondria can also be removed by selective mitophagy and replaced via mitochondria biogenesis as an adaptive response to alcohol intake.[13,14] However, whether and how mitochondrial dynamics and mitophagy affect mitochondria adaptation and the cGAS-IRF3 pathway after alcohol intake is unknown. Using human AH liver samples and liver-specific DRP1 (L-DRP1) knockout (KO) mice with impaired mitochondrial fission, we demonstrate a critical role of mitochondrial dynamics and mitophagy in protecting against ALD.
METHODS
Animal experiments
C57BL/6J mice (Jackson Laboratories) were used in this study. Dnm1l Flox/Flox [F/F] mice (C57BL/6/129) were generated as described previously[15] and were crossed with albumin-Cre mice (Alb-Cre, C57BL/6J) (Jackson Laboratory) for six generations. All animals were specific pathogen-free and maintained in a barrier rodent facility under standard experimental conditions. All procedures were approved by the Institutional Animal Care and Use Committee of the University of Kansas Medical Center. Two-to three-month-old male Alb-Cre+Dnm1l F/F mice and Alb-Cre−Dnm1l F/Fage-matched littermates were subjected to Gao-binge alcohol model.[16,17] Blood and liver tissues were collected. Liver injury was determined by measuring serum alanine aminotransferase (ALT). Liver cryosections and hematoxylin and eosin (H&E) staining and confocal microscopy were performed as described previously.[18]
Human samples
Frozen liver tissues from healthy donors (n = 6) and AH patients (n = 9) were obtained from the Clinical Resource for Alcoholic Hepatitis Investigations at John Hopkins University. The human research was approved by the Human Ethics Committee of John Hopkins University (IRB 00197893), and written, informed consent was obtained from all participants. De-identified human samples were used in accordance with the NIH and institutional guidances for human subject research. The detailed demographic, clinical, and biological characterization information of the patients are summarized in Table S1. Primary human hepatocytes were obtained from the Cell Isolation Core at the University of Kansas Medical Center. The cohort of patients with ALD patient cohort used for human RNA-sequencing (RNA-seq) analysis has been described previously.[19]
GEO accession number for our RNAseq data is GSE207074. For all other methods see Supporting Materials.
RESULTS
Decreased hepatic DRP1 expression in human AH and experimental mouse ALD, which is associated with the formation of megamitochondria
We found that protein and mRNA levels of DRP1, MFN1, and MFN2 dramatically decreased in the liver of AH patients compared with healthy controls (Figure 1A–C). Large and elongated mitochondria (megamitochondria) were readily detected in AH livers by electron microscopy (EM) (Figure 1D, arrows). Quantitative EM analysis showed heterogeneity in mitochondrial size in both normal and AH livers, but the number of megamitochondria was significantly higher in AH than in normal livers (Figure 1E). Consistent with human AH, Gao-binge ethanol (EtOH)-fed mice had decreased hepatic DRP1 at both mRNA and protein levels but had only slightly decreased levels of hepatic mRNA and no significant decline in protein levels of MFN1 and MFN2 (Figure 1F–H). Decreased MFN1 and MFN2 in human AH may represent an adaption response to the chronic accumulation of megamitochondria, and such an adaption has not been established in “Gao-binge” alcohol-fed mice because of the relatively short alcohol exposure.
FIGURE 1.
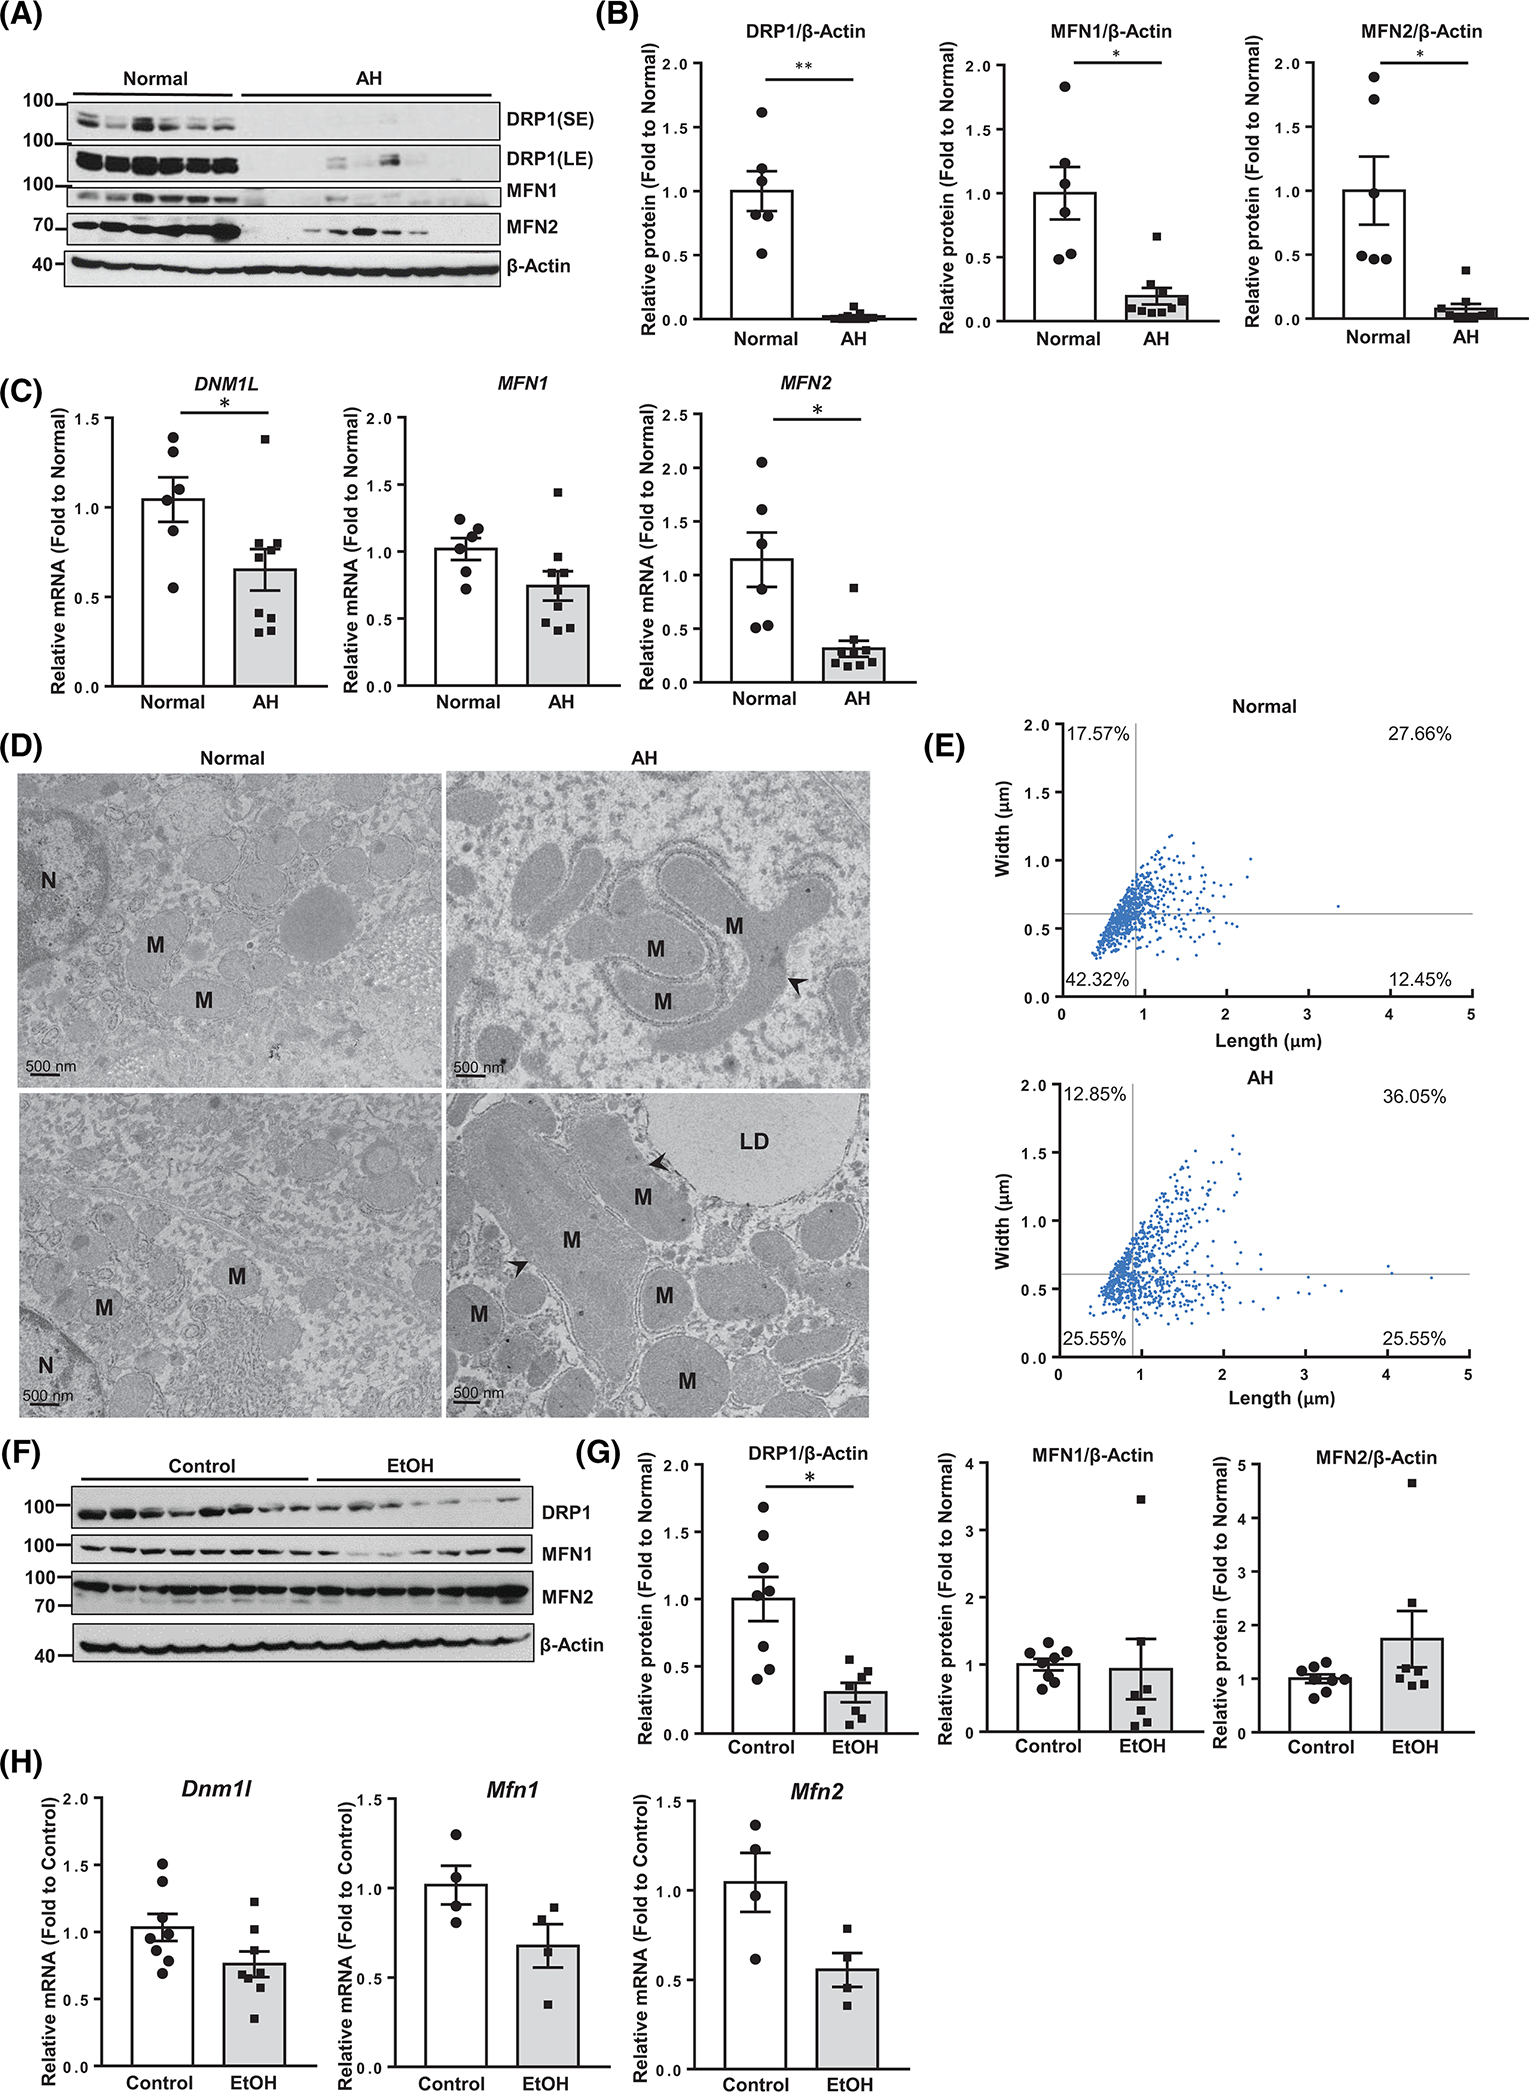
Decreased dynamin-related protein 1 (DRP1) expression in human alcoholic hepatitis (AH) and mouse alcohol-associated liver disease liver. (A) Total liver lysates and RNA from patients with AH and healthy donors were subjected to western blot analysis. (B) Densitometry analysis of (A). (C) Real-time quantitative PCR (qPCR) analysis. (D) Representative electron microscopy images of the livers from healthy donors and patients with AH. Arrowheads denote megamitochondria. LD, lipid; M, mitochondria; N, nuclear. (E) Mitochondrial length and width were measured from (D) using Image-Pro Plus software (mitochondria number = 700–800 from n = 3 livers). (F) Male wild-type C57BL/6J mice (2–3 months old) were subjected to Gao-binge alcohol feeding. Total liver lysates and RNA were subjected to western blot analysis, (G) Densitometry analysis of (F) and (H) qPCR analysis. All data are presented as means ± SEM (n = 4–9). *p < 0.05, **p < 0.01; two-tailed Student’s t test. EtOH, ethanol; MFN, mitofusin; mRNA, messenger RNA.
Alcohol inhibits expression of DRP1 through impaired transcription factor EB
We previously reported that hepatic transcription factor EB (TFEB) is impaired in experimental ALD and human AH.[20] Expression of TFEB correlated robustly with that of DRP1 in human AH livers; this correlation also existed in EtOH-fed mouse livers (Figure 2A,B, Figure S1A,B). EtOH also decreased the protein levels of DRP1 and TFEB in primary cultured human hepatocytes (Figure 2C). Overexpression of TFEB in mouse livers increased protein and mRNA levels of DRP1 with or without EtOH feeding (Figure 2D,E). Likewise, in primary mouse hepatocytes, overexpression of TFEB increased and knockdown of TFEB decreased DRP1 expression in a dose-dependent manner (Figure 2F,G). Analysis of the DNM1L gene promoter region revealed several potential Coordinated Lysosomal Expression and Regulation elements that are typically bound to TFEB in both humans and mice (Figure S1C,D). Overexpressing TFEB increased luciferase reporting activity of the Dnm1l gene promoter in primary mouse hepatocytes (Figure 2H). Liver tissue chromatin immunoprecipitation assay revealed significantly enriched binding of TFEB to the proximal and distal Dnm1l chromatin promoter regions (Figure 2I). Together, these results indicate that TFEB positively regulates DRP1 expression and can be impaired by alcohol.
FIGURE 2.
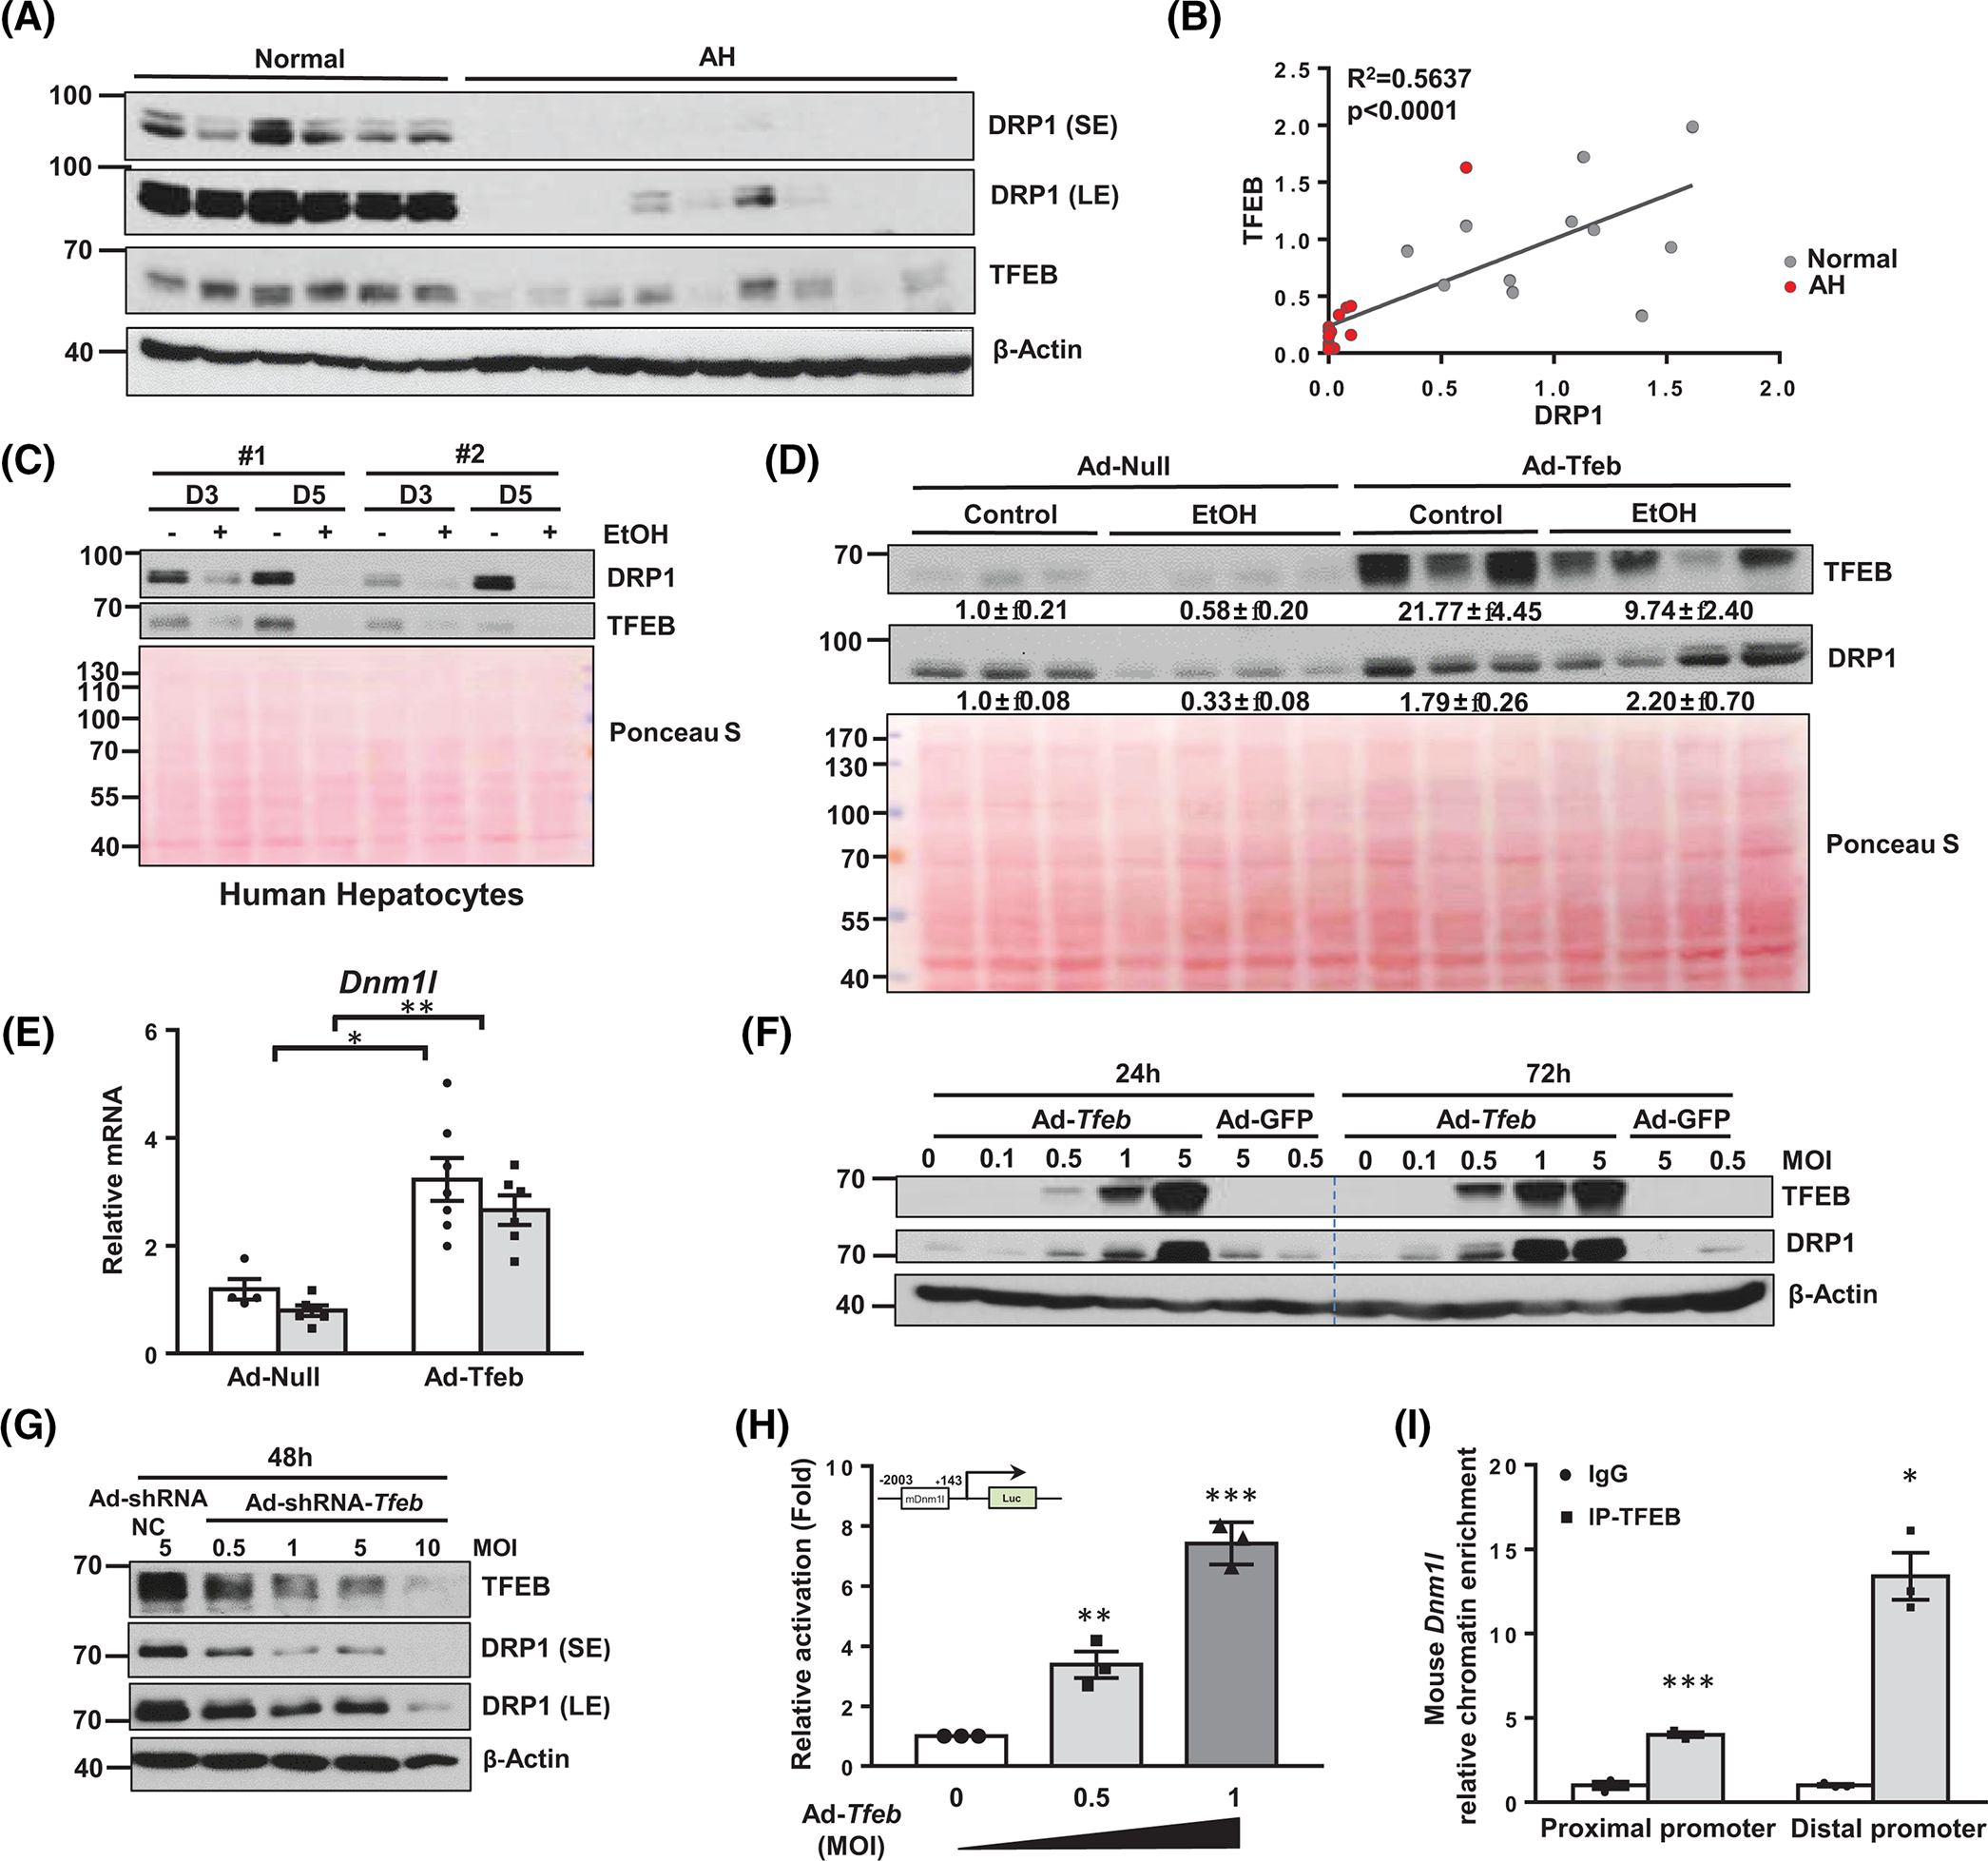
Transcription factor EB (TFEB) binds to DNM1L promoter and induces its gene expression in the liver. (A) Total liver lysates from healthy donors and patients with alcoholic hepatitis (AH) were subjected to western blot analysis. Note: DRP1 blot was from the same blot/samples from Figure 1A. (B) Correlation analysis of decreased dynamin-related protein 1 (DRP1) and TFEB protein expression from (A). (C) Primary human hepatocytes were treated with EtOH (80 mM), and total lysates were subjected to western blot analysis. (D) Male wild-type (WT) C57BL/6J mice (2–3 months old) were injected with Ad-null or Ad-Tfeb (5 × 10⁸ PFU per mouse, intravenously) followed by Gao-binge alcohol feeding. Total liver lysates and RNA were subjected to western blot analysis and (E) qPCR analysis. (F) Primary mouse hepatocytes were infected with Ad-Tfeb or Ad-shRNA-Tfeb (G) for indicated dose and time. Total cell lysates were subjected to western blot analysis. (H) Primary mouse hepatocytes were infected with the indicated dose of Ad-Tfeb for 24 h, followed by the transfection of a luciferase reporter plasmid containing around 2000 bp mouse Dnm1l gene promoter sequence. Luciferase intensity was detected at 48 h from seeding. (I) Chromatin immunoprecipitation assay for the binding of TFEB to the Dmn1l promoter was performed in WT mouse livers. All results are expressed as means ± SEM (n = 3–6). *p < 0.05, **p < 0.01, ***p < 0.001; one-way analysis of variance analysis with Bonferroni’s post hoc test for (E), two-tailed Student’s t test for (H) and (I). Ad-, adenovirus-; EtOH, ethanol; IP, immunoprecipitation; MOI, multiplicity of infection; NC, nect qRCR, real-time quantitative PCR; shRNA, short hairpin RNA.
Loss of hepatic DRP1 induces megamitochondria and exacerbates Gao-binge EtOH-induced liver injury but not steatosis
Results from western blot analysis showed decreased hepatic DRP1 in EtOH-fed wild-type (WT) mice and almost undetectable levels of DRP1 in L-DRP1 KO mice. Levels of MFN1 and MFN2 were lower in L-DRP1 KO mice than WT mice regardless of EtOH feeding (Figure 3A,B). The number of megamitochondria increased in hepatocytes of mouse livers fed with EtOH (Figure 3C, arrows). The number of megamitochondria was higher in L-DRP1 KO mice than WT mice, suggesting that loss of hepatic DRP1 is sufficient to increase mitochondrial size regardless of EtOH feeding. The number of megamitochondria was not significantly different between control diet and EtOH-fed L-DRP1 KO mice, while also being comparable to EtOH-fed WT mice (Figure 3D), suggesting that EtOH-induced megamitochondria is mainly mediated by decreased DRP1. The total number of hepatic mitochondria decreased in L-DRP1 KO mice fed with control diet, which was increased by EtOH feeding (Figure 3E). Serum ALT and aspartate aminotransferase (AST) levels were slightly higher in L-DRP1 KO mice compared with WT mice fed with control diet, suggesting loss of hepatic DRP1 may induce mild liver injury. Interestingly, serum levels of ALT and AST were significantly higher in EtOH-fed L-DRP1 KO mice than in WT mice (Figure 4A,B). Quantification of hepatic triglyceride (TG), H&E, and Oil red O staining revealed equivalent increases in hepatic steatosis in both EtOH-fed WT and L-DRP1 KO mice (Figure 4C,E). EtOH-fed WT mice had increased Sirius red staining compared with control diet-fed WT mice. L-DRP1 KO mice had higher Sirius red staining than WT mice fed with the control diet, which was not further increased following EtOH feeding (Figure 4F,G). Levels of hepatic hydroxyproline were slightly higher in EtOH-fed L-DRP1 KO mice compared with WT mice; however, these changes were nonsignificant (Figure 4H). Furthermore, expression of several fibrotic genes, including Col1a1, Acta2 (α-smooth muscle actin), and Tgfb, was generally higher in L-DRP1 KO mice regardless of EtOH feeding (Figure 4I), suggesting loss of hepatic DRP1 may be profibrogenic. These data indicate that loss of hepatic DRP1 exacerbates EtOH-induced liver injury but not steatosis.
FIGURE 3.
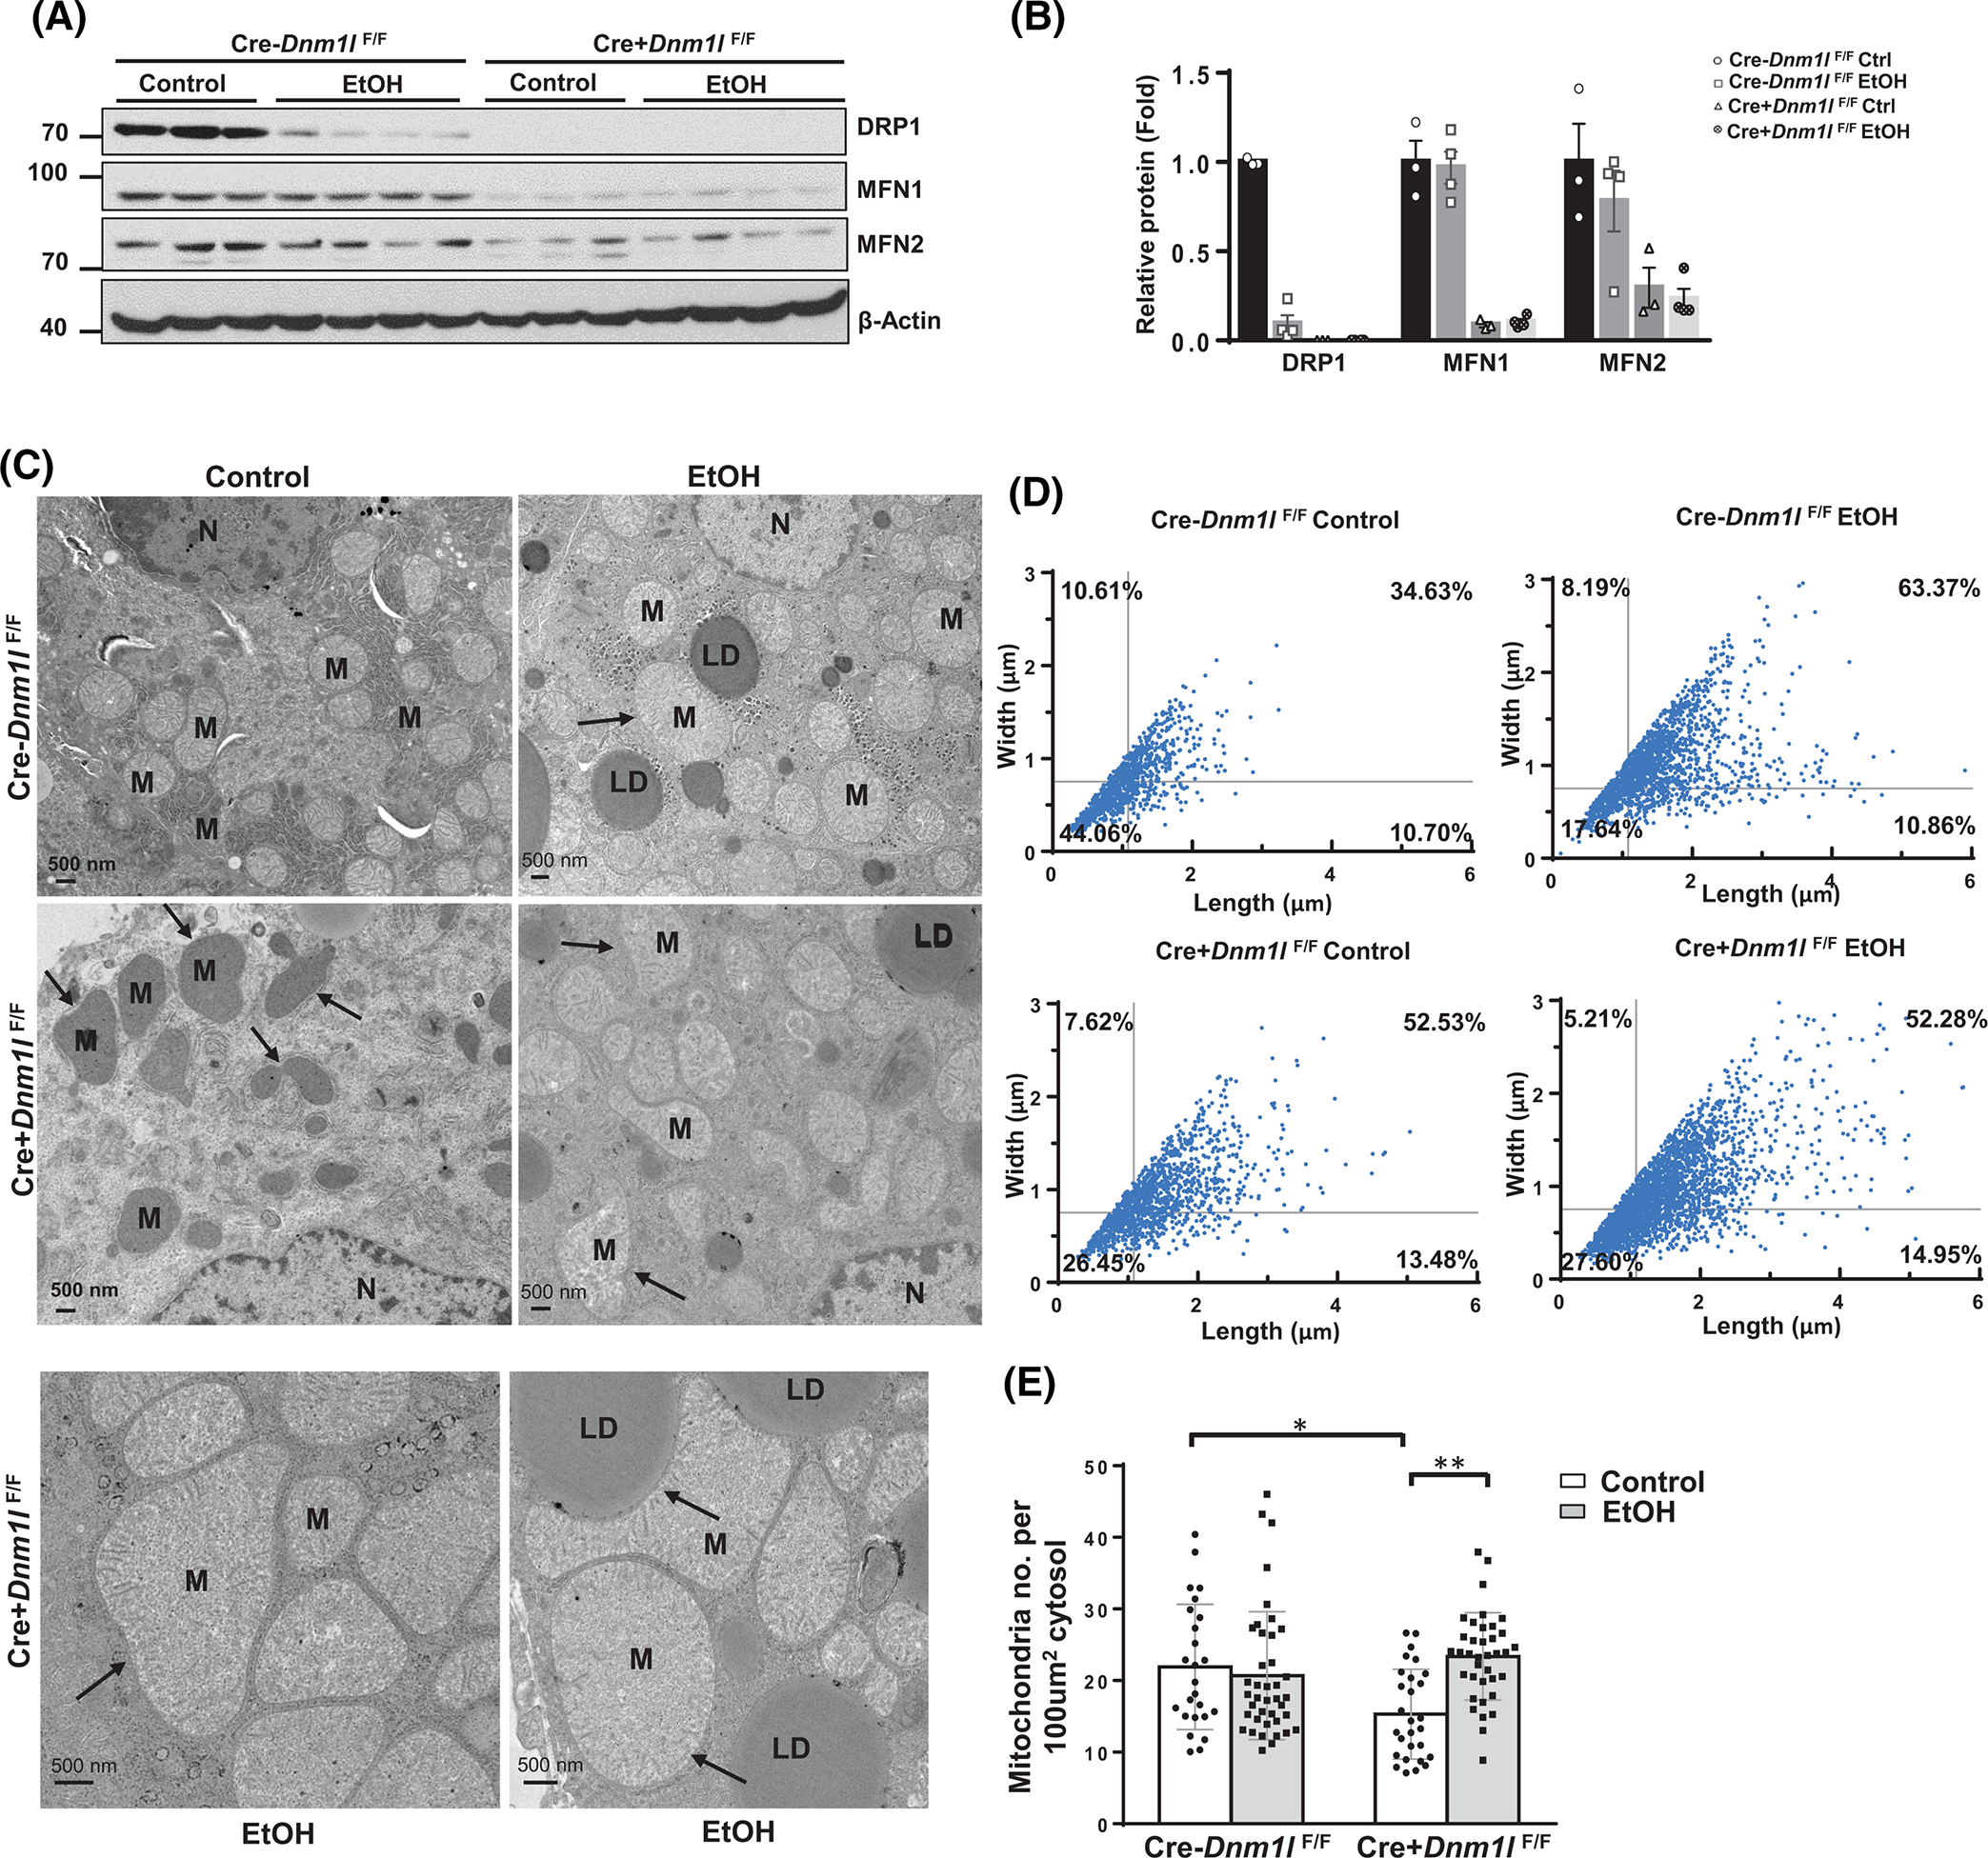
Gao-binge alcohol induces megamitochondria via downregulation of dynamin-related protein 1 (DRP1) in mouse liver. Male 2–3-month-old liver-specific DRP1 knockout and matched littermates were subjected to Gao-binge alcohol feeding. Total liver lysates were subjected to western blot analysis (A). (B) Densitometry analysis of (A). Data are presented as means ± SEM (n = 3–4). (C) Representative mouse liver electron microscopy (EM) images. Arrows denote megamitochondria. LD, lipid; M, mitochondria; N, nuclear. (D) Mitochondrial length and width from (C) were measured using Image-Pro Plus software (n = 1000–2000 from 2–3 mice). (E) Number of mitochondria per EM field were quantified and normalized with the cytosol area. At least 10 fields from each mouse were quantified. Data are presented as means ± SD. MFN, mitofusin. *p < 0.05, **p < 0.01, one-way analysis of variance analysis with Bonferroni’s post hoc test.
FIGURE 4.
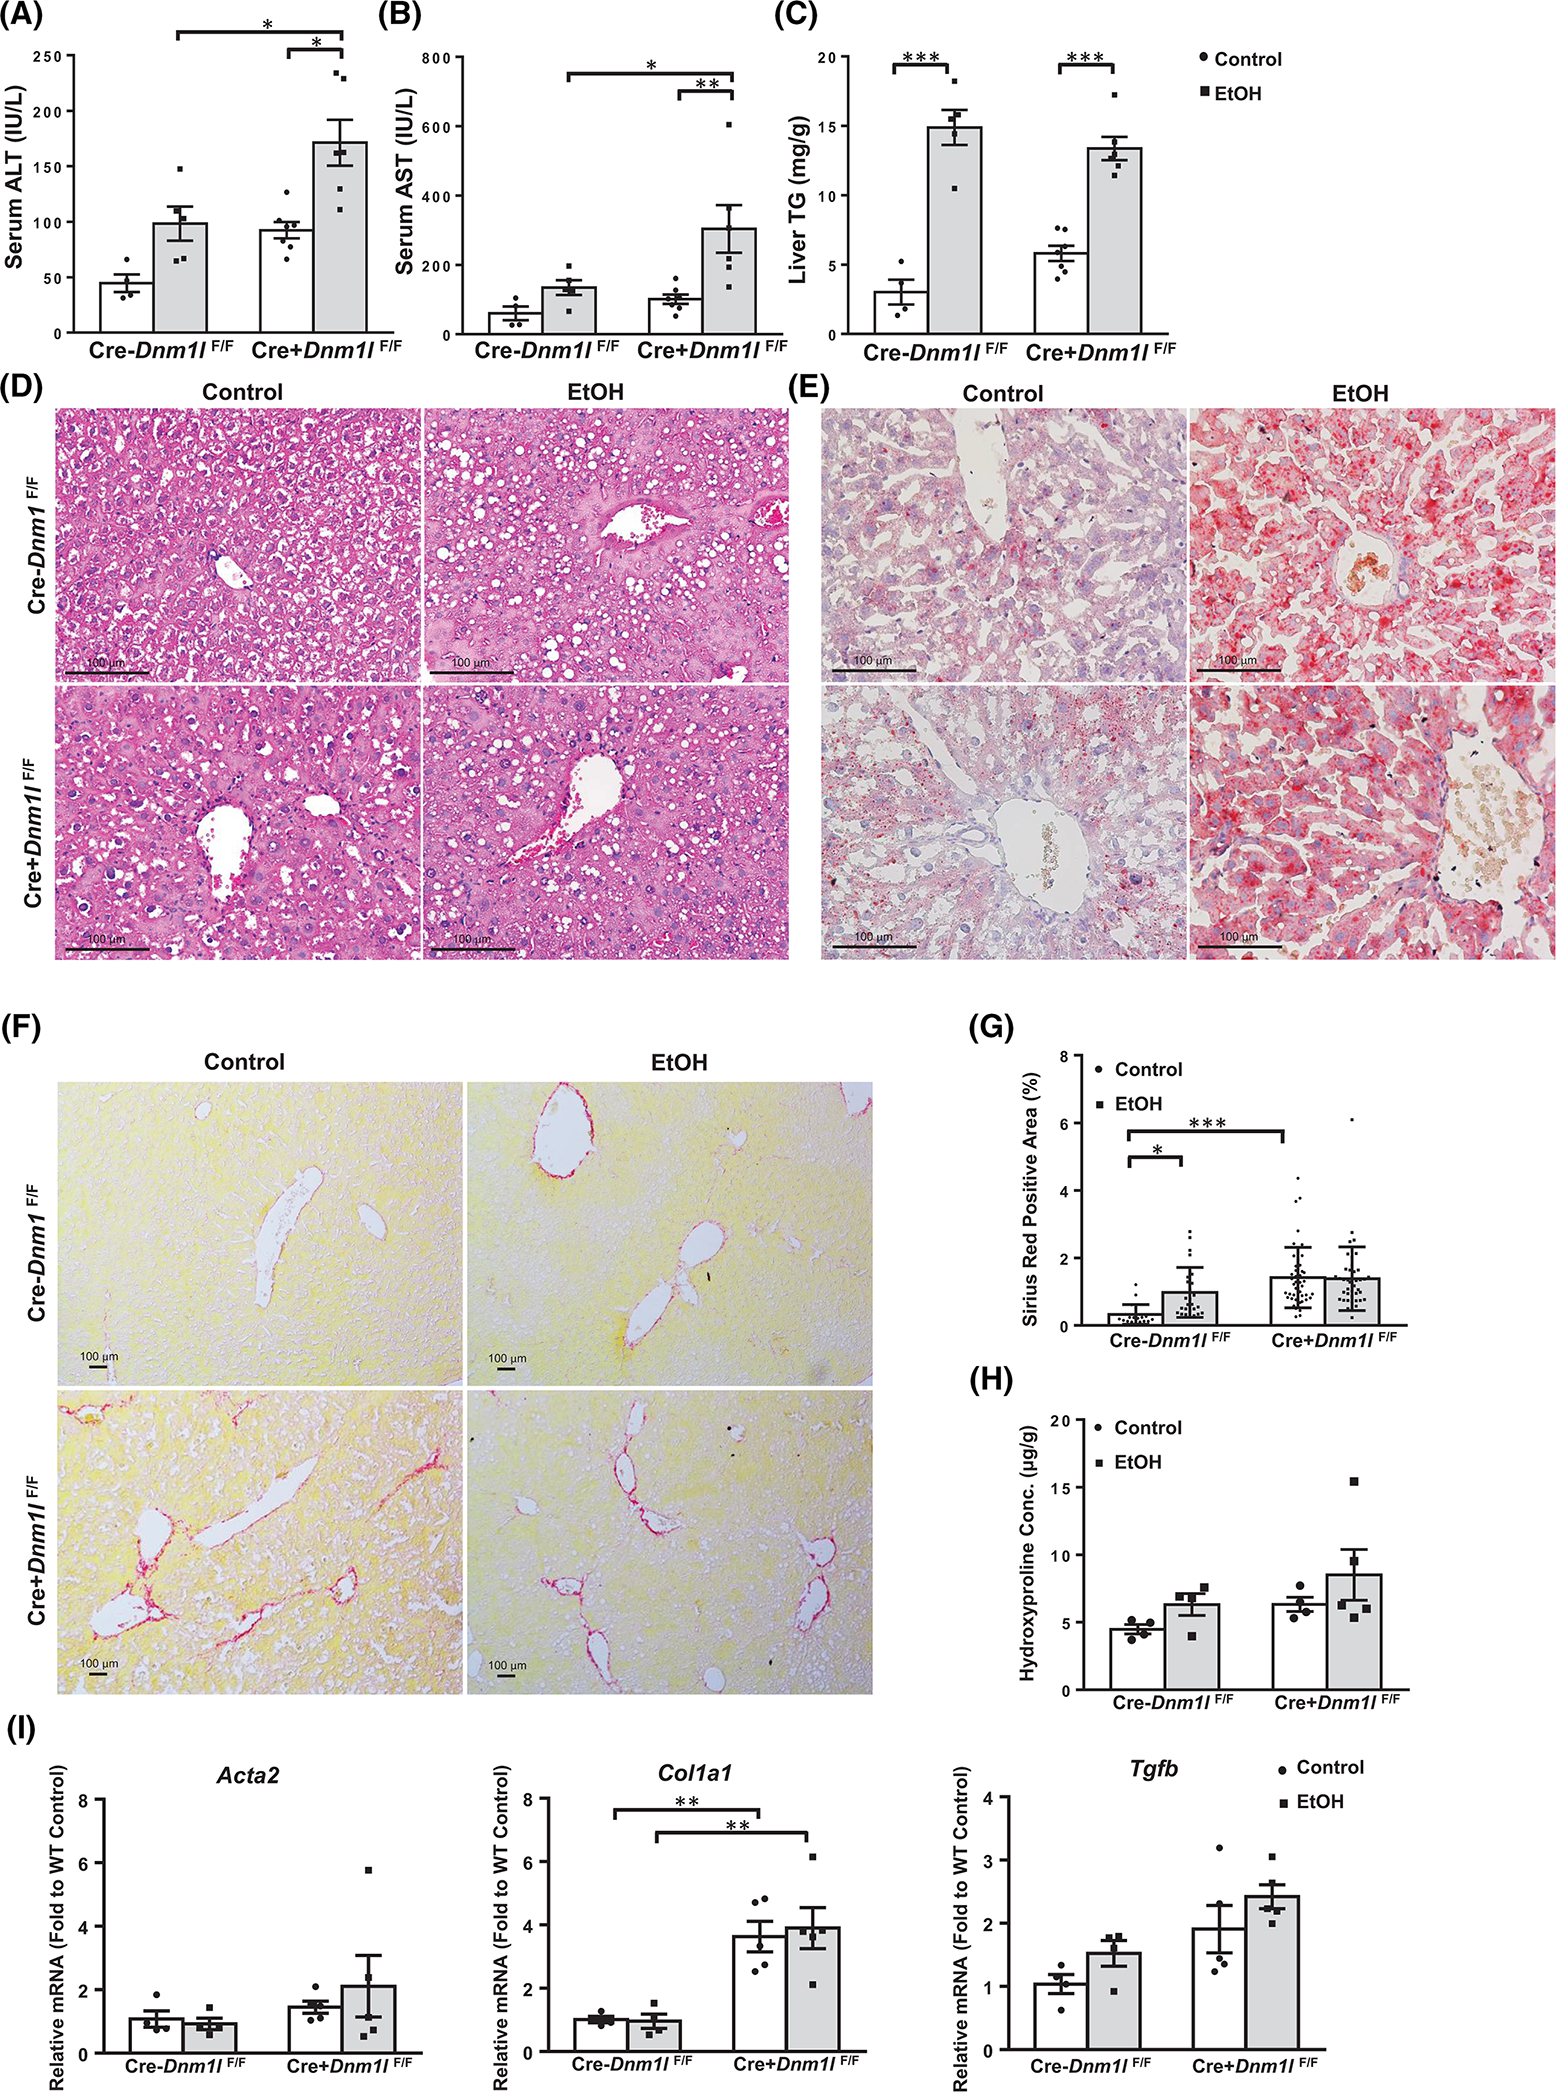
Loss of hepatic dynamin-related protein 1 (Drp1) exacerbates Gao-binge alcohol-induced liver injury but not steatosis in mice. Male 2–3-month-old liver-specific DRP1 knockout and matched littermates were subjected to Gao-binge alcohol feeding. Serum alanine aminotransferase (ALT) and aspartate aminotransferase (AST) levels (A, B) and (C) liver triglyceride (TG) levels were measured. Data are presented as means ± SEM (n = 4–7). (D) Representative liver hematoxylin and eosin, (E) Oil Red, and Sirius Red (F) staining images are shown. (G) Quantification of Sirius Red staining positive areas using Image J. Data are presented as means ± SD (n = 15 different fields of 3 mice). (H) Liver hydroxyproline content was measured. (I) Real-time quantitative PCR analysis of the fibrogenic genes in mouse livers. Data are presented as means ± SEM (n = 4–5). *p < 0.05; **p < 0.01; ***p < 0.001; one-way analysis of variance analysis with Bonferroni’s post hoc test.
Loss of hepatic DRP1 exacerbates EtOH-impaired mitophagy in hepatocytes
We next performed a Cox8-enhanced green fluorescent protein (EGFP)-mCherry mitophagy assay, in which the number of red puncta in each cell can be quantified to measure cellular mitophagy levels.[21] In EtOH-treated primary hepatocytes, the number of red mitochondria was significantly decreased, suggesting that EtOH suppresses mitophagy (Figure 5A,B). Notably, in DRP1 KO hepatocytes, the number of red-only mitochondria was significantly lower than in WT hepatocytes regardless of EtOH treatment (Figure 5A,B). Consistent with these in vitro findings, EtOH feeding decreased the number of red-only mitochondria in hepatocytes of WT mouse livers, whereas the number of red-only mitochondria was lower in L-DRP1 KO mouse hepatocytes regardless of EtOH feeding (Figure 5C,D), suggesting that loss of DRP1 impairs mitophagy in hepatocytes. Levels of p62 and microtubule-associated protein 1A/1B-light chain 3 (LC3-II) were higher after EtOH feeding in WT mice and L-DRP1 KO mice regardless of EtOH feeding, suggesting impaired autophagy in EtOH-fed mice and basal level mitophagy of L-DRP1 KO mice.
FIGURE 5.
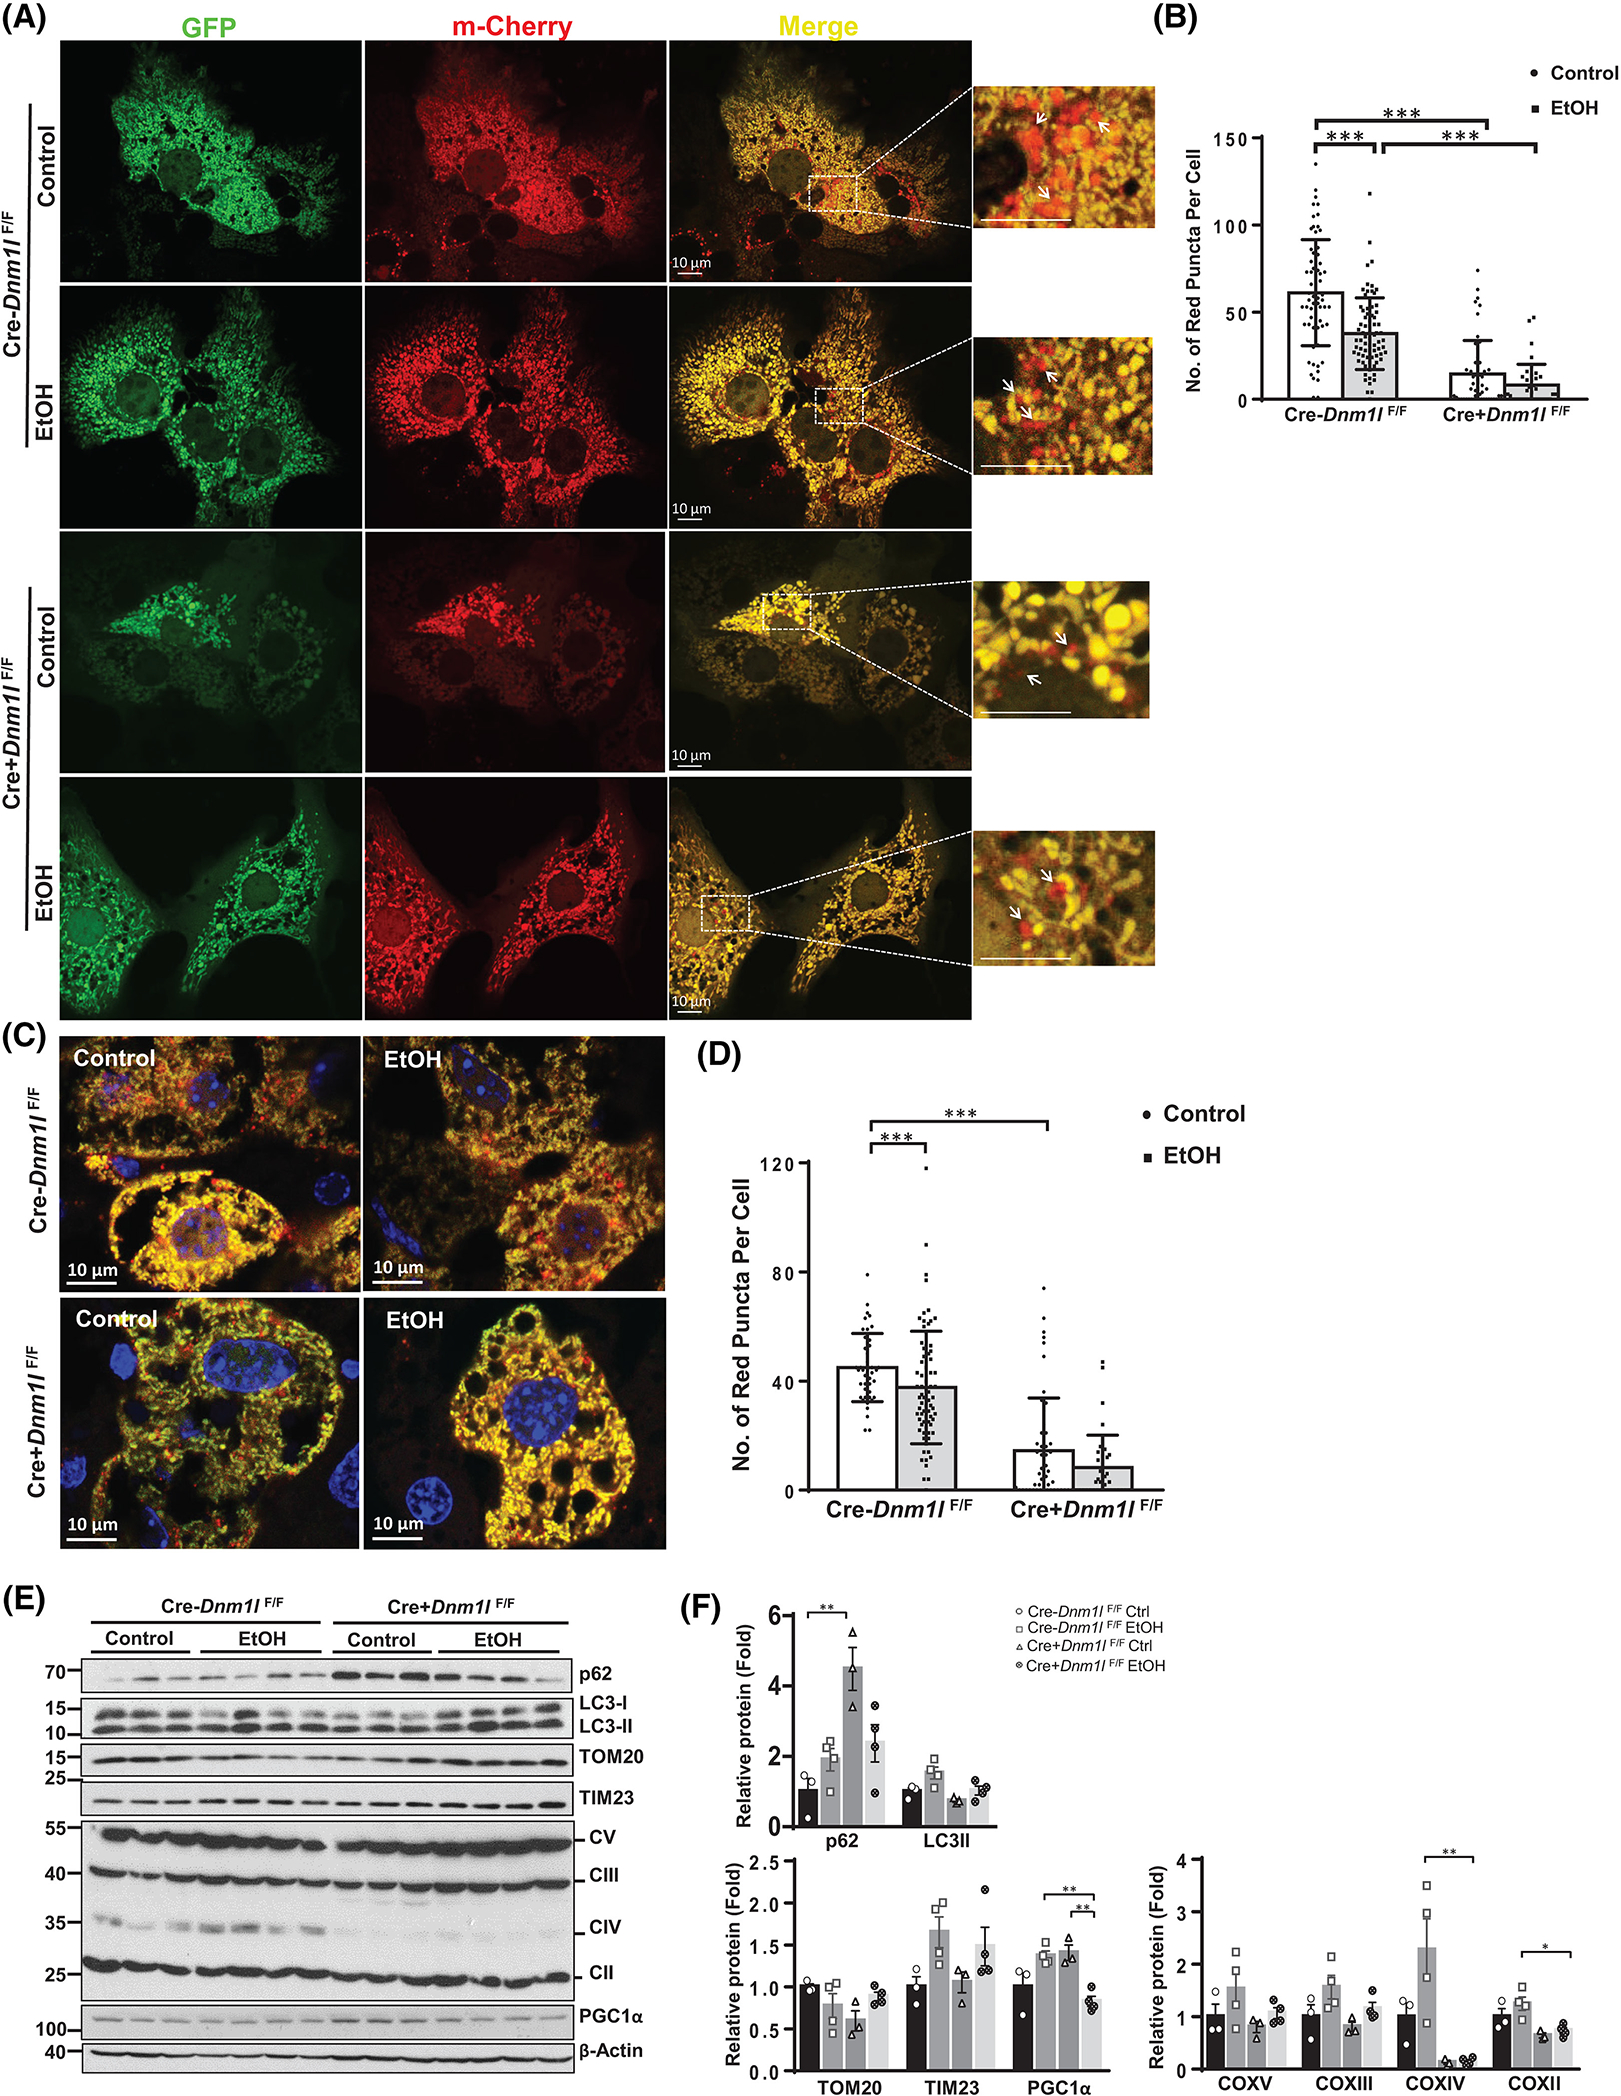
Loss of hepatic dynamin-related protein 1 (DRP1) exacerbates EtOH-impaired mitophagy in hepatocytes. (A) Primary hepatocytes from wild-type (WT) and liver-specific DRP1 knockout (L-DRP1 KO) mice were infected with Ad-Cox8-EGFP-mCherry overnight. Cells were treated with or without ethanol (80 mM) for 6 hours, followed by fluorescence microscopy. (B) The number of red puncta in each cell was quantified (n = 40–60 of 3 mice). (C) Male 2–3-month-old L-DRP1 KO and matched littermates were subjected to Gao-binge alcohol feeding. Ad-Cox8-EGFP-mCherry (5 × 10⁸ PFU per mouse, intravenously) were injected on the fifth day. Representative confocal microscopy images of cryo-liver sections are shown. (D) The number of red puncta in each cell was quantified. Data are presented as means ± SD (n = 3 mice). (E) Total liver lysate of WT and L-DRP1 KO mice fed with control or EtOH diet were subjected to western blot analysis. (F) Densitometry analysis of (E). Data are presented as means ± SEM (n = 3–4). *p < 0.05, **p < 0.01, ***p < 0.001; one-way analysis of variance analysis with Bonferroni’s post hoc test. EGFP, enhanced green fluorescent protein; EtOH, ethanol.
EtOH feeding in WT mice resulted in increased levels of mitochondrial oxidative phosphorylation proteins including complex (C)II, CIII, CIV, CV, and inner membrane TIM23 but not outer membrane TOM20. In general, we did not find significant changes in these mitochondrial proteins in L-DRP1 KO mice except for markedly decreased levels of CIII regardless of EtOH feeding (Figure 5E,F). Together, these data suggest that alcohol inhibits hepatic mitophagy both in vivo and in vitro possibly by disrupting mitochondrial fission.
Loss of hepatic DRP1 impairs EtOH-induced mitochondrial adaptation and reprogramming of glucose and lipid metabolism
Basal levels of mitochondrial OCR were slightly higher with ADP-mediated state 3 respiration and maximal respiration in response to uncoupling by carbonyl cyanide-p-trifluoromethoxyphenylhydrazone, being significantly higher in EtOH-fed mouse mitochondria compared to controls (Figure 6A,B), suggesting increased mitochondrial adaptation to alcohol intake. Although there were no significant changes in OCR between WT and KO mice fed with control diet, state 3 respiration was significantly decreased in L-DRP1 KO mice compared with that of EtOH-fed WT mice (Figure 6A,B). Cellular fractionation studies in mouse livers revealed increased apoptosis-inducing factor and cytochrome c release in EtOH-fed mice versus control diet-fed mice, which was further exacerbated in L-DRP1 KO mice (Figure 6C). Principal component analysis (PCA) on metabolomics showed distinctive separation of the four groups with greater separation of EtOH-fed mice from control diet-fed mice (Figure 6D). EtOH feeding markedly increased hepatic levels of short, medium, and long-chain saturated and unsaturated acylcarnitine, ketone bodies (3-hydroxybutyrate), and NAD+ accompanied by decreased NADH in WT mouse liver, but these were attenuated in L-DRP1 KO mouse livers (Figure 6E, Figure S2A). RNA-seq PCA analyses and volcano plots showed a clear separation of hepatic gene expression between different genotypes of mice with or without EtOH feeding (Figure 6F, Figure S2B). EtOH feeding also decreased several major glycolysis/gluconeogenesis metabolites (except 2,3-diphosphoglycerate and 2-phosphoglycerate) (Figure S3A), the tricarboxylic acid (TCA) cycle metabolites (except citrate and aconitate, Figure S4A), pentose and glycogen (Figure S5A), fructose, and galactose metabolites (except 2-ketogulonate and galatonate, Figure S6A) in EtOH-fed WT mice livers, but all were attenuated in L-DRP1 KO mouse livers. The changes of lipid and carbohydrate metabolism were generally correlated with the hepatic RNA expression of genes encoding enzymes that involves lipid, NAD, and glucose metabolism (Figure 6G, Figures S2C, S3B, S4B, S5B, S6B, S6D, S7A, S7C). The changes of gene expression in the same pathways of EtOH-fed mice also showed similar trend in patients with AH of either response or nonresponse to steroid treatment (Figures S2D, S3C, S4C, S5C, S6C, S6E, S7B, S7D). In general, these gene expression changes in EtOH-fed WT mice tended to be further downregulated in EtOH-fed L-DRP1 KO mice. Together, these data suggest that alcohol increases lipid beta-oxidation and induces a remodeling of energy supply shifting from glucose to lipids/ketone, which is attenuated in the absence of DRP1.
FIGURE 6.
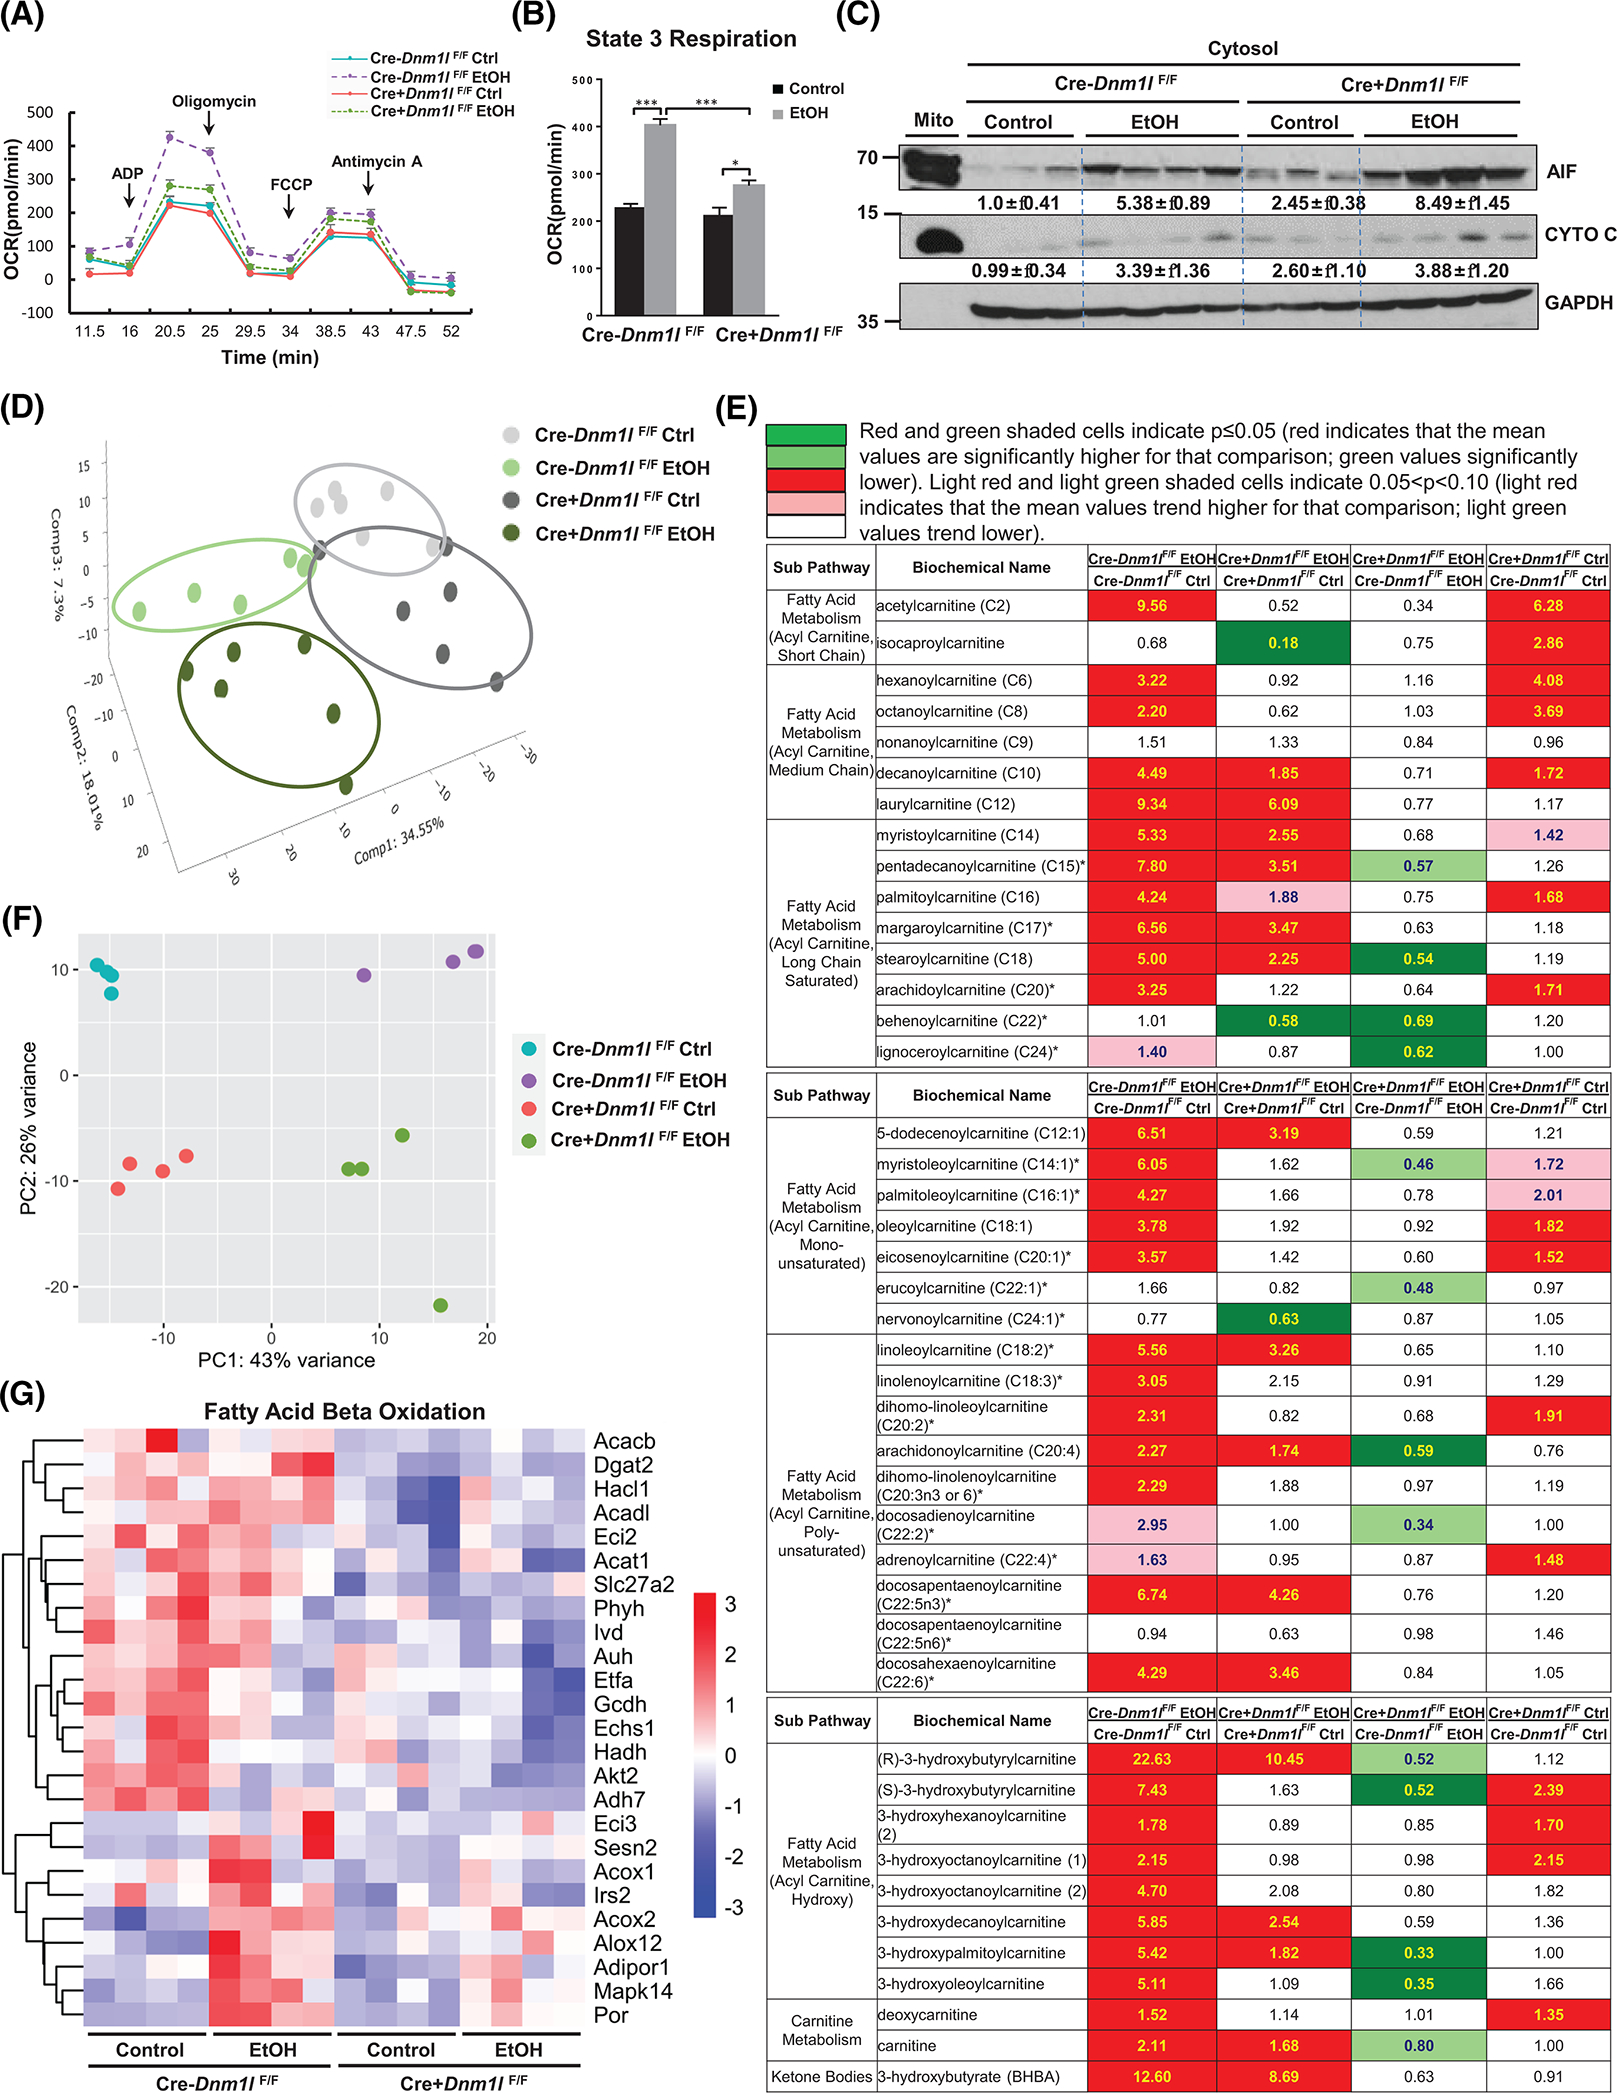
Liver-specific DRP1 knockout (L-DRP1 KO) mice have impaired mitochondrial adaptation to EtOH. Male 2–3-month-old L-DRP1 KO and matched littermates were subjected to Gao-binge alcohol feeding. (A) Pooled mouse liver mitochondria were subjected to bioenergetics analysis using the Seahorse Bioscience XF analyzer (n = 2–4). (B) Quantification of state 3 respiration from (A). (C) Liver cytosol fractions were subjected to western blot analysis. (D) Principal component analysis (PCA) of metabolomic data from indicated mouse liver. (E) Heatmap of fatty acid metabolism of metabolomics analysis of indicated mouse liver tissues (n = 6). (F) PCA of RNA-sequencing (RNA-seq) data. The RNA-seq data are accessible with GSE207074. (G) Heatmap analysis of fatty acid beta-oxidation genes from the RNA-seq dataset. ADP, adenosine diphosphate; EtOH, ethanol; FCCP, carbonyl cyanide p-trifluoromethoxyphenylhydrazone; OCR, oxygen consumption rate; PC, principal component.
EtOH feeding depleted hepatic reduced glutathione (GSH) and oxidized GSH while increasing GSH metabolites ophthalmate and 2-hydroxybutyrate/2-hydroxyisobutyrate, suggesting alcohol induces oxidative stress (Figure S8A). All these metabolic changes except GSH metabolism were attenuated in EtOH-fed L-DRP1 KO mice. Levels of hepatic S-adenosylmethionine decreased but levels of S-methylcysteine and N-acetyltaurine increased after alcohol feeding in both WT and L-DRP1 KO mice (Figure S8B). Overall, alcohol induces hepatic mitochondrial and metabolic adaptation that are impaired by loss of DRP1.
Loss of DRP1 promotes IFNβ production through cGAS-IRF3/7 pathway in mouse liver
Ingenuity Pathway Analysis of transcriptomic data revealed that inflammation-related signaling pathways, including IFN, are highly activated in EtOH-fed L-DRP1 KO mouse livers (Figure S9). Heatmap analysis showed a trend of increased cGAS-STING pathway genes in EtOH-fed WT mice and L-DRP1 KO mice regardless of EtOH feeding, a finding that was further confirmed by qPCR analysis (Figure 7A,B). More importantly, immunohistochemistry staining, real-time quantitative PCR (qPCR), and western blot analysis also revealed activation of the cGAS-STING pathway in human AH liver samples (Figure S10A–D). Levels of cytosolic mtDNA (mitochondrial 16S, ND1, Loop1, and Loop3) significantly increased in L-DRP1 KO mice compared with WT mice fed with EtOH (Figure 7C). We did not find a significant difference in protein levels of hepatic cGAS, STING, and IRF3 in WT and L-DRP1 KO mice with or without EtOH feeding (Figure S11A). The protein levels of cGAS, STING, IRF3, and IRF7 were low in hepatocytes but enriched in Kupffer cells and nonparenchyma cells (NPCs) (Figure S11B). IRF7 immunohistochemistry showed increased staining in NPCs in L-DRP1 KO mice regardless of EtOH feeding (Figure 7D). cGAS mainly located in the nuclei of both hepatocytes and NPCs regardless of the genotypes of the mice (Figure 7E and Figure S12A,B). Western blot analysis of cellular fractions confirmed cGAS enrichment in mouse liver nuclei, which was not affected by EtOH feeding. Interestingly, IRF3, but not IRF7, STING, or p65 was enriched in the mouse liver nuclear fractions (Figure 7F). Levels of serum mtDNA also tended to be increased after EtOH feeding in WT mice and even more so in L-DRP1 KO mice (Figure 7G). Together, these data indicate that the cGAS-STING-IRF pathway is activated in human AH, and loss of hepatic DRP1 promotes cGAS-STING-IRF–mediated immune response in mouse livers.
FIGURE 7.
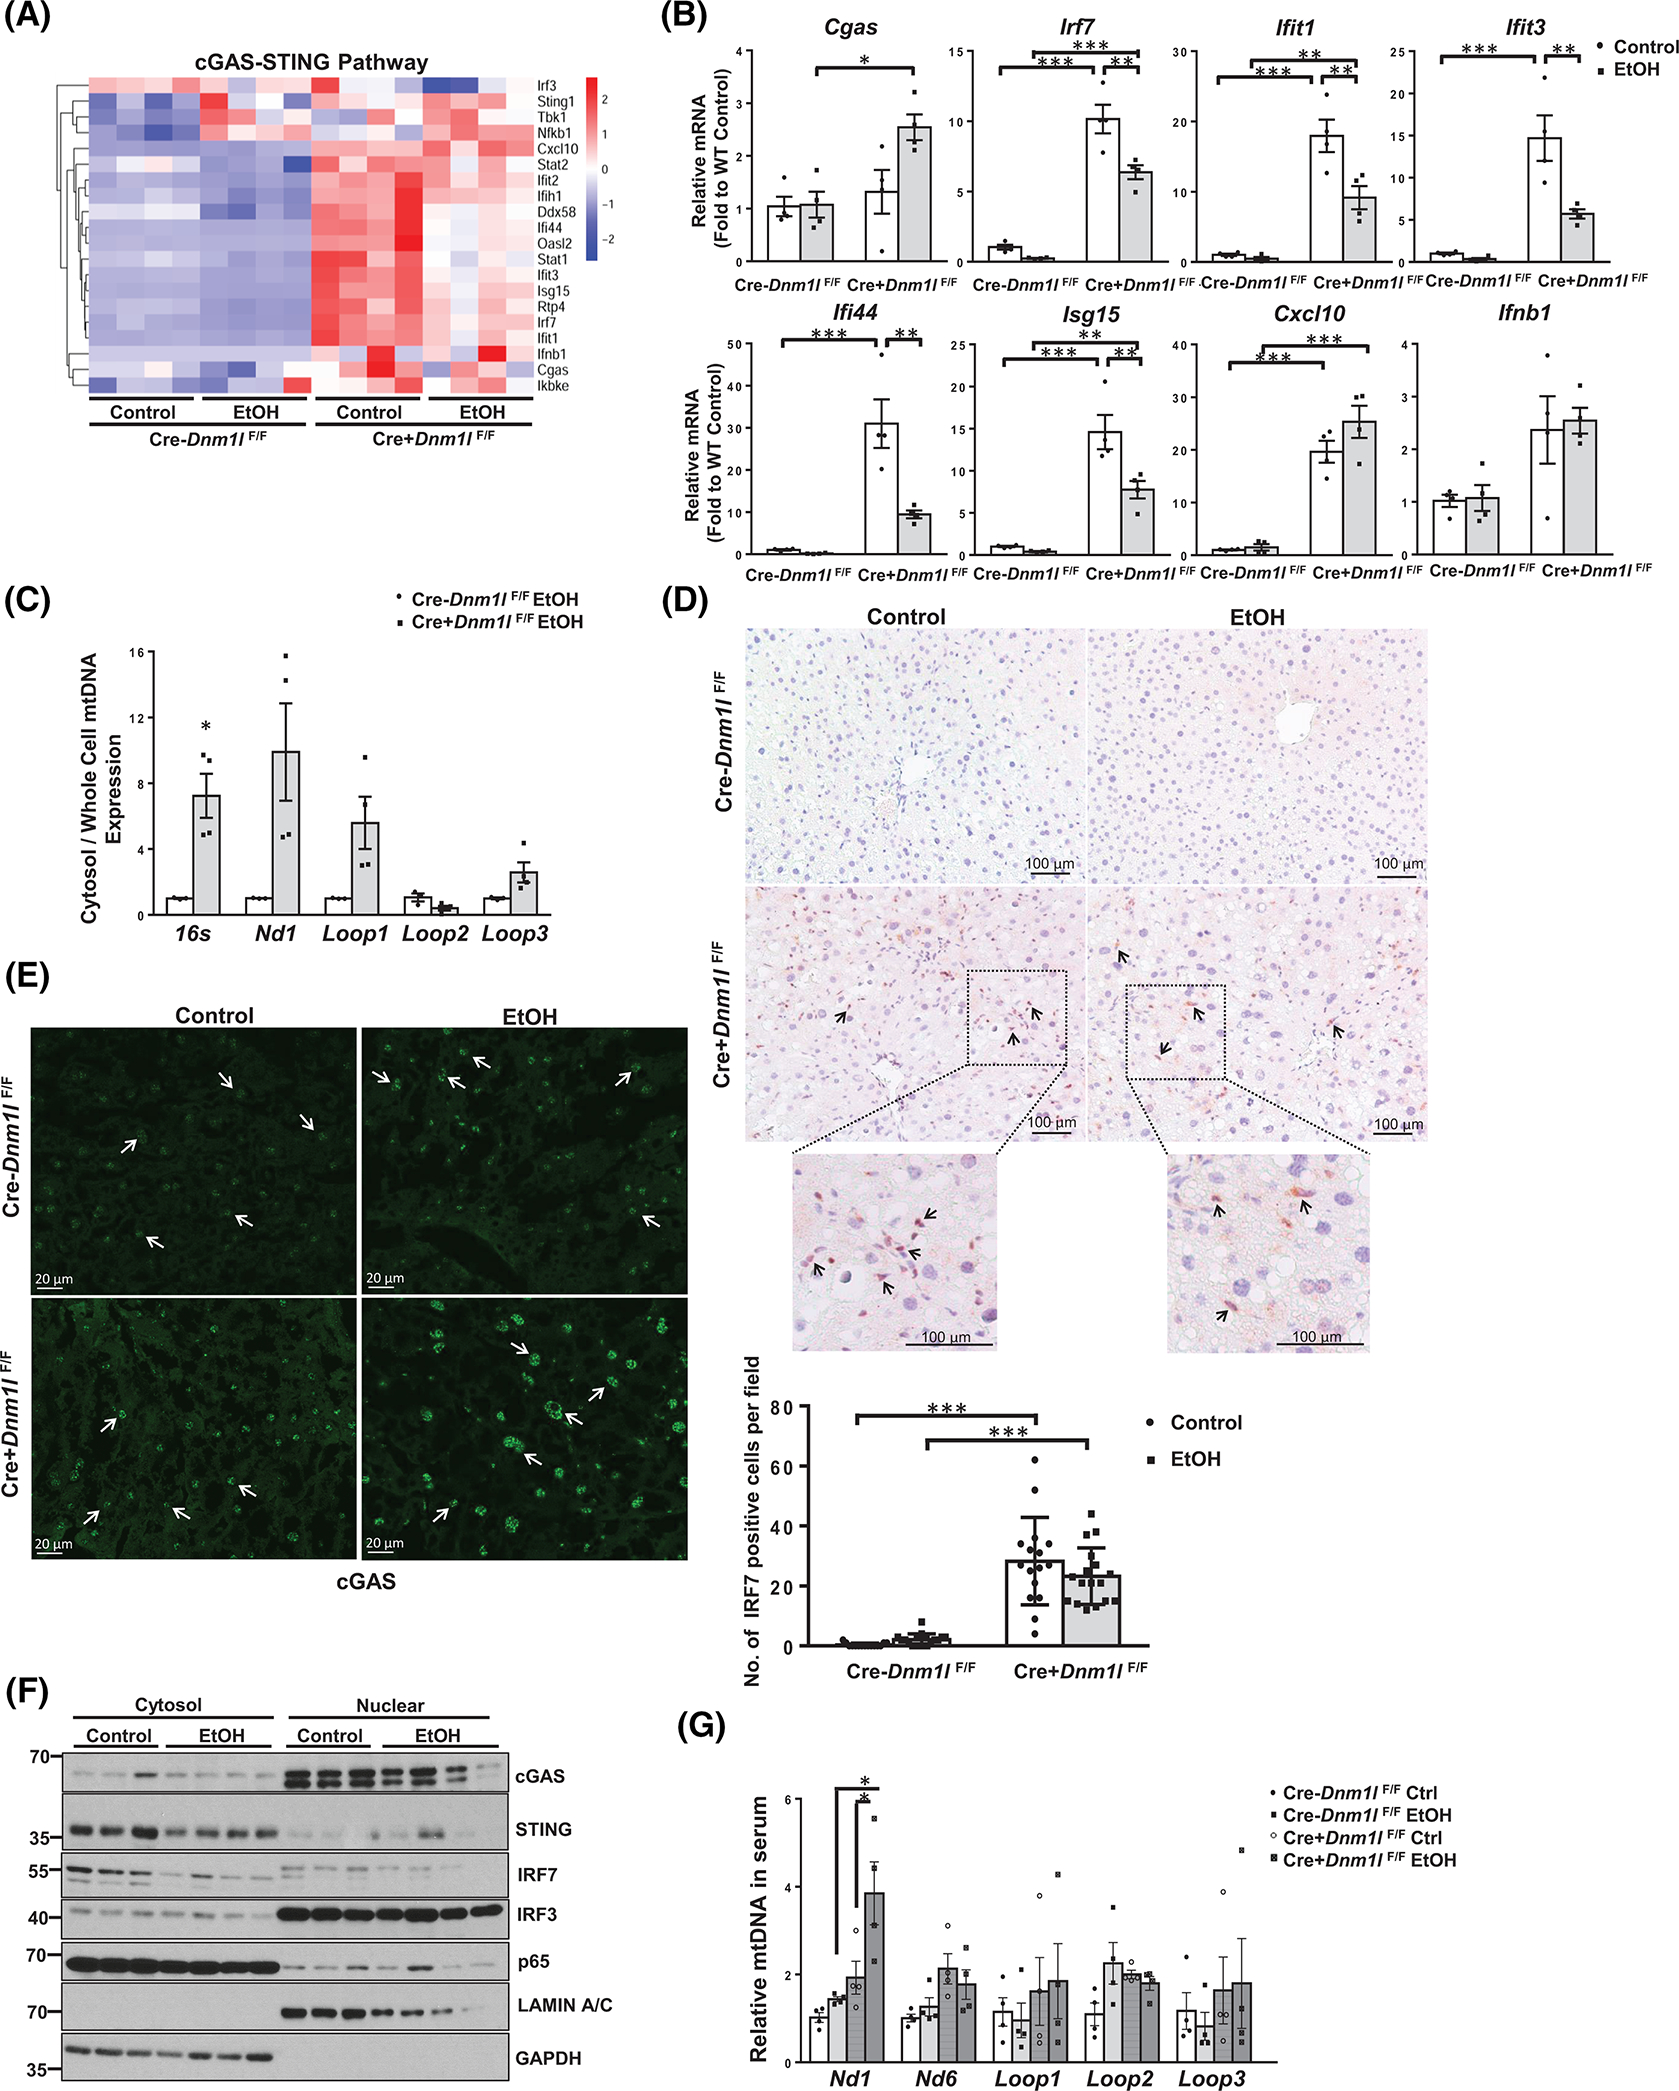
Loss of dynamin-related protein 1 (DRP1) promotes cyclic guanosine monophosphate–adenosine monophosphate synthase (cGAS)–stimulator of interferon genes (STING)–interferon regulatory factor (IRF)3/7 innate immune pathway in mouse liver. (A) Heatmap analysis of cGAS-STING pathway involved genes from the RNA-sequencing dataset of liver tissues of indicated mice fed with Gao-binge alcohol. (B) qPCR analysis of the cGAS-STING pathway genes in mouse liver. (C) DNA in the cytosol and whole cells was purified from isolated hepatocytes of liver-specific DRP1 knockout (L-DRP1 KO) and wild-type (WT) mice fed with Gao-binge alcohol. The relative abundance of mtDNA in the cytosol was quantified by qPCR using the whole-cell mtDNA content as an internal control. IHC staining for IRF7 (D) and immunofluorescence staining for cGAS in mouse livers (E). Arrows denote positive IRF7 stained nonparenchymal cells and nuclear cGAS in hepatocytes. The number of IRF7 positive cells were quantified (n = 3). (F) Liver cytosol and nuclear fractions were subjected to western blot analysis. (G) The relative abundance of mtDNA in serum was quantified by real-time polymerase chain reaction. Data are presented as means ± SEM in (B-C and G) (n = 3–4), means ± SD in (E). *p < 0.05, **p < 0.01, ***p < 0.001; one-way analysis of variance analysis with Bonferroni’s post hoc test. EtOH, ethanol; mRNA, messenger RNA; mtDNA, mitochondrial DNA; qPCR, real-time
Loss of hepatic DRP1 promotes mild endoplasmic reticulum (ER) stress, cytokine production, and immune cell infiltration in mouse liver
We found an increased number of MPO+ neutrophils and CD68+ activated macrophages in the liver of L-DRP1 KO mice regardless of EtOH feeding (Figure 8A–C). Interestingly, most CD68+ activated macrophages were in periportal areas that are argininosuccinate synthase positive in EtOH-fed WT mouse livers but were clustered in glutamine synthetase positive (GS+) central vein areas in L-DRP1 KO mice (Figure S13, Figure 8B, arrows). The energetic immune response in L-DRP1 KO mouse livers was further supported by enhanced mRNA levels of secreted cytokines and chemokines, such as Il1b, Tnfa, Ccl2, and Ccl4, which might stimulate chemotaxis of nearby responsive cells. Moreover, levels of intercellular and vascular cell adhesion molecules Icam1 and Vcam1 were also increased in L-DRP1 KO mouse livers, highlighting the active recruitment of immune cells in L-DRP1 KO mouse livers (Figure 8D).
FIGURE 8.
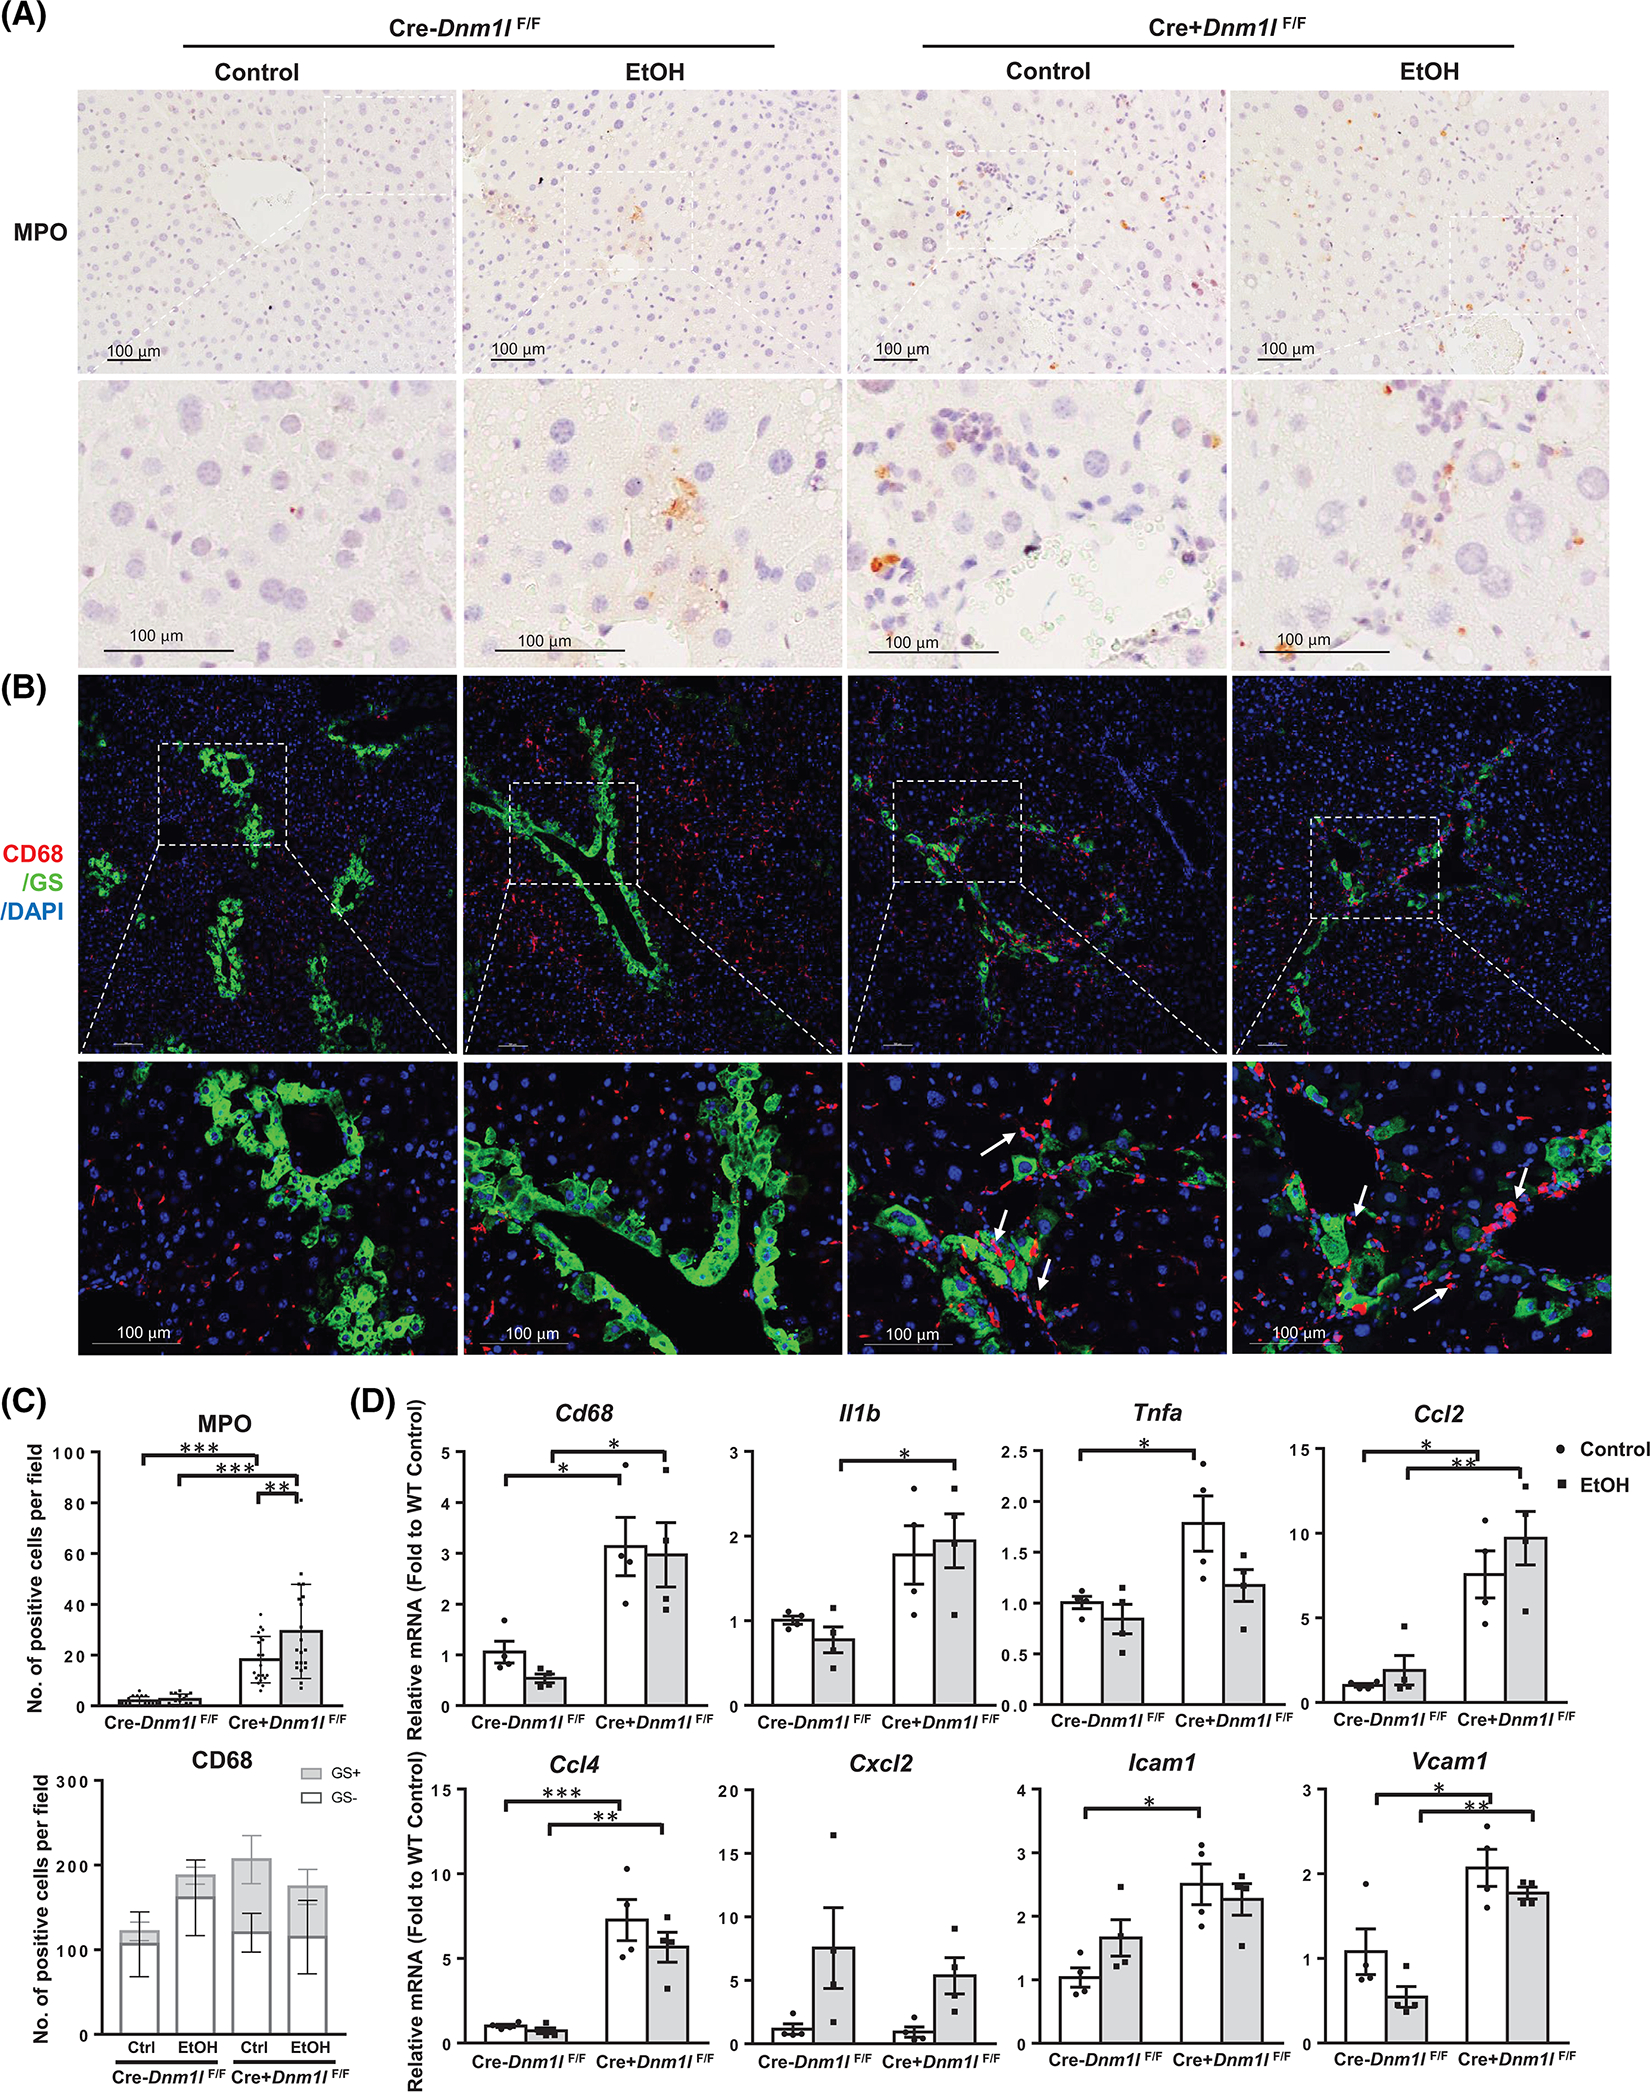
Loss of dynamin-related protein 1 (DRP1) promotes immune cell infiltration in mouse liver. (A) Representative images of immunohistochemistry staining for liver MPO of indicated mice. (B) Representative images of immunofluorescence staining of liver CD68 (red) and glutamine synthetase (GS, green) of indicated mice. Arrows denote macrophages clustered in the central vein region. (C) Quantification of (A) and (B). Data are presented as means ± SD (n = 15 fields from 3 mice). (D) Quantitative real-time polymerase chain reaction analysis of inflammation genes in mouse liver. Data are presented as means ± SEM (n = 4). *p < 0.05, **p < 0.01, ***p < 0.001; one-way analysis of variance analysis with Bonferroni’s post hoc test. DAPI, 4’,6-diamidino-2-phenylindole; EtOH, ethanol; MPO, myeloperoxidase.
Metabolomics analysis revealed a trend of increased lipoxygenase metabolites of eicosanoid products including 12-HEPE, 5-HETE, 15-HETE in EtOH-fed WT mice, which was further increased in EtOH-fed L-DRP1 KO mice. Moreover, levels of many endocannabinoid metabolites were increased significantly in EtOH-fed WT and L-DRP1 KO mice, although loss of DRP1 alone had no significant impact on endocannabinoid metabolites (Figure S14). Some of the endoplasmic reticulum (ER) stress markers such as Ddit3 increased at both mRNA and protein levels in alcohol-fed L-DRP1 KO mice, and the ratio of sXbp1/uXbp1 also tended to be higher at the basal level of L-DRP1 KO mice. The levels of BIP and phosphorylated Eif2α were also higher in L-DRP1 KO mice regardless of alcohol feeding (Figure S15A–C). The activities of caspase3/7 and terminal deoxynucleotidyl transferase dUTP nick end labeling (TUNEL)-positive cells increased in L-DRP1 KO mice regardless of alcohol feeding (Figure S15D,E). Several cytokines such as IL-13, IL-16, IL-1F3, CXCL-9, CXCL-10 and CCL5 also increased in L-DRP1 KO mice (Figure S15F,G). Collectively, these data suggest that loss of hepatic DRP1 may prime a proinflammatory microenvironment for ALD development.
Restoration of hepatic DRP1 protects EtOH-impaired mitophagy and liver injury in WT mice
Overexpression of DRP1 decreased serum ALT levels but not hepatic TG contents in EtOH-fed WT mice (Figure S16A–D). The number of large mitochondria decreased but the number of autophagosomes that enwrap mitochondria (mitophagosomes) increased in EtOH-fed mice with hepatic DRP1 overexpression (Figure S16F–H). Overexpression of DRP1 also increased levels of LC3-II and decreased levels of p62 (Figure S16E), suggesting restoration of DRP1 may improve mitophagy and liver injury in alcohol-fed mice.
DISCUSSION
Changes in mitochondrial morphology with increased accumulation of megamitochondria have been observed in ALD livers, both clinically and experimentally.[7,22–24] However, the role of mitochondria dysfunction in ALD has been controversial, and how increased megamitochondria impact ALD pathogenesis remains elusive. Rats fed with chronic alcohol had decreased mitochondria respiration,[8,25,26] which led to the widely accepted notion that alcohol induces mitochondrial dysfunction. However, chronic alcohol-fed mice have increased mitochondrial respiration with increased number of megamitochondria in the liver.[7] The exact mechanisms that accounted for the difference are unclear but could also be due to specific responses of mitochondria of different species (i.e., rat vs. mouse) to alcohol intake. It has been hypothesized that increased mitochondrial respiration and megamitochondria formation may serve as an adaptive response to alleviate alcohol-induced metabolic stress or to facilitate alcohol metabolism.[7,8] Increased mitochondrial respiration regenerates NAD+, which can be further used for alcohol metabolism via ADH and ALDH2.[8] In the present study, we showed that Gao-binge alcohol-fed mice have increased megamitochondria number, mitochondrial respiratory flux, and hepatic NAD+ levels. Gao-binge alcohol-fed mice also have decreased hepatic glucose, glycolysis, and glycogen metabolism but increased levels of ketone bodies and acylcarnitines, suggesting alcohol feeding shifts of glucose energetic pathways to fatty acid beta-oxidation, which is similar to the metabolic changes found in human AH.[27] Our results suggest a dynamic mitochondrial adaptative response to chronic alcohol intake both morphologically and functionally.
Mitochondrial homeostasis is achieved via several mechanisms including fission and fusion, mitophagy, and biogenesis.[12] The formation of megamitochondria via either decreased fission or increased fusion is generally thought to help maintain mtDNA stability and prevent permanent loss of essential mitochondrial components.[28] Disruption of mitochondrial fusion increases mitochondrial dysfunction resulting in muscle atrophy and neurodegenerative diseases.[29,30] In contrast, inhibition of DRP1-mediated mitochondrial fission in the liver protects against toxicant-induced liver injury and diet-induced NAFLD.[31,32] Moreover, patients with ALD with an increased number of megamitochondria appear to have better outcomes and long-term survival,[33,34] exemplifying the beneficial role of megamitochondria in various diseases including ALD.
Notably, L-DRP1 KO mice fed with either regular chow or control liquid diet have increased basal liver injury despite increased megamitochondria,[31,35] suggesting a complex role of mitochondrial dynamics on cell fate. Likely, the balance between mitochondrial fission and fusion, rather than simply increasing megamitochondria formation, is critical to maintaining cellular function. Indeed, whereas hepatic loss of either DRP1 or the mitochondria fusion protein OPA1 alone in mice leads to liver injury, double deletion of DRP1 and OPA1 blunts liver injury by regaining hepatic mitochondria homeostasis (also called “mitochondria stasis”).[35] Under ALD conditions, the formation of megamitochondria is likely an initial compensatory adaptive response to maintain mitochondrial function in response to alcohol intake. However, one drawback of megamitochondria is that they are difficult to remove via mitophagy because of their size, which is evident in present and previous studies.[15,35] Chronically accumulated megamitochondria eventually accumulate damaged mtDNA or proteins, as damaged mitochondrial proteins/components and mtDNA are unable to be excised because of dysfunctional fission. Increased respiration in alcohol-fed WT mice is likely due to newly formed megamitochondria, whereas most megamitochondria in alcohol-fed L-DRP1 KO were “chronic” (or old) and maladaptive. Our results thus support a novel concept that chronic accumulation of megamitochondria induced by alcohol consumption may lead to mitochondrial maladaptation resulting in liver injury. Alcohol has been shown to affect DRP1-mediated mitochondria dynamics in cardiomyocytes, neuroblastoma cells, and engineered hepatoma cells, although the exact mechanisms remain elusive.[23,36,37] TFEB is a master regulator of lysosomal biogenesis, which is impaired by alcohol consumption in hepatocytes.[20] We have provided findings that TFEB also regulates mitochondria dynamics (fission) by directly regulating DRP1/DNM1L expression.
One important downstream event of mitochondrial dysfunction is dysregulated activation of the innate immune response, which has been implicated in ALD pathogenesis.[38,39] Patients with ALD have increased expression of cGAS and IRF3, which positively correlates with ALD severity.[11,40] Both IRF3-KO mice and L-cGAS-KO mice exhibit attenuated liver injury in response to alcohol feeding, and both transcriptional and nontranscriptional activity of IRF3 contribute to alcohol-induced liver injury.[11,40,41] IRF3 activation in hepatocytes increased type I IFN production and protected against liver injury in a 4-week alcohol feeding mouse model by increasing anti-inflammatory cytokine production from macrophages.[42] IRF3 increases immune cell apoptosis via activating the retinoic acid-inducible gene-I–like receptor-induced IRF-3–mediated pathway of apoptosis in the Gao-binge alcohol mouse model.[40] Although it remains to be confirmed, IRF3 may also increase hepatocyte apoptosis because we found caspase-3 activation and increased release of apoptotic mitochondrial proteins in L-DRP1 KO mice that have elevated phosphorylated IRF3. L-cGAS KO mice were protected against alcohol-induced liver injury, suggesting that hepatocyte cGAS is also critical for amplifying alcohol-induced liver injury, likely through intercellular communication via connexin 32–mediated gap junctions.[11]
Intriguingly, we found that CD68 activated macrophages are more clustered at the pericentral areas in L-DRP1 KO mice but not in WT mice, which is likely due to the more severe impaired mitophagy resulting in more mtDNA accumulation and sterile inflammation in the pericentral area of L-DRP1 KO mice.
Although we found that hepatocytic cGAS-STING-IRF3 correlated with increased liver injury in DRP1 KO mice, future experiments to generate DRP1 and cGAS or DRP1 and IRF3 double KO mice are needed to further dissect the causal role of this pathway in its contribution to liver injury.
We found that alcohol consumption decreases hepatic DRP1 and increases megamitochondria formation in both human AH and experimental mouse ALD models. Although alcohol feeding increased mitochondrial dysfunction (i.e., release of mitochondrial apoptotic proteins and mtDNA), mitochondria underwent an adaptive response by increasing respiration and dynamically remodeling to form megamitochondria possibly at the early phase of ALD. Chronic loss of DRP1 led to mitochondrial maladaptation and impaired mitophagy resulting in dysfunctional innate immune response and aggravated liver injury possibly in the late phase of ALD (Figure S17).
Supplementary Material
ACKNOWLEDGMENTS
We thank Ms. Jennifer Hackett (Genome Sequencing Core of University of Kansas) for her excellent technical assistance.
FUNDING INFORMATION
This study was supported in part by the National Institute of Health funds R37 AA020518, R01 DK102142, U01 AA024733, R01 AG072895 (Wen-Xing Ding), R21 AA026904, R56DK129234 (Hong-Min Ni), R24AA025017 (Zhaoli Sun), R35GM144103 (Hiromi Sesaki), U01AA021908 and U01AA020821 (Ramon Bataller), R01 DK124612 (Wanqing Liu), and R01DK106540 (Wanqing Liu).
Funding information
National Institute of Diabetes and Digestive and Kidney Diseases, Grant/Award Number: R01 DK102142, R01 DK124612 and R01DK106540; National Institute of General Medical Sciences, Grant/Award Number: R35GM144103; National Institute on Aging, Grant/Award Number: R01 AG072895; National Institute on Alcohol Abuse and Alcoholism, Grant/Award Number: R21 AA026904, R37 AA020518, U01 AA024733, U01AA020821 and U01AA021908
Abbreviations:
- AH
alcoholic hepatitis
- ALD
alcohol-associated liver disease
- ALT
alanine aminotransferase
- C
complex
- cGAS
cyclic guanosine monophosphate–adenosine monophosphate synthase
- DRP1
dynamin-related protein 1
- EM
electron microscopy
- GSH
glutathione
- IFN
interferon
- IRF
interferon regulatory factor
- KO
knockout
- L-DRP1
liver-specific DRP1
- MFN
mitofusin
- mtDNA
mitochondrial DNA
- NAD+
nicotinamide adenine dinucleotide
- NADH
nicotinamide adenine dinucleotide hydrogen
- NPC
nonparenchyma cell
- OPA1
optic atrophy 1
- RNA-seq
RNA-sequencing
- STING
stimulator of interferon genes
- TFEB
transcription factor EB
- WT
wild-type
Footnotes
CONFLICT OF INTEREST
Wanqing Liu’s spouse is an employee of GenDx.
SUPPORTING INFORMATION
Additional supporting information can be found online in the Supporting Information section at the end of this article.
REFERENCES
- 1.Nagy LE, Ding WX, Cresci G, Saikia P, Shah VH. Linking pathogenic mechanisms of alcoholic liver disease with clinical phenotypes. Gastroenterology. 2016;150:1756–68. [DOI] [PMC free article] [PubMed] [Google Scholar]
- 2.Gao B, Bataller R. Alcoholic liver disease: pathogenesis and new therapeutic targets. Gastroenterology. 2011;141:1572–85. [DOI] [PMC free article] [PubMed] [Google Scholar]
- 3.Asrani SK, Mellinger J, Arab JP, Shah VH. Reducing the global burden of alcohol-associated liver disease: a blueprint for action. Hepatology. 2021;73:2039–50. [DOI] [PMC free article] [PubMed] [Google Scholar]
- 4.Hoek JB, Cahill A, Pastorino JG. Alcohol and mitochondria: a dysfunctional relationship. Gastroenterology. 2002;122:2049–63. [DOI] [PMC free article] [PubMed] [Google Scholar]
- 5.Mantena SK, King AL, Andringa KK, Eccleston HB, Bailey SM. Mitochondrial dysfunction and oxidative stress in the pathogenesis of alcohol- and obesity-induced fatty liver diseases. Free Radic Biol Med. 2008;44:1259–72. [DOI] [PMC free article] [PubMed] [Google Scholar]
- 6.Mansouri A, Gaou I, De Kerguenec C, Amsellem S, Haouzi D, Berson A, et al. An alcoholic binge causes massive degradation of hepatic mitochondrial DNA in mice. Gastroenterology. 1999;117:181–90. [DOI] [PubMed] [Google Scholar]
- 7.Han D, Ybanez MD, Johnson HS, McDonald JN, Mesropyan L, Sancheti H, et al. Dynamic adaptation of liver mitochondria to chronic alcohol feeding in mice: biogenesis, remodeling, and functional alterations. J Biol Chem. 2012;287:42165–79. [DOI] [PMC free article] [PubMed] [Google Scholar]
- 8.Han D, Johnson HS, Rao MP, Martin G, Sancheti H, Silkwood KH, et al. Mitochondrial remodeling in the liver following chronic alcohol feeding to rats. Free Radic Biol Med. 2017;102:100–10. [DOI] [PMC free article] [PubMed] [Google Scholar]
- 9.Motwani M, Pesiridis S, Fitzgerald KA. DNA sensing by the cGAS-STING pathway in health and disease. Nat Rev Genet. 2019;20:657–74. [DOI] [PubMed] [Google Scholar]
- 10.Ablasser A, Goldeck M, Cavlar T, Deimling T, Witte G, Rohl I, et al. cGAS produces a 2′−5′-linked cyclic dinucleotide second messenger that activates STING. Nature. 2013;498:380–4. [DOI] [PMC free article] [PubMed] [Google Scholar]
- 11.Luther J, Khan S, Gala MK, Kedrin D, Sridharan G, Goodman RP, et al. Hepatic gap junctions amplify alcohol liver injury by propagating cGAS-mediated IRF3 activation. Proc Natl Acad Sci U S A. 2020;117:11667–73. [DOI] [PMC free article] [PubMed] [Google Scholar]
- 12.Ni HM, Williams JA, Ding WX. Mitochondrial dynamics and mitochondrial quality control. Redox Biol. 2015;4:6–13. [DOI] [PMC free article] [PubMed] [Google Scholar]
- 13.Williams JA, Ni HM, Ding Y, Ding WX. Parkin regulates mitophagy and mitochondrial function to protect against alcohol-induced liver injury and steatosis in mice. Am J Physiol Gastrointest Liver Physiol. 2015;309:G324–40. [DOI] [PMC free article] [PubMed] [Google Scholar]
- 14.Ding WX, Li M, Chen X, Ni HM, Lin CW, Gao W, et al. Autophagy reduces acute ethanol-induced hepatotoxicity and steatosis in mice. Gastroenterology. 2010;139:1740–52. [DOI] [PMC free article] [PubMed] [Google Scholar]
- 15.Kageyama Y, Hoshijima M, Seo K, Bedja D, Sysa-Shah P, Andrabi SA, et al. Parkin-independent mitophagy requires Drp1 and maintains the integrity of mammalian heart and brain. EMBO J. 2014;33:2798–813. [DOI] [PMC free article] [PubMed] [Google Scholar]
- 16.Bertola A, Mathews S, Ki SH, Wang H, Gao B. Mouse model of chronic and binge ethanol feeding (the NIAAA model). Nat Protoc. 2013;8:627–37. [DOI] [PMC free article] [PubMed] [Google Scholar]
- 17.Williams JA, Manley S, Ding WX. New advances in molecular mechanisms and emerging therapeutic targets in alcoholic liver diseases. World J Gastroenterol. 2014;20:12908–33. [DOI] [PMC free article] [PubMed] [Google Scholar]
- 18.Ni HM, Bockus A, Boggess N, Jaeschke H, Ding WX. Activation of autophagy protects against acetaminophen-induced hepatotoxicity. Hepatology. 2012;55:222–32. [DOI] [PMC free article] [PubMed] [Google Scholar]
- 19.Argemie J, Latasa MU, Atkinson SR, Blokhin IO, Massey V, Gue JP, et al. Defective HNF4alpha-dependent gene expression as a driver of hepatocellular failure in alcoholic hepatitis. Nat Commun. 2019;10(1):3126. [DOI] [PMC free article] [PubMed] [Google Scholar]
- 20.Chao X, Wang S, Zhao K, Li Y, Williams JA, Li T, et al. Impaired TFEB-mediated lysosome biogenesis and autophagy promote chronic ethanol-induced liver injury and steatosis in mice. Gastroenterology. 2018;155:865–79.e812. [DOI] [PMC free article] [PubMed] [Google Scholar]
- 21.Ma X, Ding WX. A fluorescence imaging based-assay to monitor mitophagy in cultured hepatocytes and mouse liver. Liver Res. 2021;5:16–20. [DOI] [PMC free article] [PubMed] [Google Scholar]
- 22.Uchida T, Kronborg I, Peters RL. Giant mitochondria in the alcoholic liver diseases--their identification, frequency and pathologic significance. Liver. 1984;4:29–38. [DOI] [PubMed] [Google Scholar]
- 23.Palma E, Ma X, Riva A, Iansante V, Dhawan A, Wang S, et al. Dynamin-1-like protein inhibition drives megamitochondria formation as an adaptive response in alcohol-induced hepatotoxicity. Am J Pathol. 2019;189:580–9. [DOI] [PMC free article] [PubMed] [Google Scholar]
- 24.Bruguera M, Bertran A, Bombi JA, Rodes J. Giant mitochondria in hepatocytes: a diagnostic hint for alcoholic liver disease. Gastroenterology. 1977;73:1383–7. [PubMed] [Google Scholar]
- 25.Venkatraman A, Shiva S, Davis AJ, Bailey SM, Brookes PS, Darley-Usmar VM. Chronic alcohol consumption increases the sensitivity of rat liver mitochondrial respiration to inhibition by nitric oxide. Hepatology. 2003;38:141–7. [DOI] [PubMed] [Google Scholar]
- 26.Spach PI, Cunningham CC. Control of state 3 respiration in liver mitochondria from rats subjected to chronic ethanol consumption. Biochim Biophys Acta. 1987;894:460–7. [DOI] [PubMed] [Google Scholar]
- 27.Massey V, Parrish A, Argemi J, Moreno M, Mello A, Garcia-Rocha M, et al. Integrated multiomics reveals glucose use reprogramming and identifies a novel hexokinase in alcoholic hepatitis. Gastroenterology. 2021;160:1725–40 e1722. [DOI] [PMC free article] [PubMed] [Google Scholar]
- 28.Chen H, Chan DC. Physiological functions of mitochondrial fusion. Ann N Y Acad Sci. 2010;1201:21–5. [DOI] [PubMed] [Google Scholar]
- 29.Chen H, Vermulst M, Wang YE, Chomyn A, Prolla TA, McCaffery JM, et al. Mitochondrial fusion is required for mtDNA stability in skeletal muscle and tolerance of mtDNA mutations. Cell. 2010;141:280–9. [DOI] [PMC free article] [PubMed] [Google Scholar]
- 30.Chen H, McCaffery JM, Chan DC. Mitochondrial fusion protects against neurodegeneration in the cerebellum. Cell. 2007;130:548–62. [DOI] [PubMed] [Google Scholar]
- 31.Yang X, Wang H, Ni HM, Xiong A, Wang Z, Sesaki H, et al. Inhibition of Drp1 protects against senecionine-induced mitochondria-mediated apoptosis in primary hepatocytes and in mice. Redox Biol. 2017;12:264–73. [DOI] [PMC free article] [PubMed] [Google Scholar]
- 32.Galloway CA, Lee H, Brookes PS, Yoon Y. Decreasing mitochondrial fission alleviates hepatic steatosis in a murine model of nonalcoholic fatty liver disease. Am J Physiol Gastrointest Liver Physiol. 2014;307:G632–41. [DOI] [PMC free article] [PubMed] [Google Scholar]
- 33.Chedid A, Mendenhall CL, Tosch T, Chen T, Rabin L, Garcia-Pont P, et al. Significance of megamitochondria in alcoholic liver disease. Gastroenterology. 1986;90:1858–64. [DOI] [PubMed] [Google Scholar]
- 34.Altamirano J, Miquel R, Katoonizadeh A, Abraldes JG, Duarte-Rojo A, Louvet A, et al. A histologic scoring system for prognosis of patients with alcoholic hepatitis. Gastroenterology. 2014;146:1231–9.e1231–6. [DOI] [PMC free article] [PubMed] [Google Scholar]
- 35.Yamada T, Murata D, Adachi Y, Itoh K, Kameoka S, Igarashi A, et al. Mitochondrial stasis reveals p62-mediated ubiquitination in parkin-independent mitophagy and mitigates nonalcoholic fatty liver disease. Cell Metab. 2018;28:588–604. e585. [DOI] [PMC free article] [PubMed] [Google Scholar]
- 36.Lim JR, Lee HJ, Jung YH, Kim JS, Chae CW, Kim SY, et al. Ethanol-activated CaMKII signaling induces neuronal apoptosis through Drp1-mediated excessive mitochondrial fission and JNK1-dependent NLRP3 inflammasome activation. Cell Commun Signal. 2020;18:123. [DOI] [PMC free article] [PubMed] [Google Scholar]
- 37.Sivakumar A, Shanmugarajan S, Subbiah R, Balakrishnan R. Cardiac Mitochondrial PTEN-L determines cell fate between apoptosis and survival during chronic alcohol consumption. Apoptosis. 2020;25:590–604. [DOI] [PubMed] [Google Scholar]
- 38.Gao B, Seki E, Brenner DA, Friedman S, Cohen JI, Nagy L, et al. Innate immunity in alcoholic liver disease. Am J Physiol Gastrointest Liver Physiol. 2011;300:G516–25. [DOI] [PMC free article] [PubMed] [Google Scholar]
- 39.Nagy LE. The role of innate immunity in alcoholic liver disease. Alcohol Res. 2015;37:237–50. [DOI] [PMC free article] [PubMed] [Google Scholar]
- 40.Sanz-Garcia C, Poulsen KL, Bellos D, Wang H, McMullen MR, Li X, et al. The nontranscriptional activity of IRF3 modulates hepatic immune cell populations in acute-on-chronic ethanol administration in mice. J Hepatol. 2019;70:974–84. [DOI] [PMC free article] [PubMed] [Google Scholar]
- 41.Petrasek J, Iracheta-Vellve A, Csak T, Satishchandran A, Kodys K, Kurt-Jones EA, et al. STING-IRF3 pathway links endoplasmic reticulum stress with hepatocyte apoptosis in early alcoholic liver disease. Proc Natl Acad Sci U S A. 2013;110:16544–9. [DOI] [PMC free article] [PubMed] [Google Scholar]
- 42.Petrasek J, Dolganiuc A, Csak T, Nath B, Hritz I, Kodys K, et al. Interferon regulatory factor 3 and type I interferons are protective in alcoholic liver injury in mice by way of crosstalk of parenchymal and myeloid cells. Hepatology. 2011;53:649–60. [DOI] [PMC free article] [PubMed] [Google Scholar]
Associated Data
This section collects any data citations, data availability statements, or supplementary materials included in this article.