

Abstract
The cerebral cortex contains billions of neurons, and their disorganization or misspecification leads to neurodevelopmental disorders. Understanding how the plethora of projection neuron subtypes are generated by cortical neural stem cells (NSCs) is a major challenge. Here, we focused on elucidating the transcriptional landscape of murine embryonic NSCs, basal progenitors (BPs), and newborn neurons (NBNs) throughout cortical development. We uncover dynamic shifts in transcriptional space over time and heterogeneity within each progenitor population. We identified signature hallmarks of NSC, BP, and NBN clusters and predict active transcriptional nodes and networks that contribute to neural fate specification. We find that the expression of receptors, ligands, and downstream pathway components is highly dynamic over time and throughout the lineage implying differential responsiveness to signals. Thus, we provide an expansive compendium of gene expression during cortical development that will be an invaluable resource for studying neural developmental processes and neurodevelopmental disorders.
Keywords: cortical development, lineage specification, networks, signaling pathways, transcriptional landscape
Subject Categories: Chromatin, Transcription & Genomics; Development; Neuroscience
An atlas of mouse cerebral cortical cell transcriptome during development reveal patterns of gene expression that correspond to cell fate decisions.
Introduction
The cerebral cortex of vertebrates is an isocortex, composed of six layers of morphologically and functionally distinct neurons. During development, cortical NSCs pass through consecutive stages of mitotic expansion, deep‐ to upper‐layer neurogenesis and then gliogenesis. Most neurons are generated from NSCs through a transient progenitor population, the BPs. Maintenance of progenitor potential and control of cortical fate commitment are regulated through the integration of dynamic signaling pathways organized in space and time, which induces an elaborate interplay between downstream transcriptional networks. Although the molecular nature of mature neurons within the six cortical layers has been described, their corresponding progenitors have not been clearly characterized.
Different hypotheses have been proposed to explain the heterogeneity in the cortical precursor cells in terms of temporal expansion and differentiation potential (Hevner et al, 2003; Molyneaux et al, 2007; Woodworth et al, 2012; Lodato & Arlotta, 2015). One hypothesis states that NSCs switch their fate temporally in coherence with the time points of neurogenesis and thus generate neurons of successive layers of the cortex followed by glial cells (Guo et al, 2013). An alternate hypothesis proposes that NSCs are a multipotent cell pool, wherein each cell would be guided by intrinsic and extrinsic signals to generate a specific selection of neuronal subtypes or glial cells, and these different progenitors are recruited in a sequential manner (Franco et al, 2012). Whether one or both hypotheses are correct remains a major debate.
As RNA sequencing (RNA‐Seq) technology increased over recent years, so has our acceptance of an increasing repertoire of cell types present during cortical development. Particularly single cell sequencing techniques have allowed an ever more detailed transcriptomic analysis of cortical precursor cells (Desai & McConnell, 2000; Fode et al, 2000; Hevner et al, 2003; Haubensak et al, 2004; Arlotta et al, 2005; Gotz & Huttner, 2005; Molyneaux et al, 2007; Stancik et al, 2010; Lui et al, 2011; Greig et al, 2013; Han & Sestan, 2013; Paridaen & Huttner, 2014; Arber et al, 2015; Chuang et al, 2015; Lodato & Arlotta, 2015; Pollen et al, 2015; Liu et al, 2016; Telley et al, 2016, 2019; Ecker et al, 2017; Johnson & Walsh, 2017; Nowakowski et al, 2017; Mukhtar & Taylor, 2018; Rosenberg et al, 2018; Zeisel et al, 2018; Di Bella et al, 2021; La Manno et al, 2021). Frequently, cells are isolated based on positional information or temporal labeling, and this is used to delineate cell type and predict potential (Telley et al, 2019; Di Bella et al, 2021). Although these approaches have been very successful in providing a framework, our understanding of transcriptional programs during brain development and cortical patterning is not complete and some critical points remain. One major challenge is the extreme complexity of the system and the differences in technical approaches undertaken. As RNA‐Seq takes a snapshot in time of gene expression in a population or of single cells, it is challenging to predict the past and future gene expression profile of a cell population. Elegant labeling procedures have provided some insight into cell diversity in the NSC pool and allowed analysis of specific gene function (Telley et al, 2016, 2019). However, it remains unclear how gene expression within the defined populations of NSCs and progenitors in the developing mammalian cortex in vivo change over time and through the lineage as the fate decisions are being made.
In order to compare like‐with‐like and circumvent some of the challenges of random cell selection, we took advantage of the knowledge about murine cortical development and transgenic mice that allow isolation of defined progenitor populations at each day between embryonic day 10.5 (E10.5) and birth (Hebert & Fishell, 2008). We performed bulk and single cell RNA‐Seq to generate gene expression profiles of NSCs, BPs, and NBNs from the dorsal cortex, spanning the critical periods of NSC expansion (E10.5‐11.5), neurogenesis (E12.5‐16.5), and gliogenesis (E17.5‐PN1). From these data catalogs, we elucidated the transcriptional landscapes of NSCs, BPs, and neuronal subtypes and systematically followed robust temporal dynamics in their gene expression through cortical development. We determined an amazing dynamic heterogeneity within these progenitor populations at the single‐cell level, identifying individual clusters of NSC, BP, and NBN subtypes and providing gene signatures for each of these clusters. We evaluated the changes in signaling pathway component expression during cortical development and identified receptors, ligands, and downstream signaling pathways that potentially play critical roles in cortical development. Finally, we found that the transcriptional programs that define specific cortical neuron types are active in NSCs prior to the birth of the neurons. Our work provides a versatile and comprehensive resource that will be useful to address gene expression but also novel aspects of NSCs fate choice and neuronal cell subtype generation.
Results
Transcriptional analyses validate the selection and sorting procedure
Canonical Notch signaling in the developing cortex suppresses NSC differentiation by repressing expression of proneurogenic transcription factors while promoting proliferation and survival (Gaiano & Fishell, 2002; Dang et al, 2006; Mason et al, 2006; Kageyama et al, 2009; Imayoshi et al, 2010). Hes5 is a transcriptional target of Notch signaling and labels NSCs at all stages of development and in the adult (Lugert et al, 2010, 2012; Basak et al, 2012; Bansod et al, 2017). Conversely, Eomes (Tbr2) is expressed by BPs and committed neural progenitors (Arnold et al, 2008; Sessa et al, 2017). Hes5::GFP labels NSCs in the ventricular zone and Tbr2::GFP BPs and NBNs in the subventricular zone and developing cortical plate (Fig EV1A and B) (Basak & Taylor, 2007; Arnold et al, 2009).
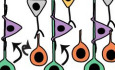
Figure EV1. Experimental paradigm and validation of the transcriptional analyses.
-
AHes5::GFP and Tbr2::GFP transgenic mice used for cell isolation.
-
BExpression of Hes5::GFP and Tbr2::GFP embryonic cortices at E17.5. Scale bar = 100 μm. Arrowheads pointing to Tbr2::GFP cells in VZ. Immunostainings for Pax6 and Tbr2 with Hes5::GFP and Tbr2::GFP coronal sections from E17.5. Arrows point to GFP+Pax6+ cells and arrowheads point to GFP+Tbr2+ cells. Scale bare = 100 μm.
-
CExamples of FACS plots for GFP positive cell sorting at E14.5 Hes5::GFP and E15.5 Tbr2::GFP.
-
D–FExpression validation of Hes5::GFP and Tbr2::GFP positive cells after FAC sorting in vitro. Scale bar = 20 μm.
-
GExpression plots of some known markers of NSCs. Each dot defines the mean and lines define the SD. Three to four biological replicates were collected for each time point.
-
HHeatmap showing differentially expressed genes in three cell populations illustrating NSCs, BPs and NBNs vary in expression, based on z‐scored log2(TPM) expression values.
-
IBar plot representing the proportion of variance covered by each PC in PCA of all cell types.
-
J, L, NVolcano plots for DEG analysis for NSCs versus BPs, NSCs versus NBNs and BPs versus NBNs, respectively. Significantly DEGs are colored as gray and top 100 DEGs are colored by red.
-
K, M, OTop 10 DEGs for NSCs versus BPs, NSCs versus NBNs, and BPs versus NBNs, respectively. Central band is the median, the whiskers define the upper and lower limit, and the box defines the interquartile ranges. (J–O) are related to analysis of Fig 1E. The range of P‐values is very different: NSC (0.01–0.4%), BP (1.6–4.9%), NBN (0.06–0.2%). There are no good marker genes for BPs as their gene expression tends to be similar to either NSC or NBN.
To address changes in gene expression within the NSC, BPs, and early neurons of the cortical neural lineages, cells were sorted from individual Hes5::GFP and Tbr2::GFP embryos at each day of development between embryonic day 10.5 (E10.5) and birth (PN), and RNA‐Seq performed on the samples from each embryo separately (Figs 1A and EV1A and B). E10.5‐PN1 covered the embryonic stages of cortical development from NSC expansion (E10.5‐E11.5), through neurogenesis (E12.5‐E16.5) to gliogenesis (E17.5‐PN). We showed previously that Hes5::GFP + cells in the VZ of the developing dorsal telencephalon express Pax6 and radial glial proteins including GLAST and Nestin (Fig EV1B; Basak & Taylor, 2007). A few newly generated Tbr2+ BPs in the apical VZ express residual Hes5::GFP, which is lost before the cells reach the SVZ (Basak & Taylor, 2007). All Pax6 cells in VZ express Hes5::GFP but those in the SVZ do not (Fig EV1B; Basak & Taylor, 2007; Lugert et al, 2012). Conversely, Tbr2::GFP is not expressed by radial glia in the VZ but localizes with Tbr2 in the SVZ.
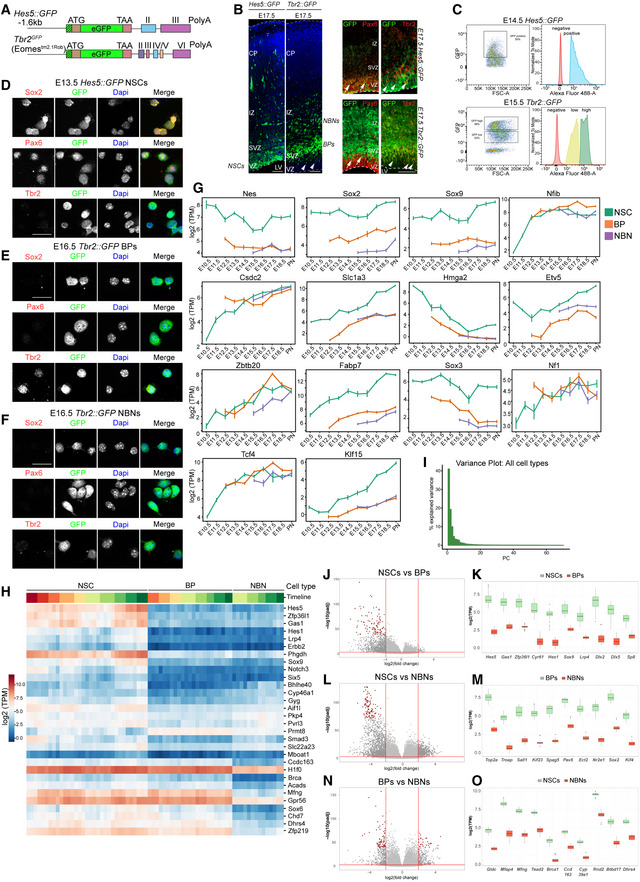
Figure 1. Overview and validation of the transcriptional analyses.
- Overview of the biological system with experimental paradigm, illustrating NSCs, BPs, and NBNs were isolated at each day during development from E10.5 to PN.
- Notch signaling effector Hes5 is expressed high in NSCs while Eomes (Tbr2) and Btg2 are expressed high in both NSCs and BPs at the mRNA level. Each dot defines the mean and lines define the Standard Deviation (SD). Three to four biological replicates were collected for each time point.
- Heatmap validating the known cell‐type specific marker gene expression from RNA sequencing data.
- Principal Component Analysis (PCA) projection of all samples of NSCs, BPs, and NBNs throughout development onto the first two principal components (PCs) covering maximum variance reveals that PC1 sorts samples by cell type and PC2 sorts samples by developmental stage.
- Heatmap illustrating the novel marker genes identified from the RNA sequencing data, as signature genes for NSCs, BPs, and NBNs. BPs, basal progenitors; E, embryonic day; IZ, intermediate zone; NBNs, newborn neurons; NSCs, neural stem cells; PN, post natal; SVZ, subventricular zone; VZ, ventricular zone. Expression values on the heatmaps are log2 (transcripts per million).
We gated on Hes5::GFP high cells at all time points excluding low and negative cells (Fig EV1C). Immunostaining of acutely sorted Hes5::GFP + cells showed expression of the NSC‐associated proteins Sox2 and Pax6 but not Tbr2 (Fig EV1D). Tbr2::GFP + cells were first detectable by FACS at E12.5 corresponding to the prominent appearance of BPs in the developing dorsal cortex (Arnold et al, 2009). From E15.5 on, the Tbr2::GFP + population was divided into GFPhigh, GFPlow, and GFP− populations (Fig EV1C). We separated Tbr2::GFP low and Tbr2::GFP high cells and analyzed these populations separately. Sorted Tbr2::GFP high cells expressed low levels of Sox2 and Pax6 and high levels of Tbr2 denoting them as BPs (Fig EV1E). Sorted Tbr2::GFP low cells did not express Sox2 and Pax6 and had lower levels of Tbr2 than the BPs (Fig EV1F). We reasoned that the Tbr2::GFP low cells were immature NBNs labeled by low levels of Tbr2 and perduring GFP.
As proof of concept, Hes5 RNA levels were high in the NSCs populations at all developmental time points and low in the Tbr2::GFP + samples (Fig 1B). As expected, the transcripts of the BP markers Tbr2 and Btg2 were highly expressed by Tbr2::GFP high cells at all stages from E12.5‐PN1 consistent with being dorsal cortical BPs and at lower levels by Tbr2::GFP low NBNs (Fig 1B). Tbr2 and Btg2 transcripts were detected in the NSC samples without detectable protein, confirming previous observations (Figs 1B and EV1B and D–F; Pollen et al, 2015; Mukhtar et al, 2020). These points demonstrate the challenges of allocation of cell type based on transcriptional activity of a few “marker” genes.
Interrogation of the RNA‐Seq data revealed that NSCs, BPs, and NBN transcriptomes were remarkably similar, and few genes were differentially expressed between NSCs and BPs (Fig 1C). We analyzed the dynamics in expression of known NSC, BP, and NBN markers between E10.5 and PN1 (Figs 1C and EV1G and H). NSC markers were highly expressed throughout cortical development with characteristic temporal dynamics in the NSC populations (Gotz & Huttner, 2005; Molyneaux et al, 2007; Ohtsuka et al, 2011; Pollen et al, 2015; Mukhtar & Taylor, 2018).
Known BP markers, including Nfib, Ngn2, Tcf4, and Neurod1, were highly expressed throughout cortical development by BPs. Astrocytic markers including S100b, ApoE, Gfap, and Aldoc were expressed highly by NSCs isolated late in development corresponding to the onset of gliogenesis indicating that the glial transcriptional program had already been initiated (Zhang & Barres, 2010; Molofsky et al, 2012; Liddelow & Barres, 2015). Similarly, key markers for oligodendrocytes including Pdgfd, Sox10, Cspg4, and Sox9 were expressed higher by late‐stage NSCs corresponding to the last wave of oligodendrogenesis originating in the ventricular zone of the dorsal cortex (Ono et al, 2008; Zhang & Barres, 2010; Takebayashi & Ikenaka, 2015). The mature neuronal markers Grin2a, Chat, Bdnf, and Igf1 were expressed at very low levels by the Hes5::GFP and Tbr2::GFP sorted cells indicating that the selection process isolated progenitors and excluded mature neurons (Figs 1C and EV1G; Sarnat, 2013).
Unbiased computational analyses revealed extensive transcriptional dynamics within the different cell types. Principal component analysis (PCA) showed that the first two principal components (PC) capture 60% of the total variance in gene expression (Fig EV1I). Remarkably, the first PC largely separated the samples based on cell type (NSC, BP and NBN), whereas the second PC orders samples by differentiation state for all three cell types (Fig 1D). This latter observation indicates that NSCs, BPs, and NBNs change their transcription in a similar direction with developmental stage. The projection onto the first two PCs indicated that BPs and NBNs are transcriptionally closer to NSCs in the neurogenic phase of cortical development than those in the expansion and gliogenic phases. While the NBNs cleanly separate from the other cell types along the first PC, the BPs were positioned between NBNs and the NSCs in the neurogenic phase, which they partially overlapped, consistent with the BPs being a transient neuronal precursor population (Fig 1D). Compared with BPs and NBNS, the NSCs displayed much larger variation in gene expression across time on the first two PCs, with a fluid separation from the expansion to neurogenesis and gliogenesis phases. Subsequently, we performed pairwise differentially expressed gene analyses (DEG) between the different cell types (Figs 1E and EV1J–O). To exclude substantial contamination of the Hes5::GFP high sorted cells with BPs and NBNs, we identified transcripts that were highly expressed by BPs and NBNs but not by NSCs (Fig EV1J–O). Thus, although the transcriptomes of NSCs and BPs are remarkably similar, the sorting procedures were effective in enriching stem from progenitor populations throughout cortical development. We identified novel markers for NSCs, BPs, and NBNs using two independent methods—DEGs and Z‐score log2 (TPM) expression values (Dataset EV1). Genes including Sp9, Cyr61, Yap1, Hes1, Lfng, and Notch3 are highly expressed by NSCs. Identification of these signature genes using an unbiased approach is an independent validation of the approach as the functions of some have been studied in NSCs. The Hippo co‐activator Yap1, Notch signaling components Hes1, Lfng are involved in NSC proliferation and maintenance (Pourquie, 2003; Bray, 2006; Takebayashi & Ikenaka, 2015). Gucy1b3, Nhlh1, and Serping1 were highly expressed by BPs and novel markers of the cell type in the lineage but not much is known about their function (Lipkowitz et al, 1992). Ntm, Nrip1 are expressed higher in NBNs than in BPs or NSCs also providing novel markers (Gil et al, 1998). Interestingly, DEG analyses revealed that the majority of the highly expressed genes in NSCs are downregulated by BPs and reduced further by NBNs.
Temporal dynamics in transcriptional landscapes of NSCs, BPs, and NBNs based on gene expression
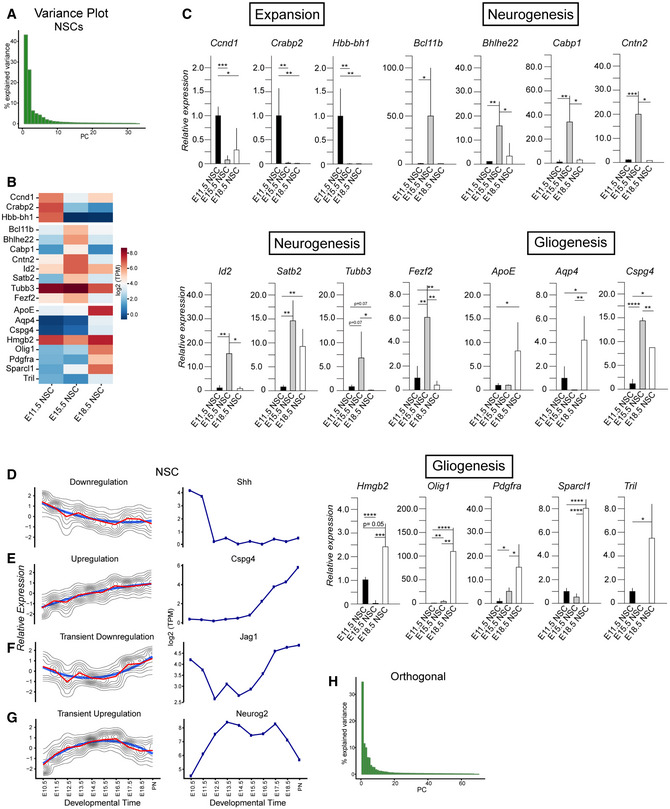
Our analyses showed that NSCs displayed maximum variance over time and therefore contribute heavily to the first two PCs. To understand the transcriptional dynamics in the NSCs, we performed PCA focusing only on the NSCs. The first two PCs covered almost 70% of the total variance and exposed a dynamic transcriptional path among the phases of expansion, neurogenesis, and gliogenesis (Figs 2A and EV2A). Although the NSCs were isolated using the same characteristic, Hes5::GFP high expression, we observed striking, stage‐related dynamic movement through transcriptional space. PCA indicated that NSCs could follow a continuous path from expansion through neurogenesis to gliogenesis, consistent with the common origin model of sequential cell specification over time. Surprisingly, Hbb‐bh1, Hba‐x, and Hbb‐y expression distinguished NSCs in the expansion phase (PC1 negative axis) from those in the neurogenic and gliogenic phases (Fig 2B). Although hemoglobin subunits are predominantly associated with erythrocytes and oxygen transport from the lungs, hemoglobin subunits are also expressed in the brain and by neurons (Brown et al, 2016). Hemoglobin subunits are found in the mitochondria in neurons and may assist oxygen transport across mitochondria membranes. As NSCs are mitotically highly active and require extensive energy for cell division, it is possible that hemoglobin supports the energy requirements during the expansion phase.
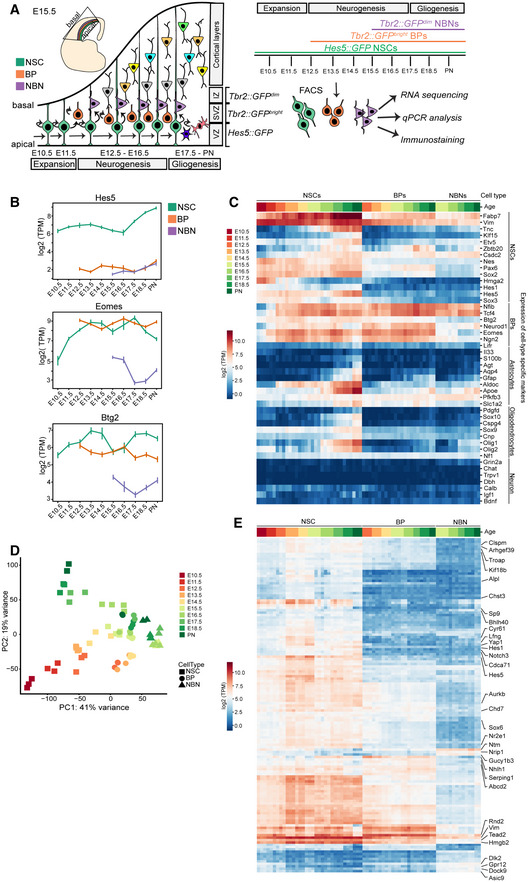
Figure 2. Dynamics of transcriptional profile changes in different populations over time.
- PCA of NSCs from E10.5 to PN showing their transcriptional dynamics.
- Heatmap of genes that have the highest contribution to the PC1 and PC2 for NSCs, sorted by their projection on the PC axis (250 most positive and 250 most negative, Dataset EV2).
- Projections of the expression profiles of example genes onto the first two PCs, showing the developmental stage at which, they are most highly expressed.
- Expression profiles of PC1 and PC2 along developmental time (top) and expression profiles of the top three genes with highest negative and positive projection on PC1 (first and second column) and highest negative and positive projection on PC2 (third and fourth column) for NSCs.
- PCA of all samples after removal of the first two principal components of the expression profiles of NSCs separates samples by cell type.
- Heatmap of genes that have the highest contribution to the PC1 and PC2, sorted by their projection on the PC axis (250 most positive and 250 most negative).
- Projections of the expression profiles of example genes onto the first two PCs, showing their differential expression across cell types.
- Expression profiles of PC1 and PC2 across all samples with time from left to right and NSCs in green, BPs in red, and NBNs in purple (top), and the gene expression profiles of top three genes with highest negative and positive projection on PC1 (first and second column) and highest negative and positive projection on PC2 (third and fourth column).
- PCA of BPs from E12.5 to PN showing their transcriptional dynamics.
- As in panel (B) but now for BPs.
- As in panel (C) but now for BPs.
- As in panel (D) but now for BPs.
- PCA of NBNs from E15.5 to PN showing their transcriptional dynamics.
- As in panels (B) and (J) but now for NBNs.
- As in panels (C) and (K) but now for NBNs.
- As in panels (D) and (L) but now for NBNs.
Data Information: In (D), (H), (L), and (P) (bottom), the x‐axis is embryonic days, and the y‐axis is log2(TPM).
Figure EV2. Experimental validation of transcriptional profile changes in NSCs over time.
-
ABar plot representing the variance coverage by PC corresponding to PCA plot in Fig 2A.
-
BHeatmap illustrating the expression changes in signature genes in time points corresponding to expansion, neurogenesis, and gliogenesis.
-
CqPCR validation of signature genes in three zones. Each time point has samples varying from N = 3 to N = 7 biological replicates. (Statistical test used‐ Unpaired Student's t‐test, *P < 0.05, **P < 0.01, ***P < 0.001, ****P < 0.0001).
-
D–Gk‐Means clustering of z‐scored log2 (TPM) gene expression profiles over developmental time course in NSCs with genes showing upregulation, e.g., Cspg4, downregulation, e.g., Shh, transient downregulation, e.g., Jag1, transient upregulation, e.g., Neurog2.
-
HBar plot representing the variance coverage by PC corresponding to PCA plot in Fig 2E.
By contrast, Neurod6, Cntn2, Slc17a7, and Nfix separated NSCs in the neurogenic phase along the PC2 negative axis from those in the expansion and gliogenic phases. Neurod6 is a Helix‐Loop‐Helix (HLH) transcription factor (TF) that plays a prominent role in neuronal differentiation (Sommer et al, 1996). Neurod6 is transcriptionally activated by Neurog1 and Neurog2, two proneural HLH TFs that are downstream of Notch signaling (Ross et al, 2003). Neurod6 is associated with familial temporal lobe epilepsy and attention deficit hyperactivity disorder in humans (Tutukova et al, 2021). Cntn2 is a member of the Contactin family of immunoglobulin cell adhesion molecules and functions in neuronal differentiation, determination, and migration as well as axon guidance (Mohebiany et al, 2014). Cntn2 is located at 1q32.1, a region associated with microcephaly, and mutations in Cntn2 cause familial adult myoclonic epilepsy 5 (FAME5) (Rickman et al, 2001; Stogmann et al, 2013; Mohebiany et al, 2014). Slc17a7 is a transmembrane channel and urea transporter. It is selectively expressed in NSCs compared with BPs and NBNs, and its expression increases with developmental stages. The function of Slc17a7 in NSCs remains to be shown. Nfix is a member of the nuclear I family of TFs. Nfix regulates NSC proliferation and differentiation both during embryonic development and in the adult and has been proposed to be a tumor suppressor in gliomas (Heng et al, 2015; Stringer et al, 2016). Loss of Nfix is associated with increased proliferation in the SVZ of the embryonic brain and delayed gliogenesis (Heng et al, 2015; Stringer et al, 2016). In summary, the unbiased analysis of gene expression revealed novel markers of stage specific NSCs and potential regulators of differentiation in the dramatic switch from the expansion to neurogenic phases of cortical development.
The unbiased computational approach identified genes important in NSC maintenance and differentiation as well as a plethora of novel and dynamically expressed NSC genes (Pollen et al, 2015; Telley et al, 2016, 2019). We validated the expression of the novel signature genes predicted by the PC separations by RT‐qPCR on independent biological replicates (Figs 2B and EV2B and C; Dataset EV2). We randomly selected genes differentially expressed by NSCs during the expansion, neurogenic and gliogenic phases. Ccnd1, Crabp2, Hbb‐bh1 are highly expressed during the expansion phase; Bcl11b, Cntn2, Id2, Satb2 during neurogenic phase; and ApoE, Aqp4, Sparcl1, Tril during the gliogenic phase (Fig EV2C; Dataset EV2). By clustering the gene expression profiles, we identified pools of genes that follow the same transcriptional trajectory in NSCs over time. This implied either co‐regulation at the transcriptional level or gene expression associated with distinct cell states (Fig EV2D–G). Some genes within these profiles are typical markers of the different phases of NSC development. For example, Neurog2 and Cspg4 mark the neurogenic and gliogenic phases of NSCs, respectively. Others, including Shh, mark specifically the early expansion phase and their expression is: low upon the onset of fate determination (Fig EV2D–G).
To address the transcriptional changes among the BPs and NBNs, we excluded the predominant variance resulting from the NSCs shifts in gene expression by computing PCs of all the samples orthogonal to the first two PCs of the NSCs. PCA of the remaining variables clustered all NSCs together indicating their underlying identity. BPs and NBNs separated in transcriptional space. Thus, the data orthogonal to the first PCs of NSCs enhanced the differences between NSCs, BPs, and NBNs (Fig 2E) and increased the separation of BPs and NBNs, revealing a clear separation of BPs at early (E12.5‐E14.5) and late (E15.5‐PN) time points of cortical development (Figs 2E and F and EV2H). In these analyses, NBNs showed less transcriptional dynamics over time. We performed pairwise comparisons to reveal DEGs genes contributing to PCs in the orthogonal analyses. Genes including Dlx1, Dlx5, and Dlx2 separate NSCs while Tbr2, Nhlh1 represent the highest loading along the orthogonal PC1 negative axis. Crym, Pf4, and Crlf4 separated BPs and NBNs along the orthogonal PC1 positive axis (Fig 2F–H; Dataset EV2).
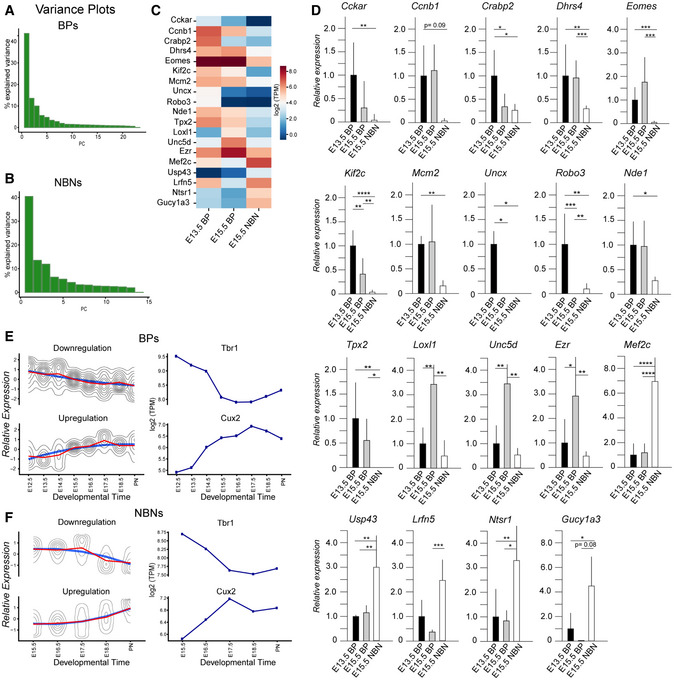
To investigate the stage‐correlated changes in gene expression by BPs and NBNs, we performed PCAs on BPs and NBNs separately. Despite being selected based on differences in level of Tbr2::GFP expression, PCA displayed continuous dynamics in these populations over time. However, the first PC was sufficient to separate BPs based on developmental stage (Figs 2I–L and EV3A). From these analyses, we identified Fezf1, Samd3, Robo3 to be highest in early BPs while Tac2, Dhrs3, Sh3rf3 were expressed higher by late BPs. Therefore, we could define distinct gene profiles for BPs that reflected their developmental stage implying that BPs are also a heterogeneous population of intermediate cells. Similarly, the first PC was also sufficient to separate NBNs over the course of development (Figs 2M–P and EV3B). In order to validate the novel signature genes separating BPs and NBNs, we performed RT‐qPCR on independent biological replicates (Fig EV3C and D; Dataset EV2), which confirmed the differential expression of the signature genes between early BPs, late BPs, and their corresponding NBNs. Cckar, Kif2c, Uncx, Robo3 were highly expressed by early BPs while Loxl1, Unc5d, Ezr were highly expressed by late BPs. On the contrary, NBNs displayed high expression of Mef2c, Usp43, Lrfn5, Ntsr1, and Gucy1a3 (Fig EV2D). A more comprehensive list of these DEGs is available in Dataset EV2. Thus, by our preliminary analyses of gene expression, we demonstrate dynamics in NSCs, BPs, and NBNs and have identified novel signature genes, which are binary and unique for these populations.
Figure EV3. Experimental validation of transcriptional profile changes in BPs and NBNs over time.
-
A, BBar plots representing the variance coverage by PCs corresponding to PCA plot in Fig 2I and M.
-
CHeatmap illustrating the expression changes in signature genes in time points corresponding to early BPs, mid‐BPs, and NBNs.
-
DqPCR validation of signature genes for three sample types. Each time point has samples varying from N = 3 to N = 7 biological replicates (statistical test used—Unpaired Student's t‐test, *P < 0.05, **P < 0.01, ***P < 0.001, ****P < 0.0001).
-
Ek‐Means clustering of z‐scored log2(TPM) gene expression profiles over developmental time course in BPs with genes showing downregulation, e.g., Tbr1 and upregulation, e.g., Cux2.
-
Fk‐Means clustering of z‐scored log2(TPM) gene expression profiles over developmental time course in NBNs with genes showing downregulation, e.g., Tbr1 and upregulation e.g., Cux2.
Temporal dynamics in transcriptional landscapes of NSCs, BPs, and NBNs is based on TF nodes and networks
To characterize the transcriptional states of NSCs, BPs, and NBNs and map the activities of TFs throughout cortical development, we used the Integrated System for Motif Activity Response Analysis (ISMARA) (Balwierz et al, 2014; Artimo et al, 2016). ISMARA infers the regulatory states of samples by computationally predicting transcription factor binding sites (TFBSs) genome‐wide and modeling the observed gene expression state of each sample in terms of the predicted TFBS and “activities” of the TF binding motifs (Fig 3A, https://ismara.unibas.ch/NeuroStemX/). PCA of the motif activities revealed that, in agreement with the observations made based on mRNA expression (Fig 2A), the majority of the variance across samples was dominated by differences within the NSC samples. Therefore, we first analyzed the NSCs from all time points in isolation and then analyzed NSCs from the neurogenic phase of development together with the BPs and NBNs.
Figure 3. Dynamics of transcriptional network changes with ISMARA in different populations over time.
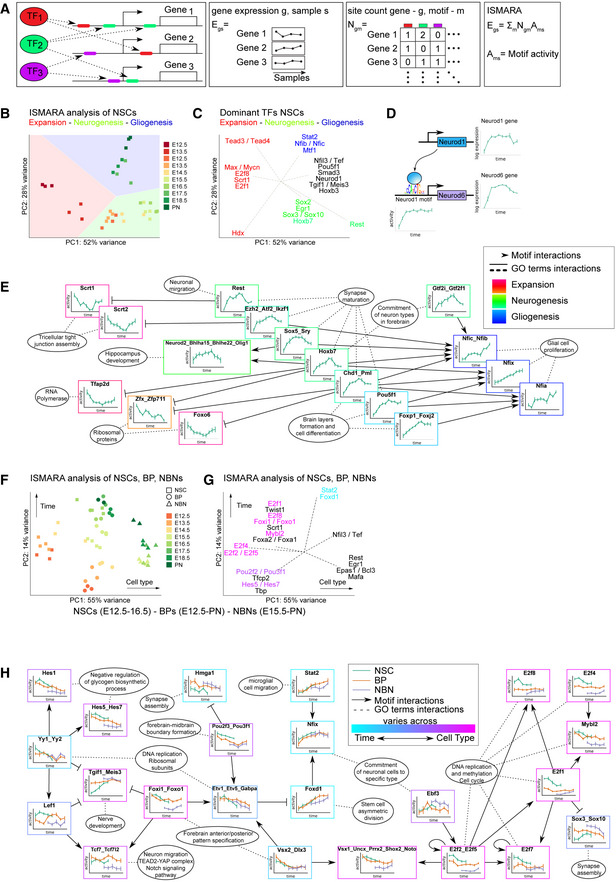
- Conceptual illustration of ISMARA, which models gene expression profiles in terms of the activities of TF binding motifs. ISMARA models the matrix of gene expression E as a linear function of computationally predicted TF binding sites in the promoters of each gene (site count matrix N) and activities of TF binding motifs across samples (matrix A).
- PCA projection of the motif activity profiles of the NSCs for all time points onto the first two PC components, which capture 80% of the total variance in motif activities. The background color represents segments of the plane spanned by the first two PCs corresponding to the expansion (red, E10.5‐E11.5), neurogenesis (green, E12.5‐E15.5), and gliogenesis (purple, E16.5‐PN) phases.
- Top 20 motifs contributing the most to the first two PCs, projected on the first two PCs, illustrating which TFs are active in each developmental stage.
- Example of a predicted regulatory interaction between two TFs. ISMARA predicts that the Neurod1 motif upregulates expression of the Neurod6 gene through a binding site in its promoter. Note that the Neurod1 motif activity (bottom) is upregulated in parallel with its gene expression (top right), indicating it acts as an activator, and that Neurod6 gene expression is: similarly upregulated across developmental time (bottom right).
- Core regulatory network of most significant motif‐motif interactions in the NSC dynamics, together with overrepresented gene ontology categories among the target genes of different core regulatory motifs. The motif activity profile of each core regulatory motif is shown framed with a color representing the developmental stage at which its most active (red for expansion, green for neurogenesis, and blue for gliogenesis). Edges from motifs A to B correspond to predicted regulatory interactions with motif A either activating or repressing activity of motif B. Ellipses indicate top Gene Ontology categories overrepresented among the target genes of different motifs.
- PCA projection of the motif activity profiles of NSCs from the neurogenesis phase (day 12.5–16.5), BPs and NBNs, which capture 69% of the total variance.
- Top 20 motifs contributing the most to the first two principal components, projected on the first two PCs of panel, illustrating which TFs distinguish cell types and developmental stages.
- Core regulatory network and overrepresented gene ontology categories as in panel E but now for analysis of the samples of the BPs, NBNs and NSCs from the neurogenesis stage. Motif activity profiles are shown as a function of time for NSCs (green), BPs (red), and NBNs (purple) and are framed with a color indicating whether the motif activity varies mainly across time (blue) or cell type (pink).
PCA of the motif activities in NSCs showed that 80% of the variance was captured by the first two PCs, with the plane spanned by these PCs clearly separating the NSC samples into segments corresponding to the expansion, neurogenic and gliogenic phases (Fig 3B; Dataset EV3). We identified the top 20 TF binding motifs that contributed most to the variance in these PCs and projected their motif activity vectors onto the same plane in order to show which TFs contribute most to gene expression at each of the stages (Fig 3C; Appendix Fig S1A). For example, Scrt1 and Hdx contribute strongly to the expansion phase, REST to the neurogenesis phase, and Nfib/c contribute to the gliogenesis phase. Using the gene expression profiles and inferred motif activities, ISMARA also infers which genes are targeted by each TF motif (Fig 3A, Balwierz et al, 2014). For example, ISMARA predicts that Neurod1 targets the Neurod6 gene. This implies that the upregulation of the Neurod6 gene during cortical development is due, at least partially, to increasing Neurod1 TF activity over time (Fig 3D). In‐depth analyses of the top TF motifs and their predicted target genes show a strong coherence with those genes identified by PCA of the RNA‐Seq date (Fig 2B–D).
Of particular interest are so called motif–motif interactions in which ISMARA predicts a TF motif to target a gene, which encodes a TF, since these interactions correspond to edges of the ISMARA predicted regulatory network. To extract a core regulatory network for NSCs in the three phases of cortical development, we selected the motif–motif interactions with the strongest statistical strength (Fig 3E, see Materials and Methods). A large proportion of TF motifs cross‐regulate each other and include TFs that are known to be involved in cortical development. For example, Scrt1 and Scrt2 are predicted to be active in NSCs during the expansion, while Hoxb7 and Sox5 are active during the neurogenic phase, and Nfi family members are involved in glial cell specification (Bel‐Vialar et al, 2002; Lai et al, 2008; Paul et al, 2014; Zhou et al, 2015). Intriguingly, the TF motifs that are most active in the neurogenesis phase (depicted in the center of Fig 3E) are predicted to repress many of the TF motifs involved in NSC expansion (left side of Fig 3E) and activate many of the TFs motifs that induce gliogenesis (right side of Fig 3E). These analyses predict complex interconnected gene regulatory networks in the dynamics of the NSC lineage with TFs that can act independently but show a large degree of synergy. Perhaps most striking, virtually all of the top regulatory interactions involve motifs that are most active during neurogenesis, either repressing or activating motifs associated with the expansion and gliogenesis phases. This suggests a key role for the TFs associated with neurogenesis in orchestration of the developmental dynamics of NSC in the dorsal cortex (Fig 3E).
Next, we analyzed the TF motif activities in NSCs, BPs, and NBNs together. Since the variance in the first two PCs is dominated by the time dynamics of the NSCs, we removed the contribution of these two components from the motif activities for subsequent analyses, in order to reveal activities that may be masked. We then identified the top TF motifs determining the separation of NSCs, BPs, and NBNs by PCA (Appendix Fig S1B and C). Similar to our gene expression analyses, we also analyzed TF motif activities along the developmental trajectory separately for BPs and NBNs and identified which TFs and motif activities contribute most to these developmental dynamics (Appendix Fig S1D–I). To better understand the relationship between the different progenitor cell types in the dorsal cortex, we jointly analyzed the motif activity dynamics of neurogenic NSCs, BPs, and NBNs. Remarkably, and similar to what we observed based on the gene expression, the PC1 of the motif activities separated the three cell types (NSCs on the left, BPs in the middle, and NBNs on the right: Fig 3F). The PC2 ordered the samples of each cell type by developmental stage (Fig 3F). It is particularly noteworthy that the temporal dynamics of the motif activities along PC2 is shared by NSCs, BPs, and NBNs (earliest stages at the bottom, oldest stages at the top: Fig 3F). We defined the key TFs and motifs that separate the cell types and define the developmental lineage of NSCs, BPs, and NBNs over time (Fig 3G).
We identified the motif–motif interactions with strongest statistical power within the neurogenic NSCs, BPs, and NBNs and represented these as a predicted core regulatory network (Fig 3H). A subnetwork of E2f family motifs (E2f1, E2f2, E2f4, E2f5, and E2f8), which all target genes involved in DNA replication, methylation, and cell cycle, positively regulate Mybl2 (a cell cycle regulator) and the paired‐like homeodomain Vsx1‐like TF activity but repress Sox3/Sox10 activity. Note that the activities of these motifs remain relatively constant over time and mainly characterize differences between the cell types, with highest activity in NSCs and lowest activity in NBNs. We also observed TF motifs that show similar activities across the progenitor cell types but change their activity over time, such as Foxd1 and Stat2 whose motifs regulate neural and glial development through Nfix (Fig 3H). Conversely, some TF motifs show cell‐type specificity, for example, those for Hes1, Hes5, Meis3, Tcf7, and Foxo1. Interestingly, Hes1, Hes5, and Tcf7 are all primary regulators of Notch signaling in NSCs (Fig 3H).
Single‐cell RNA sequencing reveals underlying heterogeneity in NSCs, BPs, and NBNs
PCA at the population level revealed extensive changes in the transcriptome of NSCs, BPs, and NBNs over time. We addressed heterogeneity within each cell population by analyzing the transcriptional landscapes at the single‐cell level by single‐cell RNA‐Seq (scRNA‐Seq) (Appendix Fig S2A). The single‐cell transcriptomes of highly variable genes (HVGs) revealed a low heterogeneity within the NSCs during expansion and gliogenesis (Fig 4A). By contrast, NSCs during the neurogenesis phase (E13.5 and E15.5) were heterogeneous (Fig 4A). To validate that the scRNA‐Seq data were representative of the population data, we averaged the single‐cell transcriptomes of a specific time point and projected them on the PC matrices of the population samples. The averaged single‐cell data superimposed on the population samples and followed the same transcriptional trajectory over time and confirmed that the single‐cell transcriptomes reflected the heterogeneity of the population at the respective time point (Fig 4B). Therefore, the single‐cell heterogeneity in NSCs during cortical development is representative of the biological changes in single NSC gene expression over time.
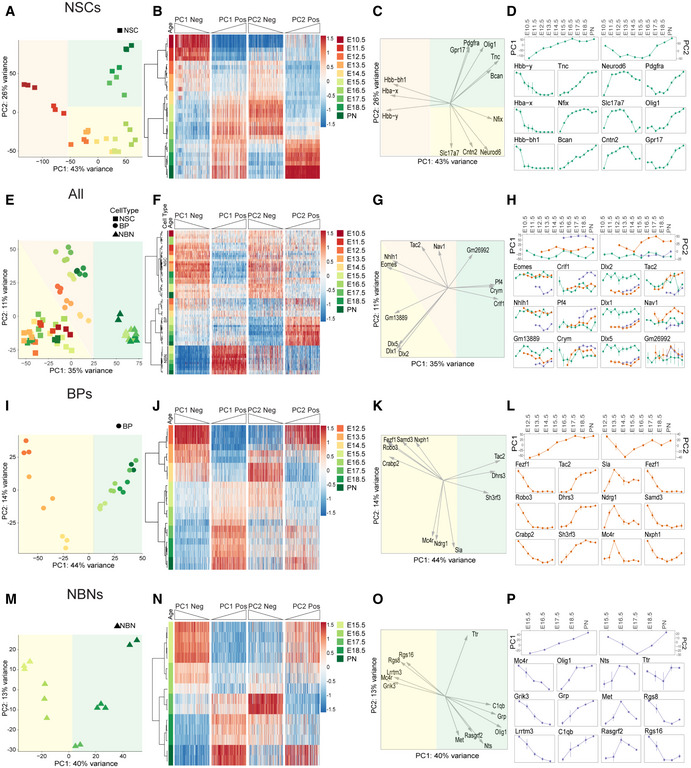
Figure 4. Heterogeneity of NSCs, BPs and NBNs at single cell level.
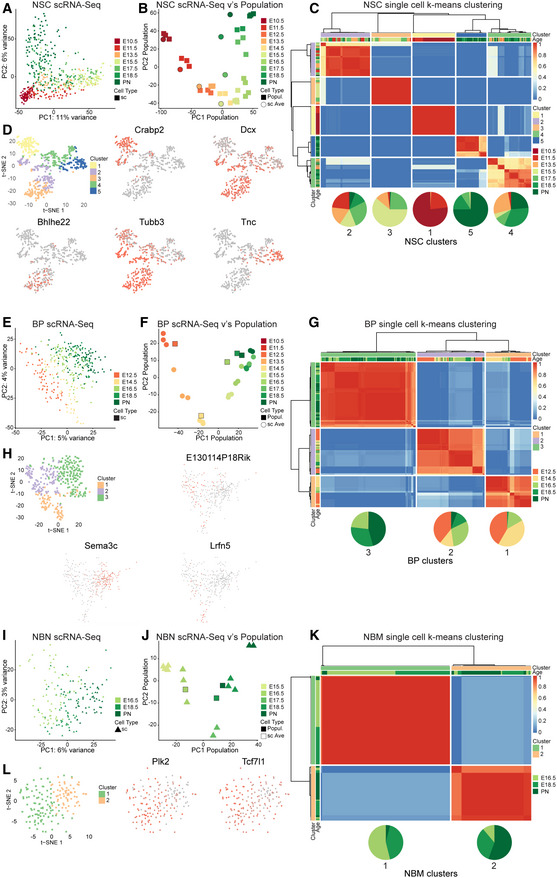
- PCA of NSC single cells, using the top 2,000 highly variable genes (HVGs) obtained from bulk NSCs.
- Projection of average single cells of NSCs at each time point on the first two PCs of bulk NSCs using the top 2,000 HVGs obtained from bulk NSCs.
- Clustering of assignment matrix of NSC single cells using k‐means and hierarchical clustering.
- Marker genes that are up/downregulated in each cluster of NSCs.
- PCA of BP single cells, using the top 2,000 highly variable genes obtained from bulk BPs.
- Projection of average BP single cells on the first two PCs of bulk BPs using the top 2,000 HVGs obtained from bulk BPs.
- Clustering of assignment matrix of NBN single cells using k‐means and hierarchical clustering.
- Marker genes that are up/down regulated in each cluster of NBNs.
- PCA of NBN single cells, using the top 2,000 HVGs obtained from bulk NBNs.
- Projection of average single cells of NBNs on the first two PCs of bulk NBNs using the top 2,000 HVGs obtained from bulk NBNs.
- Clustering of assignment matrix of NBN single cells using k‐means and hierarchical clustering.
Data Information: In (C), (G), and (K), heatmaps represent the hierarchal clustering of assignment matrix of single cells after 500 times applying k‐means clustering. The optimal number of clusters is selected based on the Silhouette coefficient. It is “1” (red) when two cells are always clustered together, “0” (blue) when two cells never fall in the same cluster. Pie charts represent the percentage of single cells at each time point in each cluster.
k‐Means clustering divided the NSCs into five cell clusters and revealed DEGs across these clusters (Fig 4C; Appendix Fig S2C–F and Dataset EV4). The five NSC types were unequally represented over time. NSC type 1 (cluster 1) was present almost exclusively at E10.5 and E11.5 and represents the major NSC transcriptional status in the expansion phase. NSC cluster 5 was the predominant NSC type during the later, gliogenic phases of corticogenesis. NSC clusters 2–4 were found during multiple phases of development from E11.5 and expansion through neurogenesis to gliogenesis (Fig 4C).
Visualization of the single cell data by t‐SNE also showed separation of the five NSC cell types (clusters 1–5: Fig 4D). Projection of gene expression onto the t‐SNE identified cluster‐specific expression. Crabp2 and Tnc marked clusters 1 and 5, respectively, while Tubb3 and Dcx were expressed in a more expanded domain across multiple NSC clusters (Fig 4D). The heatmap shows a more comprehensive list of distinct signature genes for the five clusters (Appendix Fig S2F; Dataset EV4). The GO analyses and process networks for gene expression by the NSC clusters are shown in Dataset EV5.
We analyzed heterogeneity within the BPs from E12.5‐PN1 by scRNA‐Seq. BPs showed that an age‐related difference is gene expression with heterogeneity distributed along the PC2 (Fig 4E). We pooled the single‐cell sequences at each time point and plotted these averaged values on a PCA defined by the HVGs identified from the BP analysis at the population level (Fig 4F). Strikingly, the averaged single‐cell data superimposed on the biological replicates at population level supporting that the individual BP scRNA‐Seq data are representative of the populations (Fig 4F). The analysis indicated a distinct, time‐dependent dynamic in gene expression from E12.5‐PN1. Clustering the single BPs based on k‐means revealed three distinct clusters (Fig 4G; Appendix Fig S2G–I and Dataset EV4). Cluster cell‐type 3 cells are present mostly at later developmental stages (E16.5‐PN1). Conversely, cluster 1 and 2 cells were more prominent at earlier times (Fig 4G). We visualized the BP clusters by t‐SNE and plotted some signature genes for each cluster (Fig 4H; Appendix Fig S2J and Dataset EV4). We performed similar analyses for NBNs expecting a large heterogeneity over time due to the plethora of neuron types generated in the dorsal cortex. scRNA‐Seq confirmed a broad spread in the NBNs with a component of time over the PC1 (Fig 4I).
We pooled the single‐cell NBN data at each time point and plotted these averaged values on a PCA defined by the HVGs from the NBN analysis at the population level (Fig 4J). Both the population and averaged single‐cell samples followed a time‐dependent trajectory in gene expression consistent with the sequential generation of neurons forming the deep and superficial layers of the isocortex (Fig 4J). k‐Means clustering revealed the reduced heterogeneity in the NBNs compared with NSCs and BPs and identified two major clusters (Fig 4K). Cells belonging to cluster type 1 NBNs were present at earlier time points (E15.5 and E18.5), while cells belonging to cluster type 2 were underrepresented at E15.5 and were mostly present at PN1 (Fig 4K; Dataset EV4).
t‐SNE representation of the NBNs belonging to the two cell clusters showed the sparse distribution of type 1 cells reflecting the single‐cell heterogeneity within this cluster. Type 2 NBNs clustered more tightly than cluster 1 cells. Due to this heterogeneity, it was difficult to pinpoint single‐gene signatures for the two NBN clusters (Fig 4L; Appendix Fig S2N and Dataset EV4). These findings demonstrate an unprecedented heterogeneity in NSCs and BPs over time and a dynamic shift in gene expression of these cells at the population and single‐cell levels. The scRNA‐Seq data enabled a high‐resolution definition of gene signatures for each cluster (cell subtype) of NSCs, BPs, and NBNs.
We repeated the analyses of the scRNA‐Seq data using KNN graph‐based clustering and UMAP visualizations. UMAP visualization of NSCs showed their temporal distribution within five distinct clusters (Appendix Fig S3A). Feature plots of Hbb‐bh1, Hba‐x, and Hbb‐y replicate the bulk expression patterns in NSCs, where expression is: higher during the early developmental stages (E10.5 and E11.5: Appendix Fig S3B). Additional feature plots of known markers of expansion (Sox2, Pax6, Crabp2), excitatory (Dcx, Tubb3, Bcl11b, Pou3f2), inhibitory (Gad1, Dlx1, Dlx5), astrocytic (Aldoc, Aqp4, Sox10), and oligodendrocytic (Olig1, Olig2, Cspg4) lineages show unique and consistent patterns of expression (Appendix Fig S3C–G). We performed similar analyses for the BPs and NBNs and visualized the cells on UMAPs. We identified three BP and two NBN clusters over developmental time and present example feature plots for BP genes such as Tbr2, Ascl1, Nes, Lrfn5 (Appendix Fig S4A–C). Reanalysis of the NBNs using KNN‐graph‐based methods confirmed only two discernable NBN clusters with the expression of single neuronal subtype genes such as Bcl11b, Cux1, Cux2, Foxp2, Pfn2, and Pou3f2 poorly defining the heterogeneity (Appendix Fig S4D–F).
Pseudo‐time analysis reveals potential trajectories among NSCs, BPs and NBNs
KNN‐graph‐based clustering and UMAP visualizations of pooled single NSCs, BPs, and NBNs segregated eight cell clusters (Fig 5A and B; Appendix Fig S3A). NSCs segregated in a temporal pattern as was seen with the PCA analysis. NSCs segregate into four major clusters correlated with their prospective fate – NSC1 (expansion), NSC2 (late, astrocytic), NSC3 (late, oligodendrocytic), and NSC4 (intermediate, neurogenic). BPs segregated into two clusters, BP1 enriched in Bcl11b+ cells (Ctip2+, deep layer neuron marker), and BP2 enriched in Pou3f2+ cells (Brn2+, upper layer neuron marker). NBNs divided into two clusters (NBN1 and NBN2), and similar to the individual NBN analyses, the clustering was not driven by differential expression of cortical layering markers (Fig 5C and D). The markers for each cluster are listed in Dataset EV6. We also performed Slingshot for pseudotime analysis of the scRNA‐Seq data to elucidate the neurogenic trajectories from NSCs to BPs to NBNs (Fig 5E–G). We identified three neurogenic lineage pathways starting from our early expansion NSCs to NBNs through BPs (Fig 5G).
Figure 5. Pseudo‐time analysis reveals potential trajectories among NSCs, BPs and NBNs .
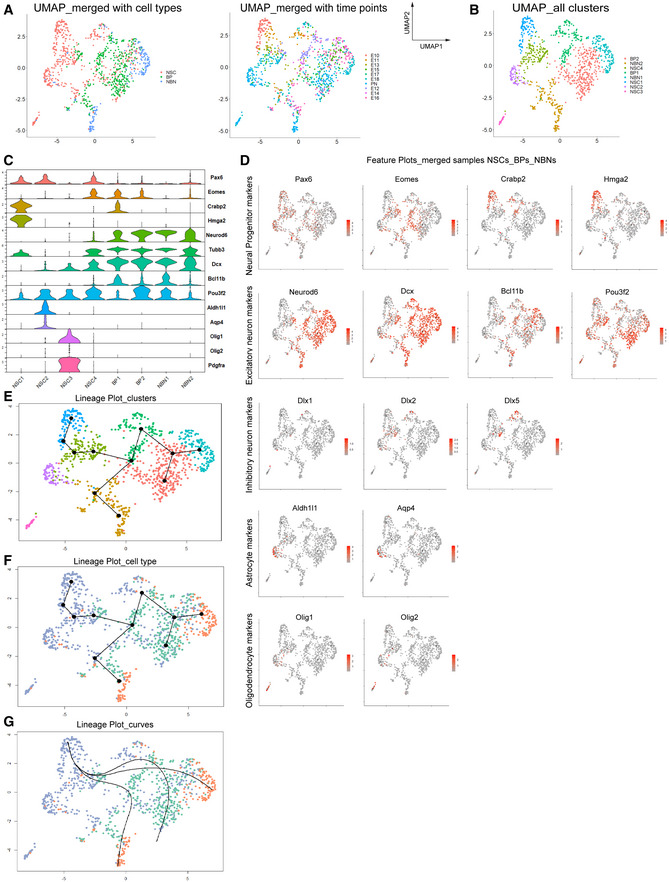
- UMAP clustering of all NSCs, BPs, and NBNs, visualized based on cell type and time point.
- UMAP clustering showing all cell types, four clusters of NSCs, two of BPs, and two of NBNs.
- Violin plots of highly enriched genes in each cluster, labeled with gene and cluster names.
- Feature plots showing examples of highly enriched genes in the neuronal lineage, identifying excitatory neuron, inhibitory neuron, astrocytic and oligodendrocytic clusters. Y axis is the log normalized expression.
- Visualization of inferred trajectory based on UMAP embeddings showing a neurogenic lineage from NSCs, to BPs to NBNs, with a time component. Colors represent the cell types shown in (B).
- Visualization of inferred trajectory overlaid on cell type, capturing neurogenic lineage.
- Smooth representations of lineage trajectory using principal curves overlaid on cell types showing a neurogenic lineage from NSCs to BPs to NBNs.
We compared our single‐cell C1 data with the extensive 10X genomics Linnarsson developing mouse brain dataset (La Manno et al, 2021; Fig EV4). First, we compared our NSCs, BPs, and NBNs to their forebrain and dorsal forebrain cells (E9‐E18); second, we compared our NSCs with the cells defined as radial glia in the Linnarsson dataset from the same brain regions. We performed CCA integration analyses with our C1 scRNA‐Seq data and the Linnarsson cells. Our cells integrated as expected into the Linnarsson dataset with the expression of distinct marker genes. Our cells maintained their distinct groupings in these analyses and segregated into 10 distinct clusters (Fig EV4B). Visualization revealed segregation of our cells within the Linnarsson dataset post‐CCA integration. These analyses also revealed that the cells we defined as NSCs and NBNs fall within the clusters defined as radial glia and neurons by Linnarsson, respectively (Fig EV4C–E). Hence, both C1 and 10X genomics sequencing approaches correctly identify the same cell populations. However, the increased sequence depth of our C1 data allowed identification of cell subtypes that were not discernable by 10X genomics. These findings also indicate that the Hes5::GFP and Tbr2::GFP selection procedure we used does not bias the analysis of the progenitors.
Figure EV4. C1 data integration and comparison with Linnarsson dorsal cortex data (La Manno et al, 2021).
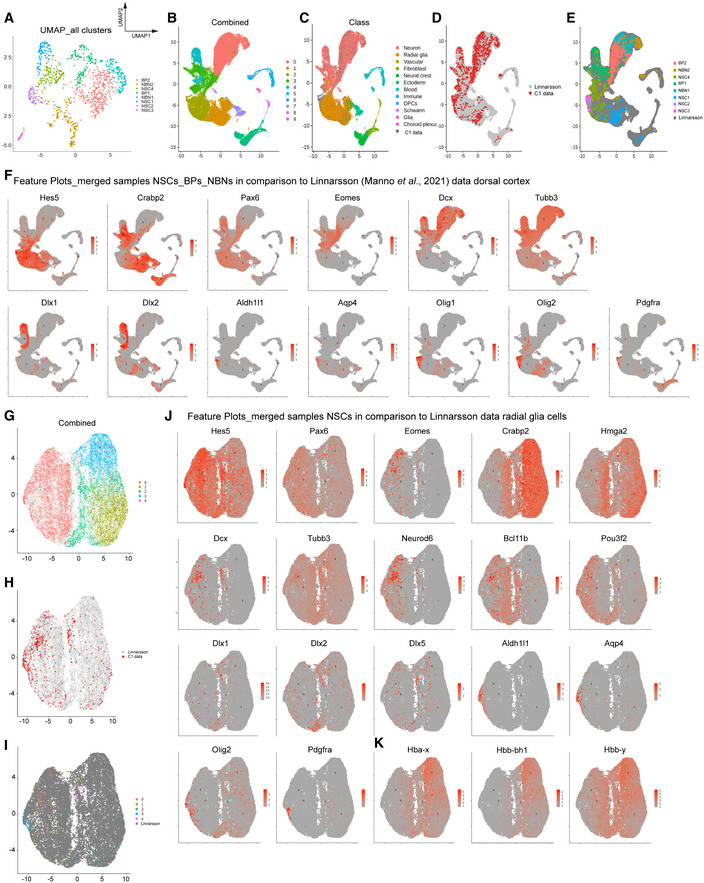
- UMAP visualization of identified clusters of NSCs, BPs and NBNs when analyzed together, segregating all cells in eight clusters—four NSC, two BP, and two NBN clusters.
- UMAP visualization of post CCA integrated merged dataset containing C1 and dissected forebrain and dorsal forebrain cells; Linnarsson dataset from (La Manno et al, 2021), into 10 clusters.
- UMAP clustering visualization of Linnarsson dataset with C1 data post CCA. Cells are labeled with established “Class” from original manuscript. Our NSCs and NBNs fall in Linnarsson radial glia and neuronal clusters.
- C1 data maps onto Linnarsson clusters.
- UMAP clustering visualization after CCA. Cells are labeled by our previously identified clusters. Our C1 clusters integrate mostly with Linnarsson radial glia and neuronal clusters and maintain their separate clustering.
- Example feature plots showing consistent expression of markers in NSCs, BPs and NBNs between two datasets. Y‐axis is the log normalized expression.
- UMAP clustering visualization post CCA integration of C1 NSCs and radial glial classed cells from Linnarsson dataset, segregating in five clusters.
- Positional mapping of C1 onto Linnarsson clusters.
- After CCA integration, we find C1 NSCs integrate well with Linnarsson radial glial cells. Cells labeled with our previously identified five NSC clusters.
- Example feature plots showing consistent expression of markers in NSCs and radial glial cells, between two datasets.
- Example feature plots showing consistent expression of Hbb subunits in NSCs and radial glial cells, between two datasets.
Interestingly, the Linnarsson dataset does not identify BPs as a separate population. Our BPs fall into the neuron clusters defined by the Linnarsson analysis and overlap with Tbr2 expressing cells in these clusters (Fig EV4F). These findings support the added value and power of the deeper SmartSeq2 C1 sequencing approach. We selected the cells classified as radial glial cells in the Linnarsson dataset and integrated our NSCs (Fig EV4G–I). This revealed distinct subpopulations of mainly dividing early and late progenitors defined by the expression of marker genes. We also found that the Linnarsson 10X dataset had low expression of the “mature” genes of radial glia cells compared with our C1 data, which we interpret as being due to the increased depth and reproducibility of the C1 sequencing approach (Fig EV4J). However, Hbb subunits that defined subtypes of NSCs in our analyses were also detectable in the radial glia in the Linnarsson dataset (Fig EV4K).
Neuronal specification markers show sequential waves in gene expression and massive heterogeneity at the single cell level
During cortical development, morphologically and physiologically unique classes of neurons are formed sequentially in waves throughout neurogenesis (Molyneaux et al, 2007; Greig et al, 2013; Telley et al, 2016; Fig 6A). Several gene combinations have been identified that classify the distinct subtypes of projection neurons in the cortex (Molyneaux et al, 2007; Greig et al, 2013). We selected and curated an extensive list of known patterning and neuronal subtype marker genes from the literature and analyzed their expression dynamics in the NSCs, BPs, and NBNs at the population and single cell levels.
Figure 6. Dynamic expression of neuronal specification factors in NSCs, BPs, and NBNs .
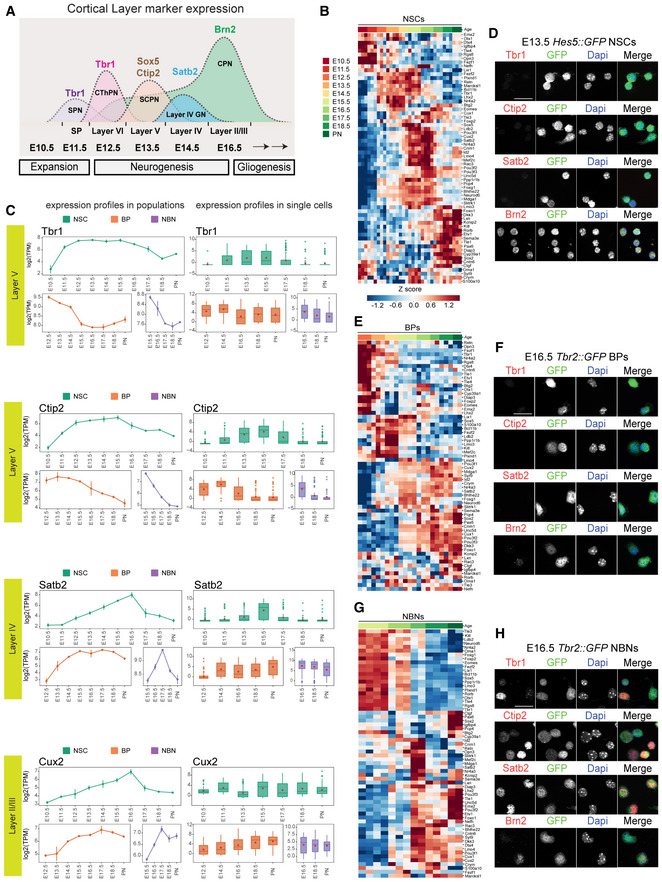
- Illustration of distinct projection neurons born sequentially during neurogenesis.
- Heatmap illustrating the dynamics of expression of cortical layering markers in NSCs at population level.
- Examples of expression dynamics of deep layer markers Tbr1, Ctip2 and upper layer markers Satb2, Cux2 in NSCs, BPs, and NBNs, profiles at population level (left) and single cell level (right). Each dot defines the mean and lines define the SD. Three to four biological replicates were collected for each time point.
- Experimental validation of NSCs isolated at E13.5 using Hes5::GFP transgenic embryos, showing no detectable protein for Tbr1, Ctip2 and Satb2. NSCs do express Brn2 (Pou3f2) in vitro and in vivo at protein level. Scale bar = 20 μm.
- Heatmap illustrating the dynamics of expression of cortical layering markers in BPs at population level.
- Experimental validation of BPs isolated at E16.5 using Tbr2::GFP transgenic embryos, showing no detectable protein for Tbr1, Ctip2 and Satb2. Scale bar = 20 μm.
- Heatmap illustrating the dynamics of expression of cortical layering markers in NBNs at population level.
- Experimental validation of NBNs isolated at E16.5 using Tbr2::GFP transgenic embryos, showing protein expression for Tbr1, Ctip2, Satb2 and Brn2(Pou3f2). Scale bar = 20 μm.
Data information: In (B), (E) and (F), heatmaps are based on z‐score of log2(TPM) expression values.
Surprisingly, transcription of the neuronal subtype genes showed sequential and developmental wave‐like patterns of expression even in NSCs, at the population level (Figs 6B and EV5A). At the single cell level, these developmental waves were recapitulated in NSCs, albeit with a pronounced heterogeneity at each time point (Fig 6C). Particularly those genes commonly used to define neuronal subtypes and cortical layers later in development (Tbr1 and Ctip2—Layers V and VI; Satb2 and Cux2—Layers IV and II/III) showed characteristic and transient dynamics in expression 1–2 days prior to the established birth date of the neurons (Molyneaux et al, 2007). We plated the freshly FACsorted Hes5::GFP positive NSCs but could not detect expression of these neuronal specification factors at the protein level by immunocytochemistry (Fig 6D). This suggested that the transcriptional program that defines cortical neuron subtypes is initiated in NSCs long before their exit from cell cycle.
Figure EV5. Heterogeneity of cortical layering marker expression in NSCs, BPs and NBNs.
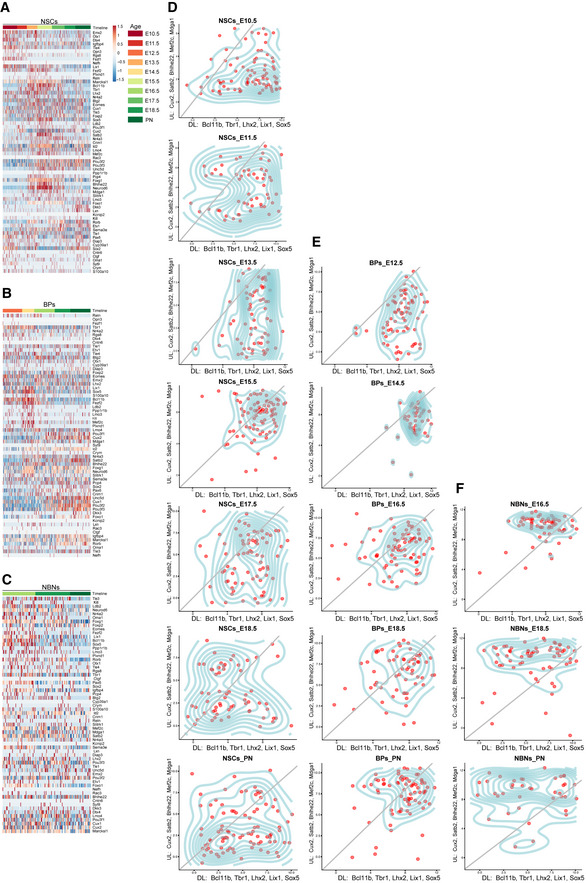
- Heatmap of cortical layer markers in NSC single cells, based on z‐scored log2(TPM) expression values.
- Heatmap of cortical layer markers in BP single cells, based on z‐scored log2(TPM) expression values.
- Heatmap of cortical layer markers in NBN single cells, based on z‐scored log2(TPM) expression values.
- Temporal distribution of NSC single cells along the deep or upper layer markers.
- Temporal distribution of BP single cells along the deep or upper layer markers.
- Temporal distribution of NBN single cells along the deep or upper layer markers.
Data Information: In (D–F), X axis: deep layer markers‐ Bcl11b, Tbr1, Lhx2, Lix1, Sox5, and Y axis‐ Cux2, Satb2, Bhlhe22, Mef2c, Mdga1.
We performed similar computational analyses on the BPs and NBNs and identified similar sequential waves of cortical neuron gene expression correlating with the birth date of the respective neuron subtype (Figs 6C, E, and F and EV5B). Similarly, we could not detect protein expression in the BPs acutely isolated from the developing cortex (Figs 6C, E, and F and EV5B). However, and as expected, NBNs expressed proteins associated with neuron subtypes of definitive cortical layers (Figs 6C, G, and H and EV5C).
These striking findings indicate that neuronal specification programs start early in the lineage, in NSCs and BPs, and continue into the NBNs. At the single‐cell level, some E10.5 NSCs expressed high levels of deep layer neuronal markers including Cux2 while later NSCs expressed both deep and upper‐layer neuronal markers (Figs 6C and EV5D). This explains the seemingly controversial Cux2 lineage tracing experiments described previously (Franco et al, 2012). We observe similar expression in BPs, from a deep to both deep and upper layer marker expression While the NBNs match upper layers, corresponding to their later time points of collection (Fig EV5E and F).
Signaling pathway effectors show dynamic expression in the neurogenic lineage
Signaling pathways impinge on downstream effectors to regulate NSC fate decisions during corticogenesis. The cross talk between signaling pathways and the integration of their target effectors governs stem cell maintenance and fate. However, it remains unclear to which signals NSC, BPs, and NBNs are competent to respond in vivo. In order to evaluate susceptibility to paracrine signaling molecules and the dynamics in this responsiveness, we selected those genes designated to be receptors in the databases and analyzed the expression of the 440 receptors that showed variable gene expression throughout the neurogenic lineage. The resulting extensive gene expression profiles could be divided into three groups (Fig 7A and B):
Receptors that are highly expressed by NSCs through the most of cortical development (Fig 7A and B). These receptors, including those for Wnt (Fzd5, 7, 9), Notch (Notch1, 2, 3), Fgf (Fgfr2, Fgfr3), and Shh signaling (Smo, Ptch1), are part of pathways involved in stem cell maintenance (Blaschuk & ffrench‐Constant, 1998; Fukuchi‐Shimogori & Grove, 2001; Gaiano & Fishell, 2002; Itoh & Ornitz, 2004; Bray, 2006; Louvi & Artavanis‐Tsakonas, 2006; Shimojo et al, 2008, 2011; Iwata & Hevner, 2009; Sahara & O'Leary, 2009; Imayoshi et al, 2010; Rash et al, 2011; Wang et al, 2011).
Receptors that are highly expressed by NSCs during neurogenesis and later stages and by BPs and NBNs, which we refer to as neurogenic (Fig 7A).
Receptors that are highly expressed predominantly at later stages of development in the NSCs during the gliogenic phase. These we refer to as gliogenic pathways and include the receptors for known ligands involved in gliogenesis, including Tgf‐beta/BMP signaling (Tgfbr2, Bmpr1a, Bmpr1b) and Il6/Lif signaling (Lifr, Il6st) (Ebendal et al, 1998; Gomes et al, 2005; Rodriguez‐Martinez & Velasco, 2012; Pollen et al, 2015).
Figure 7. Dynamic expression profile of signaling receptors during corticogenesis.
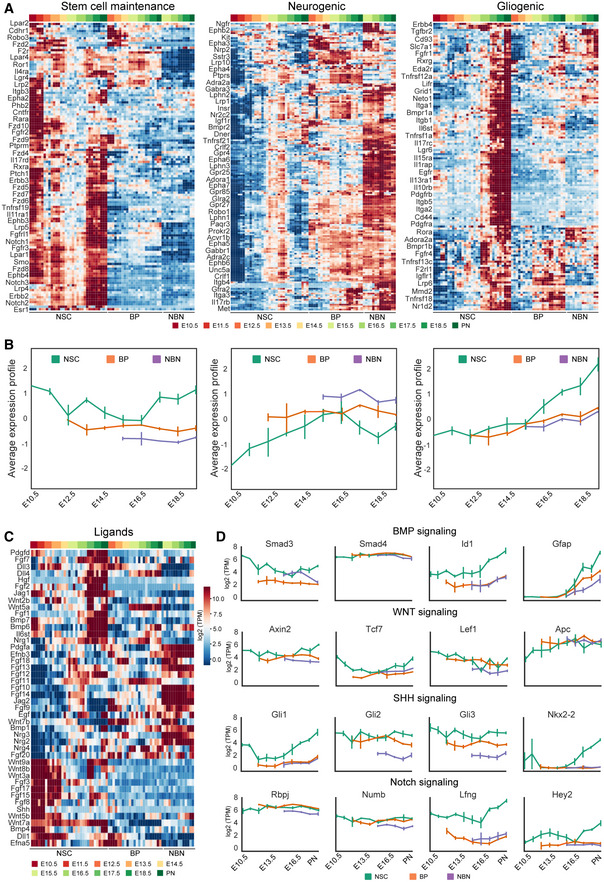
- Heatmaps representing the expression profile of signaling receptors that can be divided into three main groups based on k‐means clustering of z‐scored log2(TPM) expression values: stem cell maintenance (121 receptors), neurogenic (180 receptors), and gliogenic (139 receptors). Names of selected receptors are displayed. For the complete list please see Dataset EV7. Expression profiles are represented by their z‐score.
- Average expression profile of each cluster for NSCs (green), BP (orange), and NBN (purple). Solid line represents the average z‐score, while the area represents the SD estimated from different biological samples. Three to four biological replicates were collected for each time point.
- Heatmap representing the expression profile of ligands from selected signaling pathways, based on the z‐scored log2(TPM) expression values.
- Expression profile of selected target or modulator of key signaling pathways: BMP, Wnt, Shh and Notch signaling. Each dot defines the mean and lines define the SD. Three to four biological replicates were collected for each time point.
The neurogenic niche during corticogenesis provides local autocrine and paracrine signals but also responds to blood‐born ligands and factors in the fluid of the telencephalic vesicles. We assessed the potential local signals in the NSCs, BPs, and NBNs by examining the expression of ligands for the top, regulated receptors (Fig 7C). Similar to the expression profile of their cognate receptors, the expression of some ligands could be divided into three clusters. Ligands expressed predominantly by NSCs during the expansion phase of corticogenesis, ligands expressed predominantly by NSCs in the gliogenic phase, and ligands expressed mostly by neurons that act as paracrine signals back to the progenitors. Many Wnt ligands and their receptors are expressed by NSCs suggesting autocrine signaling. One notable exception being Wnt7b, which is prominently expressed by NBNs and its canonical receptor Fzd7 also by NSCs at the expansion and gliogenesis phases. By contrast, although their cognate receptors were mostly expressed by NSCs, the Fgf ligands were divided into two major groups: those expressed mainly by NBNs and those expressed mainly by NSCs (Fig 7A and C).
As a proof of concept, we also evaluated selected modulators and effector targets of some of the key signaling pathways including Bmp, Wnt, Notch, and Shh signaling (Fig 7D). The expression of many target genes of these pathways reflected the expression of their respective receptors suggesting that not only are the ligands available and the receptors expressed but the pathways may be active throughout the neurogenic lineage (Fig 7D).
bHLH TFs are dynamically and heterogeneously expressed by NSCs
bHLH TFs are notably involved in the control of neurogenesis and brain development downstream of many pathways including Notch, BMP, TGFβ, and Wnts. We analyzed the expression profile of the bHLH family genes. The bHLH TFs could be grouped into three classes based on their expression profiles:
bHLH factors related to NSCs maintenance, including Hes1, Hes5, Hey1, and Id4, are highly expressed by NSCs (Fig 8A and B).
bHLH factors related to neuronal commitment and differentiation. For example, the proneural differentiation bHLH genes including Neurog2, Neurod2, and Neurod6, which are expressed by NSCs during the neurogenic phase and by BPs, but their expression is: lower in NBNs (Fig 8A and C).
bHLH genes with expression associated prominently with gliogenesis, which are expressed at low levels by BPs and NBNs including Olig1, Olig2, and Id1 (Fig 8A and D).
Figure 8. Dynamic and heterogenic expression profile of bHLH factors during forebrain development.
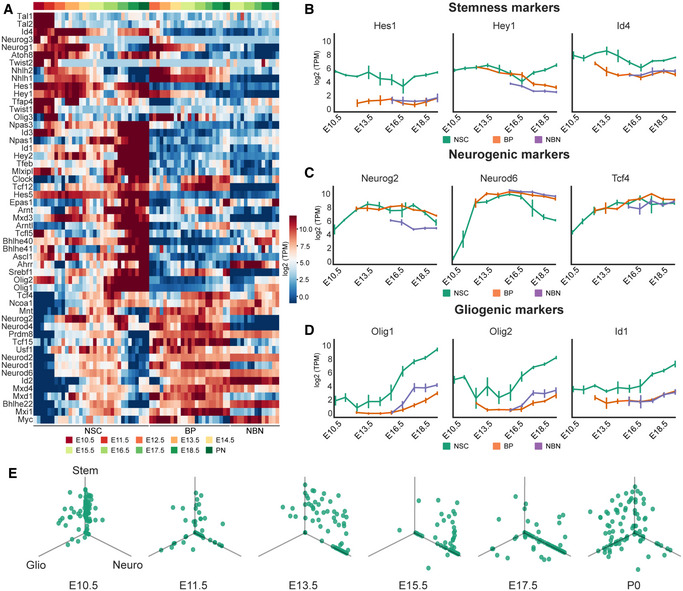
- Heatmaps representing the expression profile of bHLH factors. Three main groups are observed based on k‐means clustering of z‐scored log2(TPM) of expression value: stem cell maintenance (high expression in the NSCs at early embryonic times and low in BPs and NBNs), neurogenic (high expression in the NSCs during neurogenesis and high expression in BPs and NBNs), and gliogenic (high expression in the NSCs at late embryonic times and low in BPs and NBNs). Expression profiles are represented by their z‐score.
- Expression profile of selected stem cell maintenance markers Hes1, Hey1 and Id4. Each dot defines the mean and lines define the SD. Three to four biological replicates were collected for each time point.
- Expression profile of selected neurogenic markers Neurog2, Neurod2, and Neurod6. Each dot defines the mean and lines define the SD. Three to four biological replicates were collected for each time point.
- Expression profile of selected gliogenic markers Olig1, Olig2 and Id1. Each dot defines the mean and lines define the SD. Three to four biological replicates were collected for each time point.
- Expression of stem cell markers (Hes1, Hey1 and Id4), neurogenic markers (Neurog2, Neurod2, and Neurod6) and gliogenic markers (Olig1,2 and Id1) in NSCs during different embryonic time points in the single‐cell levels. Each point represents the expression value of one single cell in log2(TPM).
We also identified a group of bHLH TFs expressed moderately by NSCs during the neurogenic phase of corticogenesis, but which are expressed by BPs and NBNs suggesting a role in neural commitment and differentiation (Fig 8C and D). At the single cell level, expression of the bHLH factors by the NSCs was highly heterogeneous, even at the same embryonic time point (Fig 8E). As expected at E10.5, most NSCs expressed high levels stemness markers (Hes1, Hey1, and Id4) and low or no neurogenic‐associated (Neurog2, Neurod2, and Neurod6) and gliogenic‐associated bHLH TFs (Olig1, Olig2, and Id1). As neurogenesis initiated at E13.5, more cells started to express neurogenic markers and the number of cells expressing Hes1, Hey1, and Id4 reduced, but very few cells were expressing the gliogenic bHLHs. At E13.5 two major NSC populations were evident based on bHLH expression, one expressing high stemness markers and low neurogenic markers, and another expressing low stemness markers and high neurogenic markers. However, there was also a subpopulation of cells that expressed both maintenance and neurogenesis‐associated bHLH TFs. One explanation for this populations is the oscillatory expression of stemness factors Hes1 and Hes5 and their repression of the neurogenic targets including Neurog2. At later stages, when NSCs exit the neurogenic phase and enter gliogenesis (E15.5‐E17.5), the proportion of NSCs expressing the neurogenic bHLHs rather than the stem cell maintenance‐associated TFs increased. As the NSCs transitioned into gliogenesis and toward PN1, the proportion of NSCs expressing Neurog2, Neurod2, and Neurod6 diminished with a concomitant increase in gliogenic factor (Olig1, Olig2, and Id1) expressing cells (Fig 8E). Strikingly, some NSCs in the gliogenic state coexpressed the maintenance bHLH TFs. This confirms previous observations that Notch signaling and the expression of Hes‐related TFs are linked to glial commitment of NSCs.
Discussion
The temporal dynamics in gene expression during lineage commitment throughout ontogeny of the cerebral cortex remains unclear. Advances in scRNA‐Seq and gene cluster analysis have given unprecedented insights into cellular heterogeneity in the mammalian cortex, as well as in primary human samples. Particularly when trying to understand the genetic regulation of cell diversification from stem and progenitor cells, these snapshots of cellular transcriptomics are used to define cellular state and therefore predict fate potential. One challenge for transcriptome analysis is to predict not only the future of a particular cell and its offspring but also its history. This is particularly confounded by highly dynamic gene expression over time windows ranging from days to minutes.
Here we posed the questions of how gene expression changes in stem cells, progenitors, and newly formed neurons over time, and whether we can reveal distinct gene expression patterns within specific cell types that may allude to their differentiation potential. We characterized gene expression of the dorsal cortical neural lineages over time, focusing on the phases of expansion, neurogenesis, and gliogenesis using NSC, BP, and NBN populations with definitive characteristics. We have created an extensive resource of dorsal cortical ontogeny, which can be mined through an interactive web‐based browser (Appendix Fig S5; http://neurostemx.ethz.ch/).
Development of the cerebral cortex is a dynamic process, however, and remarkably, our understanding of the lineage heterogeneity and changes in gene expression that accompany the formation of the different neuron subtypes and subsequent cortical layers is limited. The most widely accepted model of cortical development utilizes a common multipotent progenitor, which becomes progressively restricted in its fate over time. Unbiased computational analysis of our data revealed distinctive, stage‐specific changes in gene expression not only in NSC, but also BPs and NBNs. These shifts in transcriptional space at the population and single cell levels reveal a heterogeneity in each of these cell populations and establish novel gene signatures defining five NSC, three BP and two NBN types. Remarkably, we show the presence of different NSC, BP, and NBN types at the same developmental stage, and that these constitute different proportions of the particular populations at each stage. Although these findings do not disprove a common progenitor mechanism, they imply that the populations of NSC, BPs, and NBNs at any point in developmental time are composed of different proportions of cells with distinct transcriptomes, which can be predicted by a panel of signature genes.
We analyzed our dataset using two separate clustering methods and identified similar distinct clusters of NSCs, BPs, and NBNs, highlighting the robustness of our data. We also integrated our C1 data with 10X genomics data from the developing mouse forebrain (La Manno et al, 2021). Our cells integrated into the 10X genomics data as expected, while maintaining their distinct groupings, again validating their broader utility. We consider the use of transgenic Hes5::GFP and Tbr2::GFP lines as a major strength of the paper because we were able to enrich clean populations of NSCs, BPs, and NBNs using these lines. To understand the neurogenic trajectories, we performed the pseudo‐time analyses, which revealed three lineages, from NSCs to BPs to NBNs following a strict time component. These observations again emphasize the tight regulation of neural fate dynamics.
Our analyses of cells types with definitive characteristics exemplify potential dangers in a priori allocation of cell type based on comparative gene expression and limited gene sets. For example, the transcriptomes of NSC in the neurogenic phase of cortical development are closer to BPs at this stage than they are to NSCs at E10.5 (expansion phase) or PN (gliogenic phase). Only by separating the NSCs, BPs, and NBNs and analyzing their transcriptomes in isolation, was it possible to uncover specific signatures and determine cellular heterogeneity. We also found that NSCs express many neuronal RNAs but with no detectable protein expression. This suggests that essential posttranscriptional regulation programs are active in the neurogenic lineage during differentiation. Several mechanisms of posttranscriptional regulation have previously been reported during embryonic neurogenesis including by Drosha (Knuckles et al, 2012) and m6 mRNA methylation (Yoon et al, 2017).
The conjunction of gene expression dynamics and predicted transcriptional networks by ISMARA identified active TFs and nodes in NSCs, BPs, and NBNs over time. These TF motifs and activities also revealed the same directional trajectory and pathway of each cell type through transcriptional space as predicted by the mRNA expression. As ISMARA predicts the activity of more than 800 TFs and their targets in all cell types, this dataset and resource will be valuable to explore and extrapolate the known regulatory networks to the missing novel nodes. Recently, we validated the Tead TFs in cortical development and elucidated different functions of Tead factors in NSCs (Mukhtar et al, 2020). The dynamic changes in the TFs in NSCs, for example, reflect the sequential changes these cells undergo during corticogenesis. Our analyses determining the relationship among the neuronal lineage demonstrate a naturally occurring directionality, indicating strong intrinsic control. Moreover, among all the cell types, NSCs seem to be most dynamic, be it at gene expression level or the level of transcriptional networks. The NSCs follow a continuous path through the three phases of corticogenesis, supporting the neuronal origin from “common progenitors,” sequentially changing in transcriptional space. To this end, we identified signature genes of NSCs in expansion, neurogenic and gliogenic phases. As all the known genes depicted the dynamics of expression as expected, we believe that we provide more extensive lists of novel signature genes, which could be used to identify NSCs in different phases. These signatures are like a “scorecard” for the NSC population undergoing corticogenesis, some of which we have also validated experimentally (Figs EV2B and C, and EV3C and D). Similar analyses for BPs and NBNs have yielded key signature markers, which hold promise for further biological exploration. The up‐ and downregulations of genes could be presumed to be the result of active or inactive downstream programs in these cells and their progeny. It is crucial to differentiate between early and late BPs, or different NBN populations across time in order to consolidate our knowledge about their downstream fate and function.
The microenvironment of the cells plays critical roles in regulating cell fate choices. We used these resources and explored some of the signaling pathways defining logic in NSC differentiation using a high‐throughput microfluidic approach (Zhang et al, 2019). This validation was the tip of the iceberg and together with the recent developments in the field, we provide a consolidated resource, a comprehensive and systematic characterization of major progenitor pools in cortical development. Further biological validations of our predicted signaling and transcriptional nodes will provide more promise toward the deeper exploration of mechanisms controlling corticogenesis.
Materials and Methods
Reagents and Tools table
| Antibodies | Source | Identifier |
|---|---|---|
| Chick anti‐GFP (1:300) | Millipore | Cat# 06‐896, RRID:AB_11214044 |
| Rat anti‐Ctip2 (1:500) | Abcam | Cat# ab18465, RRID:AB_2064130 |
| Goat anti‐Brn2 (1:250) | Santa Cruz | Cat# sc‐6029, RRID:AB_2167385 |
| Sheep anti‐GFP (1:250) | AbD Serotec/Biorad | Cat# 4745‐1051, RRID:AB_619712 |
| Rabbit anti‐Tbr2 (1:500) | Abcam | Cat# ab23345, RRID:AB_778267 |
| Rabbit anti‐Pax6 (1:500) | Covance | Cat# PRB‐278P, RRID:AB_291612 |
| Mouse anti‐Satb2 (1:200) | Abcam | Cat# ab51502, RRID:AB_882455 |
| Rabbit anti‐Tbr1 (1:500) | Abcam | Cat# ab31940, RRID:AB_2200219 |
| Donkey anti‐Sheep, Alexa 488 (1:500) | Jackson ImmunoResearch Labs | Cat# 713‐545‐147, RRID:AB_2340745 |
| Donkey anti‐Rabbit, Cy3 (1:500) | Jackson ImmunoResearch Labs | Cat# 711‐165‐152, RRID:AB_2307443 |
| Donkey anti‐Mouse, Cy3 (1:500) | Jackson ImmunoResearch Labs | Cat# 715‐165‐151, RRID:AB_2315777 |
| Donkey anti‐Rat, Cy3 (1:500) | Jackson ImmunoResearch Labs | Cat# 712‐166‐153, RRID:AB_2340669 |
| Donkey anti‐Goat, Cy3 (1:500) | Jackson ImmunoResearch Labs | Cat# 705‐165‐147, RRID:AB_2307351 |
| Donkey anti‐Chicken, Alex488 (1:500) | Jackson ImmunoResearch Labs | Cat# 703‐545‐155, RRID:AB_2340375 |
| Chemicals | Source | Identifier |
|---|---|---|
| Formaldehyde Solution (w/v) | Sigma | 47608(47673/33220) |
| DNase I, RNase‐free | Sigma | 04716728001 |
| DNase I Grade II | Roche | 10104159001 |
| L_Cysteine | Sigma | 168149 |
| Papain | Sigma | P3125‐100MG |
| Trypsin inhibitor from Glycine max (soybean) | Sigma | T6522‐5x100MG |
| L15 Medium | Invitrogen | 31415029 (31415086) |
| PBS cell culture | Dulbecco | 14080089 (14080048) |
| Triton X‐100 | Fisher | BPE151‐500 |
| TRIzol | Invitrogen | VX15596018 |
| Glycoblue Co‐precipitate | Life Technologies | D1417005 |
| Poly L‐ Lysine hydrobromide | Sigma | P9155‐5MG |
| B27 supplement+A26 | Gibco | 17504‐044 |
| DMEM/F12 | Gibco | 31966‐047 |
| Chloroform | Sigma | 288306 |
| Normal Donkey Serum | Jackson ImmunoResearch Labs | 017‐000‐121 |
| Agarose | Fisher Scientific | BPE1356‐100 |
| RNAse free water | Ambion | AM9906 |
| TE buffer | Invitrogen by Thermo Fisher Scientific | AM9849 |
| NaOH | Roth | 6785.1 |
| Chamber slides | Lab‐Tek | 177402 |
| Critical Commercial Assays | Source | Identifier |
|---|---|---|
| 2x Assay Loading Reagent | Fluidigm | 85000736 |
| 20x DNA Binding Dye Sample Loading Reagent | Fluidigm | 100‐3738 |
| 20x GE Sample Loading Reagent | Fluidigm | 85000746 |
| Sso Fast EvaGreen SuperMix with low Lox | BioRad | 172‐5211 |
| Dynamic Array 48.48 | Fluidigm | BMK‐M‐48.48 |
| Dynamic Array 96.96 | Fluidigm | BMK‐M‐96.96 |
| PreAmp and Reverse Transcription Master Mix | Fluidigm | 100‐6300 |
| Human Brain Reference RNA | Life Technologies | AM6050 |
| Exonuclease I | New England Biolabs | M0293L |
C1 Single Cell Auto Prep Array for mRNA Seq Multipack—contains:
|
Fluidigm |
100‐6041 100‐5518 100‐6209 100‐5757 |
| SMARTer Ultra Low RNA Kit for Illumina Sequencing | Clontech/Takara | 634936 |
| Advantage 2 PCR Kit | Clontech/Takara | 639206 |
| Nextera XT DNA Library Preparation Kit | Illumina | FC‐131‐1096 |
| Nextera XT Index Kit v2 Set A | Illumina | FC‐131‐2001 |
| Nextera XT Index Kit v2 Set B | Illumina | FC‐131‐2002 |
| Nextera XT Index Kit v2 Set C | Illumina | FC‐131‐2003 |
| Nextera XT Index Kit v2 Set D | Illumina | FC‐131‐2004 |
| Agencourt AMPure XP | Beckman Coulter | A63882 |
| DNA Suspension Buffer, pH 8.0 | Teknova | T0221 |
| HS NGS Fragment 35‐6000bp.mthds | Labgene Scientific SA | DNF‐486‐0500 |
| HS NGS Fragment 1‐6000bp.mthds | Labgene Scientific SA | DNF‐474‐0500 |
| SS NGS Fragment 35‐6000bp.mthds | Labgene Scientific SA | DNF‐479‐0500 |
| SS NGS Fragment 1‐6000bp.mth | Labgene Scientific SA | DNF‐473‐0500 |
| RNA 6000 Pico Complete Kit | Agilent Technologies | 5067‐1513 |
| Agilent RNA 6000 Nano Kit | Agilent Technologies | 5067‐1511 |
| Quant‐IT RiboGreen® RNA Assay Kit | Life Technologies | R11490 |
| Quant‐iT PicoGreen® dsDNA Assay Kit | Life Technologies | P11496 |
| GREINER‐384‐Well plate, black | Greiner | 784076 |
| TruSeq RNA Library Preparation Kit v2, Set A | Illumina | RS‐122‐2001 |
| TruSeq RNA Library Preparation Kit v2, Set B | Illumina | RS‐122‐2002 |
| Superscript II Reverse Transcriptase | Life Technologies | 18064‐014 |
| twin.tec PCR Plate 96, semi‐skirted | Vaudaux‐Eppendorf AG | 0030 128.575 |
| Ethanol absolute Honeywell 1L | Honeywell | 02860‐1L |
| 10mM TRIS‐HCl with 0.1% TWEEN‐20, pH 8.5 | TEKNOVA | T7724 |
| Experimental models | Source | Identifier |
|---|---|---|
| Mouse: Hes5::GFP | Verdon Taylor (Basak & Taylor, 2007) | N/A |
| Mouse: Tbr2::GFP | Arnold et al (2009) | N/A |
| Oligonucleotides | Source | Identifier |
|---|---|---|
| Ccnd1_Forward_5′‐ TGCCGAGAAGTTGTGCATCTA‐3′ | This paper | N/A |
| Ccnd1_Reverse_5′‐ TGTTCACCAGAAGCAGTTCCA‐3′ | This paper | N/A |
| Crabp2_Forward_5′‐ATGCCTAACTTTTCTGGCAACT‐3′ | https://pga.mgh.harvard.edu/primerbank/ | N/A |
| Crabp2_Reverse_5′‐GCACAGTGGTGGAGGTTTTGA‐3′ | https://pga.mgh.harvard.edu/primerbank/ | N/A |
| Hbb‐bh1_Forward_5′‐GAAACCCCCGGATTAGAGCC‐3′ | https://pga.mgh.harvard.edu/primerbank/ | N/A |
| Hbb‐bh1_Reverse_5′‐GAGCAAAGGTCTCCTTGAGGT‐3′ | https://pga.mgh.harvard.edu/primerbank/ | N/A |
| Bcl11b_Forward_5′‐CCCGACCCTGATCTACTCAC‐3′ | https://pga.mgh.harvard.edu/primerbank/ | N/A |
| Bcl11b_Reverse_5′‐ CTCCTGCTTGGACAGATGCC‐3′ | https://pga.mgh.harvard.edu/primerbank/ | N/A |
| Bhlhe22_Forward _5′‐ AAGCGCATCAAGGTGGAGAA‐3′ | This paper | N/A |
| Bhlhe22_Reverse_5′‐ CTTGGTTGAGGTAGGCGACTAA‐3′ | This paper | N/A |
| Cabp1_Forward_5′‐ GAGCTGTCTCAGCAGATCAAC‐3′ | https://pga.mgh.harvard.edu/primerbank/ | N/A |
| Cabp1_Reverse_5′‐ TTTAGGGCCCATCAGTTCCA‐3′ | https://pga.mgh.harvard.edu/primerbank/ | N/A |
| Cntn2_Forward_5′‐ GCTGATGCCATGACCATGAA‐3′ | This paper | N/A |
| Cntn2_Reverse_5′‐ ACTTAAGGCTGAGGCTGGAA‐3′ | This paper | N/A |
| Id2_Forward_5′‐ ACCCTGAACACGGACATCA‐3′ | This paper | N/A |
| Id2_Reverse_5′‐ TCGACATAAGCTCAGAAGGGAA‐3′ | This paper | N/A |
| Satb2_Forward_5′‐ GCCGTGGGAGGTTTGATGATT‐3′ | https://pga.mgh.harvard.edu/primerbank/ | N/A |
| Satb2_Reverse_5′‐ACCAAGACGAACTCAGCGTG‐3′ | https://pga.mgh.harvard.edu/primerbank/ | N/A |
| Tubb3_Forward_5′‐ GCGCATCAGCGTATACTACA‐3′ | This paper | N/A |
| Tubb3_Reverse_5′‐ AGGTTCCAAGTCCACCAGAA‐3′ | This paper | N/A |
| Fezf2_Forward_5′‐ GTCACCGGCCACTTCTAAAAC‐3′ | https://pga.mgh.harvard.edu/primerbank/ | N/A |
| Fezf2_Reverse_5′‐GTCTGCCTCTAACGCAGCA‐3′ | https://pga.mgh.harvard.edu/primerbank/ | N/A |
| ApoE_Forward_5′‐ CTGACAGGATGCCTAGCCG‐3′ | https://pga.mgh.harvard.edu/primerbank/ | N/A |
| ApoE_Reverse_5′‐ CGCAGGTAATCCCAGAAGC‐3′ | https://pga.mgh.harvard.edu/primerbank/ | N/A |
| Aqp4_Forward_5′‐ CTTTCTGGAAGGCAGTCTCAG‐3′ | https://pga.mgh.harvard.edu/primerbank/ | N/A |
| Aqp4_Reverse_5′‐ CCACACCGAGCAAAACAAAGAT‐3′ | https://pga.mgh.harvard.edu/primerbank/ | N/A |
| Cspg4_Forward_5′‐ GGGCTGTGCTGTCTGTTGA‐3′ | https://pga.mgh.harvard.edu/primerbank/ | N/A |
| Cspg_Reverse_5′‐ TGATTCCCTTCAGGTAAGGCA‐3′ | https://pga.mgh.harvard.edu/primerbank/ | N/A |
| Hmgb2_Forward_5′‐ GTGGCAGGTACATGCAATCC‐3′ | This paper | N/A |
| Hmgb2_Reverse_5′‐ GTACTTTGGTGGTGGTGTCCTA‐3′ | This paper | N/A |
| Olig1_Forward_5′‐ CTGTATGAGCTGGTGGGTTACA‐3′ | This paper | N/A |
| Olig1_Reverse_5′‐ GAGAAGGGATGCGGTGGAA‐3′ | This paper | N/A |
| Pdgfra_Forward_5′‐ AGAGTTACACGTTTGAGCTGTC‐3′ | https://pga.mgh.harvard.edu/primerbank/ | N/A |
| Pdgfra_Reverse_5′‐ GTCCCTCCACGGTACTCCT‐3′ | https://pga.mgh.harvard.edu/primerbank/ | N/A |
| Sparcl1_Forward_5′‐ GGCAATCCCGACAAGTACAAG‐3′ | https://pga.mgh.harvard.edu/primerbank/ | N/A |
| Sparcl1_Reverse_5′‐TGGTTTTCTATGTCTGCTGTAGC‐3′ | https://pga.mgh.harvard.edu/primerbank/ | N/A |
| Tril_Forward_5′‐ CTATGTATGCCGTTGGGGTAGG‐3′ | https://pga.mgh.harvard.edu/primerbank/ | N/A |
| Tril_Reverse_5′‐ AGCTTTTCACTTATTTCGCCCAT‐3′ | https://pga.mgh.harvard.edu/primerbank/ | N/A |
| Cckar_Forward_5′‐ CTTTTCTGCCTGGATCAACCT‐3′ | https://pga.mgh.harvard.edu/primerbank/ | N/A |
| Cckar_Reverse_5′‐ ACCGTGATAACCAGCGTGTTC‐3′ | https://pga.mgh.harvard.edu/primerbank/ | N/A |
| Ccnb1_Forward_5′‐ AAGGTGCCTGTGTGTGAACC‐3′ | https://pga.mgh.harvard.edu/primerbank/ | N/A |
| Ccnb1_Reverse_5′‐ GTCAGCCCCATCATCTGCG‐3′ | https://pga.mgh.harvard.edu/primerbank/ | N/A |
| Dhrs4_Forward_5′‐CCTGTCGCTCCTTCCATCCTA‐3′ | https://pga.mgh.harvard.edu/primerbank/ | N/A |
| Dhrs4_Reverse_5′‐ GCAAGGTGTCTCTTTTGTGGGA‐3′ | https://pga.mgh.harvard.edu/primerbank/ | N/A |
| Tbr2_Forward_5′‐ GCGCATGTTTCCTTTCTTGAG‐3′ | https://pga.mgh.harvard.edu/primerbank/ | N/A |
| Tbr2_Reverse_5′‐ GGTCGGCCAGAACCACTTC‐3′ | https://pga.mgh.harvard.edu/primerbank/ | N/A |
| Kif2c_Forward_5′‐ ATGGAGTCGCTTCACGCAC‐3′ | https://pga.mgh.harvard.edu/primerbank/ | N/A |
| Kif2c_Reverse_5′‐ CCACCGAAACACAGGATTTCTC‐3′ | https://pga.mgh.harvard.edu/primerbank/ | N/A |
| Mcm2_Forward_5′‐ ATCCACCACCGCTTCAAGAAC‐3′ | https://pga.mgh.harvard.edu/primerbank/ | N/A |
| Mcm2_Reverse_5′‐ TACCACCAAACTCTCACGGTT‐3′ | https://pga.mgh.harvard.edu/primerbank/ | N/A |
| Uncx_Forward_5′‐ ACCCGCACCAACTTTACCG‐3′ | https://pga.mgh.harvard.edu/primerbank/ | N/A |
| Uncx_Reverse_5′‐ TGAACTCGGGACTCGACCA‐3′ | https://pga.mgh.harvard.edu/primerbank/ | N/A |
| Robo3_Forward_5′‐ AGATGAACTTGTTCGCGGACT‐3′ | https://pga.mgh.harvard.edu/primerbank/ | N/A |
| Robo3_Reverse_5′‐ GGAAGCAGACTAGGGTTGAGC‐3′ | https://pga.mgh.harvard.edu/primerbank/ | N/A |
| Nde1_Forward_5′‐ATGGAGGACTCGGGAAAGACC‐3′ | https://pga.mgh.harvard.edu/primerbank/ | N/A |
| Nde1_Reverse_5′‐TCAGCTTCGTATTCTCGGCTT‐3′ | https://pga.mgh.harvard.edu/primerbank/ | N/A |
| Tpx2_Forward_5′‐ GATGCCCCCACCGACTTTATC‐3′ | https://pga.mgh.harvard.edu/primerbank/ | N/A |
| Tpx2_Reverse_5′‐ CTTGTTCTCCAAGTTGGCCTT‐3′ | https://pga.mgh.harvard.edu/primerbank/ | N/A |
| Loxl1_Forward_5′‐ GAGTGCTATTGCGCTTCCC‐3′ | https://pga.mgh.harvard.edu/primerbank/ | N/A |
| Loxl1_Reverse_5′‐ GGTTGCCGAAGTCACAGGT‐3′ | https://pga.mgh.harvard.edu/primerbank/ | N/A |
| Unc5d_Forward_5′‐ TGGCTAGGACTCTTTTTCTGGG‐3′ | https://pga.mgh.harvard.edu/primerbank/ | N/A |
| Unc5d_Reverse_5′‐ GCTCCTCGATGAAATGAGGCA‐3′ | https://pga.mgh.harvard.edu/primerbank/ | N/A |
| Ezr_Forward_5′‐ CAATCAACGTCCGGGTGAC‐3′ | https://pga.mgh.harvard.edu/primerbank/ | N/A |
| Ezr_Reverse_5′‐GCCAATCGTCTTTACCACCTGA‐3′ | https://pga.mgh.harvard.edu/primerbank/ | N/A |
| Mef2c_Forward_5′‐ GTCAGTTGGGAGCTTGCACTA‐3′ | https://pga.mgh.harvard.edu/primerbank/ | N/A |
| Mef2c_Reverse_5′‐ CGGTCTCTAGGAGGAGAAACA‐3′ | https://pga.mgh.harvard.edu/primerbank/ | N/A |
| Usp43_Forward_5′‐ AGCTCACGGGCTGGTATCT‐3′ | https://pga.mgh.harvard.edu/primerbank/ | N/A |
| Usp43_Reverse_5′‐ AAGACCTGTACTGTGCTTGAAAG‐3′ | https://pga.mgh.harvard.edu/primerbank/ | N/A |
| Lrfn5_Forward_5′‐ TGTTTCTCATTGGCATAGCTGT‐3′ | https://pga.mgh.harvard.edu/primerbank/ | N/A |
| Lrfn5_Reverse_5′‐ TGGTGGAACAAATAGAAGCCCT‐3′ | https://pga.mgh.harvard.edu/primerbank/ | N/A |
| Ntsr1_Forward_5′‐CAGTTCGGACTGGAGACGATG‐3′ | https://pga.mgh.harvard.edu/primerbank/ | N/A |
| Ntsr1_Reverse_5′‐ ACCAGCACCTTGGAATAAATGTC‐3′ | https://pga.mgh.harvard.edu/primerbank/ | N/A |
| Gucy1a3_Forward_5′‐ CCCCTGGTCAGGTTCCTAAG‐3′ | https://pga.mgh.harvard.edu/primerbank/ | N/A |
| Gucy1a3_Reverse_5′‐ GGAGACTCCCTTCTGCATTCT‐3′ | https://pga.mgh.harvard.edu/primerbank/ | N/A |
| β‐actin_Forward_5′‐ AGGTGACAGCATTGCTTCTG‐3′ | https://pga.mgh.harvard.edu/primerbank/ | N/A |
| β‐actin_Reverse_5′‐ GGGAGACCAAAGCCTTCATA‐3′ | https://pga.mgh.harvard.edu/primerbank/ | N/A |
| Ubb_Forward_5′‐ TCTGAGGGGTGGCTATTAA‐3′ | https://pga.mgh.harvard.edu/primerbank/ | N/A |
| Ubb_Reverse_5′‐TGCTTACCATGCAACAAAAC‐3′ | https://pga.mgh.harvard.edu/primerbank/ | N/A |
| Topp_Forward_5′‐GGCTGTACAGAGACTAGAAGAGCA‐3′ | https://pga.mgh.harvard.edu/primerbank/ | N/A |
| Topp_Reverse_5′‐CCTCTCGATCTGTGGCTTG‐3′ | https://pga.mgh.harvard.edu/primerbank/ | N/A |
| Gapdh_Forward_5′‐ CTCCCACTCTTCCACCTTCG‐3′ | https://pga.mgh.harvard.edu/primerbank/ | N/A |
| Gapdh_Reverse_5′‐ CCACCACCCTGTTGCTGTAG‐3′ | https://pga.mgh.harvard.edu/primerbank/ | N/A |
| Resource | Source | Identifier |
|---|---|---|
| Fiji | Hosted by University of Wisconsin | https://imagej.net/Fiji/Downloads |
| Photoshop | Adobe | N/A |
| Illustrator | Adobe | N/A |
| Prism 7 | GraphPad Software, Inc | https://www.graphpad.com/scientific‐software/prism/ |
| R | R Core Team | https://www.r‐project.org |
| MATLAB R2016a 9.0.0.341360 | MathWorks | mathworks.com/products/matlab |
| Python 2.7.11 | Python Software Foundation | www.python.org |
| Python 3.6 | Python Software Foundation | www.python.org |
| goatools | https://github.com/tanghaibao/goatools | |
| InCHLib | https://openscreen.cz/software/inchlib/home/ | |
| MGI_Gene_Model_Coord.rpt | http://www.informatics.jax.org/downloads/reports/index.html | |
| fastcluster | http://www.danifold.net/fastcluster.html | |
| Inkscape | The Inkscape Project | inkscape.org |
Methods and Protocols
Experiment model and subject details
Hes5::GFP (Basak & Taylor, 2007) and Tbr2::GFP (Arnold et al, 2009) transgenic lines have been described previously. Mice were maintained on a 12‐h day–night cycle with free access to food and water under specific pathogen‐free conditions and according to the Swiss federal regulations. All procedures were approved by the Basel Cantonal Veterinary Office (license number ZH_Tay).
Method details
Tissue preparation and fluorescence‐assisted cell sorting (FACS)
Dorsal cortices from embryonic day (E10.5) to postnatal day 1 (PN) were micro‐dissected and dissociated into single‐cell suspensions using Papain and Ovo‐mucoid mix (as described previously Giachino et al, 2009). Cells were washed with L15 medium and FAC‐sorted for GFP‐positive NSCs using FACSariaIII (BD Biosciences) derived from Hes5::GFP transgenic embryos for NSCs and Tbr2::GFP transgenic embryos for BPs and NBNs. For each time point, 3–4 biological replicates were generated.
RNA isolation and RNA sequencing
Total RNA was isolated from FAC‐sorted GFP‐positive cells from Hes5::GFP and Tbr2::GFP transgenic lines using TRIzol reagent. A time course was performed with NSCs, BPs, and NBNs isolated at each time point during development from E10.5 to postnatal day 1 (PN) or as specified in the Fig 1A. Samples were analyzed for their integrity and concentration using Agilent 2100 Bioanalyzer and Quant‐IT RiboGreen RNA Assay Kit. Sequencing libraries were prepared with the Illumina TruSeq RNA Library Prep Kit v2 according to Illumina's instructions. After quality control (Fragment Analyzer, AATI), libraries were pooled and loaded on an Illumina flow cell for cluster generation (HiSeq SR Cluster Kit v4 cBot). Libraries were sequenced SR50 on the HiSeq 2500 system (HiSeq SBS Kit V4) following the manufacturer's protocols.
Single‐cell RNA sequencing
Single‐cell capture, lysis, and cDNA preparation were performed with the Fluidigm C1 system. Cells were loaded on a microfluidic C1 Single Cell Auto Prep Array for mRNA Seq (5–10 μm), and capture efficiency evaluated using microscopy. Lysis, reverse transcription, and cDNA amplification were performed with the SMARTer Ultra Low RNA Kit for Illumina Sequencing (Clontech/Takara) according to Fluidigm's guidelines for single‐cell RNA‐seq on the C1 system. cDNA was harvested, profiles checked on the Fragment Analyzer (AATI), and their concentration determined using Quant‐iT PicoGreen dsDNA Assay Kit. For subsequent library preparation using Nextera XT DNA library preparation kit (Illumina) following the Fluidigm manual, cDNAs were normalized to 0.3 ng/μl. Libraries were pooled and sequenced SR75 on an Illumina NextSeq 500 system (75 cycles High Output v2 kit).
qPCR validation
Total RNA was isolated from FAC‐sorted GFP positive cells from Hes5::GFP (E11.5, E15.5 and E18.5) and Tbr2::GP (E13.5 BPs, E15.5 BPs and E15.5 NBNs) transgenic embryos using TRIzol reagent. Independent biological replicates were generated for RT‐qPCR validation. Samples were analyzed for their integrity and concentration using Agilent 2100 Bioanalyzer and Quant‐IT RiboGreen RNA Assay Kit. DNase treatment was done using Roche DNase kit and cDNA prepared using the PreAmp and Reverse Transcription Master Mix from Fluidigm. Deltagene Assay primers (Fluidigm) and EvaGreen (BioRad) were used for real‐time qPCR. Gene expression was assayed using Dynamic Array IFC chips and the BioMark system (Fluidigm). Fluidigm real‐time PCR analysis software was used to calculate cycle threshold (C t) values for each qPCR.
Tissue preparation and immunohistochemistry
Hes5::GFP and Tbr2::GFP‐positive brains at E17.5 were isolated and fixed with 4% PFA in 0.1 M phosphate buffer (PBS). Brains were embedded in 3% agarose, sectioned 40 μm thick using a Vibrotome. Sections were mounted in mounting media containing diazabicyclo‐octane (DABCO; Sigma) as an anti‐fading agent on SuperFrost glass slides and visualized using Zeiss Apotome 2 microscope. For immunostainings, fixed brains were equilibrated serially with 15% and then 30% sucrose solution in PBS overnight at 4°C. Brains were embedded in 100% OCT and 20 μm sections collected on SuperFrost glass slides.
Adherent NSC culture in vitro and immunocytochemistry
Primary NSCs were isolated from E13.5 dorsal cortices from Hes5::GFP transgenic embryos and BPs, NBNs were isolated at E16.5 from Tbr2::GFP transgenic embryos. Following FAC‐sorting, the cells were seeded in 100 μg/ml Poly L‐Lysine pre‐coated 8‐well Lab‐Tek chamber slides and cultured in DMEM/F12 + Glutamax medium (with 2% B27). The cells were incubated for 1 h at 37°C, 5% CO2. The cells were fixed with 4% PFA, at RT for 15 min and blocked with 5% Normal donkey serum and 0.1% Triton X‐100. Primary antibody incubations were performed overnight at 4°C. Secondary antibody incubations were performed at RT, for 1 h. The cells were incubated with 1:1000 Dapi for 30 min at RT and rinsed with PBS. Slides were mounted with DABCO and imaged using Zeiss Apotome 2 microscope.
Quantification and statistical analysis
Images taken by Zeiss Apotome 2 were processed with FIJI software. Contrast and image size of IF images were adjusted with Adobe photoshop. Expression profiles of genes of interest were produced in R. Bar graphs were generated by GraphPad Prism 7. All figures were made in Adobe Illustrator CS6.
Sample size is mentioned in the excel sheets for the quantifications. For FACS analysis, for Hes5::GFP transgenic embryos, only the bright GFP‐positive cells were collected. For Tbr2::GFP transgenic embryos, both bright and dim GFP‐positive cells were collected and analyzed. For IF images, three fields of views were analyzed and quantified per sample. Unpaired t‐tests were used for qPCR validation experiments. The cutoff value for statistical significance was indicated in corresponding tables.
Read mapping and data preprocessing
Reads from single cell and cell population mRNA‐Seq were mapped to the transcriptome (GENCODE Release M2 GRCm38.p2) with kallisto 0.43.0[*]. The option ‐‐pseudobam was used to save the pseudoalignments to transcriptome in BAM file. The reads mapping to multiple transcripts were uniformly distributed. To obtain the expression per transcript, we first divided the number of reads mapping to each transcript by the length of the transcript in nucleotides and then transformed the length‐normalized read counts in transcript per million (TPM). Gene expression was obtained by summing for each gene the TPM of the transcripts corresponding to the gene. Promoter expression was obtained by summing for each promoter the length‐normalized count of the transcripts associated with the promoter and then transformed in TPM. We added a pseudo‐count of 0.5 to express transcript, gene, and promoter expression in logarithmic space (log2(TPM + 0.5)). For the population mRNA‐Seq, we computed replicate averages in log2(TPM + 0.5). The method used is adapted from Bray et al (2016a, 2016b).
Differentially expressed genes in different cell types
A pairwise comparison between each two cell types is applied using tximport and Deseq2 packages in R. Next, the first 50 top DEGs (differentially expressed genes) for each cell type have been selected considering fold change of more than 2 and adjusted P‐value < 1e‐3. Finally, the common DEGs of each cell type are used for visualization. The complete list of DEGs of each comparison is given in (Dataset EV1).
The goal of our analysis was to find the most optimal marker genes. That is, if we were to only make gene expression measurements of a few genes (using qPCR, for example), those that give us the most information about the sample. When we are only interested in knowing whether the sample belongs to one of two classes (e.g., NSC vs. non‐NSC), this information content is given by the conditional entropy described below. Hence, we use it as a score to find good marker genes. In the derivation, we account for the fact that the empirical expression variance from a few data does not necessarily reflect its true variance by using a prior that makes very small and very large variances unlikely.
Assuming that the probability to measure log‐expression of a gene follows a Gaussian distribution with mean and inverse variance , and using a uniform prior for and a gamma‐distribution prior for , we find the likelihood of getting a set of measurements for samples of class to be
where is the empirical variance of . Hence, we numerically find the maximum‐likelihood estimates from maximizing the sum of log‐likelihoods across all genes. Finally, the inferred probability distribution of in class is:
where and . This distribution is approximately Gaussian with variance , which provides us with a more accurate estimate of the true variance of a gene rather than simply taking .
Furthermore, we can take the expression of and to calculate the conditional entropy . While
with being the digamma function, has an analytical solution, with can be calculated through numerical integration.
In an experiment that only measures the expression of a single gene, serves as a measure for how much information the result provides about the class of the sample. With only two classes, we can write , which we can numerically invert to find , the probability to falsely classify a sample based on gene expression. The table below summarizes the classes for which we looked for such marker genes:
| Class 2 | Number of marker genes | |
|---|---|---|
| By cell type | ||
| NSC | Non‐NSC | 37 |
| BP | Non‐BP | 0 |
| NBN | Non‐NBN | 136 |
| NSC | BP | 49 |
| NSC | NBN | 469 |
| BP | NBN | 249 |
| NSC by phase | ||
| Expansion NSC | Non‐expansion NSC | 222 |
| Neurogenesis NSC | Non‐neurogenesis NSC | 4 |
| Gliogenesis NSC | Non‐gliogenesis NSC | 102 |
| Expansion NSC | Neurogenesis NSC | 207 |
| Expansion NSC | Gliogenesis NSC | 759 |
| Neurogenesis NSC | Gliogenesis NSC | 117 |
| Neurogenic (E12.5–16.5) NSC by day | ||
| E12.5 | Other days | 0 |
| E13.5 | Other days | 3 |
| E14.5 | Other days | 0 |
| E15.5 | Other days | 1 |
| E16.5 | Other days | 50 |
| E12.5‐E13.5 | E14.5‐E16.5 | 9 |
| E12.5‐E14.5 | E15.5‐E16.5 | 16 |
| BP by day | ||
| E12.5 | Other days | 248 |
| E13.5 | Other days | 0 |
| E14.5 | Other days | 29 |
| E15.5 | Other days | 0 |
| E16.5 | Other days | 1 |
| E17.5 | Other days | 3 |
| E18.5 | Other days | 1 |
| PN | Other days | 38 |
| E12.5‐E13.5 | E14.5‐PN | 54 |
| E12.5‐E14.5 | E15.5‐PN | 83 |
| E12.5‐E15.5 | E16.5‐PN | 0 |
| E12.5‐E16.5 | E17.5‐PN | 15 |
| E12.5‐E17.5 | E18.5‐PN | 4 |
| Other | ||
|
BP E12.5‐E14.5 |
NBN | 354 |
| BP E15.5‐PN | NBN | 650 |
Gene regulatory networks
Using a set of curated binding motifs for 503 families of transcription factors, ISMARA predicts TF binding sites in the promoters (TSS ± 500 bp) of all genes' genome‐wide and summarizes these predictions by total count Npm of the number of binding sites for motif m on the promoter region of promoter p. Using a matrix of measured gene expression of promoter p in sample s Eps (measured in logarithms of transcripts per million transcripts), ISMARA infers the matrix Ams of activities of each motif m in each sample s, using the likelihood
together with a Gaussian prior on the motif activities. To quantify the significance of the regulatory interaction from each motif m to each target promoter p (where all promoters that contain at least on binding site for motif m are potential targets), ISMARA calculates the log‐likelihood ratio of the model without and with the specific interaction Npm. The core regulatory networks of Fig 3E and H were obtained by taking all interactions with a log‐likelihood of at least 28 for Fig 3E and at least 15 for Fig 3H.
Furthermore, motif activities at each time point and cell type are given as a mean and a standard deviation of the posterior distribution over motif activities. The significance of each motif is characterized by a Z‐score, which is calculated as follows: for each sample, the ratio of the estimated motif activity and its standard deviation is squared, averaged across the samples, and finally the square root of the average is calculated. That is, a motif's Z‐score corresponds to the average number of standard deviations the motif activity is away from zero across the samples. For Fig 3H, we further restricted the core regulatory network to motifs with a Z‐score of at least 1.
When analyzing the NSCs, we noticed that motifs can be roughly distinguished as being active in either the expansion, neurogenic or gliogenic phases. To make this more visible, we have color‐coded each motif of the graph (Fig 3E) in red for motifs active in expansion phase, in green for motif active in neurogenesis phase, and in blue for motifs active in gliogenesis phase. Some motifs are active in multiple phases, and we colored motifs using an HSV wheel to interpolate the motif activity profile between those three states. For example, Pou5f1 in Fig 3E is active in both neurogenesis and gliogenesis phases and is therefore colored in cyan, i.e., between green and blue on the HSV wheel.
When analyzing the Neurogenic NSCs, BPs, and NBNs, we noticed that motifs would either mostly vary along the first PC axis, i.e., distinguishing samples of cell types, or along the second PC axis, i.e., distinguishing samples from different time points. We therefore color‐coded the motifs of the graph (Fig 3H) from cyan to magenta, cyan representing genes that vary across time but that are constant across cell types and magenta representing motifs that vary across cell types but that are constant across time. We use a continuous gradient to report motifs varying across both time and cell types, as for instance, motifs Pou2f2_Pou3f1 on Fig 3H.
Each node on the networks of Fig 3E and H represents a TF motif. ISMARA also reports interactions between motifs and genes that are not transcription factors. To summarize the predicted target genes of each motif of the network, we ran a GO analysis (The Gene Ontology resource: enriching a GOld mine; Gene Ontology, 2021), and we use dotted edges to associate each motif with the main gene ontology biological process categories that are overrepresented among its predicted target genes.
Selection of highly variable genes
To select the most highly variable genes (HVGs), we have defined a score for each gene based on the contribution of each gene on each principal component and the variance that each component explains considering the first two components, as following:
Where refers to the weight (contribution) of gene in , and denotes the percentage of variance that is covered by . Next, the first 2000 genes with the highest scores are selected as the highly variable genes, HVGs.
Clustering of single cells
First, single cells at each time point are clustered by applying 500 times k‐means clustering to avoid the dependency of k‐means clustering on the random initialization number (seed value). To implement k‐means clustering, clustering package considering Euclidean distance as metric in R is used. Next, the assignment matrix is estimated based on the frequency of observing each two single cells in the same clustering at each iteration. Next, the hierarchal clustering is used to sort the assignment matrix using Euclidean distance as metric and ward. D2 as method in hclust function in R.
Selection of differentially expressed gene in single cells
Kruskal–Wallis non‐parametric test is used to select differentially expressed genes, and genes with adjusted P‐value of less than 1e‐3 are considered as significantly differentially expressed genes.
Visualization
PCA is applied using prcomp function in R after centering the log transferred data. Heatmap are illustrated using pheatmap package in R on log transferred data.
Secondary KNN clustering and UMAP visualization
Raw counts were globally normalized; the expression of each gene was normalized against the total expression for each cell and multiplied by a scale factor of 10,000 using LogNormalize in Seurat v4.0. The most variable genes were then identified using FindVariableFeatures; this used local polynomial regression to fit log‐variance to log‐mean value with gene variance being calculated from the standardized values. The top 2,000 most variable genes were scaled and used for downstream analyses. Significant principal components were carried forward, and a K‐nearest neighbor graph was constructed on the Euclidean distance in PCA space. Edges were weighted based on shared overlap in neighborhoods using Jaccard index and graph‐based Louvain clustering was conducted using FindClusters. For UMAP visualization, UMAP coordinates were calculated in PCA space for significant PCs and cells were assigned by previously derived cluster identities.
Trajectory inference analysis
Cell embeddings from established clustering were then used to infer lineage structures in low‐dimensional space using Slingshot. First, the global lineage structure was identified constructing a cluster‐based minimal spanning tree in a semi‐supervised manner using a priori knowledge using GetLineages. This was then converted into smooth lineages to infer pseudotime by fitting simultaneous principal curves for each lineage with the getCurves function.
Linnarsson comparisons
Our C1 dataset was compared against (La Manno et al, 2021) single‐cell developmental time course dataset, all cells from tissue labeled as “Forebrain” and “Dorsal Forebrain” by (La Manno et al, 2021) were clustered to capture cells spanning E9‐E18 developmental timepoints. For radial glial exclusive comparisons, the cells were further subset to include only cells classed as “Radial Glia” in the original analysis. Canonical correlation analysis (CCA) was used to integrate this dataset with our C1 data. Log‐normalized and scaled variable features that were repeatedly variable in both datasets were called and used to define cell anchors between the datasets, these anchors were then used to integrate the two datasets together. The integrated datasets were then clustered and visualized using UMAP as described above.
NeuroStemX data exploration web app
The NeuroStemX data exploration web app makes it possible to navigate data produced in the NeuroStemX project. The site supports viewing data by focusing on one of several parameters: gene list, biological sample, or measurement type (single cell vs. population). The website allows entry of a list of mouse genes (either as gene symbol or Ensembl ID) to focus on the data acquired for those genes. It alternatively allows viewing data on individual samples. When looking at a sample, a list of genes that have been determined to be outliers are shown. A gene is considered an outlier for a sample if the expression value of the gene either exceeds the 75th percentile +1.5*iqr or is less than the 25th percentile −1.5*iqr, where percentiles and inter‐quartile range are computed based on the expression values for the given gene over all samples within the measurement type (single cell or population).
When viewing all data for a measurement type, data are displayed using hierarchical clustering. The InCHLib widget displays the clustered data. Clustering is performed using the fastcluster package in python with distance (both row and column) calculated using the Euclidean metric and linkage (both row and column) performed using Ward's method (Mullner, 2013; Skuta et al, 2014). The site supports performing gene ontology enrichment analysis either locally, using goatools, or with PANTHER. For local enrichment analysis, we use the MGI_Gene_Model_Coord annotations based on the GRCm38 assembly (Mi et al, 2017).
Goatools: https://github.com/tanghaibao/goatools
Haibao Tang et al GOATOOLS: Tools for Gene Ontology. Zenodo. 10.5281/zenodo.31628.
MGI_Gene_Model_Coord.rpt
Author contributions
Tanzila Mukhtar: Data curation; formal analysis; validation; investigation; writing—original draft; writing—review and editing. Jeremie Breda: Formal analysis; writing—original draft; writing—review and editing. Manal A Adam: Formal analysis; writing—review and editing. Marcelo Boareto: Formal analysis; writing—original draft. Pascal Grobecker: Formal analysis; writing—original draft. Zahra Karimaddini: Formal analysis; writing—original draft. Alice Grison: Formal analysis; writing—original draft. Katja Eschbach: Data curation; validation; methodology. Ramakrishnan Chandrasekhar: Software; visualization. Swen Vermeul: Software; visualization. Michal Okoniewski: Software; visualization. Mikhail Pachkov: Software; visualization. Corey C Harwell: Writing—review and editing. Suzana Atanasoski: Conceptualization; funding acquisition; writing—original draft. Christian Beisel: Conceptualization; supervision; funding acquisition; methodology; writing—original draft. Dagmar Iber: Conceptualization; supervision; funding acquisition; writing—original draft. Erik van Nimwegen: Conceptualization; data curation; software; formal analysis; supervision; funding acquisition; methodology; writing—original draft; writing—review and editing. Verdon Taylor: Conceptualization; supervision; funding acquisition; methodology; writing—original draft; project administration; writing—review and editing.
Disclosure and competing interests statement
The authors declare that they have no conflict of interest.
Supporting information
Appendix
Expanded View Figures PDF
Dataset EV1
Dataset EV2
Dataset EV3
Dataset EV4
Dataset EV5
Dataset EV6
Dataset EV7
PDF+
Acknowledgements
We thank the members of the V.T. laboratory for helpful discussions and Frank Sager for excellent technical assistance. We thank the Animal Core Facility of the University of Basel. This work was a part of a SystemsX consortium ‐ NeuroStemX supported by the Swiss National Science Foundation grant 51RT‐0_145728. M.A and C.H were supported by NIH R01NS102228.
Contributor Information
Tanzila Mukhtar, Email: tanzila.mukhtar@ucsf.edu.
Dagmar Iber, Email: dagmar.iber@bsse.ethz.ch.
Erik van Nimwegen, Email: erik.vannimwegen@unibas.ch.
Verdon Taylor, Email: verdon.taylor@unibas.ch.
Data availability
The RNA sequencing datasets have been deposited in Gene Expression Omnibus (GEO) with accession number GEO:
https://www.ncbi.nlm.nih.gov/geo/query/acc.cgi?acc=GSE134688 and
https://www.ncbi.nlm.nih.gov/geo/query/acc.cgi?acc=GSE134738
For ISMARA, data can be found here:
References
- Arber C, Precious SV, Cambray S, Risner‐Janiczek JR, Kelly C, Noakes Z, Fjodorova M, Heuer A, Ungless MA, Rodriguez TA et al (2015) Activin A directs striatal projection neuron differentiation of human pluripotent stem cells. Development 142: 1375–1386 [DOI] [PMC free article] [PubMed] [Google Scholar]
- Arlotta P, Molyneaux BJ, Chen J, Inoue J, Kominami R, Macklis JD (2005) Neuronal subtype‐specific genes that control corticospinal motor neuron development in vivo . Neuron 45: 207–221 [DOI] [PubMed] [Google Scholar]
- Arnold SJ, Huang GJ, Cheung AF, Era T, Nishikawa S, Bikoff EK, Molnar Z, Robertson EJ, Groszer M (2008) The T‐box transcription factor Eomes/Tbr2 regulates neurogenesis in the cortical subventricular zone. Genes Dev 22: 2479–2484 [DOI] [PMC free article] [PubMed] [Google Scholar]
- Arnold SJ, Sugnaseelan J, Groszer M, Srinivas S, Robertson EJ (2009) Generation and analysis of a mouse line harboring GFP in the Eomes/Tbr2 locus. Genesis 47: 775–781 [DOI] [PMC free article] [PubMed] [Google Scholar]
- Artimo P, Duvaud S, Pachkov M, Ioannidis V, van Nimwegen E, Stockinger H (2016) The ISMARA client. F1000Res 5: 2851 [DOI] [PMC free article] [PubMed] [Google Scholar]
- Balwierz PJ, Pachkov M, Arnold P, Gruber AJ, Zavolan M, van Nimwegen E (2014) ISMARA: automated modeling of genomic signals as a democracy of regulatory motifs. Genome Res 24: 869–884 [DOI] [PMC free article] [PubMed] [Google Scholar]
- Bansod S, Kageyama R, Ohtsuka T (2017) Hes5 regulates the transition timing of neurogenesis and gliogenesis in mammalian neocortical development. Development 144: 3156–3167 [DOI] [PubMed] [Google Scholar]
- Basak O, Taylor V (2007) Identification of self‐replicating multipotent progenitors in the embryonic nervous system by high Notch activity and Hes5 expression. Eur J Neurosci 25: 1006–1022 [DOI] [PubMed] [Google Scholar]
- Basak O, Giachino C, Fiorini E, Macdonald HR, Taylor V (2012) Neurogenic subventricular zone stem/progenitor cells are Notch1‐dependent in their active but not quiescent state. J Neurosci 32: 5654–5666 [DOI] [PMC free article] [PubMed] [Google Scholar]
- Bel-Vialar S, Itasaki N, Krumlauf R (2002) Initiating Hox gene expression: in the early chick neural tube differential sensitivity to FGF and RA signaling subdivides the HoxB genes in two distinct groups. Development 129: 5103–5115 [DOI] [PubMed] [Google Scholar]
- Blaschuk KL, ffrench‐Constant C (1998) Developmental neurobiology: Notch is tops in the developing brain. Curr Biol 8: R334–R337 [DOI] [PubMed] [Google Scholar]
- Bray SJ (2006) Notch signalling: a simple pathway becomes complex. Nat Rev Mol Cell Biol 7: 678–689 [DOI] [PubMed] [Google Scholar]
- Bray NL, Pimentel H, Melsted P, Pachter L (2016a) Erratum: near‐optimal probabilistic RNA‐seq quantification. Nat Biotechnol 34: 888 [DOI] [PubMed] [Google Scholar]
- Bray NL, Pimentel H, Melsted P, Pachter L (2016b) Near‐optimal probabilistic RNA‐seq quantification. Nat Biotechnol 34: 525–527 [DOI] [PubMed] [Google Scholar]
- Brown N, Alkhayer K, Clements R, Singhal N, Gregory R, Azzam S, Li S, Freeman E, McDonough J (2016) Neuronal hemoglobin expression and its relevance to multiple sclerosis neuropathology. J Mol Neurosci 59: 1–17 [DOI] [PMC free article] [PubMed] [Google Scholar]
- Chuang JH, Tung LC, Lin Y (2015) Neural differentiation from embryonic stem cells in vitro: an overview of the signaling pathways. World J Stem Cells 7: 437–447 [DOI] [PMC free article] [PubMed] [Google Scholar]
- Dang L, Yoon K, Wang M, Gaiano N (2006) Notch3 signaling promotes radial glial/progenitor character in the mammalian telencephalon. Dev Neurosci 28: 58–69 [DOI] [PubMed] [Google Scholar]
- Desai AR, McConnell SK (2000) Progressive restriction in fate potential by neural progenitors during cerebral cortical development. Development 127: 2863–2872 [DOI] [PubMed] [Google Scholar]
- Di Bella DJ, Habibi E, Stickels RR, Scalia G, Brown J, Yadollahpour P, Yang SM, Abbate C, Biancalani T, Macosko EZ et al (2021) Molecular logic of cellular diversification in the mouse cerebral cortex. Nature 595: 554–559 [DOI] [PMC free article] [PubMed] [Google Scholar]
- Ebendal T, Bengtsson H, Soderstrom S (1998) Bone morphogenetic proteins and their receptors: potential functions in the brain. J Neurosci Res 51: 139–146 [DOI] [PubMed] [Google Scholar]
- Ecker JR, Geschwind DH, Kriegstein AR, Ngai J, Osten P, Polioudakis D, Regev A, Sestan N, Wickersham IR, Zeng H (2017) The BRAIN initiative cell census consortium: lessons learned toward generating a comprehensive brain cell atlas. Neuron 96: 542–557 [DOI] [PMC free article] [PubMed] [Google Scholar]
- Fode C, Ma Q, Casarosa S, Ang SL, Anderson DJ, Guillemot F (2000) A role for neural determination genes in specifying the dorsoventral identity of telencephalic neurons. Genes Dev 14: 67–80 [PMC free article] [PubMed] [Google Scholar]
- Franco SJ, Gil‐Sanz C, Martinez‐Garay I, Espinosa A, Harkins‐Perry SR, Ramos C, Muller U (2012) Fate‐restricted neural progenitors in the mammalian cerebral cortex. Science 337: 746–749 [DOI] [PMC free article] [PubMed] [Google Scholar]
- Fukuchi‐Shimogori T, Grove EA (2001) Neocortex patterning by the secreted signaling molecule FGF8. Science 294: 1071–1074 [DOI] [PubMed] [Google Scholar]
- Gaiano N, Fishell G (2002) The role of notch in promoting glial and neural stem cell fates. Annu Rev Neurosci 25: 471–490 [DOI] [PubMed] [Google Scholar]
- Gene Ontology C (2021) The gene ontology resource: enriching a GOld mine. Nucleic Acids Res 49: D325–D334 [DOI] [PMC free article] [PubMed] [Google Scholar]
- Giachino C, Basak O, Taylor V (2009) Isolation and manipulation of mammalian neural stem cells in vitro. Methods Mol Biol 482: 143–158 [DOI] [PubMed] [Google Scholar]
- Gil OD, Zanazzi G, Struyk AF, Salzer JL (1998) Neurotrimin mediates bifunctional effects on neurite outgrowth via homophilic and heterophilic interactions. J Neurosci 18: 9312–9325 [DOI] [PMC free article] [PubMed] [Google Scholar]
- Gomes FC, Sousa Vde O, Romao L (2005) Emerging roles for TGF‐beta1 in nervous system development. Int J Dev Neurosci 23: 413–424 [DOI] [PubMed] [Google Scholar]
- Gotz M, Huttner WB (2005) The cell biology of neurogenesis. Nat Rev Mol Cell Biol 6: 777–788 [DOI] [PubMed] [Google Scholar]
- Greig LC, Woodworth MB, Galazo MJ, Padmanabhan H, Macklis JD (2013) Molecular logic of neocortical projection neuron specification, development and diversity. Nat Rev Neurosci 14: 755–769 [DOI] [PMC free article] [PubMed] [Google Scholar]
- Guo C, Eckler MJ, McKenna WL, McKinsey GL, Rubenstein JL, Chen B (2013) Fezf2 expression identifies a multipotent progenitor for neocortical projection neurons, astrocytes, and oligodendrocytes. Neuron 80: 1167–1174 [DOI] [PMC free article] [PubMed] [Google Scholar]
- Han W, Sestan N (2013) Cortical projection neurons: sprung from the same root. Neuron 80: 1103–1105 [DOI] [PMC free article] [PubMed] [Google Scholar]
- Haubensak W, Attardo A, Denk W, Huttner WB (2004) Neurons arise in the basal neuroepithelium of the early mammalian telencephalon: a major site of neurogenesis. Proc Natl Acad Sci USA 101: 3196–3201 [DOI] [PMC free article] [PubMed] [Google Scholar]
- Hebert JM, Fishell G (2008) The genetics of early telencephalon patterning: some assembly required. Nat Rev Neurosci 9: 678–685 [DOI] [PMC free article] [PubMed] [Google Scholar]
- Heng YH, Zhou B, Harris L, Harvey T, Smith A, Horne E, Martynoga B, Andersen J, Achimastou A, Cato K et al (2015) NFIX regulates proliferation and migration within the murine SVZ neurogenic niche. Cereb Cortex 25: 3758–3778 [DOI] [PMC free article] [PubMed] [Google Scholar]
- Hevner RF, Daza RA, Rubenstein JL, Stunnenberg H, Olavarria JF, Englund C (2003) Beyond laminar fate: toward a molecular classification of cortical projection/pyramidal neurons. Dev Neurosci 25: 139–151 [DOI] [PubMed] [Google Scholar]
- Imayoshi I, Sakamoto M, Yamaguchi M, Mori K, Kageyama R (2010) Essential roles of Notch signaling in maintenance of neural stem cells in developing and adult brains. J Neurosci 30: 3489–3498 [DOI] [PMC free article] [PubMed] [Google Scholar]
- Itoh N, Ornitz DM (2004) Evolution of the Fgf and Fgfr gene families. Trends Genet 20: 563–569 [DOI] [PubMed] [Google Scholar]
- Iwata T, Hevner RF (2009) Fibroblast growth factor signaling in development of the cerebral cortex. Dev Growth Differ 51: 299–323 [DOI] [PubMed] [Google Scholar]
- Johnson MB, Walsh CA (2017) Cerebral cortical neuron diversity and development at single‐cell resolution. Curr Opin Neurobiol 42: 9–16 [DOI] [PMC free article] [PubMed] [Google Scholar]
- Kageyama R, Ohtsuka T, Shimojo H, Imayoshi I (2009) Dynamic regulation of Notch signaling in neural progenitor cells. Curr Opin Cell Biol 21: 733–740 [DOI] [PubMed] [Google Scholar]
- Knuckles P, Vogt MA, Lugert S, Milo M, Chong MM, Hautbergue GM, Wilson SA, Littman DR, Taylor V (2012) Drosha regulates neurogenesis by controlling neurogenin 2 expression independent of microRNAs. Nat Neurosci 15: 962–969 [DOI] [PubMed] [Google Scholar]
- Lai T, Jabaudon D, Molyneaux BJ, Azim E, Arlotta P, Menezes JR, Macklis JD (2008) SOX5 controls the sequential generation of distinct corticofugal neuron subtypes. Neuron 57: 232–247 [DOI] [PubMed] [Google Scholar]
- La Manno G, Siletti K, Furlan A, Gyllborg D, Vinsland E, Mossi Albiach A, Mattsson Langseth C, Khven I, Lederer AR, Dratva LM et al (2021) Molecular architecture of the developing mouse brain. Nature 596: 92–96 [DOI] [PubMed] [Google Scholar]
- Liddelow S, Barres B (2015) SnapShot: Astrocytes in Health and Disease. Cell 162: 1170–1170.e1 [DOI] [PubMed] [Google Scholar]
- Lipkowitz S, Gobel V, Varterasian ML, Nakahara K, Tchorz K, Kirsch IR (1992) A comparative structural characterization of the human NSCL‐1 and NSCL‐2 genes. Two basic helix‐loop‐helix genes expressed in the developing nervous system. J Biol Chem 267: 21065–21071 [PubMed] [Google Scholar]
- Liu SJ, Nowakowski TJ, Pollen AA, Lui JH, Horlbeck MA, Attenello FJ, He D, Weissman JS, Kriegstein AR, Diaz AA et al (2016) Single‐cell analysis of long non‐coding RNAs in the developing human neocortex. Genome Biol 17: 67 [DOI] [PMC free article] [PubMed] [Google Scholar]
- Lodato S, Arlotta P (2015) Generating neuronal diversity in the mammalian cerebral cortex. Annu Rev Cell Dev Biol 31: 699–720 [DOI] [PMC free article] [PubMed] [Google Scholar]
- Louvi A, Artavanis‐Tsakonas S (2006) Notch signalling in vertebrate neural development. Nat Rev Neurosci 7: 93–102 [DOI] [PubMed] [Google Scholar]
- Lugert S, Basak O, Knuckles P, Haussler U, Fabel K, Gotz M, Haas CA, Kempermann G, Taylor V, Giachino C (2010) Quiescent and active hippocampal neural stem cells with distinct morphologies respond selectively to physiological and pathological stimuli and aging. Cell Stem Cell 6: 445–456 [DOI] [PubMed] [Google Scholar]
- Lugert S, Vogt M, Tchorz JS, Muller M, Giachino C, Taylor V (2012) Homeostatic neurogenesis in the adult hippocampus does not involve amplification of Ascl1(high) intermediate progenitors. Nat Commun 3: 670 [DOI] [PubMed] [Google Scholar]
- Lui JH, Hansen DV, Kriegstein AR (2011) Development and evolution of the human neocortex. Cell 146: 18–36 [DOI] [PMC free article] [PubMed] [Google Scholar]
- Mason HA, Rakowiecki SM, Gridley T, Fishell G (2006) Loss of notch activity in the developing central nervous system leads to increased cell death. Dev Neurosci 28: 49–57 [DOI] [PubMed] [Google Scholar]
- Mi H, Huang X, Muruganujan A, Tang H, Mills C, Kang D, Thomas PD (2017) PANTHER version 11: expanded annotation data from Gene Ontology and Reactome pathways, and data analysis tool enhancements. Nucleic Acids Res 45: D183–D189 [DOI] [PMC free article] [PubMed] [Google Scholar]
- Mohebiany AN, Harroch S, Bouyain S (2014) New insights into the roles of the contactin cell adhesion molecules in neural development. Adv Neurobiol 8: 165–194 [DOI] [PubMed] [Google Scholar]
- Molofsky AV, Krencik R, Ullian EM, Tsai HH, Deneen B, Richardson WD, Barres BA, Rowitch DH (2012) Astrocytes and disease: a neurodevelopmental perspective. Genes Dev 26: 891–907 [DOI] [PMC free article] [PubMed] [Google Scholar]
- Molyneaux BJ, Arlotta P, Menezes JR, Macklis JD (2007) Neuronal subtype specification in the cerebral cortex. Nat Rev Neurosci 8: 427–437 [DOI] [PubMed] [Google Scholar]
- Mukhtar T, Taylor V (2018) Untangling Cortical Complexity During Development. J Exp Neurosci 12: 1179069518759332 [DOI] [PMC free article] [PubMed] [Google Scholar]
- Mukhtar T, Breda J, Grison A, Karimaddini Z, Grobecker P, Iber D, Beisel C, van Nimwegen E, Taylor V (2020) Tead transcription factors differentially regulate cortical development. Sci Rep 10: 4625 [DOI] [PMC free article] [PubMed] [Google Scholar]
- Mullner D (2013) fastcluster: fast hierarchical, agglomerative clustering routines for R and Python. J Stat Softw 53: 1–18 [Google Scholar]
- Nowakowski TJ, Bhaduri A, Pollen AA, Alvarado B, Mostajo‐Radji MA, Di Lullo E, Haeussler M, Sandoval‐Espinosa C, Liu SJ, Velmeshev D et al (2017) Spatiotemporal gene expression trajectories reveal developmental hierarchies of the human cortex. Science 358: 1318–1323 [DOI] [PMC free article] [PubMed] [Google Scholar]
- Ohtsuka T, Shimojo H, Matsunaga M, Watanabe N, Kometani K, Minato N, Kageyama R (2011) Gene expression profiling of neural stem cells and identification of regulators of neural differentiation during cortical development. Stem Cells 29: 1817–1828 [DOI] [PubMed] [Google Scholar]
- Ono K, Takebayashi H, Ikeda K, Furusho M, Nishizawa T, Watanabe K, Ikenaka K (2008) Regional‐ and temporal‐dependent changes in the differentiation of Olig2 progenitors in the forebrain, and the impact on astrocyte development in the dorsal pallium. Dev Biol 320: 456–468 [DOI] [PubMed] [Google Scholar]
- Paridaen JT, Huttner WB (2014) Neurogenesis during development of the vertebrate central nervous system. EMBO Rep 15: 351–364 [DOI] [PMC free article] [PubMed] [Google Scholar]
- Paul V, Tonchev AB, Henningfeld KA, Pavlakis E, Rust B, Pieler T, Stoykova A (2014) Scratch2 modulates neurogenesis and cell migration through antagonism of bHLH proteins in the developing neocortex. Cereb Cortex 24: 754–772 [DOI] [PubMed] [Google Scholar]
- Pollen AA, Nowakowski TJ, Chen J, Retallack H, Sandoval‐Espinosa C, Nicholas CR, Shuga J, Liu SJ, Oldham MC, Diaz A et al (2015) Molecular identity of human outer radial glia during cortical development. Cell 163: 55–67 [DOI] [PMC free article] [PubMed] [Google Scholar]
- Pourquie O (2003) The segmentation clock: converting embryonic time into spatial pattern. Science 301: 328–330 [DOI] [PubMed] [Google Scholar]
- Rash BG, Lim HD, Breunig JJ, Vaccarino FM (2011) FGF signaling expands embryonic cortical surface area by regulating Notch‐dependent neurogenesis. J Neurosci 31: 15604–15617 [DOI] [PMC free article] [PubMed] [Google Scholar]
- Rickman DS, Tyagi R, Zhu XX, Bobek MP, Song S, Blaivas M, Misek DE, Israel MA, Kurnit DM, Ross DA et al (2001) The gene for the axonal cell adhesion molecule TAX‐1 is amplified and aberrantly expressed in malignant gliomas. Cancer Res 61: 2162–2168 [PubMed] [Google Scholar]
- Rodriguez‐Martinez G, Velasco I (2012) Activin and TGF‐beta effects on brain development and neural stem cells. CNS Neurol Disord Drug Targets 11: 844–855 [DOI] [PubMed] [Google Scholar]
- Rosenberg AB, Roco CM, Muscat RA, Kuchina A, Sample P, Yao Z, Graybuck LT, Peeler DJ, Mukherjee S, Chen W et al (2018) Single‐cell profiling of the developing mouse brain and spinal cord with split‐pool barcoding. Science 360: 176–182 [DOI] [PMC free article] [PubMed] [Google Scholar]
- Ross SE, Greenberg ME, Stiles CD (2003) Basic helix‐loop‐helix factors in cortical development. Neuron 39: 13–25 [DOI] [PubMed] [Google Scholar]
- Sahara S, O'Leary DD (2009) Fgf10 regulates transition period of cortical stem cell differentiation to radial glia controlling generation of neurons and basal progenitors. Neuron 63: 48–62 [DOI] [PMC free article] [PubMed] [Google Scholar]
- Sarnat HB (2013) Clinical neuropathology practice guide 5‐2013: markers of neuronal maturation. Clin Neuropathol 32: 340–369 [DOI] [PMC free article] [PubMed] [Google Scholar]
- Sessa A, Ciabatti E, Drechsel D, Massimino L, Colasante G, Giannelli S, Satoh T, Akira S, Guillemot F, Broccoli V (2017) The Tbr2 molecular network controls cortical neuronal differentiation through complementary genetic and epigenetic pathways. Cereb Cortex 27: 3378–3396 [DOI] [PubMed] [Google Scholar]
- Shimojo H, Ohtsuka T, Kageyama R (2008) Oscillations in notch signaling regulate maintenance of neural progenitors. Neuron 58: 52–64 [DOI] [PubMed] [Google Scholar]
- Shimojo H, Ohtsuka T, Kageyama R (2011) Dynamic expression of notch signaling genes in neural stem/progenitor cells. Front Neurosci 5: 78 [DOI] [PMC free article] [PubMed] [Google Scholar]
- Skuta C, Bartunek P, Svozil D (2014) InCHlib – interactive cluster heatmap for web applications. J Chem 6: 44 [DOI] [PMC free article] [PubMed] [Google Scholar]
- Sommer L, Ma Q, Anderson DJ (1996) neurogenins, a novel family of atonal‐related bHLH transcription factors, are putative mammalian neuronal determination genes that reveal progenitor cell heterogeneity in the developing CNS and PNS. Mol Cell Neurosci 8: 221–241 [DOI] [PubMed] [Google Scholar]
- Stancik EK, Navarro‐Quiroga I, Sellke R, Haydar TF (2010) Heterogeneity in ventricular zone neural precursors contributes to neuronal fate diversity in the postnatal neocortex. J Neurosci 30: 7028–7036 [DOI] [PMC free article] [PubMed] [Google Scholar]
- Stogmann E, Reinthaler E, Eltawil S, El Etribi MA, Hemeda M, El Nahhas N, Gaber AM, Fouad A, Edris S, Benet‐Pages A et al (2013) Autosomal recessive cortical myoclonic tremor and epilepsy: association with a mutation in the potassium channel associated gene CNTN2. Brain 136: 1155–1160 [DOI] [PubMed] [Google Scholar]
- Stringer BW, Bunt J, Day BW, Barry G, Jamieson PR, Ensbey KS, Bruce ZC, Goasdoue K, Vidal H, Charmsaz S et al (2016) Nuclear factor one B (NFIB) encodes a subtype‐specific tumour suppressor in glioblastoma. Oncotarget 7: 29306–29320 [DOI] [PMC free article] [PubMed] [Google Scholar]
- Takebayashi H, Ikenaka K (2015) Oligodendrocyte generation during mouse development. Glia 63: 1350–1356 [DOI] [PubMed] [Google Scholar]
- Telley L, Govindan S, Prados J, Stevant I, Nef S, Dermitzakis E, Dayer A, Jabaudon D (2016) Sequential transcriptional waves direct the differentiation of newborn neurons in the mouse neocortex. Science 351: 1443–1446 [DOI] [PubMed] [Google Scholar]
- Telley L, Agirman G, Prados J, Amberg N, Fievre S, Oberst P, Bartolini G, Vitali I, Cadilhac C, Hippenmeyer S et al (2019) Temporal patterning of apical progenitors and their daughter neurons in the developing neocortex. Science 364: eaav2522 [DOI] [PubMed] [Google Scholar]
- Tutukova S, Tarabykin V, Hernandez‐Miranda LR (2021) The role of neurod genes in brain development, function, and disease. Front Mol Neurosci 14: 662774 [DOI] [PMC free article] [PubMed] [Google Scholar]
- Wang H, Ge G, Uchida Y, Luu B, Ahn S (2011) Gli3 is required for maintenance and fate specification of cortical progenitors. J Neurosci 31: 6440–6448 [DOI] [PMC free article] [PubMed] [Google Scholar]
- Woodworth MB, Greig LC, Kriegstein AR, Macklis JD (2012) SnapShot: cortical development. Cell 151: 918–918.e1 [DOI] [PMC free article] [PubMed] [Google Scholar]
- Yoon KJ, Ringeling FR, Vissers C, Jacob F, Pokrass M, Jimenez‐Cyrus D, Su Y, Kim NS, Zhu Y, Zheng L et al (2017) Temporal control of mammalian cortical neurogenesis by m(6)A methylation. Cell 171: 877–889.e17 [DOI] [PMC free article] [PubMed] [Google Scholar]
- Zeisel A, Hochgerner H, Lonnerberg P, Johnsson A, Memic F, van der Zwan J, Haring M, Braun E, Borm LE, La Manno G et al (2018) Molecular architecture of the mouse nervous system. Cell 174: 999–1014.e22 [DOI] [PMC free article] [PubMed] [Google Scholar]
- Zhang Y, Barres BA (2010) Astrocyte heterogeneity: an underappreciated topic in neurobiology. Curr Opin Neurobiol 20: 588–594 [DOI] [PubMed] [Google Scholar]
- Zhang C, Tu HL, Jia G, Mukhtar T, Taylor V, Rzhetsky A, Tay S (2019) Ultra‐multiplexed analysis of single‐cell dynamics reveals logic rules in differentiation. Sci Adv 5: eaav7959 [DOI] [PMC free article] [PubMed] [Google Scholar]
- Zhou B, Osinski JM, Mateo JL, Martynoga B, Sim FJ, Campbell CE, Guillemot F, Piper M, Gronostajski RM (2015) Loss of NFIX Transcription Factor Biases Postnatal Neural Stem/Progenitor Cells Toward Oligodendrogenesis. Stem Cells Dev 24: 2114–2126 [DOI] [PubMed] [Google Scholar]