Abstract
Background and Objectives
Topographical distribution of white matter hyperintensities (WMH) are hypothesized to vary by cerebrovascular risk factors. We used an unbiased pattern discovery approach to identify distinct WMH spatial patterns and investigate their association with different WMH etiologies.
Methods
We performed a cross-sectional study on participants of the Alzheimer's Disease Neuroimaging Initiative (ADNI) to identify spatially distinct WMH distribution patterns using voxel-based spectral clustering analysis of aligned WMH probability maps. We included all participants from the ADNI Grand Opportunity/ADNI 2 study with available baseline 2D-FLAIR MRI scans, without history of stroke or presence of infarction on imaging. We evaluated the associations of these WMH spatial patterns with vascular risk factors, amyloid-β PET, and imaging biomarkers of cerebral amyloid angiopathy (CAA), characterizing different forms of cerebral small vessel disease (CSVD) using multivariable regression. We also used linear regression models to investigate whether WMH spatial distribution influenced cognitive impairment.
Results
We analyzed MRI scans of 1,046 ADNI participants with mixed vascular and amyloid-related risk factors (mean age 72.9, 47.7% female, 31.4% hypertensive, 48.3% with abnormal amyloid PET). We observed unbiased partitioning of WMH into 5 unique spatial patterns: deep frontal, periventricular, juxtacortical, parietal, and posterior. Juxtacortical WMH were independently associated with probable CAA, deep frontal WMH were associated with risk factors for arteriolosclerosis (hypertension and diabetes), and parietal WMH were associated with brain amyloid accumulation, consistent with an Alzheimer disease (AD) phenotype. Juxtacortical, deep frontal, and parietal WMH spatial patterns were associated with cognitive impairment. Periventricular and posterior WMH spatial patterns were unrelated to any disease phenotype or cognitive decline.
Discussion
Data-driven WMH spatial patterns reflect discrete underlying etiologies including arteriolosclerosis, CAA, AD, and normal aging. Global measures of WMH volume may miss important spatial distinctions. WMH spatial signatures may serve as etiology-specific imaging markers, helping to resolve WMH heterogeneity, identify the dominant underlying pathologic process, and improve prediction of clinical-relevant trajectories that influence cognitive decline.
Cerebral white matter lesions or hyperintensities (WMH) are a highly prevalent radiographic phenotype increasingly recognized as a marker of poor brain health,1 characterized by hyperintense signals on T2-weighted MRI.2 WMH are a cardinal manifestation of cerebral small vessel disease (CSVD)2 and a major component of vascular contributions to cognitive impairment and dementia (VCID)3 and Alzheimer disease (AD).4,5 WMH reflect a diverse array of underlying etiologies1,6 that belie their homogenous macroscale appearance.4 This heterogeneity poses a significant challenge toward disentangling the underlying WMH pathogenesis. Consequently, efforts toward identifying WMH features or patterns that are able to discriminate different disease etiologies such as AD, vascular-related CSVD (arteriolosclerosis), and amyloid-related CSVD (cerebral amyloid angiopathy [CAA]) are needed.3,7 However, previous studies using whole-brain, voxel-based comparisons have failed to identify distinct patterns8,9 because they require the erroneous assumption of voxel-wise independence and lack statistical power because of high dimensionality and multiple comparison problems.
Increasing evidence support the hypothesis that WMH location may provide etiologic information. Neuropathologic studies have suggested that different pathologic processes underlie WMH in different brain regions.1,6 However, WMH is commonly assessed by quantifying cumulative burden expressed as total WMH volume (WMHv), which eliminates latent spatial specificity and lacks discriminative potential for different etiologies. Beyond global WMHv, studies exploring WMH by spatial location have traditionally used arbitrarily defined categories of periventricular and subcortical/deep WMH10,11 or by dividing white matter into different anatomical brain regions (cortical lobes)12 or vascular territories.13 While these studies considered the concept of WMH spatial heterogeneity, their use of predefined regions of interest or empirically defined visual WMH patterns introduce bias and confound the identification of robust disease-dependent WMH distribution patterns.
WMH are associated with cognitive decline, but WMH burden correlates inconsistently with cognitive impairment. This clinicoradiographic discrepancy is believed to be partly influenced by location-specific effects of WMH on different cognitive domains,14,15 which may reflect different underlying disease processes and further complicated by the frequent coexistence of both AD and CSVD pathologies in the older participants.16
In this study, we conducted a multivariate analysis of WMH spatial distribution using voxel-based spectral clustering of WMH probability maps to identify distinct WMH patterns. This approach addresses prior methodological constraints by preserving localized voxel variations without losing voxel-wise interactions and has been used successfully in identifying face17 and regional brain shape variations.18 We hypothesized that data-driven WMH spatial patterns capture disease-dependent WMH patterns in a robust and spatially precise manner that can discriminate different WMH etiologies. The establishment of distinct WMH spatial patterns that maps robustly to different WMH etiology will improve diagnostic specificity and characterization of WMH.
Methods
Study Design
Data used in this study were obtained from participants in the Alzheimer's Disease Neuroimaging Initiative (ADNI) study (eMethods, links.lww.com/WNL/C332). ADNI data were downloaded19 in September 2019. In brief, all ADNI participants were aged between 55 and 90 years, had completed at least 6 years of education, were English or Spanish speakers, and had no significant neurologic disease other than AD. We included all participants with available baseline 3.0 T 2D-FLAIR MRI scans, without history of stroke or presence of infarction on imaging (n = 1,046) for the present analyses. We applied (a) deep learning to construct WMH probability maps representing voxel-wise WMH distribution, (b) spectral clustering of WMH probability maps to compute data-driven WMH spatial patterns, and (c) multivariable regression to examine location-specific relationships with risk factors for arteriolosclerosis, CAA, AD, and cognitive impairment. We extracted the following variables for our analysis: serial systolic blood pressure, antihypertensive medication use, diabetes mellitus, hyperlipidemia, smoking, alcohol use, atrial fibrillation, cardiovascular disease, APOE genotype, Clinical Dementia Rating (CDR) scores, cortical standardized uptake value ratio (SUVR) from amyloid PET, and CAA diagnosis from T2*-weighted MRI.
Standard Protocol Approvals, Registrations, and Patient Consents
The ADNI study was approved by the individual Institutional Review Boards of all participating institutions, with written informed consent obtained from all study participants, and all data were deidentified.
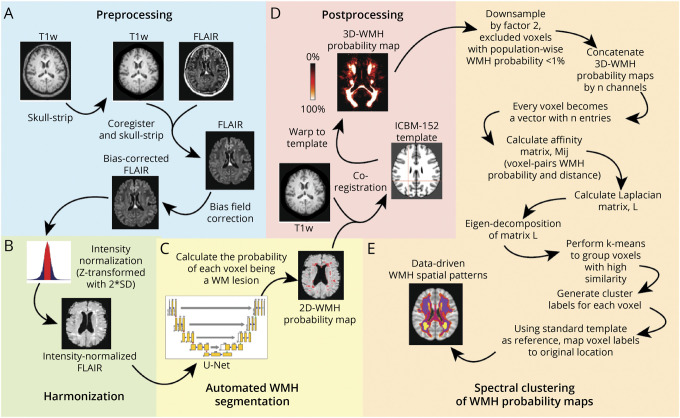
Image Preprocessing and Constructing WMH Probability Maps
A standardized MRI protocol for image acquisition was implemented across ADNI sites and validated across platforms.20 We performed image analysis using baseline 2D-FLAIR and T1-weighted brain MRIs, with imaging parameters as described (eTable 1, links.lww.com/WNL/C332). We implemented our analytical framework (Figure 1, A–D) to extract individual-level probabilistic information of voxel-wise WMH distribution in the form of a WMH probability map; detailed description is provided in eMethods, links.lww.com/WNL/C332. In brief, we constructed an 18-layer convolutional neural network with U-Net21 architecture (eFigure 1, links.lww.com/WNL/C332) in Python using Pytorch to automatically segment WMH and generate participant-specific 2D-WMH probability maps from 2D-FLAIR scans, which were coregistered to their corresponding T1-weighted MRIs, then aligned to a common template space. We validated our deep learning network performance against a reference standard of manual WMH segmentations and the UCD four-tissue segmentation method22 used by ADNI on 70 randomly selected ADNI images, divided into training (n = 50) and test data sets (n = 20). The test data set for final model performance evaluation consisted of hold-out images not used in network training or tuning. Two trained reviewers performed manual delineation of supratentorial WMH in accordance with the STRIVE criteria,3 with high inter-rater agreement for the manually derived WMH segmentation in spatial (dice similarity coefficient, DSC = 0.72; 95% CI = 0.67–0.81) and volumetric correspondence (intraclass correlation coefficient = 0.92). Deep learning (U-Net) was superior to the UCD four-tissue segmentation method across all evaluation metrics, including improved spatial accuracy (DSC), sensitivity, and specificity in detecting WMH (area under precision recall curve, AUC-PR) (eTable 2, links.lww.com/WNL/C332). Small lesion size and burden reduce WMH segmentation accuracy,23 creating detection bias for larger, confluent WMH. Our U-Net algorithm maintained high segmentation accuracy across a range of WMH burden (eFigure 2, eTable 3, links.lww.com/WNL/C332). Visual comparisons of the different segmentation methods are shown in eFigure 3, links.lww.com/WNL/C332.
Figure 1. Methodologic Sequence for Identifying Data-Driven WMH Spatial Patterns.
(A) Image analysis pipeline includes standard preprocessing of both FLAIR and corresponding T1-weighted MRI data, (B) image-level harmonization to account for batch effects, (C) automated WMH segmentation using a custom deep learning network (U-Net), (D) alignment to standard brain template to ensure cohort-level spatial correspondence of the WMH probability maps, and (E) voxel-based spectral clustering of aligned WMH probability maps.
Data-Driven WMH Phenotyping, Identifying Distinct WMH Spatial Localizations
Aligned WMH probability maps (voxel size 1 × 1 × 1) were uniformly down-sampled by a factor of 2, and voxels with population-wise WMH probability <1% were excluded to improve computational efficiency, generating a WMH probability feature vector length of 30,353 per participant. We applied spectral clustering to the entire analysis cohort (n = 1,046) to identify distinct spatial clusters of WMH using a custom script24 in MATLAB (2019a, Natick, Massachusetts: The MathWorks Inc.) (Figure 1E). Aligned WMH probability maps were jointly analyzed by concatenation into n channels, each voxel as a vector with n values of WMH probability. Similarity measures between ij voxel pairs were calculated as a Gaussian kernel function (σ = 16) of the Euclidean distance between their WMH probability feature vectors forming an ijn affinity matrix; M. Laplacian transformation was applied to matrix M before Eigen decomposition of the squared matrix followed by k-means clustering to group highly correlated voxels, then mapped back to common template space to visualize spatial clusters of WMH. This results in partitioning of the white matter into a map of k data-driven WMH spatial patterns. To estimate the optimal number of nonoverlapping clusters (k), we applied the eigengap method to identify k corresponding to the maximal difference between consecutive eigenvalues of the Laplacian. Finally, this map was warped into individual participant space to calculate WMH burden (volume of voxels with WMH probability threshold of ≥0.5) for each k data-driven WMH spatial pattern.
MRI-Based CAA Assessment
Two trained reviewers assessed blood-sensitive T2*-weighted MRIs for strictly lobar cerebral microbleeds (SL-CMB) and cortical superficial siderosis (cSS) to ascertain CAA diagnosis by the Modified Boston criteria.25 We carefully excluded microbleed mimics, including vessels, flow voids, and calcification. We reassessed 50 randomly selected scans for intra-rater reliability (K = 0.91; 95% CI = 0.88–0.94) and inter-rater reliability (K = 0.85; 95% CI = 0.82–0.90).
Amyloid-Related Biomarkers
Brain amyloid had been quantified by 18F-florbetapir (FBP) AV-45 PET summary data obtained from the ADNI database. Detailed acquisition and standardized processing methods were previously described.26 In brief, FBP PET analyses used FreeSurfer v4.5.0 segmentation of a contemporary coregistered MRI to define cortical regions of interest that commonly harbor Aβ.26 We defined global Aβ burden based on a composite SUVR of weighted FBP mean uptake across 4 cortical regions (frontal, lateral temporal, lateral parietal, and cingulate) normalized to the whole cerebellum uptake, calculated from FBP PET performed within 1 year of study participants' baseline FLAIR MRI.
APOE genotyping was performed using DNA extracted from leukocytes collected from ADNI participants,27 and finalized, quality-controlled data were obtained from the ADNI database. APOE genotype (available for n = 967) was analyzed as a categorical variable indicated by the number of ε2 and ε4 alleles (0, 1, or 2).
Assessment of Cognitive Impairment
We used CDR scores assessed within 6 months of baseline FLAIR MRI as a measure of cognitive impairment. The CDR is a well-validated instrument for staging dementia severity into a 5-point scale: 0, no cognitive impairment; 0.5, very mild dementia; 1, mild dementia; 2, moderate dementia; 3, severe dementia. Owing to extremely low numbers of study participants with CDR ≥2 (n = 2), we analyzed CDR as a categorical variable indicated by CDR 0, 0.5, and ≥1.
Nonamyloid/Vascular Risk Factors
We obtained vascular risk factors most relevant to cerebrovascular disease for our study participants including type 2 diabetes mellitus, atrial fibrillation, history of cardiovascular disease (coronary heart disease, cardiac failure, or intermittent claudication), smoking status, alcohol use, and hyperlipidemia by screening the general health evaluation data in ADNI. We calculated the average systolic blood pressure (SBP) from brachial artery SBP measurements collected during each study visit and screened for antihypertensive medication use to construct a composite hypertension score (HTN-S; range 0–10) derived from the Framingham Risk Score28 to quantify participant-specific hypertension risk (eTable 4, links.lww.com/WNL/C332). 92.8% of study participants had ≥2 study visits (median [interquartile range, IQR] = 5 (4–6)).
Statistical Analysis
All statistical analyses were performed with R v4.0.3. For each k WMH spatial pattern, we normalized their territorial WMHv by the total WMHv to describe a relative WMH burden (WMHvrel) per pattern. We transformed WMHvrel for each WMH spatial pattern using rank-based inverse normal transformation to normalize their distributions. We examined associations of the WMH spatial patterns with different CSVD pathologies using a multivariable linear regression model for each WMH spatial pattern as outcome (WMHvrel for each pattern) and arteriolosclerosis-related (HTN-S and diabetes mellitus) and amyloid-related (CAA, amyloid SUVR, and APOE ε4 genotype) CSVD risk factors as predictors (resulting in 5 models). We investigated for interaction effects of CSVD risk factors on the WMH spatial patterns with linear regression models including HTN-S*diabetes mellitus, HTN-S*CAA, and HTN-S*amyloid SUVR interaction terms. Similarly, we assessed for pattern-specific WMH effects on cognitive impairment with CDR at time of imaging. All regression models were adjusted for age, sex, race, and other vascular risk factors including hyperlipidemia, smoking status, alcohol use, atrial fibrillation, and cardiovascular disease. Regression models for cognitive status were separately adjusted for years of education. Significance threshold was set at Bonferroni-corrected p < 0.01.
Data Availability
All relevant source data are available from ADNI.19 Relevant image IDs are provided in the Supplement (eTable 5, links.lww.com/WNL/C332). The derived data supporting the study findings are available on request for the express purpose of reproducing the results.
Results
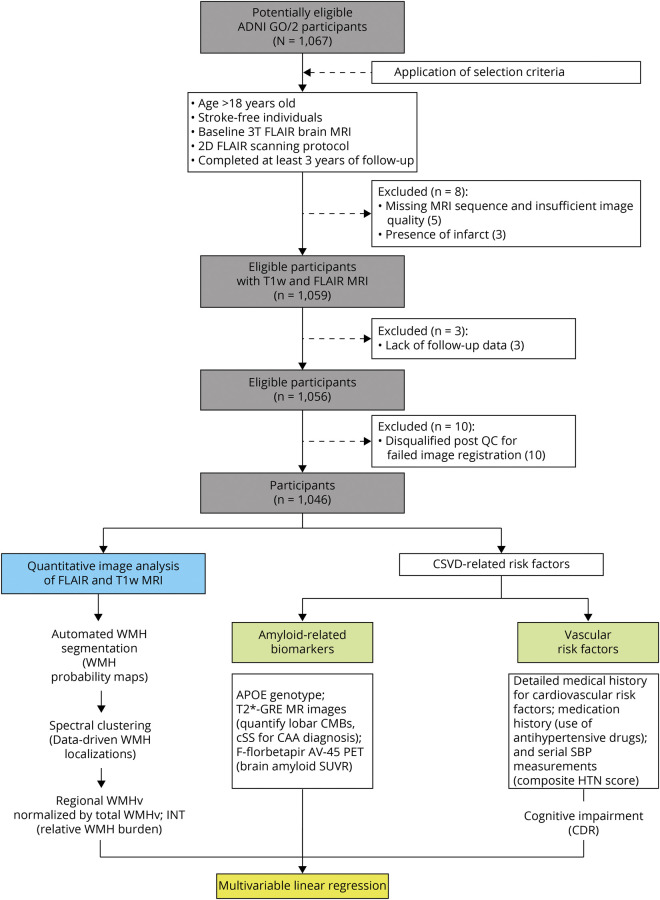
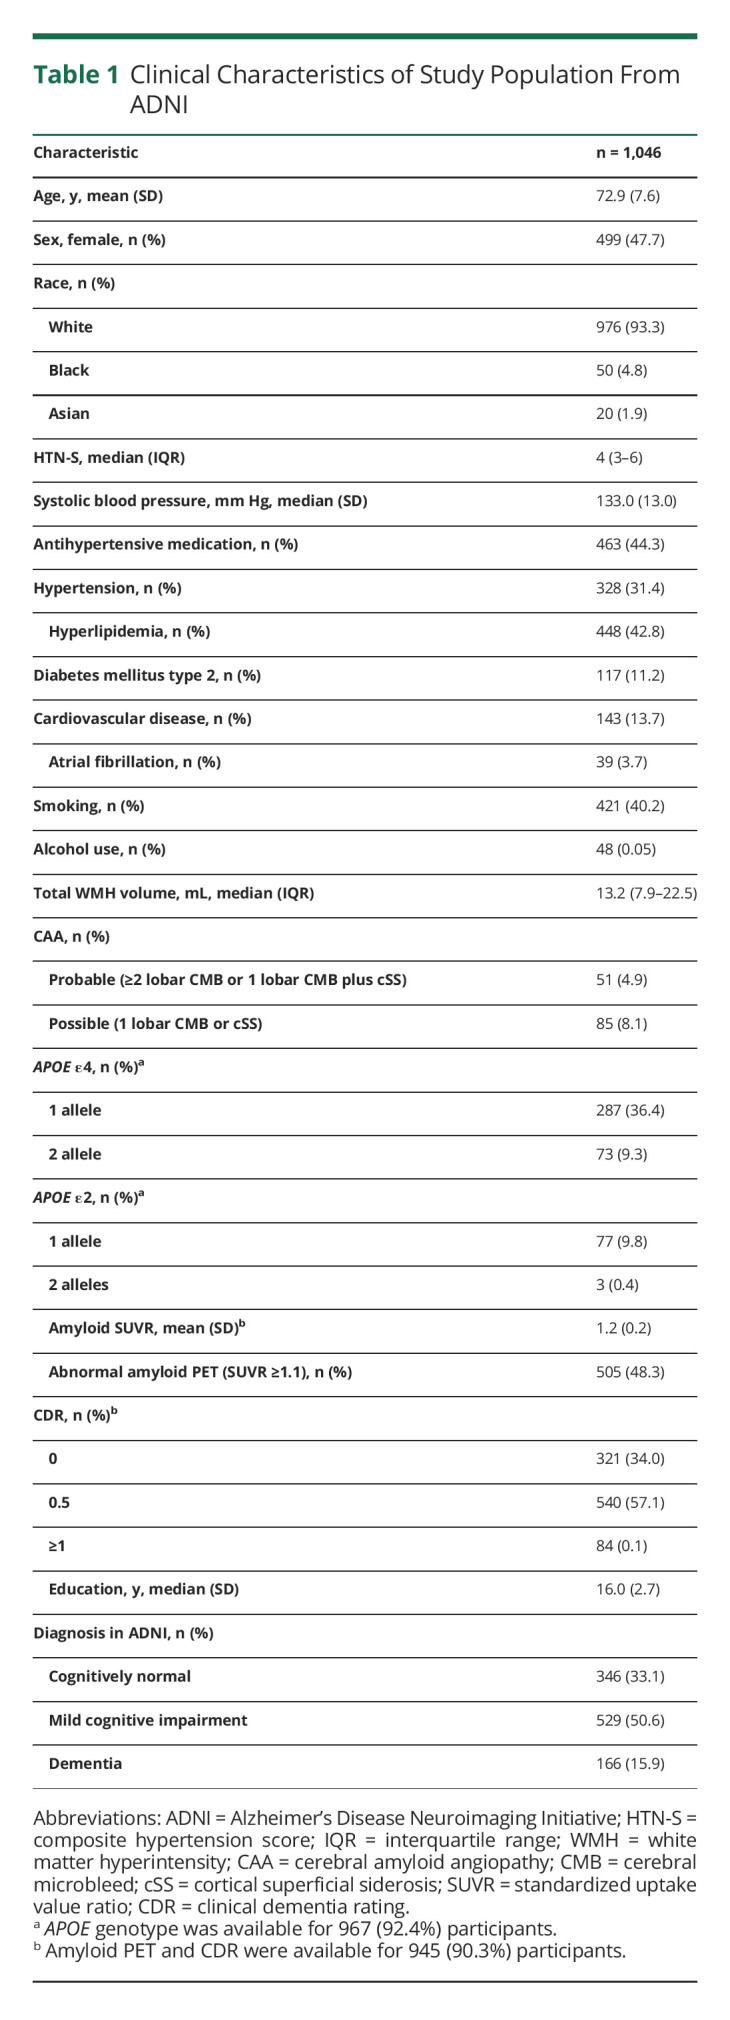
There were 1,067 participants with available 2D-FLAIR sequence, but 21 were excluded because of missing clinical data, presence of infarct on imaging, or failing subsequent image quality screening (Figure 2). Our final cohort comprised 1,046 participants (mean age 72.9 years (SD 7.6); 47.7% female; 93.3% White) from ADNI with mixed CSVD (31.4% with hypertension; 13.0% with CAA) and AD pathology (48.3% with abnormal amyloid PET). Characteristics of the study cohort are shown in Table 1.
Figure 2. Flowchart of Study Participants and Analysis Framework.
Abbreviations: ADNI = Alzheimer's Disease Neuroimaging Initiative public database; CSVD = cerebral small vessel disease; WMH = white matter hyperintensities; GRE = T2*-gradient echo sequence; CMB, cerebral microbleeds; cSS = cortical superficial siderosis; SBP = systolic blood pressure; HTN = hypertension; SUVR = standardized uptake value ratio; WMHv = WMH volume; INT = inverse normal transformation; CDR = clinical dementia rating scale.
Table 1.
Clinical Characteristics of Study Population From ADNI
Identification of Data-Driven WMH Spatial Patterns
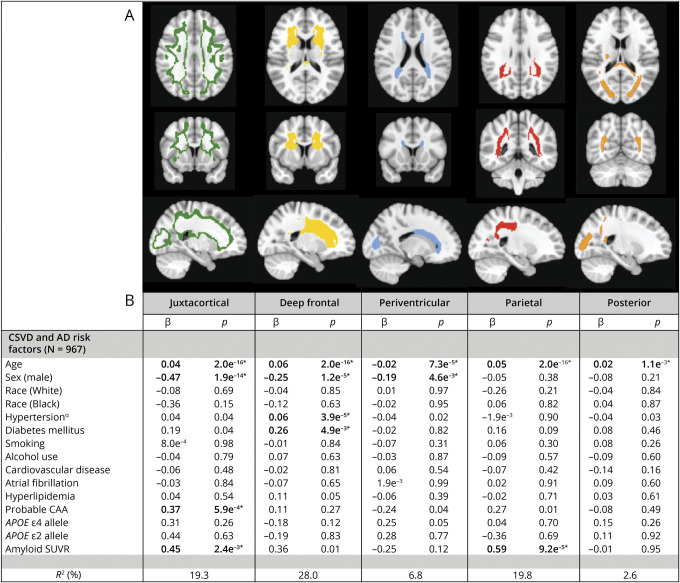
We identified 5 WMH clusters representing 5 distinct, nonoverlapping WMH spatial patterns (Figure 3) in our study cohort. The optimal number of clusters, k = 5, was determined using the eigengap method, representing the maximum difference between consecutive eigenvalues (eFigure 4, links.lww.com/WNL/C332). We validated the robustness of the WMH spatial patterns through repeated clustering experiments with bootstrap resampling and quantified the extent of spatial overlap (0<DSC<1; 0, no overlap; 1, perfect overlap) for the resulting WMH clusters between pairs of repeat clustering attempts. The WMH spatial patterns were highly reproducible, with high median overlap (DSC1=0.90, DSC2=0.96, DSC3=0.89, DSC4=0.88, DSC5=0.92) (eTable 6, links.lww.com/WNL/C332). Furthermore, voxel-based spectral clustering partitioned WMH into recognizable spatial distributions: the first involved the juxtacortical region in the intersection between cortical gray and white matter (WMH-J, green in Figure 3A), the second location was in the deep frontal WM region (WMH-D, yellow in Figure 3A), the third specified a narrow area surrounding the ventricles mostly involved the frontal and occipital horns of the lateral ventricles (WMH-PV, blue in Figure 3A), the fourth location involved deep white matter in the dorsal parietal region (WMH-Pa, red in Figure 3A), and the fifth mainly involved subcortical white matter in the occipital lobe including the splenium (WMH-Post, orange in Figure 3A).
Figure 3. Data-Driven WMH Spatial Patterns Define Distinct Disease Etiologies.
(A) Topographical distribution of the data-driven WMH spatial patterns identified using spectral clustering of study cohort WMH probability maps. (B) Associations between data-driven WMH spatial patterns and vascular and amyloid-related risk factors. Multivariable linear regression models were used with relative WMH burden for each data-driven WMH spatial pattern as outcomes, composite hypertension score, diabetes mellitus, amyloid SUVR, and CAA diagnosis as predictors, adjusted for age, race, sex, smoking status, current alcohol use, cardiovascular disease, atrial fibrillation, hyperlipidemia, and APOE genotype. *significance (bold) at Bonferroni-corrected level p < 0.01. α composite hypertension score. Abbreviations: CAA = cerebral amyloid angiopathy; SUVR = standardized uptake value ratio; CDR = Clinical Dementia Rating Scale; CSVD = cerebral small vessel disease; WMH = white matter hyperintensities; β = beta-coefficient.
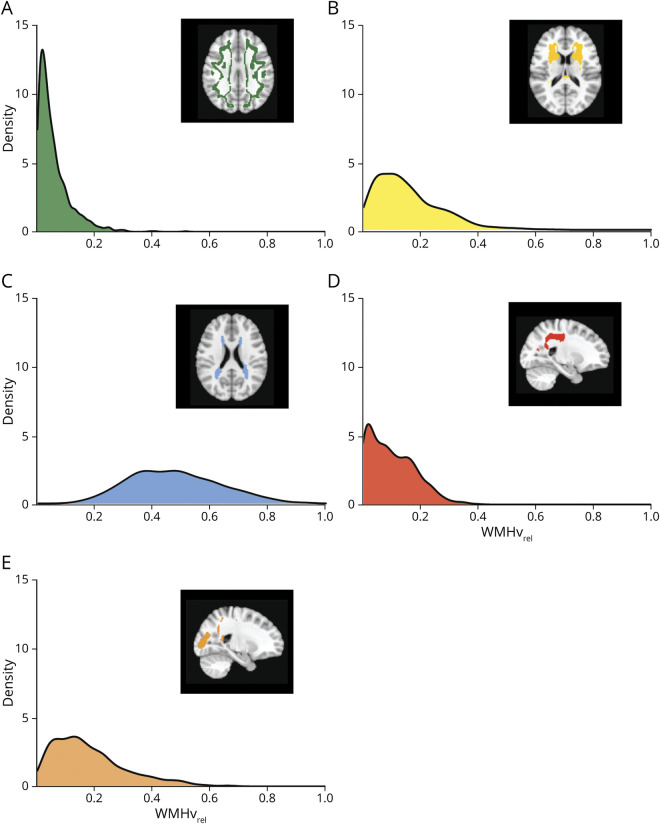
We created a territorial map of the 5 WMH spatial patterns identified, registered each participant's WMH probability map in standard space, and calculated their WMHvrel for each WMH spatial pattern. The median total WMHv was 13.2 cm3 (interquartile range (IQR): 7.9–22.5). The WMHvrel distributions of the 5 WMH spatial patterns are summarized in Figure 4. Periventricular and posterior WMH patterns were ubiquitous across all participants (median WMHvrel (IQR): WMH-PV = 46.6% (35.8%–58.2%), WMH-Post = 15.2% (8.4%–24.3%)), while being less common for juxtacortical, deep frontal, and parietal WMH patterns (median WMHvrel (IQR): WMH-J = 3.7% (1.7%–7.5%), WMH-D = 12.8% (6.8%–21.3%), WMH-Pa = 8.5% (3.1%–15.7%)).
Figure 4. Distribution of the Data-Driven WMH Spatial Patterns.
(A-E) Density plots showing the distribution of relative white matter hyperintensities burden (WMHvrel) for each WMH spatial pattern.
Associations With CSVD Etiologies
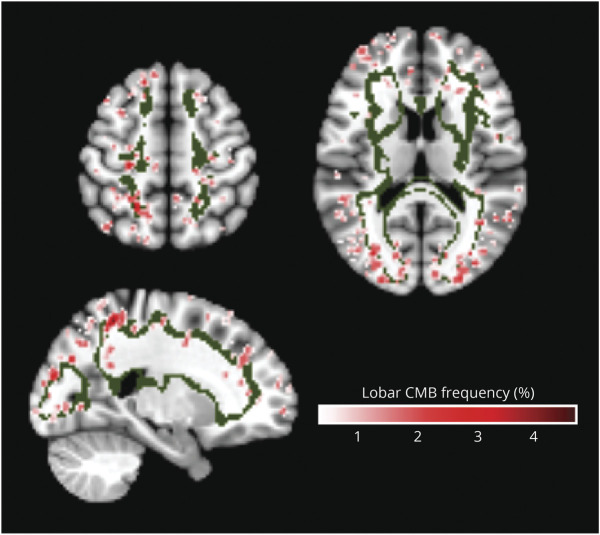
In multivariable linear regression analysis, there were significant associations between age and relative WMH burden for all WMH spatial patterns, with highest coefficients for deep frontal and parietal patterns (WMH-D: β = 0.06, p < 2e−16, WMH-Pa: β = 0.05, p < 2e−16), whereas the proportion of periventricular WMH pattern decreased relative to the other spatial patterns with age (β = −0.02, p < 7.3e−5). By contrast, we found differential associations of the WMH spatial patterns with amyloid SUVR, CAA, and vascular risk factors. Higher relative WMH burden in the juxtacortical pattern was independently associated with probable CAA diagnosis (β = 0.37, p < 5.9e−4) and amyloid SUVR (β = 0.45, p < 2.3e−3). Consistent with this finding, regions of greatest SL-CMBs density overlapped spatially with the juxtacortical WMH pattern (Figure 5). In a similar multivariable linear regression model, amyloid SUVR was the only independent predictor associated with increased relative WMH burden in the parietal pattern (β = 0.59, p < 9.2e−5). Greater relative WMH burden in the deep frontal pattern was independently associated with only HTN-S and diabetes mellitus (β = 0.06, p < 3.9e−5 and β = 0.26, p < 5.0e−3, respectively). WMH burden in both periventricular and posterior patterns were not related to any CSVD risk factors in multivariable regression models. The number of APOE ε2 and ε4 alleles was not associated with relative WMH burden in any of the identified WMH spatial patterns. The results are summarized in Figure 3, and diagnostic regression plots for the separate models are shown in eFigure 5, links.lww.com/WNL/C332. The associations of WMH-J with probable CAA, WMH-D with HTN-S, and WMH-Pa with amyloid SUVR remained significant after adjustments for CDR (n = 930, eTable 7, links.lww.com/WNL/C332). No significant interaction effects were observed between individual CSVD-related risk factors and the WMH spatial patterns (eTable 8, links.lww.com/WNL/C332).
Figure 5. Spatial Correspondence of the Juxtacortical WMH Spatial Pattern and Strictly Lobar Cerebral Microbleeds.
The strictly lobar cerebral microbleeds (SL-CMBs) frequency map has a range of values from 0% to 4.4%. Areas of highest SL-CMBs density were located within the topographical distribution of the juxtacortical WMH pattern (green).
Associations With Cognitive Impairment
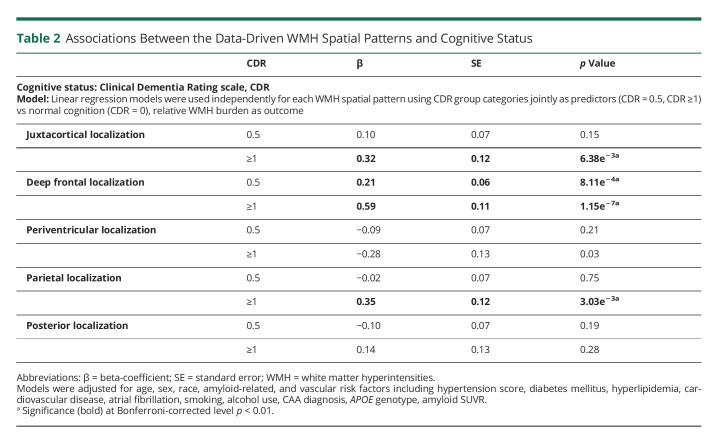
Higher global WMH burden was associated with increased cognitive impairment measured by CDR (median WMHv (IQR) in cm3: CDR 0 = 12.7 (7.8–19.9), CDR 0.5 = 13.0 (7.7–23.2), CDR ≥1 = 20.5 (13.8–28.2); p = 2.3e−6) (eFigure 6, links.lww.com/WNL/C332). However, we found location-specific effects of WMH on cognitive decline in the subset of study cohort (n = 945) with CDR assessments completed near time of MRI (Table 2). Increased relative WMH burden in both juxtacortical and parietal patterns were independently associated with dementia (CDR ≥1: β = 0.32, p < 6.4−3 for WMH-J; β = 0.35, p < 3.0−3 for WMH-Pa). Higher relative WMH burden in the deep frontal pattern was associated with mild cognitive impairment (CDR = 0.5: β = 0.21, p < 8.1−3; CDR ≥1: β = 0.59, p < 1.2−7). We did not find an association between WMH burden in either periventricular or posterior patterns with cognitive impairment. In a sensitivity analysis, the pattern of associations was unchanged with inclusion of education years as a marker of brain resilience (eTable 9, links.lww.com/WNL/C332).
Table 2.
Associations Between the Data-Driven WMH Spatial Patterns and Cognitive Status
Discussion
We applied multivariate voxel-based spectral clustering to FLAIR MRIs of a cohort of well-characterized older, stroke-free participants from ADNI with mixed pathologies of CSVD and AD to identify disease-dependent WMH distribution patterns. Using an unbiased approach, we identified 5 distinct WMH spatial patterns: (i) juxtacortical, (ii) deep frontal, (iii) periventricular, (iv) parietal, and (v) posterior and demonstrated that these data-driven WMH spatial patterns reflected regional susceptibility to different underlying disease etiologies. While we found a shared influence of age on all WMH spatial patterns, specific CSVD risk factors were independently associated with different WMH spatial patterns. Increased juxtacortical WMH pattern was independently associated with a greater likelihood of probable CAA and brain amyloid accumulation, suggesting juxtacortical WMH as a spatially specific marker of cerebrovascular amyloid load or CAA-related leukoaraiosis. Elevated composite hypertension score and diabetes mellitus, risk factors highly associated with arteriolosclerosis, were both related to increased deep frontal WMH pattern. Elevated brain amyloid load had the greatest influence on increased parietal WMH pattern. By contrast, periventricular and posterior WMH patterns were not associated with any risk factors except for age. Furthermore, greater relative WMH burden within the juxtacortical, deep frontal, and parietal patterns were all associated with increased likelihood of cognitive impairment whereas periventricular and posterior WMH patterns did not influence cognitive status.
Our findings that spatially distinct patterns of WMH distribution are associated with different underlying WMH etiologies are consistent with circumstantial evidence from previous studies. Using predefined qualitative WMH patterns, the authors of a study11 noted a divergence in WMH pattern topography between patients with primary intracerebral hemorrhage (ICH) due to hypertension (HTN) vs CAA. Peribasal ganglia WMH were more prevalent among patients with HTN-ICH, whereas multiple subcortical spots pattern of WMH was more common in the CAA-ICH group.11 Recently, several studies separately suggested an association between frontally located WMH with hypertension,29 increased vascular risk,30 and vascular dementia.12 Other studies have noted an association between posteriorly located WMH with both AD-related cognitive dysfunction31 and PET-based amyloid positivity.30 In a longitudinal study investigating the relationship between WMH by lobar regions and incident dementia, only parietal WMH was associated with increased risk of AD.5 This posterior WMH predilection was also seen in familial AD. A study involving asymptomatic autosomal dominant AD mutation carriers demonstrated greater WMH burden in the posterior periventricular regions involving both parietal and occipital lobes compared with noncarrier controls.32 With a single exception,29 these studies all used empiric WMH categories or arbitrarily defined regional boundaries that varied in anatomical definitions between studies.10-15,33 Indeed, the traditional deep and periventricular WMH showed discordant associations with various risk factors and cognitive correlates across studies34 in part because of inconsistent definitions of deep and periventricular subdivisions.1,34 Our study instead used an unbiased method to partition WMH and systematically define WMH pattern distributions, whose boundaries were specified by the spatial localizations of highly correlated clusters of WMH probability voxels across individuals.
A particularly striking finding was that several of these data-driven WMH patterns specified spatial locations which were consistent with known anatomic localizations of distinct disease pathologies, strengthening their robustness and specificity as discriminative biomarkers of different WMH etiology. Previous studies reported an association between CAA and posterior WMH.35 By contrast, the juxtacortical pattern of CAA-related WMH in our study is more consistent with neuropathologic studies that showed similar topography of the leptomeningeal microvasculature. These vessels, most affected by CAA,36 perfuse cortical-subcortical regions in the frontal, parietal, occipital, and lateral temporal lobes.36 Indeed, this juxtacortical location overlapped with areas of high SL-CMBs density (Figure 5), the radiologic hallmark of CAA,36 and observed spatial increase in PET-based amyloid burden in individuals with probable CAA.37 Studies using high-resolution MRI also demonstrated colocalization of enlarged centrum semiovale perivascular spaces,38 another CAA imaging marker, with greater CAA severity by imaging and histopathology also within the juxtacortical region.38,39 The positive association between juxtacortical WMH pattern and cognitive impairment is also consistent with findings from autopsy and prospective cohort studies of CAA patients that suggest high prevalence of cognitive dysfunction in CAA with a cognitive profile of impaired processing speed and executive dysfunction,40 distinct from AD.
Similarly, deep frontal WMH pattern was strongly associated with risk factors for arteriolosclerosis (hypertension and diabetes mellitus) in our study. Several studies which examined regional rather than global WMH load independently observed positive associations between frontally located WMH with traditional vascular risk factors, particularly driven by hypertension, and risk of vascular-related cognitive decline.12,29,30 This location share the largest spatial overlap with our observed arteriolosclerosis-related WMH spatial pattern predominantly involving the frontal subcortical white matter. The distinct vulnerability of frontal subcortical white matter to hypertension12,29 may be a consequence of the regional vascular blood supply, comprising territories of the distal branches of the superficial perforating arteries of the anterior and middle cerebral arteries, which are prone to development of arteriolosclerosis. Moreover, a recent study investigating regional variation in WMH pathology using human postmortem brain tissue observed that arteriolosclerosis was the main driver of frontal WMH development,41 which corresponds with our observation of a distinct arteriolosclerosis-related WMH distribution pattern involving the frontal subcortical white matter.
We also identified a parietal WMH pattern that was strongly associated with increased brain cortical Aβ load and cognitive impairment, biomarkers characteristic of preclinical amyloid pathology and AD.42 Although several studies have suggested an association between global WMH burden and increased Aβ, many others showed no relationship between total WMHv and brain amyloid uptake.43 Conversely, studies which explored regional WMH effects showed convergent observations of WMH located in posterior brain regions being associated with elevated brain Aβ deposition in sporadic AD.31,32 Our observation of an AD-associated WMH pattern involving the parietal white matter corresponds with previous studies demonstrating association of parietal WMH with both AD risk and progression.5,32 Further support for parietal WMH as an AD-related leukoaraiosis pattern is evidenced by histologic findings of degenerative axonal loss secondary to AD pathology in the absence of arteriolosclerosis specifically within parietal white matter lesions in AD.44 It is interesting that our proposed AD-related WMH location involving the parietal subcortical white matter overlap with the stereotypical temporoparietal cortical pattern45 of amyloid pathology in AD and supports the suggestion that white matter tracts originating from neurons affected by Aβ deposition in the overlying cortex may be vulnerable to Wallerian degeneration-associated axonal damage triggered by the cortical AD pathology.44
An interesting finding was the delineation of periventricular WMH pattern as periventricular caps around the frontal and posterior horns of the lateral ventricles with a thin lining along the lateral ventricles,46 which was not associated with any disease risk factors examined or cognitive impairment. The periventricular cap pattern of WMH is a common finding on cranial MRI in the older participants,46 postulated to be distinct from CSVD-related WMH and related to normal aging,47 consistent with our observation of a singular association with age. WMH in this region has characteristic histology of spongiotic, finely textured myelin, and accumulation of interstitial fluid within the adjacent white matter and subependymal widening of the extracellular space around the lateral ventricle horns.47 A quantitative MRI study measuring brain water content identified the periventricular caps as having significantly higher water content compared with normal white matter,46 further supporting our periventricular WMH pattern as a distinct white matter region. Similarly, we also identified a posterior WMH pattern associated with age but not with any disease risk factor or cognitive impairment. Given that this white matter region is immediately adjacent posteriorly to the periventricular caps, we speculate that the corresponding WMH may represent a late-stage progression of periventricular caps expanding into the potential space surrounding the occipital horn of the lateral ventricles. Of note, this hypothesis may be borne out by the opposing relationship of relative WMH burden within these 2 patterns with time (represented as age). Relative WMH burden within the periventricular pattern decreased with age but increased over time in the posterior pattern, suggesting that periventricular WMH occurrence likely preceded development of posterior WMH.
This analysis expands on previous studies examining WMH spatial heterogeneity by using a data-driven approach to define distinct WMH spatial patterns which represent different WMH etiologies: arteriolosclerosis, CAA, AD, and normal aging. Similar studies using unbiased definitions of regional WMH are rare—a single previous study29 used advanced structural covariance analysis and produced WMH subdivisions with anatomic localizations which were less specific for CSVD subtypes. By contrast, our study identified WMH regional definitions which demonstrated significant correspondence with various radiologic, histopathologic, and epidemiologic correlations across the spectrum of CSVD and AD pathology in existing literature. Additional strengths of our work include our inclusion of a large, well-phenotyped population-based cohort with mixed CSVD etiologies and AD, which allowed for more comprehensive definition of distinct WMH localizations, and quantification of lobar CMBs for assessment of CAA.
Despite the above strengths, our study has several limitations. First, our study cohort from ADNI creates a relatively biased sample of older individuals with increased preponderance of amyloid-related pathology and less traditional vascular risk factors, especially hypertension, which may be less representative of the general population. However, bias toward amyloid-related pathology was reduced by the mixed nature of our study cohort that included cognitively normal individuals, as reflected by a similar prevalence in CAA-related imaging markers in our study population as compared with the estimated prevalence in the general population.48 Second, our analysis did not include assessment of MRI-visible perivascular space burden as another CSVD biomarker, which was previously reported to have topographically specific distributions representing different CSVD microangiopathies.49 Third, we did not perform external validation on an independent data set with different population characteristics. Further confirmation of our findings through repeated assessments in other, diverse populations comprising ischemic and/or hemorrhagic stroke, AD and CAA cohorts will be needed to demonstrate generalizability of our findings. Fourth, we did not explore cognitive profiles for the WMH spatial patterns in this study. We hypothesize that specific WMH spatial patterns are associated with different cognitive correlates, which would be the basis for future work. Fifth, study variables were restricted to those collected by the relevant ADNI study phases, and as such, we did not include other modifiable risk factors for WMH such as inflammation or tau PET, which were not performed for ADNI GO/2. Sixth, we assumed that the WMH occurrence can be decomposed into highly nonoverlapping clusters, where each cluster groups voxels with high similarities across the population. As typical for all clustering methods, it was crucial to specify the number of clusters, k, for grouping. For this unsupervised approach, this was the only decision that we have imposed, and this number was subsequently rigorously examined to ensure the optimal k was selected.
In this work, we performed an unbiased classification of WMH into 5, nonoverlapping, spatial patterns using voxel-based spectral clustering of WMH probability maps. We observed differential associations between each WMH spatial pattern and vascular and amyloid-related risk factors. We demonstrated that the development of WMH burden across the supratentorial brain is not homogenous, and spatial specificity of WMH reflects differential regional white matter vulnerability to injury from different disease pathologies. We observed WMH pattern-specific correspondence with cognitive impairment, a novel finding. We showed that our data-driven WMH spatial patterns may represent WMH spatial signatures that can distinguish between arteriolosclerosis-related CSVD, CAA, Alzheimer disease, and normal aging. This opens the path for new investigations using these WMH spatial patterns as etiology-specific imaging markers to help resolve WMH heterogeneity and improve understanding of the underlying mechanisms driving WMH development, help inform interpretation of clinical MRI scans as to the dominant underlying pathologic process, and predict clinically relevant trajectories that may affect disease and cognitive outcomes.
Acknowledgment
Data collection and sharing for this project was funded by the Alzheimer's Disease Neuroimaging Initiative (ADNI) (National Institutes of Health Grant U01 AG024904) and DOD ADNI (Department of Defense award number W81XWH-12-2-0012). ADNI is funded by the National Institute on Aging, the National Institute of Biomedical Imaging and Bioengineering, and through generous contributions from the following: AbbVie, Alzheimer's Association; Alzheimer's Drug Discovery Foundation; Araclon Biotech; BioClinica, Inc.; Biogen; Bristol-Myers Squibb Company; CereSpir, Inc.; Cogstate; Eisai Inc.; Elan Pharmaceuticals, Inc.; Eli Lilly and Company; EuroImmun; F. Hoffmann-La Roche Ltd and its affiliated company Genentech, Inc.; Fujirebio; GE Healthcare; IXICO Ltd.; Janssen Alzheimer Immunotherapy Research & Development, LLC.; Johnson & Johnson Pharmaceutical Research & Development LLC.; Lumosity; Lundbeck; Merck & Co., Inc.; Meso Scale Diagnostics, LLC.; NeuroRx Research; Neurotrack Technologies; Novartis Pharmaceuticals Corporation; Pfizer Inc.; Piramal Imaging; Servier; Takeda Pharmaceutical Company; and Transition Therapeutics. The Canadian Institutes of Health Research is providing funds to support ADNI clinical sites in Canada. Private sector contributions are facilitated by the Foundation for the National Institutes of Health (fnih.org). The grantee organization is the Northern California Institute for Research and Education, and the study is coordinated by the Alzheimer's Therapeutic Research Institute at the University of Southern California. ADNI data are disseminated by the Laboratory for Neuro Imaging at the University of Southern California.
Glossary
- AD
Alzheimer disease
- ADNI
Alzheimer's Disease Neuroimaging Initiative
- CAA
cerebral amyloid angiopathy
- CDR
Clinical Dementia Rating
- CSVD
cerebral small vessel disease
- cSS
cortical superficial siderosis
- HTN
hypertension
- HTN-S
hypertension score
- ICH
intracerebral hemorrhage
- IQR
interquartile range
- SBP
systolic blood pressure
- SL-CMB
strictly lobar cerebral microbleeds
- SUVR
standardized uptake value ratio
- WMH
white matter hyperintensities
Appendix. Authors
Footnotes
Editorial, page 1017
Study Funding
C.L. Phuah is supported by the NIH-NINDS (K23 NS110927) and the American Heart Association (19CDA34620004). B.M. Ances receives support from the NIH-NIA through P01 AG026276 and R01 AG052550, the Daniel J. Brennan MD Fund, and the Paula and Rodger O'Riney Fund. J.-M. Lee is supported by the NIH-NINDS through U24 NS107230, UF1 NS 125512, and R01 NS085419. All funding entities were not involved in study design; data collection, analysis, and interpretation; writing of the manuscript; or the decision to submit for publication.
Disclosure
The authors report no relevant disclosures. Go to Neurology.org/N for full disclosures.
References
- 1.Wardlaw JM, Valdés Hernández MC, Muñoz-Maniega S. What are white matter hyperintensities made of? Relevance to vascular cognitive impairment. J Am Heart Assoc. 2015;4(6):e001140. [DOI] [PMC free article] [PubMed] [Google Scholar]
- 2.Wardlaw JM, Smith EE, Biessels GJ, et al. Neuroimaging standards for research into small vessel disease and its contribution to ageing and neurodegeneration. Lancet Neurol. 2013;12(8):822-838. [DOI] [PMC free article] [PubMed] [Google Scholar]
- 3.Alber J, Alladi S, Bae HJ, et al. White matter hyperintensities in vascular contributions to cognitive impairment and dementia (VCID): knowledge gaps and opportunities. Alzheimers Dement (NY). 2019;5:107-117. [DOI] [PMC free article] [PubMed] [Google Scholar]
- 4.Alosco ML, Sugarman MA, Besser LM, et al. A clinicopathological investigation of white matter hyperintensities and Alzheimer's disease neuropathology. J Alzheimers Dis. 2018;63(4):1347-1360. [DOI] [PMC free article] [PubMed] [Google Scholar]
- 5.Lee S, Viqar F, Zimmerman ME, et al. White matter hyperintensities are a core feature of Alzheimer's disease: evidence from the dominantly inherited Alzheimer network. Ann Neurol. 2016;79:929-939. [DOI] [PMC free article] [PubMed] [Google Scholar]
- 6.Gouw AA, Seewann A, van der Flier WM, et al. Heterogeneity of small vessel disease: a systematic review of MRI and histopathology correlations. J Neurol Neurosurg Psychiatry. 2011;82:126-135. [DOI] [PubMed] [Google Scholar]
- 7.Gurol ME, Biessels GJ, Polimeni JR. Advanced neuroimaging to unravel mechanisms of cerebral small vessel diseases. Stroke. 2020;51(1):29-37. [DOI] [PubMed] [Google Scholar]
- 8.Holland CM, Smith EE, Csapo I, et al. Spatial distribution of white matter hyperintensities in Alzheimer disease, cerebral amyloid angiopathy, and healthy aging. Stroke. 2008;39:1127-1133. [DOI] [PMC free article] [PubMed] [Google Scholar]
- 9.Rostrup E, Gouw AA, Vrenken H, et al. The spatial distribution of age-related white matter changes as a function of vascular risk factors – results from the LADIS study. NeuroImag.e 2012;60(3):1597-1607. [DOI] [PubMed] [Google Scholar]
- 10.Smith CD, Johnson ES, Van Eldik LJ, et al. Peripheral (deep) but not periventricular MRI white matter hyperintensities are increased in clinical vascular dementia compared to Alzheimer's disease. Brain Behav. 2016;6:e00438. [DOI] [PMC free article] [PubMed] [Google Scholar]
- 11.Charidimou A, Boulouis G, Haley K, et al. White matter hyperintensity patterns in cerebral amyloid angiopathy and hypertensive arteriopathy. Neurology. 2016;86(6):505-511. [DOI] [PMC free article] [PubMed] [Google Scholar]
- 12.Salvado G, Brugulat-Serrat A, Sudre CH, et al. Spatial patterns of white matter hyperintensities associated with Alzheimer's disease risk factors in a cognitively healthy middle-aged cohort. Alz Res Ther. 2019;11(1):12. [DOI] [PMC free article] [PubMed] [Google Scholar]
- 13.Schirmer MD, Giese AK, Fotiadis P, et al. Spatial signature of white matter hyperintensities in stroke patients. Front Neurol. 2019;10:208. [DOI] [PMC free article] [PubMed] [Google Scholar]
- 14.Brugulat-Serrat A, Salvadó G, Sudre CH, et al. Patterns of white matter hyperintensities associated with cognition in middle-aged cognitively healthy individuals. Brain Imaging Behav. 2020;14:2012-2023. [DOI] [PMC free article] [PubMed] [Google Scholar]
- 15.Garnier-Crussard A, Bougacha S, Wirth M, et al. White matter hyperintensity topography in Alzheimer's disease and links to cognition. Alzheimers Dement 2021. doi: 10.1002/alz.12410 [DOI] [PMC free article] [PubMed] [Google Scholar]
- 16.Bangen KJ, Nation DA, Delano-Wood L, et al. Aggregate effects of vascular risk factors on cerebrovascular changes in autopsy-confirmed Alzheimer's disease. Alzheimers Dement. 2015;11(4):394-403. [DOI] [PMC free article] [PubMed] [Google Scholar]
- 17.Claes P, Roosenboom J, White JD, et al. Genomewide mapping of global-to-local genetic effects on human facial shape. Nat Genet. 2018;50:414-423. [DOI] [PMC free article] [PubMed] [Google Scholar]
- 18.Gors D, Suetens P, Vandenberghe R, Claes P. Hierarchical spectral clustering of MRI for global-to-local shape analysis: applied to brain variations in Alzheimer's Disease. IEEE 14th Int Symp Biomed Imaging 2017:787-791. [Google Scholar]
- 19.ADNI. Alzheimer's Disease Neuroimaging Initiative. Accessed September 2019. adni.loni.usc.edu. [Google Scholar]
- 20.Jack CR, Bernstein MA, Fox NC, et al. The Alzheimer's disease neuroimaging initiative (ADNI): MRI methods. J Magn Reson Imaging. 2008;27:685-691. [DOI] [PMC free article] [PubMed] [Google Scholar]
- 21.Ronneberger O, Fischer P, Brox T. U-net: convolutional networks for biomedical image segmentation. Medical Image Computing and Computer-Assisted Intervention (MICCAI), Vol 9351. Springer; 2015:234-241. [Google Scholar]
- 22.DeCarli C, Maillard P, Fletcher E. Four tissue segmentation in ADNI II. Alzheimer's disease neuroimaging initiative. files.alz.washington.edu/documentation/adni-proto.pdf.
- 23.Rachmadi MF, Valdes-Hernandez MdC, Agan MLF, Di Perri C, Komura T. The Alzheimer's Disease Neuroimaging Initiative. Segmentation of white matter hyperintensities using convolutional neural networks with global spatial information in routine clinical brain MRI with none or mild vascular pathology. Comput Med Imaging Graphics. 2018;66:28-43. [DOI] [PubMed] [Google Scholar]
- 24.Chen W, Song Y, Bai H, Lin C, Chang EY. Parallel spectral clustering in distributed systems. IEEE Pattern Anal Mach Intell. 2011;33(3):568-586. [DOI] [PubMed] [Google Scholar]
- 25.Linn J, Halpin A, Demaerel P, Ruhland J, Giese AD, et al. Prevalence of superficial siderosis in patients with cerebral amyloid angiopathy. Neurology. 2010;74(17):1356-1350. [DOI] [PMC free article] [PubMed] [Google Scholar]
- 26.Jagust WJ, Landau SM, Koeppe RA, et al. The Alzheimer's disease neuroimaging initiative 2 PET core: 2015. Alzheimers Dement. 2015;11:757-771. [DOI] [PMC free article] [PubMed] [Google Scholar]
- 27.Saykin AJ, Shen L, Yao X, et al. Genetic studies of quantitative MCI and AD phenotypes in ADNI: progress, opportunities, and plans. Alzheimers Dement. 2015;11(7):792-814. [DOI] [PMC free article] [PubMed] [Google Scholar]
- 28.D'Agostino RB, Wolf PA, Belanger AJ, Kannel WB. Stroke risk profile: adjustment for antihypertensive medication. The Framingham Study. Stroke. 1994;25:40-43. [DOI] [PubMed] [Google Scholar]
- 29.Habes M, Sotiras A, Erus G, et al. White matter lesions: spatial heterogeneity, links to risk factors, cognition, genetics, and atrophy. Neurology. 2016;91:e964-e975. [DOI] [PMC free article] [PubMed] [Google Scholar]
- 30.Palhaugen L, Sudre CH, Tecelao S, et al. Brain amyloid and vascular risk are related to distinct white matter hyperintensity patterns. J Cereb Blood Flow Metab. 2021;41(5):1162-1174. [DOI] [PMC free article] [PubMed] [Google Scholar]
- 31.Yoshita M, Fletcher E, Harvey D, et al. Extent and distribution of white matter hyperintensities in normal aging, MCI, and AD. Neurology. 2006;67(12):2192-2198. [DOI] [PMC free article] [PubMed] [Google Scholar]
- 32.Brickman AM, Zahodne LB, Guzman VA, et al. Reconsidering harbingers of dementia: progression or parietal lobe white matter hyperintensities predicts Alzheimer's disease incidence. Neurobiol Aging. 2015;36(1):27-32. [DOI] [PMC free article] [PubMed] [Google Scholar]
- 33.Kim KW, MacFall JR, Payne ME. Classification of white matter lesions on magnetic resonance imaging in elderly persons. Biol Psychiatry. 2008;24:273-280. [DOI] [PMC free article] [PubMed] [Google Scholar]
- 34.Griffanti L, Jenkinson M, Suri S, et al. Classification and characterization of periventricular and deep white matter hyperintensities on MRI: a study in older adults. Neuroimage 2018;170:174-181. [DOI] [PubMed] [Google Scholar]
- 35.Weaver NA, Doeven T, Barkhof F, et al. Cerebral amyloid burden is associated with white matter hyperintensity in specific posterior white matter regions. Neurobiol Aging. 2019;84:225-234. [DOI] [PubMed] [Google Scholar]
- 36.Charidimou A, Gang Q, Werring DJ. Sporadic cerebral amyloid angiopathy revisited: recent insights into pathophysiology and clinical spectrum. J Neurol Neurosurg Psychiatry. 2012;83:124-137. [DOI] [PubMed] [Google Scholar]
- 37.Dierksen GA, Skehan ME, Khan MA. Spatial relation between microbleeds and amyloid deposits in amyloid angiopathy. Ann Neurol. 2010;68:545-548. [DOI] [PMC free article] [PubMed] [Google Scholar]
- 38.Bouvy WH, van Heluw SJ, Kuijf HJ, et al. Microbleeds colocalize with enlarged juxtacortical perivascular spaces in amnestic mild cognitive impairment and early Alzheimer's disease: a 7 Tesla MRI study. J Cereb Blood Flow Metab. 2020;40(4):739-746. [DOI] [PMC free article] [PubMed] [Google Scholar]
- 39.Perosa V, Oltmer J, Munting LP, et al. Perivascular space dilation is associated with vascular amyloid-β accumulation in the overlying cortex. Acta Neuropathol. 2022;143(3):331-348. [DOI] [PMC free article] [PubMed] [Google Scholar]
- 40.Case NF, Charlton A, Zwiers A, et al. Cerebral amyloid angiopathy is associated with executive dysfunction and mild cognitive impairment. Stroke. 2016;47:2010-2016. [DOI] [PubMed] [Google Scholar]
- 41.McAleese KE, Miah M, Graham S, et al. Frontal white matter lesions in Alzheimer's disease are associated with both small vessel disease and AD-associated cortical pathology. Acta Neuropathol. 2021;142:937-950. [DOI] [PMC free article] [PubMed] [Google Scholar]
- 42.Jack CR Jr, Bennett DA, Blennow K, et al. NIA-AA Research Framework: toward a biological definition of Alzheimer's disease. Alzheimers Dement. 2018;14(4):535-562. [DOI] [PMC free article] [PubMed] [Google Scholar]
- 43.Roseborough A, Ramirez J, Black SE, Edwards J. Associations between amyloid β and white matter hyperintensities: a systematic review. Alzheimers Dement. 2017;13:1154-1167. [DOI] [PubMed] [Google Scholar]
- 44.McAleese KE, Walker L, Graham S, et al. Parietal white matter lesions in Alzheimer's disease are associated with cortical neurodegenerative pathology, but not with small vessel disease. Acta Neuropathol. 2017;134:459-473. [DOI] [PMC free article] [PubMed] [Google Scholar]
- 45.Grothe MJ, Barthel H, Sepulcre J, et al. Vivo staging of regional amyloid deposition. Neurology. 2017;89(20):2031-2038. [DOI] [PMC free article] [PubMed] [Google Scholar]
- 46.Sichtermann T, Furtmann JK, Dekeyzer S, et al. Increased water content in periventricular caps in patients without acute hydrocephalus. AJNR Am J Neuroradiol. 2019;40(5):784-787. [DOI] [PMC free article] [PubMed] [Google Scholar]
- 47.Schmidt R, Schmidt H, Haybaeck J, et al. Heterogeneity in age-related white matter changes. Acta Neuropathologica. 2011;122:171-185. [DOI] [PubMed] [Google Scholar]
- 48.Jakel L, De Kort AM, Klijn CJM, Schreuder FHBM, Verbeek MM. Prevalence of cerebral amyloid angiopathy: a systematic review and meta-analysis. Alzheimer Dement. 2021:1-19. [DOI] [PMC free article] [PubMed] [Google Scholar]
- 49.Charidimou A, Boulois G, Pasi M, et al. MRI-visible perivascular spaces in cerebral amyloid angiopathy and hypertensive arteriopathy. Neurology. 2017;88(12):1157-1164. [DOI] [PMC free article] [PubMed] [Google Scholar]
Associated Data
This section collects any data citations, data availability statements, or supplementary materials included in this article.
Data Availability Statement
All relevant source data are available from ADNI.19 Relevant image IDs are provided in the Supplement (eTable 5, links.lww.com/WNL/C332). The derived data supporting the study findings are available on request for the express purpose of reproducing the results.


