Abstract
Urinary tract infections are among the most common human bacterial infections and place a significant burden on healthcare systems due to associated morbidity, cost, and antibiotic use. Despite being a facultative anaerobe, uropathogenic Escherichia coli (UPEC), the primary cause of urinary tract infections, requires aerobic respiration to establish infection in the bladder. By combining bacterial genetics with cell culture and murine models of infection, we demonstrate that the widely conserved respiratory quinol oxidase cytochrome bd is required for intracellular infection of urothelial cells. Through a series of genetic, biochemical, and functional assays, we show that intracellular oxygen scavenging by cytochrome bd alters mitochondrial physiology by reducing the efficiency of mitochondrial respiration, stabilizing the hypoxia inducible transcription factor HIF-1, and promoting a shift toward aerobic glycolysis. This bacterially induced rewiring of host metabolism antagonizes apoptosis, thereby protecting intracellular bacteria from urothelial cell exfoliation and preserving their replicative niche. These results reveal the metabolic basis for intracellular bacterial pathogenesis during urinary tract infection and identify subversion of mitochondrial metabolism as a bacterial strategy to facilitate persistence within the urinary tract.
Urinary tract infections are among the most common human bacterial infections, afflicting an estimated 150 million people per year1–3. Uropathogenic Escherichia coli (UPEC) accounts for approximately 80% of urinary tract infections, making it one of the most successful human bacterial pathogens1,3. During bladder infection UPEC enters a transient intracellular lifecycle, where it replicates to form multicellular communities within the cytosol of urothelial cells1–6. Inside the cytosol, bacteria replicate to high numbers in a protected and nutrient-rich niche4–6. Although decades of research have meticulously defined the stages of UPEC pathogenesis, relatively little is known regarding how bacteria adapt their metabolism to thrive within urothelial cells7,8.
Despite being a facultative anaerobe, oxygen plays a central role in the ability of UPEC to colonize the bladder and form stress tolerant biofilms in the urinary tract9–13. Although E. coli encodes three respiratory oxidases capable of mediating aerobic respiration – a heme copper oxidase, cytochrome bo, and two bd-type oxidases, cytochromes bd and bd2 – only loss of cytochrome bd impacts bacterial fitness in the bladder12,14,15. Unlike cytochrome bo, the bd-type oxidases possess a remarkably high oxygen affinity which allows them to mediate respiration under microaerobic conditions14,16. Moreover, cytochrome bd possesses non-respiratory biochemical activities that confer tolerance to toxic chemicals and innate immune effectors such as nitric oxide17,18. Consequently, cytochrome bd plays a central role in the physiology and pathogenesis of a wide array of human pathogens16,18.
In this work we demonstrate that oxygen scavenging by cytochrome bd supports intracellular bacterial pathogenesis during bladder infection both by supporting bacterial replication and by depleting oxygen from the urothelial cell cytosol. Intracellular bacterial respiration alters mitochondrial physiology, stabilizes the hypoxia inducible transcription factor HIF-1, and rewires urothelial cell metabolism. This metabolic shift antagonizes apoptosis and protects intracellular bacteria from urothelial cell exfoliation, a critical antibacterial defense in the bladder. These findings define the metabolic underpinnings of intracellular bacterial pathogenesis during urinary tract infection and reveal a mechanism by which bacterial respiration rewires host cell metabolism to support bacterial survival in the urinary tract.
RESULTS
Cytochrome bd supports intracellular bacterial replication
Although previous work established that cytochrome bd is necessary for bladder colonization, the mechanisms underlying this requirement remain unclear12,15. To define the contribution of cytochrome bd to bladder colonization, we infected mice with UPEC cystitis isolate UTI89, an isogenic mutant lacking cytochrome bd (∆cydAB), or ∆cydAB complemented with the cytochrome bd encoding operon (cydABX) under native transcriptional control12,13 and enumerated bacterial bladder titer during the first six hours of infection. Loss of cytochrome bd causes a reduction in bladder titer within one hour of infection that is rescued by extrachromosomal complementation, demonstrating cytochrome bd is necessary for the establishment of infection (Figure 1a). This reduction in titer increases in magnitude over time, indicating cytochrome bd supports the expansion of bacterial populations in the bladder (Figure 1a).
Figure 1: Cytochrome bd supports intracellular bacterial replication during bladder infection.
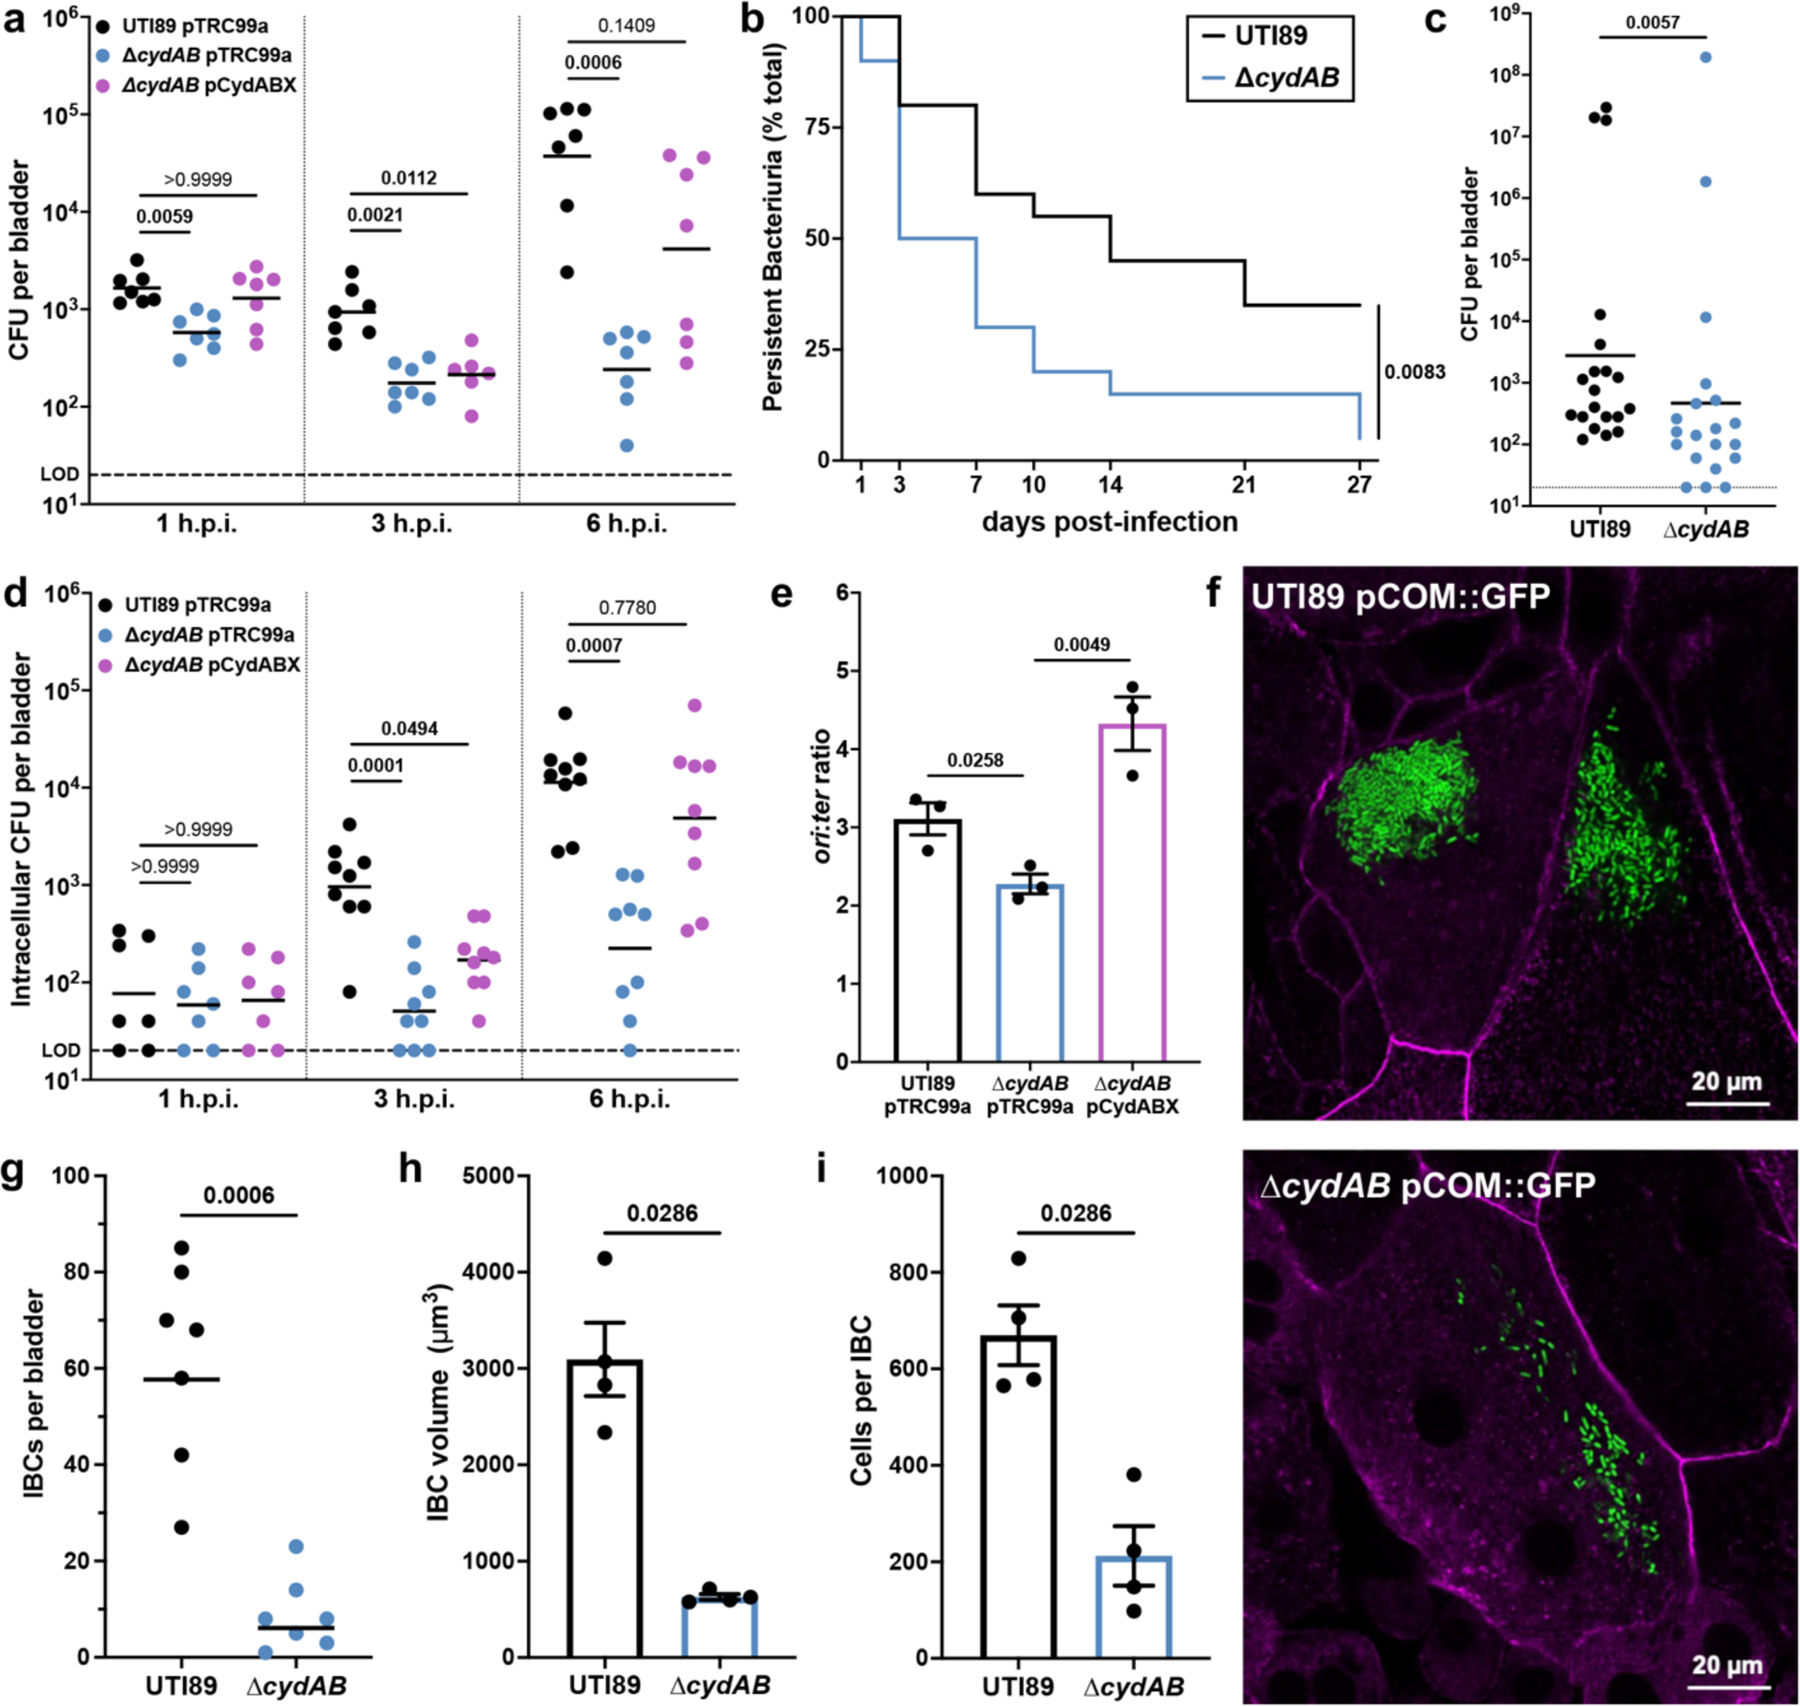
a, Bladder bacterial titer 1-, 3-, and 6-hours post-infection (h.p.i.); geometric mean; Kruskal-Wallis test with Dunn’s test for multiple comparisons. b, Kaplan-Meier curve depicting the proportion of mice (n = 20) with persistent bacteriuria (>104 CFU per mL urine); log-rank Mantel-Cox test. c, Bladder bacterial titer 28 days post-infection; geometric mean; two-tailed Mann-Whitney test. d, Bladder intracellular bacterial titer 1, 3, and 6 h.p.i.; geometric mean; Kruskal-Wallis test with Dunn’s test for multiple comparisons. e, ori:ter copy number ratio of intracellular bacteria 3 h.p.i; mean ± SEM, two-tailed unpaired t test. f, Representative images of wild-type and ∆cydAB IBCs 6 h.p.i.; green, bacteria; magenta, actin. g, Number of IBCs per bladder; geometric mean; two-tailed Mann-Whitney test. h-i, Quantification of the volume (h) and number of cells per IBC (i); mean ± SEM; two-tailed Mann-Whitney test. All experiments were performed with a minimum of three biological replicates. Each point represents a biological replicate. Dotted line indicates limit of detection (LOD). Exact p-values are provided in the figure, with bold values indicating statistical significance (p < 0.05).
To determine whether the observed defect in early bladder colonization impacts bacterial persistence in the bladder, we longitudinally collected urine from infected mice (Figure 1b–c). Similar to patterns observed in humans, in this model a subset of mice spontaneously resolve bacteriuria, whereas others experience chronic bacteriuria throughout the experiment. Mice infected with ∆cydAB experience rapid resolution of bacteriuria (median time to resolution: 14 and 5 days for wild-type and ∆cydAB, respectively), and are less likely to experience chronic bacteriuria than wild-type infected mice (35% and 5% of mice for wild-type and ∆cydAB, respectively) (Figure 1b). Consistent with these findings, ∆cydAB infected mice have reduced bladder bacterial titer four weeks post-infection (Figure 1c). Together these data indicate cytochrome bd is required for both initial colonization and long-term bacterial persistence in the bladder.
UPEC use type 1 pili to adhere to urothelial cells, invade the urothelial cell cytosol, and replicate to form biofilm-like intracellular bacterial communities (IBCs)4,19,20. We thus first determined how cytochrome bd influences production of type 1 pili, using wild-type UTI89, ∆cydAB, ∆appBC∆cyoAB (which encodes cytochrome bd as its sole respiratory oxidase), and a strain lacking type 1 pili (∆fimA-H). Wild-type, ∆cydAB, and ∆appBC∆cyoAB have similar abundance of the primary subunit of type 1 pili FimA, and each strain exhibits similar patterns of FimA polymerization (Extended Data Figure 1a–b), demonstrating cytochrome bd does not impair type 1 pili production. Furthermore, each strain exhibits similar, mannose-sensitive hemagglutination titers, indicating cytochrome bd does not impact the elaboration of functional type 1 pili (Extended Data Figure 1c). Consistent with these findings, gentamicin protection assays reveal that urothelial cells infected with wild-type, ∆cydAB, or ∆appBC∆cyoAB have similar adherent and intracellular bacterial titers at early stages of infection (Extended Data Figure 1d). These results demonstrate cytochrome bd does not impact UPEC adherence or invasion of urothelial cells.
To define the contribution of cytochrome bd to intracellular bacterial pathogenesis, we quantified intracellular bacterial bladder titers across the first six hours of infection. Wild-type and ∆cydAB have indistinguishable intracellular titers one hour post-infection, indicating loss of cytochrome bd does not impact bacterial invasion of urothelial cells in vivo (Figure 1d)19. Intracellular titers of wild-type and ∆cydAB pCydABX increase rapidly during the first six hours of infection; however, intracellular titers of ∆cydAB remain static between one and three hours and increase modestly thereafter, suggesting loss of cytochrome bd impairs intracellular bacterial replication (Figure 1d). To test this, we extracted genomic DNA from intracellular bacteria three hours post-infection and performed qPCR to quantify the copy number ratio of the origin of replication and terminus (ori:ter ratio) as a proxy for chromosomal replication rate (Figure 1e)21. Loss of cytochrome bd decreases the ori:ter ratio relative to wild-type, indicating cytochrome bd is required for efficient intracellular replication (Figure 1e). Consistent with this, loss of cytochrome bd causes gross deficiencies in the formation of IBCs (Figure 1f). Mice infected with ∆cydAB have nearly 10-fold fewer IBCs per bladder compared to mice infected with wild-type. Moreover, ∆cydAB IBCs are smaller and less populated than wild-type IBCs (Figure 1g–i). Because loss of cytochrome bd affects antibiotic tolerance in biofilms in vitro12,13, we next investigated whether cytochrome bd influences intracellular bacterial antibiotic sensitivity. Interestingly, although ciprofloxacin is equally efficient at killing wild-type and ∆cydAB during intracellular infection, ∆cydAB is more sensitive to nitrofurantoin – a first-line treatment for bladder infection (Extended Data Figure 2). These data demonstrate cytochrome bd supports UPEC intracellular pathogenesis by facilitating bacterial replication and enhancing bacterial stress tolerance.
Cytochrome bd has niche dependent roles during infection
Cytochrome bd is a multifunctional respiratory complex that plays a critical role in the pathogenesis of a diverse group of bacteria16,18. While cytochrome bd canonically functions as a high affinity respiratory quinol:O2 oxidoreductase, this complex also possesses non-respiratory activities including the ability to reversibly sequester and oxidatively degrade the respiratory poison and innate immune effector nitric oxide17,18. Although both respiration and nitric oxide tolerance are known to support the pathogenesis of various organisms, the independent contribution of the respiratory and non-respiratory activities of cytochrome bd has not been systematically investigated. For example, while cytochrome bd functions as an oxygen scavenger that facilitates pathogenic expansion of Salmonella enterica and E. coli in the inflamed gut, the contribution of the non-respiratory activities to this process is unknown22. In Mycobacterium tuberculosis, cytochrome bd supports respiration and confers tolerance to nitric oxide, but the role of each biochemical activity in pathogenesis is poorly defined23,24. Given this gap in knowledge, we sought to create a cytochrome bd variant that functionally separates the respiratory and non-respiratory activities of cytochrome bd, allowing us to biochemically define the contribution of cytochrome bd to UPEC pathogenesis in the urinary tract.
Lysine-252 (K252) is a universally conserved periplasmic residue of the cytochrome bd subunit CydA that facilitates quinol binding and aids in the coordination of heme b558, the electron accepting prosthetic group (Figure 2a and Supplementary Table 1a–b)25,26. Because K252 lacks contacts with the heme d prosthetic group that interacts with nitric oxide26, we hypothesized that disrupting K252 would inhibit respiration without influencing the non-respiratory activities of cytochrome bd. Indeed, previous work demonstrated that a CydA_K252A variant has impaired quinol oxidation (Vmax = 5% wild-type CydA) but near wild-type abundance of heme d25. Consistent with this, Rosetta predicts minimal destabilization of CydA_K252A relative to wild-type CydA (Cartesian ∆∆G = 3.46 Rosetta energy units (REU)). These analyses suggest the CydA_K252A variant has impaired respiratory activity but retains the ability to detoxify nitric oxide.
Figure 2: Biochemical dissection of cytochrome bd reveals niche dependent contributions to bladder pathogenesis.
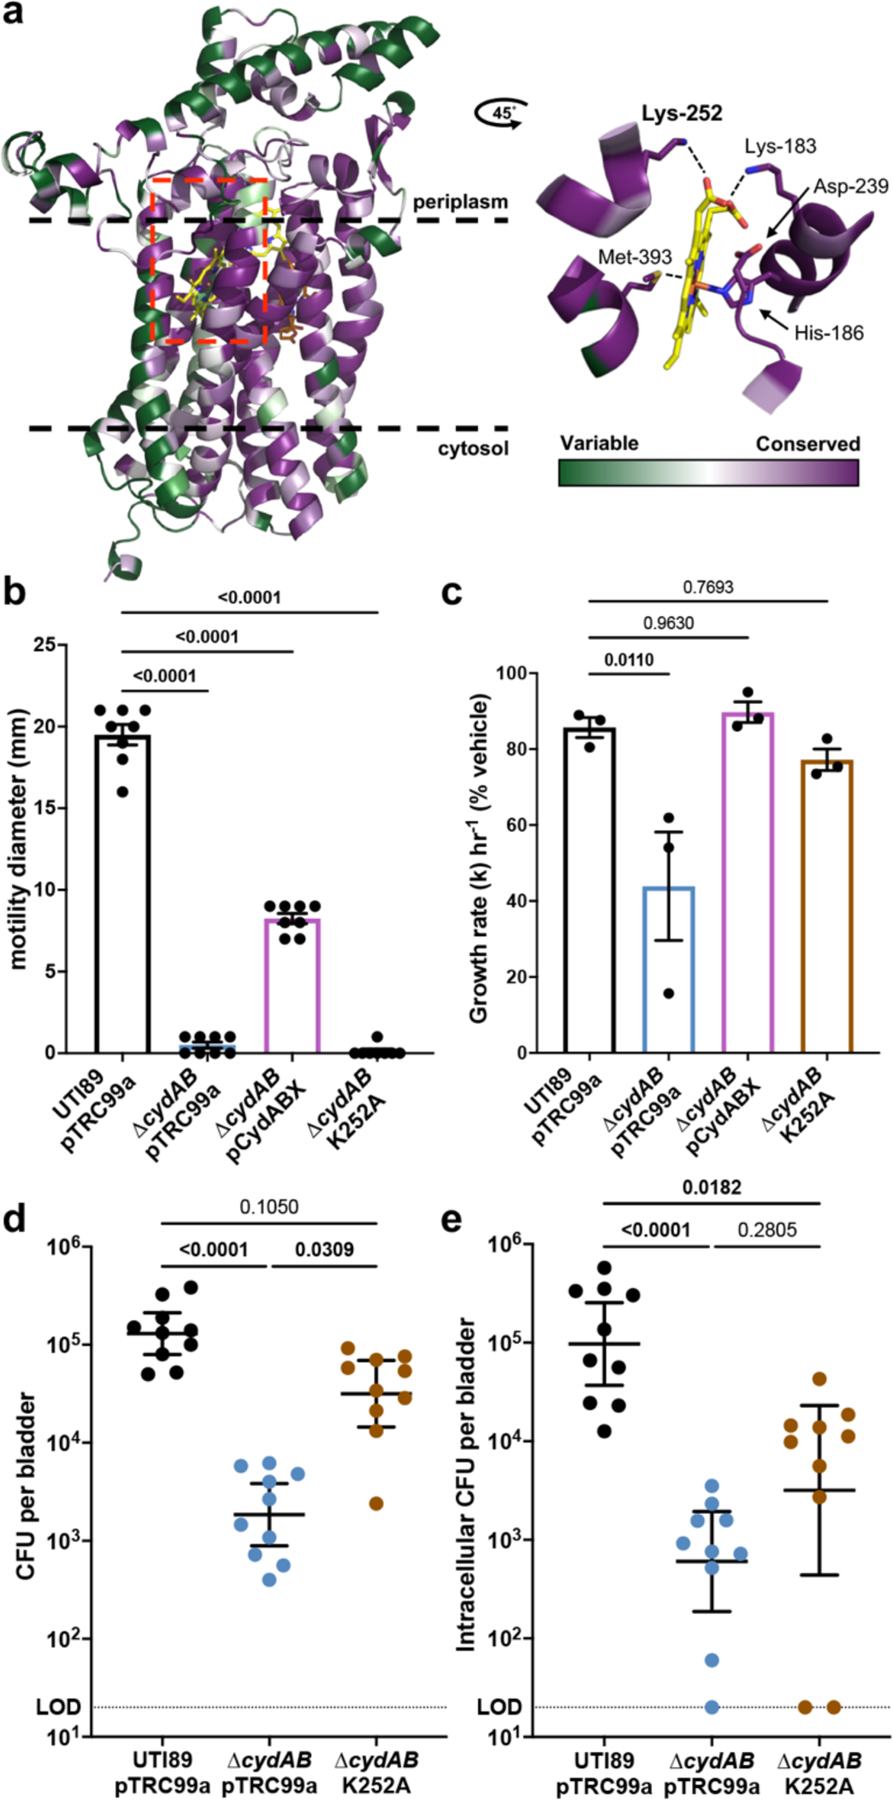
a, left, Full-length model of cytochrome bd subunit CydA color coded according to amino acid conservation score. right, Magnified image of the region surrounding heme b558 from a CydA cryo-EM structure (PDB ID: 6rko) depicting the coordinating residues. Dashed lines indicate approximate bounds of the inner membrane. Red box denotes magnified region shown in the right panel. b, Flagellar motility radius; mean ± SEM; one-way ANOVA with Dunnett’s test for multiple comparisons. c, Bacterial growth rate in NOC-12 treated cultures compared to vehicle treated controls; mean ± SEM; one-way ANOVA with Dunnett’s test for multiple comparisons. d-e, Bladder total bacterial titer (d) and intracellular bacterial titer (e) at 6 h.p.i.; geometric mean ± 95% confidence interval (CI); Kruskal-Wallis test with Dunn’s test for multiple comparisons. All experiments were performed with a minimum of three biological replicates. Each point represents a biological replicate. Dotted line indicates limit of detection. Exact p-values are provided in the figure, with bold values indicating statistical significance (p < 0.05).
To test this prediction, we interrogated the energetics and nitric oxide sensitivity of ∆cydAB complemented with either pCydABX or CydA_K252A. Respiratory activity was assessed by measuring flagellar motility, a process energized by quinol oxidation via the proton gradient. Loss of cytochrome bd eliminates motility without impeding flagellar biosynthesis, indicating quinol oxidation by cytochrome bd energizes flagellar rotation (Figure 2b and Extended Data Figure 3). Unlike the native cydABX construct, expression of CydA_K252A fails to restore flagellar motility (Figure 2b), in agreement with work indicating CydA_K252A does not substantially contribute to quinol oxidation25. Nitric oxide sensitivity was assessed by measuring growth inhibition after treatment with nitric oxide donor NOC-12. Whereas deletion of cytochrome bd exacerbates nitric oxide mediated growth inhibition, complementation with either pCydABX or CydA_K252A restores nitric oxide tolerance to wild-type levels (Figure 2c). Collectively, these data demonstrate that the respiratory and non-respiratory activities of cytochrome bd are functionally separable, and that CydA_K252A is a respiration deficient variant that retains the ability to detoxify nitric oxide. Because cytochrome bd is widely distributed among pathogenic bacteria and K252 is universally conserved, we anticipate the CydA_K252A variant will have broad applicability toward studying the contribution of cytochrome bd to bacterial physiology.
We next leveraged CydA_K252A to biochemically define the role of cytochrome bd in bladder pathogenesis. We observed that at six hours post-infection, complementation with CydA_K252A restores total bladder titers to wild-type levels, suggesting cytochrome bd supports colonization of the bladder lumen through its non-respiratory activities, presumably by detoxifying nitric oxide (Figure 2d). Consistent with this, urine contains high concentrations of nitric oxide and nitrogenous waste, and bacterial infection induces a robust influx of phagocytes into the bladder27. Complementation with CydA_K252A fails to restore intracellular bladder titers to wild-type levels, indicating cytochrome bd mediated quinol oxidation is required for intracellular pathogenesis (Figure 2e). Despite this, intracellularly infected urothelial cells robustly upregulate inducible nitric oxide synthase (iNOS) encoding transcript NOS2, indicating that UPEC is exposed to nitric oxide during intracellular infection (Extended Data Figure 4). These results demonstrate that the biochemical mechanisms by which cytochrome bd promotes bladder pathogenesis are niche dependent, and that cytochrome bd mediated respiration is specifically required during intracellular infection.
UPEC uses aerobic respiration during intracellular infection
Based on the observation that cytochrome bd mediated quinol oxidation supports intracellular expansion, we sought to quantify intracellular bacterial aerobic respiration. To do so, we measured the oxygen consumption rate (OCR) of intracellularly infected urothelial cells and observe a consistently elevated OCR relative to mock infected controls (Figure 3a). Importantly, because the respiratory chain of E. coli differs substantially from that encoded by mammalian cells, E. coli is insensitive to the complex I and III inhibitors rotenone and antimycin A (Extended Data Figure 5)14,28,29. As such, these agents specifically inhibit mammalian mitochondrial respiration and allow a direct measure of non-mitochondrial (i.e. bacterial) OCR. We observe a 69% increase in non-mitochondrial OCR of intracellularly infected cells, indicating the elevated OCR is caused by intracellular bacterial oxygen consumption and not an off-target effect on mitochondrial respiration (Figure 3b).
Figure 3: UPEC uses aerobic respiration during intracellular infection of urothelial cells.
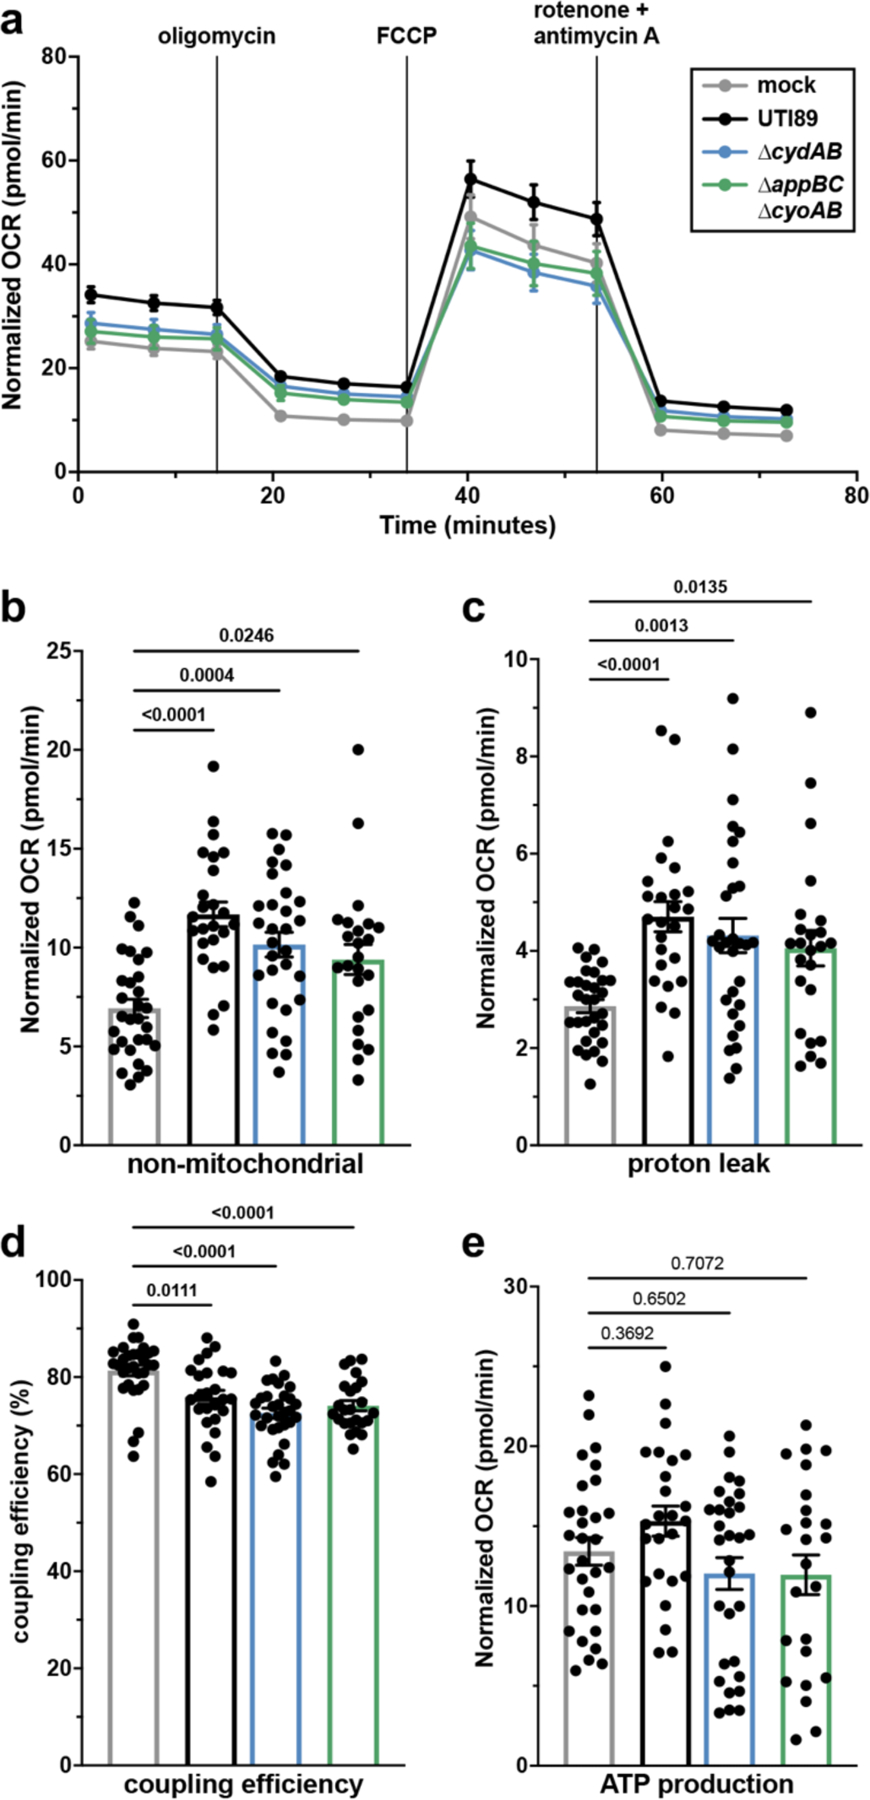
a, Oxygen consumption rate (OCR) of intracellularly infected urothelial cells; mean ± SEM. b-e, non-mitochondrial OCR (b), mitochondrial coupling efficiency (c), proton leak (d), and ATP production (e) measured by extracellular flux assays; mean ± SEM; Brown-Forsythe and Welch ANOVA with Dunnett’s T3 test for multiple comparisons. All experiments were performed with a minimum of three biological replicates. Each point in (b-e) represents a biological replicate. Exact p-values are provided in the figure, with bold values indicating statistical significance (p < 0.05).
To determine the contribution of cytochrome bd to intracellular bacterial respiration, we measured OCR of urothelial cells intracellularly infected with ∆cydAB or ∆appBC∆cyoAB. Although infected urothelial cells contain similar numbers of intracellular bacteria at the tested timepoint (Extended Data Figure 1d), urothelial cells infected with ∆cydAB or ∆appBC∆cyoAB exhibit an intermediate phenotype between wild-type and mock infected cells (Figure 3a). The increase in non-mitochondrial OCR is partially reduced in cells infected with either respiratory mutant relative to wild-type infected cells, suggesting UPEC can use multiple respiratory oxidases to facilitate intracellular aerobic respiration (Figure 3a–b). Consistent with this, intracellular bacteria robustly express both cytochrome bd and bo, and transcript encoding both respiratory oxidases is homogenously distributed within IBCs (Pearson correlation: 16S rRNA-cyoA = 0.93; 16S rRNA-cydA = 0.94) (Extended Data Figure 6). These results suggest UPEC uses a mixed respiratory program to facilitate aerobic respiration within urothelial cells.
We next determined the influence of intracellular bacterial respiration on mitochondrial metabolism by interrogating mitochondrial electron transport chain efficiency. Intracellularly infected urothelial cells exhibit increased proton leak and decreased coupling efficiency relative to mock infected cells, indicating intracellular infection impairs mitochondrial respiration efficiency (Figure 3c–d). However, despite decreased electron transport chain efficiency, intracellularly infected cells have similar ATP production as mock infected cells (Figure 3e), suggesting a compensatory mechanism allows urothelial cells to maintain their energetic state during intracellular infection despite disruptions to electron transport chain efficiency.
To further characterize the influence of intracellular infection on mitochondrial physiology, we performed structured illumination microscopy to analyze mitochondrial network morphology. In contrast to the punctate mitochondria observed in mock infected cells, we observe tubular mitochondrial networks in intracellularly infected cells (Figure 4a). Mitochondrial size and major axis length are increased in intracellularly infected cells relative to mock infected cells (Figure 4b–d), indicating intracellular infection leads to an enhancement in mitochondrial fusion. Invasion of several bacterial pathogens into human cells has been shown to promote mitochondrial fusion, and this fusion both enhances mitochondrial respiratory efficiency and supports innate immune defenses30,31. Intriguingly, we observe more pronounced mitochondrial fusion in ∆cydAB-infected cells relative to wild-type infected cells, suggesting intracellular bacterial respiration antagonizes mitochondrial fusion. Consistent with this, previous studies demonstrate that decreases in oxygen availability promote mitochondrial fission by activating the GTPase DRP132. Together these results indicate that intracellular infection of urothelial cells induces mitochondrial fusion and suggest that bacterial respiration may antagonize mitochondrial fusion by depleting oxygen and rewiring host cell metabolism.
Figure 4: Intracellular bacterial infection enhances mitochondrial network fusion.
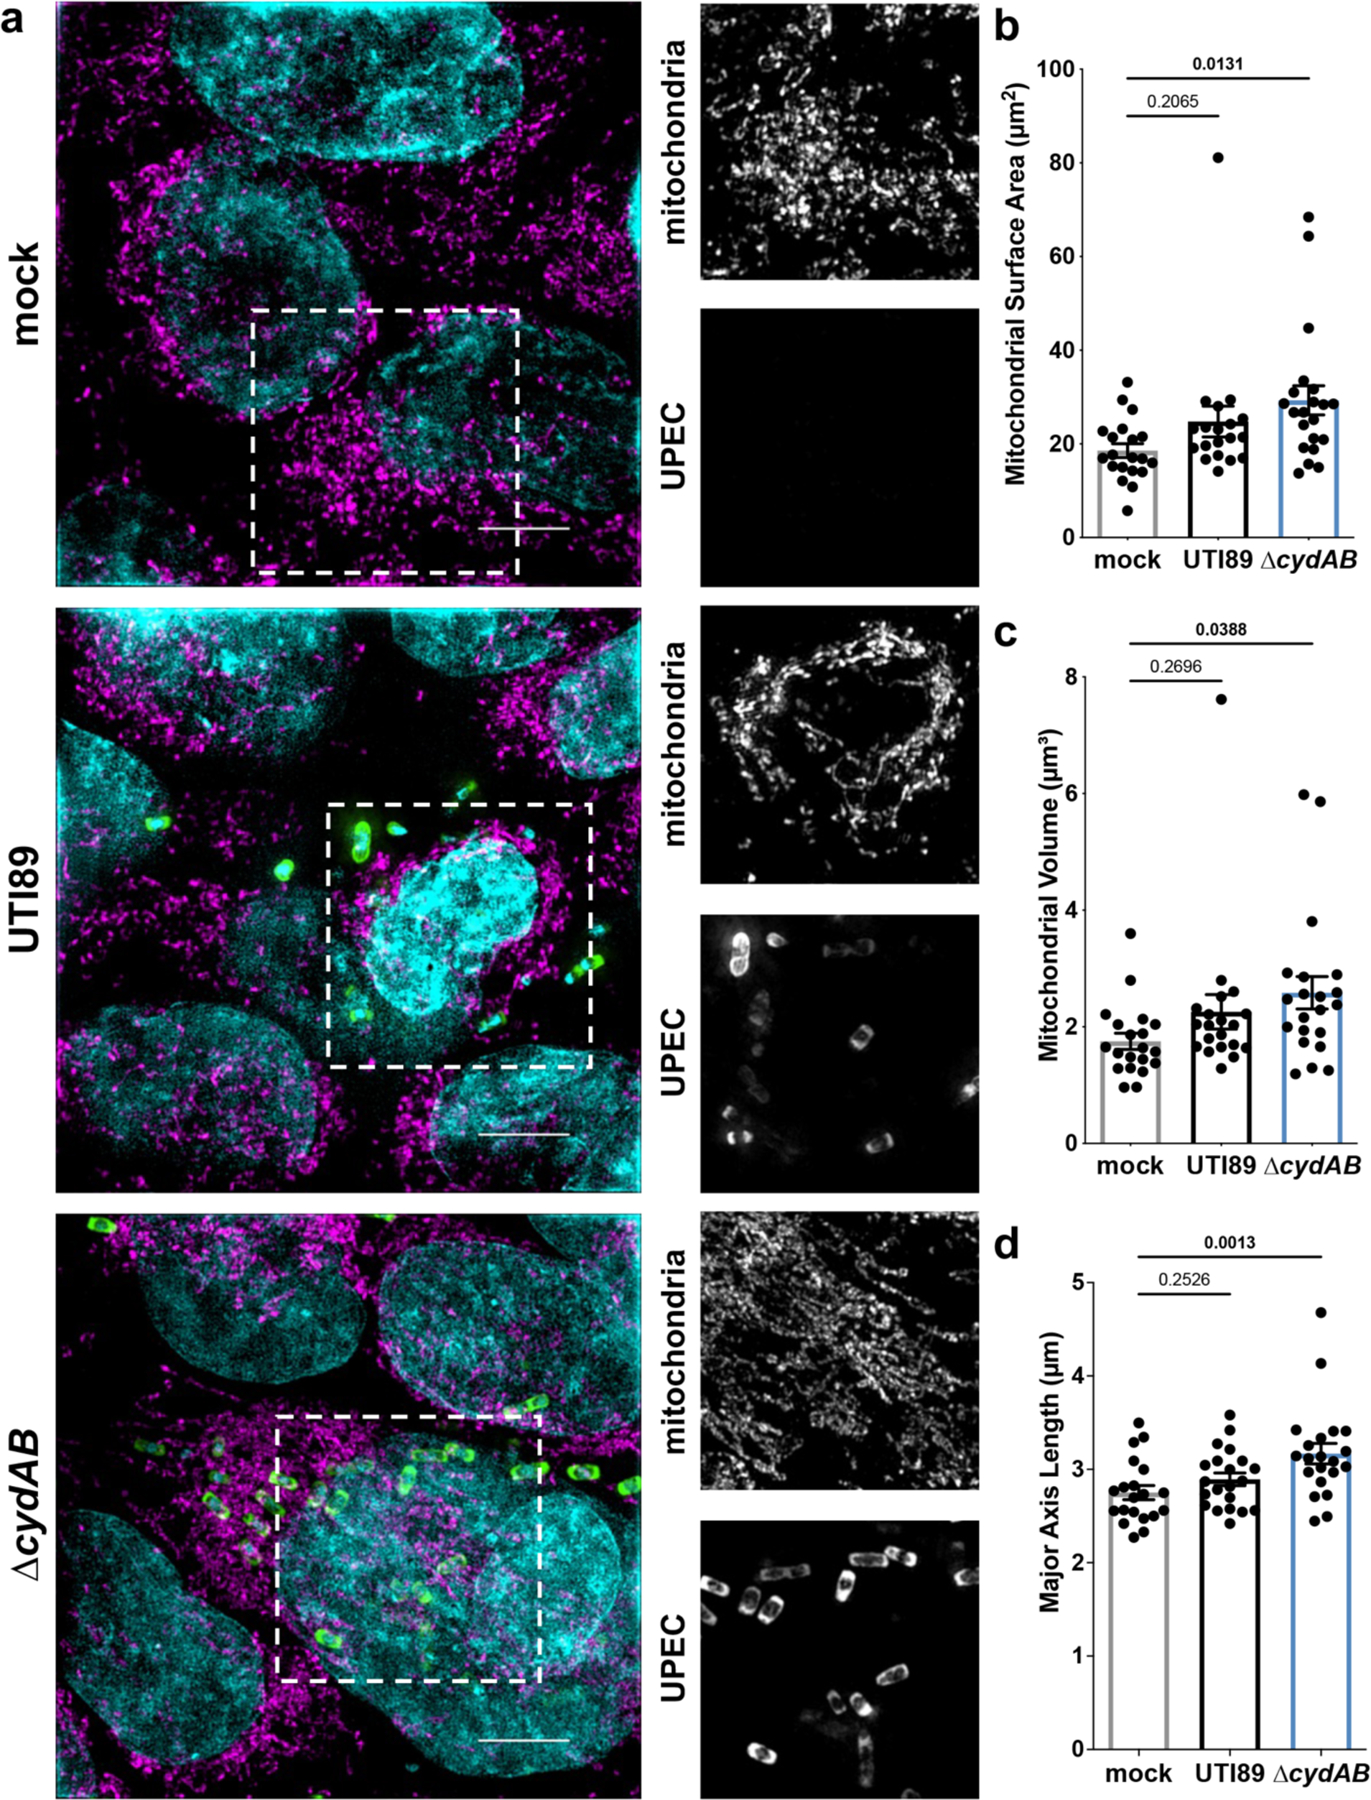
a, Representative structured illumination microscopy images of intracellularly infected or mock infected urothelial cells. Scale bar, 5 μm. Dashed box indicates area of interest shown in single color panels at right; cyan, DAPI; magenta, mitochondria; green, bacteria. (b-d) Quantification of mitochondrial surface area (b), volume (c), and major axis length (d) of intracellularly infected urothelial cells; mean ± SEM; one-way ANOVA with Dunnett’s test for multiple comparisons. Each point represents the average value for an individual cell. Experiments were performed on at least three biological replicates. Exact p-values are provided in the figure, with bold values indicating statistical significance (p < 0.05).
Bacterial respiration alters urothelial cell metabolism
The oxygen affinity of cytochrome bd is approximately 1000-fold higher than that of cytochrome bo and human cytochrome c oxidase, suggesting cytochrome bd promotes intracellular pathogenesis by allowing UPEC to scavenge oxygen in the hypoxic cytosol14,33. As such, we hypothesized that intracellular bacterial oxygen consumption depletes cytosolic oxygen, stabilizes the hypoxia inducible transcription factor HIF-1, and induces a shift toward aerobic glycolysis. Indeed, several studies have identified Warburg-like metabolic shifts associated with intracellular bacterial infection of immune cells, and urothelial cells upregulate genes involved in glucose metabolism in response to IBC formation7,8,30,31. To test this hypothesis, we quantified the abundance of HIF-1α, the oxygen regulated subunit of HIF-1 in infected urothelial cells, using immunoblot analysis. Consistent with the prediction that intracellular bacterial respiration depletes cytosolic oxygen and stabilizes HIF-1, we observe a 30 percent increase in HIF-1α abundance in intracellular infected cells relative to mock infected cells (Figure 5a).
Figure 5: Intracellular infection of urothelial cells induces a shift toward aerobic glycolysis.
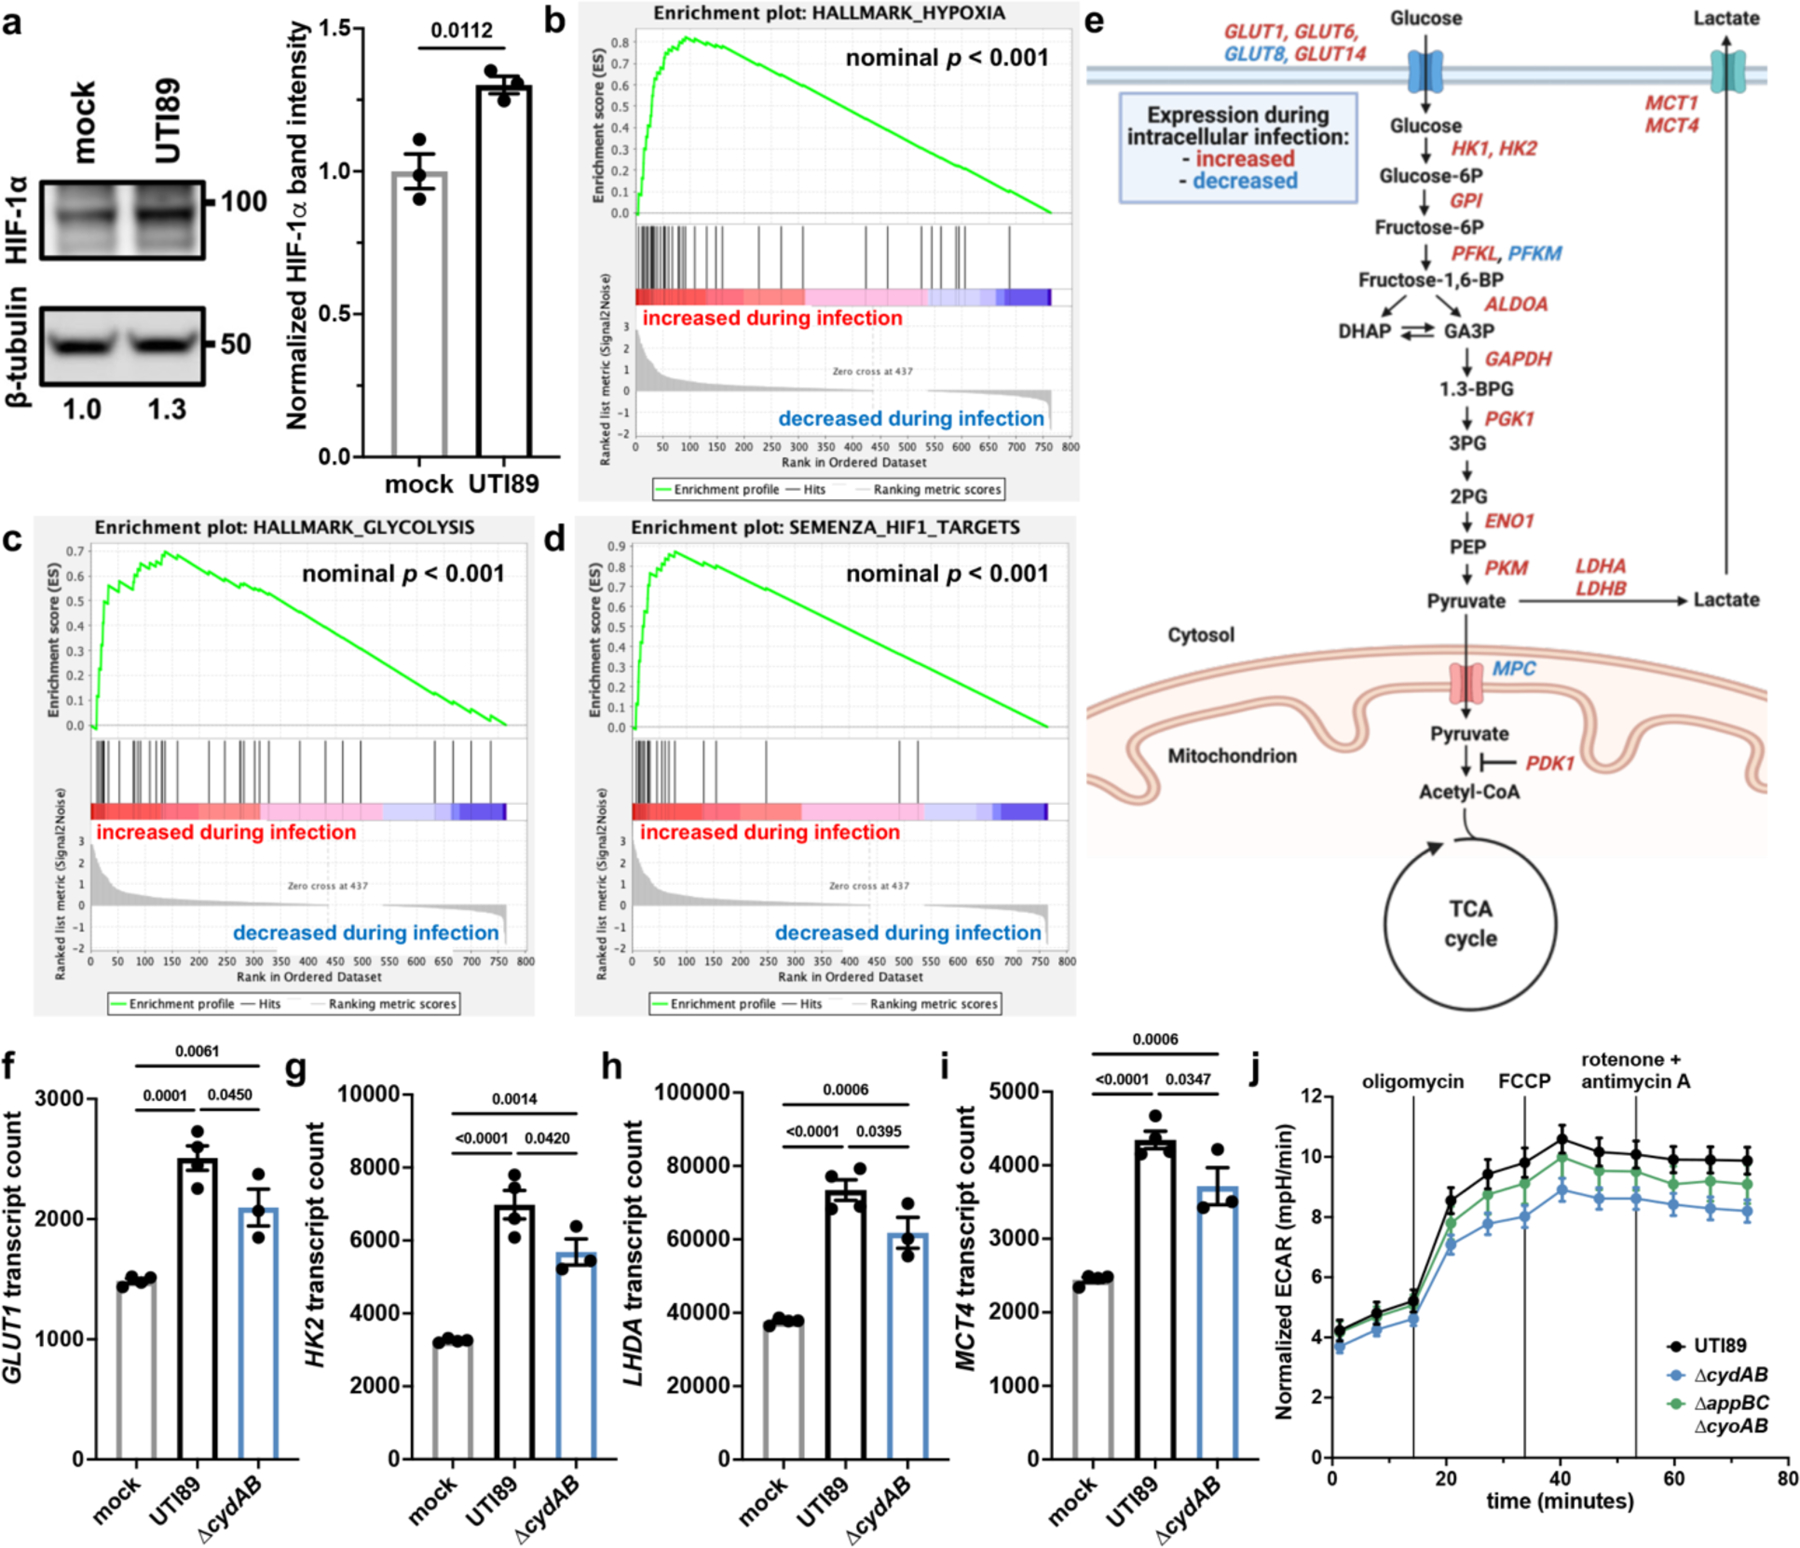
a, left, HIF-1α immunoblot performed on intracellularly infected or mock infected urothelial cells. right, Quantification of HIF-1α band intensity normalized to β-tubulin; mean ± SEM; two-tailed unpaired t test. b-d, Gene set enrichment analyses of hypoxia hallmark genes (b), glycolysis hallmark genes (c), and HIF-1 target genes (d). Green line depicts running enrichment score, black lines indicate the location of each gene within the ranked list of differentially regulated transcripts; empirical phenotype-based permutation test. e, Schematic depicting metabolic genes with significant differences in transcript abundance between intracellularly infected and mock infected cells. f-i Normalized counts of select HIF-1 regulated metabolic transcripts shown in (e); mean ± SEM; one-way ANOVA with Tukey’s test for multiple comparisons. j, Extracellular acidification rate (ECAR) of intracellularly infected urothelial cells; mean ± SEM. Each point represents a biological replicate. Experiments were performed on at least three biological replicates. Exact p-values are provided in the figure, with bold values indicating statistical significance (p < 0.05).
To determine the transcriptional consequences in UPEC infected cells, we extracted RNA from intracellularly infected urothelial cells and profiled a panel of genes involved in metabolism and cellular stress response. In agreement with immunoblot data, gene set enrichment analyses reveal that intracellularly infected urothelial cells have elevated abundance of hypoxia and glycolysis related transcripts, including canonical HIF-1 targets (Figure 5b–d and Supplementary Table 2a–c). Specifically, intracellularly infected cells have increased abundance of transcript encoding 3 glucose transporters, 9 glycolytic enzymes, lactate dehydrogenase, and two lactate exporters (Figure 5e, Extended Data Figure 7, and Supplementary Table 2a–c). We additionally observe decreased abundance of transcript encoding the mitochondrial pyruvate importers MPC1 and MPC2 as well as increased abundance of transcript encoding PDK1 – a kinase that inactivates pyruvate dehydrogenase and antagonizes oxidative phosphorylation (Figure 5e and Extended Data Figure 7).
To define the contribution of cytochrome bd in the transcriptional changes observed in infected urothelial cells, we also analyzed urothelial transcripts in cells infected with ∆cydAB. These experiments showed that intracellular infection with either wild-type or ∆cydAB similarly increases the expression of pathways involved in the canonical urothelial cell response to infection – including NF-κB signaling, TLR signaling, and cytokine and chemokine signaling – suggesting infection with either strain elicits a similar acute immune response (Extended Data Figure 8 and Supplementary Table 2a–c)27. By contrast, deletion of cytochrome bd partially abrogates the increased expression of HIF-1 regulated metabolic genes and decreases the extracellular acidification rate (ECAR) of intracellularly infected cells – a proxy for lactate secretion – demonstrating intracellular bacterial respiration is necessary for this metabolic shift (Figure 5f–j and Supplementary Table 2a–c). Intriguingly, although both cytochromes bd and bo contribute to intracellular bacterial respiration (Figure 3 and Extended Data Figure 6), the basal ECAR of ∆appBC∆cyoAB infected cells is similar to wild-type infected cells, indicating oxygen scavenging by cytochrome bd is primarily responsible for alterations in urothelial cell metabolism (Figure 5j).
Bacterial respiration modulates urothelial cell survival
Although HIF-1 canonically regulates central metabolism, this transcription factor is a pleiotropic regulator of cellular physiology34. Previous work demonstrates that HIF-1 activation and shifts toward aerobic glycolysis antagonize pro-apoptotic proteins and delay the onset of apoptosis in cancer and immune cells34,35. Therefore, we hypothesized that HIF-1 dependent metabolic changes induced by intracellular infection would impede apoptosis, delay exfoliation of urothelial cells, and allow bacteria sufficient time to complete their intracellular lifecycle. Supporting this hypothesis, previous work reveals that UPEC induces caspase-dependent urothelial cell apoptosis during bladder infection, and that chemically inhibiting apoptosis through pan-caspase inhibitors increases bacterial colonization in a murine model of urinary tract infection20,36,37.
To test the hypothesis that intracellular infection antagonizes apoptosis, urothelial cells were intracellularly infected with GFP-labelled UPEC, stained with the apoptosis marker annexin V, and analyzed by flow cytometry (Figure 6a–c and Extended Data Figure 9). Strikingly, intracellularly infected cells (GFPhigh) are approximately five-fold less likely to undergo apoptosis (annexin Vhigh) than uninfected cells in the same well (odds ratio 0.19; p < 0.0001) (Figure 6a–c). We observe similar patterns of caspase-3 activity in these subpopulations, with intracellularly infected cells being less likely to have high caspase-3 activity than their uninfected counterparts (odds ratio 0.23; p < 0.0001) (Figure 6d–f). Urothelial cells infected with ∆cydAB are more likely to have high annexin V staining than cells infected with wild-type UPEC (odds ratio 1.24, p < 0.0001), indicating intracellular infection antagonizes urothelial cell apoptosis in a respiration-dependent manner.
Figure 6: Rewiring of host metabolism modulates urothelial cell survival during intracellular infection.
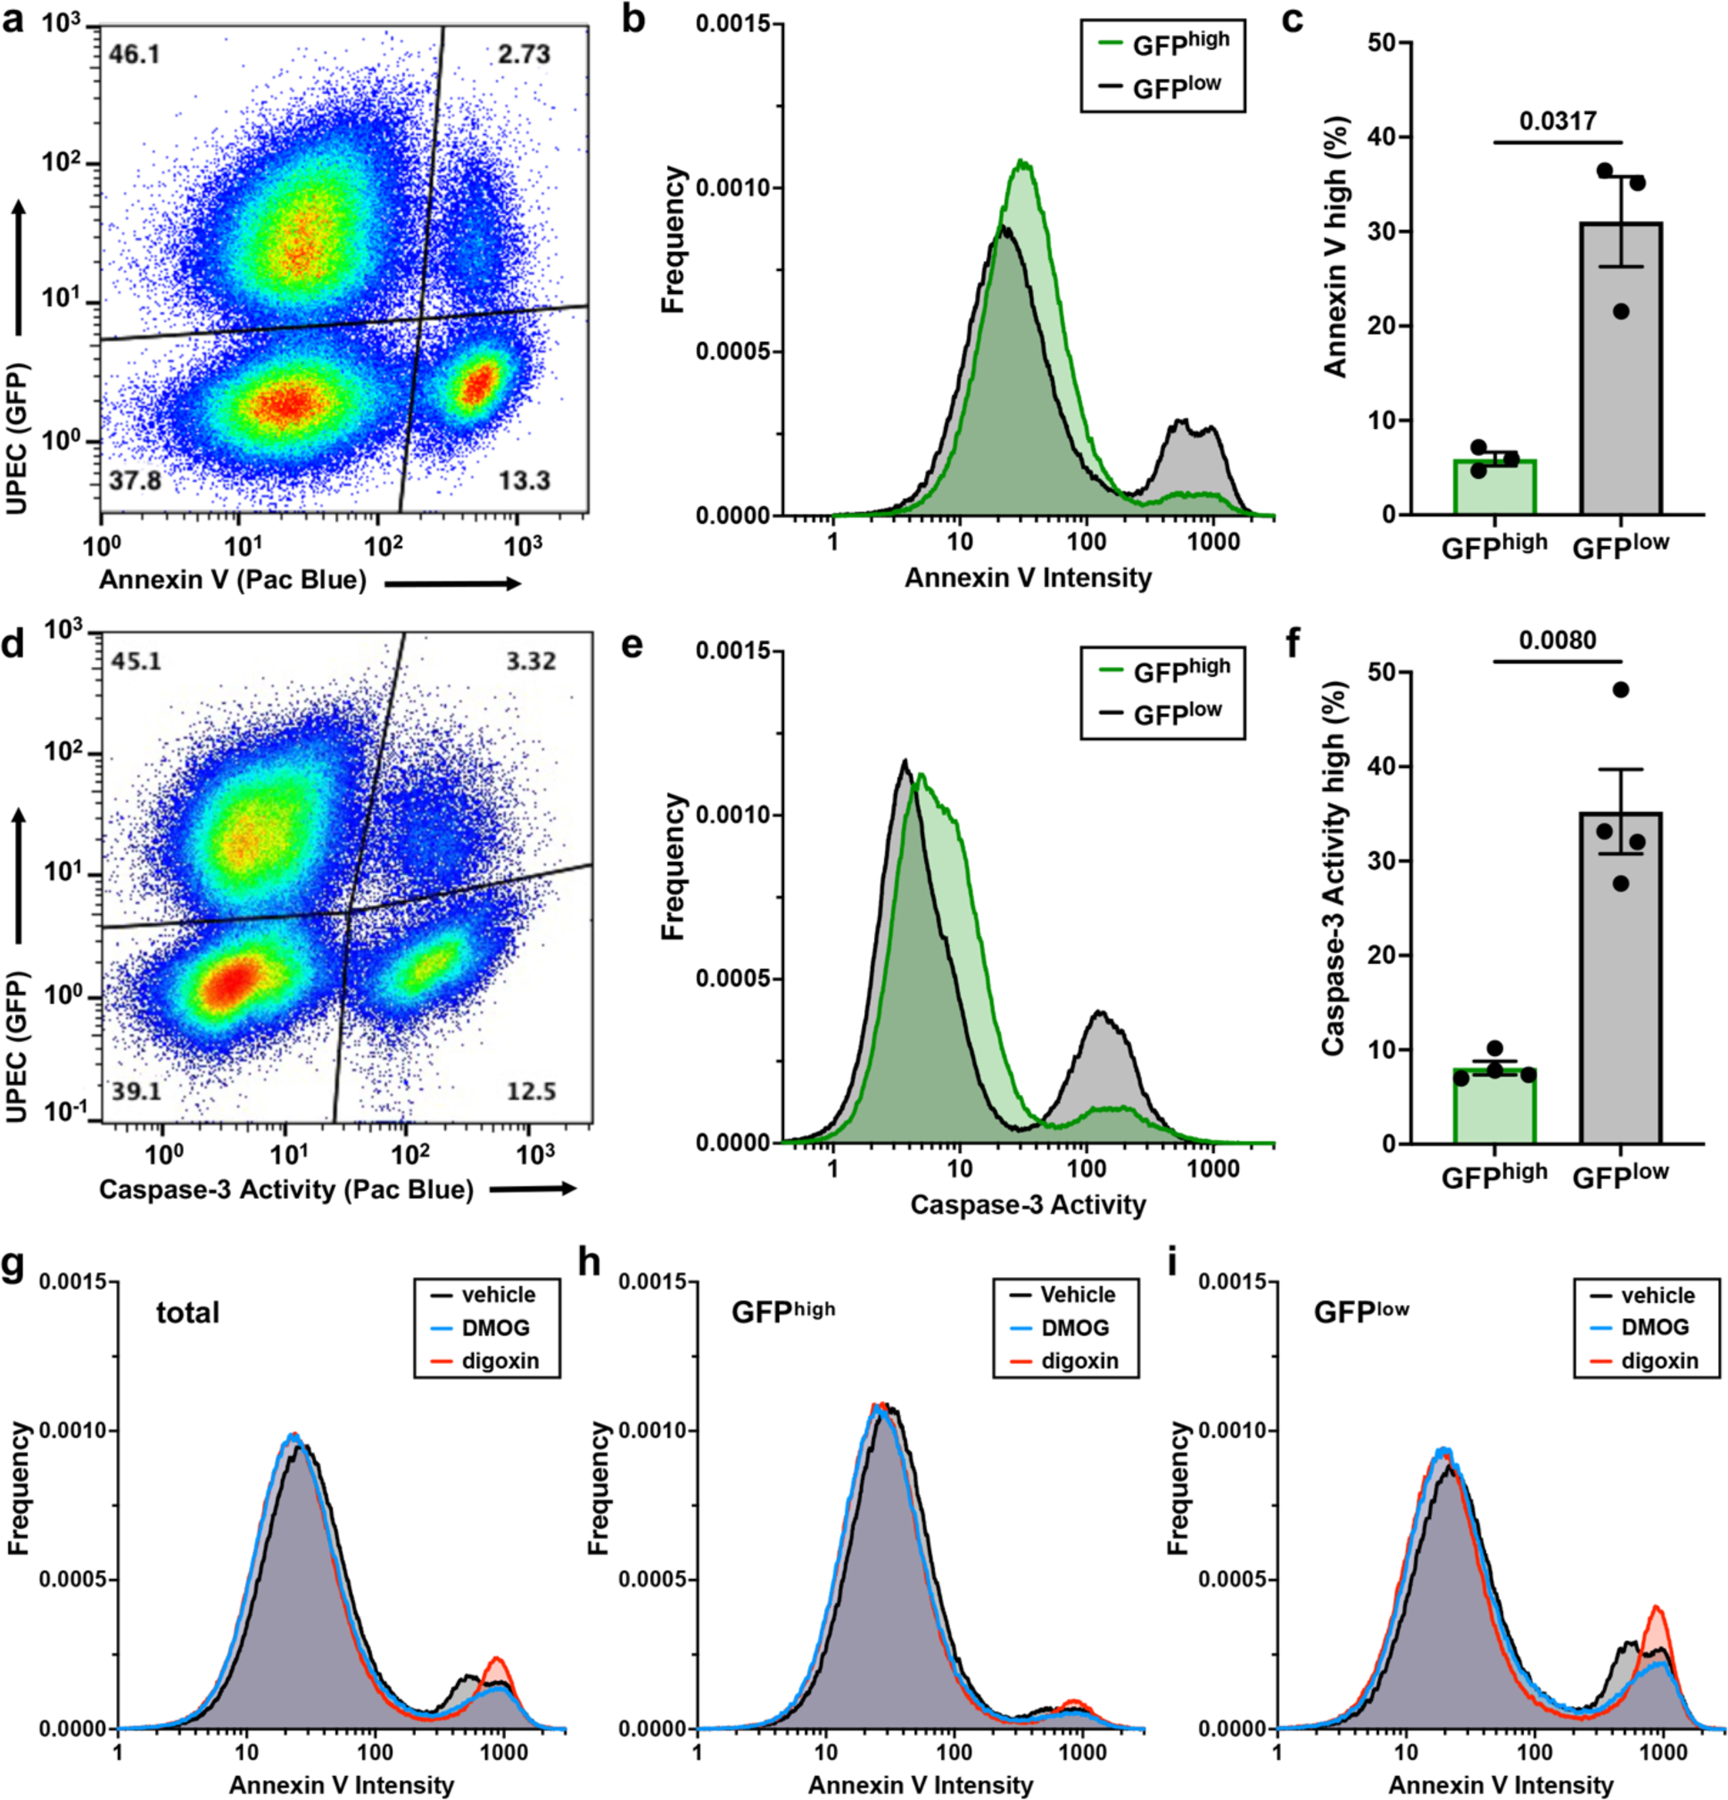
a, Representative flow cytometry plot depicting annexin V staining in intracellularly infected (GFPhigh) and uninfected (GFPlow) urothelial cells. b, Histogram depicting annexin V staining intensity. c, Plot depicting the proportion of urothelial cells with high annexin V staining; mean ± SEM; two-tailed Welch’s t test. d, Representative flow cytometry plot depicting caspase-3 activity in intracellularly infected (GFPhigh) and uninfected (GFPlow) urothelial cells. e, Histogram depicting caspase-3 activity. f, Plot depicting the proportion of urothelial cells with high caspase-3 activity; mean ± SEM; two-tailed Welch’s t test. g-i, Histograms depicting annexin V staining intensity in all urothelial cells (g), intracellularly infected (GFPhigh) urothelial cells (h), and uninfected (GFPlow) urothelial cells (i) treated with digoxin, DMOG, or vehicle at the time of infection. In (a) and (d) each dot represents one cell, and relative population density is represented by a color spectrum (red indicates regions of high cell density, blue indicates regions of low cell density). All experiments were performed with a minimum of three biological replicates. Exact p-values are provided in the figure, with bold values indicating statistical significance (p < 0.05).
To determine whether HIF-1 dependent metabolic changes influence urothelial cell fate during intracellular infection, we treated urothelial cells with dimethyloxalylglycine (DMOG) or digoxin to pharmacologically modulate HIF-1. Treatment with DMOG, a prolyl hydroxylase inhibitor that post-translationally stabilizes HIF-1α, reduces the number of apoptotic cells (odds ratio 0.62, p < 0.0001), in agreement with work demonstrating stabilization of HIF-1 has cytoprotective effects during urinary tract infection (Figure 6g–i)38. By contrast, treatment with digoxin, a potent inhibitor of HIF1A translation, increases annexin V staining intensity without increasing the number of apoptotic cells (mean staining intensity of GFPhigh/annexinhigh cells: 586 and 821 relative fluorescence units for vehicle and digoxin treated, respectively), suggesting inhibition of HIF-1 signaling accelerates the induction of apoptosis (Figure 6g–i). These data collectively indicate intracellular infection antagonizes urothelial cell apoptosis and identify HIF-1 as a regulator of urothelial cell fate during bladder infection.
DISCUSSION
Although the need for aerobic metabolism during urinary tract infection is well established, it has remained unclear how and why UPEC deploys aerobic respiratory enzymes during infection10,12,39. In this work, we determine that UPEC uses the high affinity oxidase cytochrome bd to support bladder pathogenesis in a niche dependent manner, and that aerobic respiration supports UPEC replication during intracellular infection. Intracellular bacterial respiration rewires host cell metabolism, thereby protecting intracellular bacteria from urothelial cell exfoliation and preserving their replicative niche. We propose that although bladder infection induces a robust inflammatory response that initiates exfoliation of urothelial cells and limits bacterial proliferation20,36,37, intracellular infection antagonizes urothelial cell apoptosis by rewiring host cell metabolism (Extended Data Figure 10). This bifurcation of urothelial cell fate allows UPEC to complete its intracellular pathogenic cascade while simultaneously exposing underlying bladder tissue layers for subsequent rounds of infection and facilitating bacterial persistence in the bladder. These results define the role of aerobic respiration in UPEC pathogenesis and expand our understanding of the metabolic requirements of intracellular bacteria.
This study identifies several bacterial and host pathways that could be manipulated to impede bacterial virulence in the bladder. The centrality of cytochrome bd to UPEC bladder pathogenesis identifies this complex as a target for the development of antimicrobial agents to aid in the treatment of urinary tract infections. Importantly, deletion of cytochrome bd rewires bacterial metabolism in a non-lethal manner, suggesting inhibition of cytochrome bd would impede UPEC virulence in the bladder without influencing its ability to survive as a commensal in the anaerobic gut12,13,39,40. In addition to targeting bacterial metabolism, these results suggest that host metabolic and cell death pathways are viable targets for therapeutic intervention. We anticipate that pharmacologic modulation of HIF-1 activity, glucose import, or urothelial cell apoptosis – for example through use of prolyl hydroxylase inhibitors, gliflozins, and Bcl-2 inhibitors – would directly modulate bacterial colonization of the bladder and influence the formation of persistent reservoirs in the bladder.
METHODS
Strains, constructs, and growth conditions
All studies were performed in uropathogenic Escherichia coli cystitis isolate UTI89 and isogenic derivatives created using the λ–Red recombinase system41. Cell culture infections were performed using 5637 human transitional bladder epithelial cells (ATCC HTB-9), hereafter referred to as urothelial cells. Mouse infections were performed using female C3H/HeN mice (Envigo). Genetically manipulated strains, complementation constructs, plasmids, primers, and probes are listed in Supplementary Table 3a–b. Concentrations of nucleic acids and optical density at 600nm (OD600) were measured using a NanoDrop 2000c (ThermoFisher). DNA gels were imaged using Image Lab (BioRad). Bacterial cultures were propagated overnight in shaking lysogeny broth (LB) at 37°C unless otherwise noted. For mouse and cell culture infections, bacterial cultures were grown in 10 mL static LB for 24 hours at 37°C, sub-cultured 1:1,000 into 10 mL fresh LB, and grown statically for another 24 hours. Cultures were normalized to OD600 = 3.4 in PBS and diluted 1:10 in PBS prior to infection. Urothelial cells were propagated and infected in RPMI 1640 (Gibco) supplemented with 10% fetal bovine serum (FBS) (Gibco) and incubated at 37°C in 5% CO2 unless otherwise noted.
Mouse infections
All animal studies conform to regulatory standards and were approved by the Vanderbilt University Medical Center Institutional Animal Care and Use Committee (IACUC) (protocol: M1500017). Mouse infections were performed as described previously42. 6- to 7-week-old female C3H/HeN mice (Envigo) were transurethrally inoculated with 107 colony forming units (CFUs) of UPEC in 50 μL PBS. Mice were randomly allocated to experimental groups at the time of infection. At pre-determined time points, mice were sacrificed, and organs were harvested into ice-cold, sterile PBS. To quantify total CFU per organ, organs were homogenized using an Omni tissue homogenizer and the lysate was serially diluted. To quantify intracellular CFUs, bladders were washed in PBS and treated with 100 μg/mL gentamicin in PBS for 90 minutes. After gentamicin treatment bladders were washed in PBS, homogenized, serially diluted, and plated to quantify CFUs. For confocal laser scanning microscopy, bladders were stretched in PBS and fixed overnight at 4°C in 3.2% paraformaldehyde. After fixation, bladders were washed in PBS, counter stained with Alexa Fluor 647 Phalloidin (ThermoFisher), and mounted with ProLong Diamond Antifade (ThermoFisher). Microscopy was performed on a Zeiss LSM 710 Confocal Microscope using Zen blue edition software (Zeiss). IBCs were enumerated by manual counting using fluorescence microscopy and analyzed using BiofilmQ (v0.2.2)43. Z-stacks were loaded into BiofilmQ, and intensity was normalized for each Z-stack analyzed. Global parameters of each IBCs were analyzed using default settings.
Cell culture infections
HTB-9 urothelial cells were propagated and infected in RPMI (Gibco) supplemented with 10% fetal bovine serum (Gibco), as described previously4. Bacteria were added to urothelial cell monolayers at a multiplicity of infection (MOI) of 5–10, centrifuged at 600 x g for 5 minutes to facilitate and synchronize attachment, and incubated for two hours at 37°C in 5% CO2. For intracellular infections, monolayers were washed thoroughly with PBS, and fresh RPMI containing 100 μg/mL gentamicin (Gibco) was added to each well to kill extracellular bacteria. Monolayers were incubated another two hours and washed with PBS prior to endpoint experiments. To determine sensitivity of intracellular bacteria to antibiotics, urothelial cells were treated with RPMI containing 100 μg/mL gentamicin and either ciprofloxacin in water (2 μg/mL), nitrofurantoin in DMSO (50 μg/mL), or vehicle. To quantify total CFUs, monolayers were lysed with 0.1% Triton X-100 (Fisher) and serially diluted. To quantify adherent CFUs, monolayers were washed three times in PBS to remove extracellular bacteria, lysed with 0.1% Triton X-100, and serially diluted. To quantify intracellular CFUs, monolayers were washed three times in PBS, and PBS containing 100 μg/mL gentamicin was added to each well to kill extracellular bacteria. After another 2 hours of incubation, monolayers were washed three times in PBS, lysed with 0.1% Triton X-100, and serially diluted.
Hemagglutination assays
Elaboration of type 1 pili was determined using mannose sensitive hemagglutination assays. Cultures were grown statically at 37°C for 24 hours in LB, sub-cultured 1:1,000 and grown another 24 hours statically at 37°C. Cultures were normalized to OD600 = 1.0 in PBS, concentrated 10x, and resuspended in PBS or PBS with 4% mannose to competitively bind the type 1 pilus adhesin FimH. Concentrated culture was added to a 96 well plate and diluted in two-fold increments. Next, guinea pig erythrocytes (Biolink Life Sciences) were washed in PBS and suspended in PBS or PBS with 4% mannose. Normalized erythrocytes were added to diluted bacterial culture and incubated statically overnight at 4°C. Hemagglutination titer was determined by measuring the lowest dilution that visibly inhibited hemagglutination.
Immunoblots
For FimA immunoblots, bacterial cultures were grown statically at 37°C for 24 hours in LB, sub-cultured 1:1,000, grown another 24 hours statically at 37°C, and normalized to OD600 = 1.0. Samples were boiled in SDS or boiled in acidified SDS to depolymerize FimA subunits. After transfer, membranes were stained with Ponceau S to ensure similar loading, blocked in 1% BSA 1% milk in TBST, and blotted with 1:5,000 rabbit FimA antisera overnight at 4°C. Membranes were then treated with 1:10,000 goat anti-rabbit IgG HRP conjugate (Promega) and developed using SuperSignal West Chemiluminescent Substrate (Thermo Scientific). Densitometric quantification of FimA band intensity was performed by comparing the band of each sample to the wild-type control lane on the same gel (at least five independent samples across four gels). For HIF-1α immunoblots, urothelial cells were intracellularly infected or mock infected as described above and transferred to 4% oxygen to increase HIF-1α abundance. Cells lysed in RIPA buffer (Sigma) containing 0.2 μM PMSF and 50 μg total protein was loaded per sample. Membranes were blocked in 5% milk-TBST, blotted with 1:1,000 anti-HIF-1α (Cell Signaling Technologies; Rabbit mAb 14179) or 1:1,000 anti-β-tubulin (Cell Signaling Technologies; Rabbit mAb 2128) in 5% BSA-TBST with 0.02% sodium azide overnight at 4°C, and treated with 1:5,000 goat anti-rabbit IgG HRP conjugate (Promega) in 5% milk-TBST. Because the HIF-1α antibody exhibits cross-reactivity, a set of cells was treated with the HIF-1 stabilizing agent DMOG to identify the correct band. Membranes were stained with Ponceau S to ensure similar transfer and developed using SuperSignal West Chemiluminescent Substrate (ThermoFisher). Protein levels were calculated by normalizing HIF-1α band density to β-tubulin band density on imageJ and statistically compared with an unpaired t test.
Quantitative PCR
RNA was extracted using TRIzol Reagent (Invitrogen) according to manufacturer’s protocols. 20 μg nuclease free glycogen (Sigma) was added to facilitate RNA precipitation. RNA was DNase treated using Turbo DNase I (Invitrogen), and reverse transcribed using SuperScript III Reverse Transcriptase (Invitrogen). cDNA was amplified in an Applied Biosystems StepOne Plus Real-Time PCR machine using TaqMan reagents. Relative fold difference in transcript abundance was determined using the ΔΔCT method44. Transcripts were normalized to gyrB abundance. For ori:ter qPCR, genomic DNA (gDNA) was isolated and treated with RNAse A using the Wizard Genomic DNA Purification Kit (Promega) following manufacturer’s protocols. qPCR was performed using SYBR Green (Applied Biosystems), and the ori:ter ratio was calculated by comparing the abundance of origin of replication and terminus sequences to gDNA extracted from late stationary phase bacteria (expected ori:ter ratio = 1) using the ΔΔCT method21,44. All qPCR experiments were performed using cDNA or gDNA from at least three biological replicates. Each reaction was performed in technical triplicate at two different cDNA or gDNA concentrations. All primers and probes were validated in previous studies and are listed in Supplementary Table 3a–b.
Modeling of CydA
A full-length model of CydA was generated using Rosetta (v3.12)45. The RosettaCM – Comparative Modeling protocol was followed as described46 using the CydA FASTA sequence NCBI NP_415261.2 and templates PDB ID: 6rko and PDB ID: 6rx4. A transmembrane span file was generated using the RosettaMP application Span From PDB (MPSpanFromPDB) for PDB ID 6rko47,48. The final model with the lowest score out of 1,000 was selected and used as the input for subsequent stability calculations and amino acid conservation analysis. Heme groups were manually added to the full-length model generated by RosettaCM for representative purposes. To do so, the full-length model was overlayed with a published cryo-EM structure (PDB ID: 6rko) using the ChimeraX (v1.2) MatchMaker tool and atom coordinates of 6rko were saved relative to the full-length model. Coordinates for the heme groups were then copied from 6rko into the full-length model. From MatchMaker, the root mean square deviation (RMSD) across all atom pairs was 1.128 Å.
Amino acid conservation analysis
CydA amino acid evolutionary sequence conservation was analyzed using ConSurf49–51 and mapped onto the full-length model of CydA. Homolog search was performed using the HHMER algorithm and the UNIREF-90 database. 500 homologs with 50–99% sequence identity were automatically selected and aligned using the MAFFT-L-INS-I method. Conservation scores were calculated using a Bayesian method with the best fit evolutionary model (LG). Final graphical representations and images were generated using PyMOL Molecular Graphics System (v2.0.7; Schrödinger, LLC).
Stability Calculations of CydA_K252A
The free energy change of the CydA_K252A variant compared to wild-type CydA was modeled using Rosetta (version 2021.38)45. The Cartesian ∆∆G protocol was followed as described52,53 using the full-length model of CydA as the input, including all-atom refinement using the Rosetta Relax application54–57 and using the mpframework_smooth_fa_2012_cart weights for membrane proteins47. The relaxed model with the lowest score out of 100 was selected and the Rosetta energy change (∆∆G) was then calculated as the average score difference between three iterations of CydA_K252A and wild-type models: ΔΔG = ∆GK252A − ∆GWT. The final ∆∆G value was reported for the CydA_K252A variant in Rosetta energy units (REU). A mutation is classified as stabilizing if the change in free energy is ≤ −1, as destabilizing if the change is ≥ 1, and neutral if it falls between these values, with larger absolute values predicted to be more significant.
Analysis of flagellar motility
Flagellar motility was assessed by stabbing overnight cultures into 0.25% LB agar supplemented with 0.001% triphenyl tetrazolium chloride (TTC) and 100 μg/mL ampicillin. Plates were incubated for 7 hours at 37°C, and flagellar motility was quantified by measuring the diameter of motility front. To analyze expression of the flagellar master regulator FlhDC, UTI89 and ∆cydAB were transformed with a FlhDC transcriptional reporter (PflhDC::GFP), grown to mid-logarithmic phase, and imaged using confocal laser scanning microscopy. Expression of flhDC was determined by measuring GFP intensity on imageJ and normalizing to cell area. To visualize flagella, cells were extracted from 11-day old colony biofilms grown on 1.2X yeast extract casamino acids (YESCA) agar and normalized in PBS. Bacterial samples were fixed with 1% glutaraldehyde (Electron Microscopy Sciences) and allowed to absorb onto freshly glow discharged formvar/carbon-coated copper grids for 10 minutes. Grids were then washed in dH2O and stained with 1% aqueous uranyl acetate (Ted Pella Inc.) for one minute. Excess liquid was gently wicked off and grids were allowed to air dry. Samples were viewed on a JEOL 1200EX transmission electron microscope (JEOL USA) equipped with an AMT 8-megapixel digital camera (Advanced Microscopy Techniques).
Nitric oxide growth inhibition assay
Overnight cultures were diluted to OD600 = 0.05 in LB containing 100 μg/mL ampicillin. After two hours of growth, cultures were split into two flasks. One flask was treated with 0.5 mM nitric oxide donor NOC-12, and the other flask was treated with 0.1 M NaOH vehicle. OD was measured every hour for 8 hours. Data were fit to the Gompertz growth equation (R2 > 0.99 for all replicates) on GraphPad Prism, and growth inhibition was calculated by quantifying the percent change in growth rate constant (k) in NOC-12 and vehicle treated controls.
PNA-FISH
Peptide nucleic acid in situ hybridization (PNA-FISH) experiments were performed as described previously12. Infected bladders were harvested six hours post-infection, stretched in PBS, and fixed in 3.2% paraformaldehyde at 4°C overnight42. Bladders were washed in PBS and treated with PNA-FISH probes complementary to RNA encoding cydA (cytochrome bd), cyoA (cytochrome bo), and rrsH (16S rRNA) in hybridization solution for 60 minutes at 60°C. After hybridization, bladders were washed in 60°C wash solution for 30 minutes, mounted in ProLong Diamond (Invitrogen), and imaged by confocal laser scanning microscopy. Pearson correlation between 16S rRNA, cydA, and cyoA staining intensity was determined using the Coloc2 plug-in on FIJI with default settings. Wash solution: 5 mM Tris-HCl (pH 7.4), 15 mM NaCl, and 1% Triton X-100. Hybridization solution: 10% (w/v) dextran sulfate, 30% formamide, 50 mM Tris-HCl (pH 7.4), 10 mM NaCl, 5 mM EDTA, 0.1% Triton X-100, 200 nM each PNA-FISH probe.
Extracellular flux assays
Extracellular flux assays were performed using an Agilent Seahorse XFe96 Analyzer with the Mito Stress Test kit (Agilent). HTB-9 urothelial cells were grown to confluency in an Agilent Seahorse XF96 cell culture microplate and infected at an MOI of 5–10 as described above. Cultures were incubated at 37°C in 5% CO2 for 2 hours, washed in PBS, and the media was replaced with Seahorse XF RPMI (Agilent) containing 100 μg/μL gentamicin, 10 mM glucose, 2 mM glutamine, and 1 mM pyruvate. After changing the media, cells were incubated for one hour in 5% CO2 and transferred to a non-CO2 incubator for one hour. Cells were treated with oligomycin (1.5 μM), FCCP (0.5 μM), and rotenone/antimycin A (0.5 μM). Raw OCR and ECAR values were normalized using Seahorse Wave software (Agilent) to the number of eukaryotic cells per well as determined by a Cytation 5 imaging reader (BioTek). Bacterial extracellular flux assays were adapted from previous reports58. Agilent Seahorse XF96 cell culture microplates were coated in 15 μL 1 mg/mL poly-D-lysine (Sigma) in 100 mM Tris HCl pH 8.4. After overnight drying, plates were washed twice in sterile water. To assess the impact of mitochondrial targeting drugs on bacterial OCR, cultures were grown to mid-logarithmic phase in Seahorse XF RPMI (Agilent) containing 10 mM glucose, 2 mM glutamine, and 1 mM pyruvate. 107 CFU were added to each well, and attachment was facilitated by centrifugation at 4,000 x g for 10 minutes. Bacteria were treated with oligomycin (1.5 μM), FCCP (0.5 μM), and rotenone/antimycin A (0.5 μM) or mock treated with vehicle. Parameter calculation was performed using Seahorse Analytics software (Agilent).
Mitochondrial imaging and analysis
Urothelial cells were intracellularly infected at an MOI 5–10 or mock infected as described above. Cells were washed in PBS and fixed in 4% paraformaldehyde for 20 minutes at room temperature followed by permeabilization in 1% Triton-X-100 for 5 minutes at room temperature. After blocking in 10% BSA, immunostaining was performed with anti-HSP60 (1:200; Cell Signaling Technologies; 12165S) and anti-rabbit IgG Alexa Fluor 546 (1:500; Thermo Fisher Scientific; A10040). Super-resolution mitochondrial images were acquired using a Nikon SIM microscope equipped with a 1.49 NA 100x Oil objective and Andor DU-897 EMCCD camera. Quantification of mitochondrial morphology was performed in NIS-Elements (Nikon) as described previously59. Mitochondria were segmented in 3D and skeletonized using the resulting binary 3D mask. All mitochondria within each cell were averaged resulting in one data point per cell. Acquisition and analysis of mitochondrial imaging data was performed by a blinded experimenter.
Transcriptional profiling
RNA was extracted was intracellularly infected urothelial cells using TRIzol Reagent (Invitrogen) according to manufacturer’s protocols. 20 μg nuclease free glycogen (Sigma) was added to facilitate RNA precipitation. 100 ng purified RNA (20 ng/μL) was hybridized for 20 hours and analyzed using the nCounter Human Metabolic Pathways Panel (NanoString Technologies) according to manufacturer’s protocols. RNA was analyzed from at least three biological replicates per condition. Raw data were normalized and subjected to background thresholding using default settings. Normalized data were analyzed using the nCounter Advanced Analysis platform (v2.0.134) plugin for nSolver using default settings (Benjamini-Yekutieli method). Gene set enrichment analysis were performed as described previously60. Raw NanoString read counts were normalized using the nSolver Analysis Software (v4.0) and used as input expression files. Data were annotated using the Human Gene Symbol with Remapping MSigDB (v7.4) Chip platform and analyzed under default settings using the HALLMARK_GLYCOLYSIS, HALLMARK_HYPOXIA, or SEMENZA_HIF1_TARGETS gene sets obtained from the Broad Institute Molecular Signatures Database (v7.4).
Flow Cytometry
Urothelial cells were intracellularly infected with UTI89 pCOM::GFP or ∆cydAB pCOM::GFP at an MOI 5–10 as described above. For annexin V experiments, urothelial cells were treated with 100 μM dimethyloxalylglycine (DMOG; Sigma), 100 nM digoxin (Sigma), or DMSO vehicle at the time of infection. Infected monolayers were washed in PBS and homogenized with 0.25% Trypsin-EDTA (Gibco). Single cell suspensions were sedimented, washed in cold PBS, sedimented, and stained with Annexin V Pacific Blue (Thermo Fisher) in annexin binding buffer for 15 minutes according to manufacturer’s protocols. For caspase-3 activity experiments, urothelial cells were infected, homogenized, and washed as described above. Next, cells were treated with 5μM BioTracker NucView 405 Blue Caspase-3 Dye (Millipore Sigma) for 30 minutes at room temperature according to manufacturer’s protocols. This dye is non-fluorescent but becomes fluorescent after cleavage by activated caspase-3. Cells were analyzed using a MACSQuant 10 Analyzer (Miltenyi Biotec). The number of cells analyzed per replicate can be found in the source data. Data analysis was performed in FlowJo (v10.0.7r2 and v10.8.1). For presentation purposes, histograms were smoothed to the 25 nearest neighbors using GraphPad Prism. Gating strategy is depicting in Extended Data Figure 9.
Statistical analyses
Statistical analyses were performed in GraphPad Prism. Power analyses were performed to determine group size for mouse infection and extracellular flux assays using the ClinCalc browser-based calculator. For mouse infections, power analyses indicate a group size of at least seven is sufficient to detect a 25 percent difference in mean CFU between test groups, assuming a standard deviation equal to 20 percent the mean with a power of 90 percent. For extracellular flux assays, power analyses indicate a group size of at least 21 would be sufficient to detect a 10 percent difference in mean between test groups, assuming a standard deviation equal to 10 percent the mean with a power of 90 percent. No statistical methods were used to pre-determine sample size in other experiments. In accordance with standard convention, at least three biological replicates were used in all experiments, and more replicates were included where feasible. Odds ratio calculations were performed using the MedCalc browser-based calculator. All statistical tests are two-tailed unless otherwise noted. Details of group size, test used, error bars, and statistical significance cutoffs are presented in figure legends, source data, and the text.
Extended Data
Extended Data Fig. 1. Cytochrome bd does not influence type 1 pilus dependent adherence or invasion of urothelial cells.
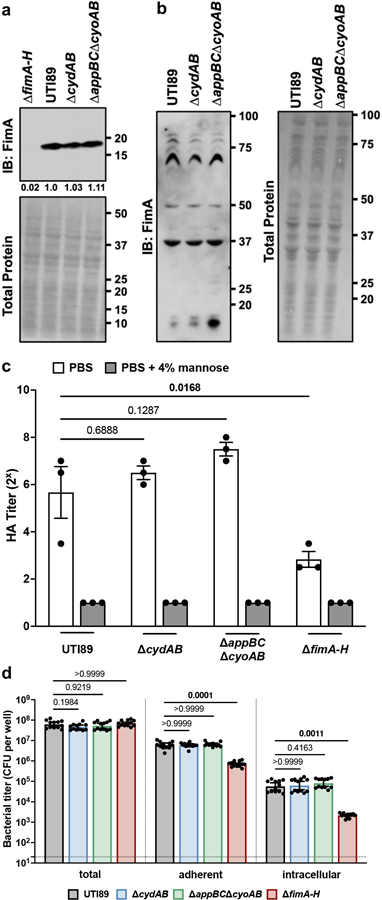
a, Anti-FimA immunoblot performed on normalized samples boiled in acidified SDS to depolymerize type 1 pili. b, Anti-FimA immunoblot performed on normalized samples with polymerized type 1 pili. Each band represents FimA polymers of a different size. c, Bacterial hemagglutination titer with or without the FimH inhibitor mannose; mean ± SEM; one-way ANOVA with Dunnett’s test for multiple comparisons. d, Total, adherent, and intracellular bacterial titers in infected urothelial cells; geometric mean ± 95% CI; Kruskal-Wallis test with Dunn’s test for multiple comparisons. All experiments were performed with a minimum of three biological replicates. Each point represents a biological replicate. Exact p-values are provided in the figure, with bold values indicating statistical significance (p < 0.05).
Extended Data Fig. 2. Loss of cytochrome bd increases intracellular bacterial sensitivity to nitrofurantoin.
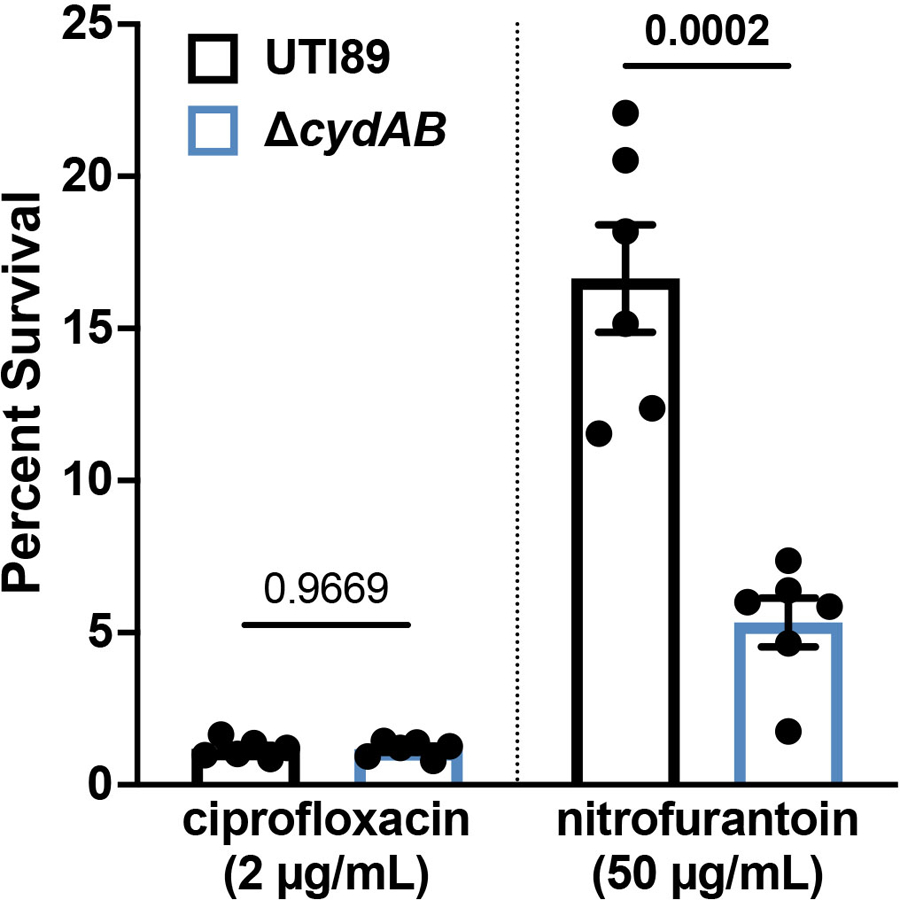
Percent survival of intracellular UPEC treated with ciprofloxacin or nitrofurantoin as compared to vehicle treated controls. Data is representative of six biological replicates per group. Each point represents a biological replicate; mean ± SEM; two-tailed unpaired t test. Exact p-values are provided in the figure, with bold values indicating statistical significance (p < 0.05).
Extended Data Fig. 3. Loss of cytochrome bd does not impair flagellar biosynthesis.
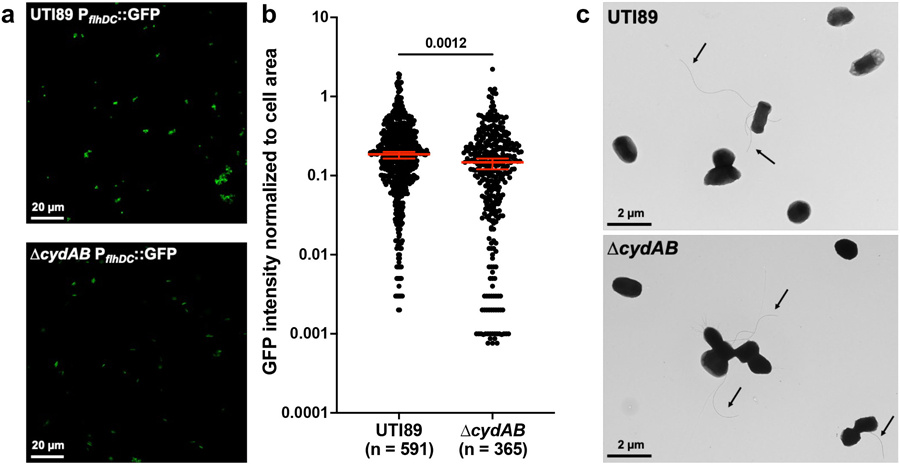
a, Representative images of wild-type and ∆cydAB transformed with a transcriptional reporter for FlhDC, the master regulator of flagellar expression. b, GFP intensity normalized to cell area; median ± 95% CI; two-tailed unpaired t test. c, Representative transmission electron microscopy images of bacterial cells. Arrows indicate flagella. Images are representative of three biological replicates. Exact p-values are provided in the figure, with bold values indicating statistical significance (p < 0.05).
Extended Data Fig. 4. Urothelial cells upregulated NOS2 in response to intracellular infection.
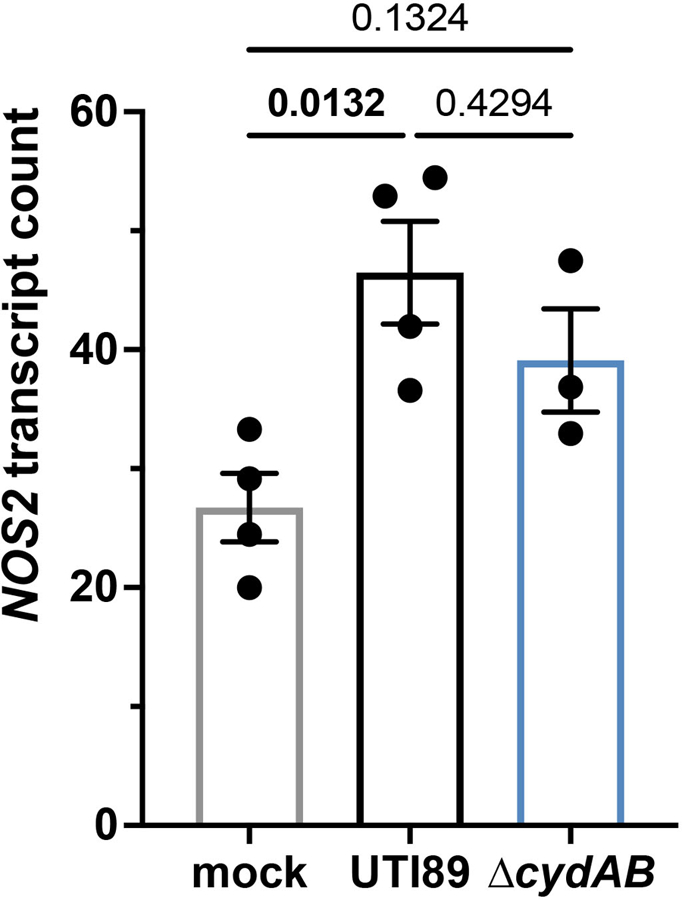
Normalized counts of NOS2 (inducible nitric oxide synthase, iNOS) transcript in intracellularly infected urothelial cells. Data is representative of at least three biological replicates per group; mean ± SEM; one-way ANOVA with Tukey’s test for multiple comparisons. Exact p-values are provided in the figure, with bold values indicating statistical significance (p < 0.05).
Extended Data Fig. 5. UPEC is not sensitive to rotenone or antimycin A.
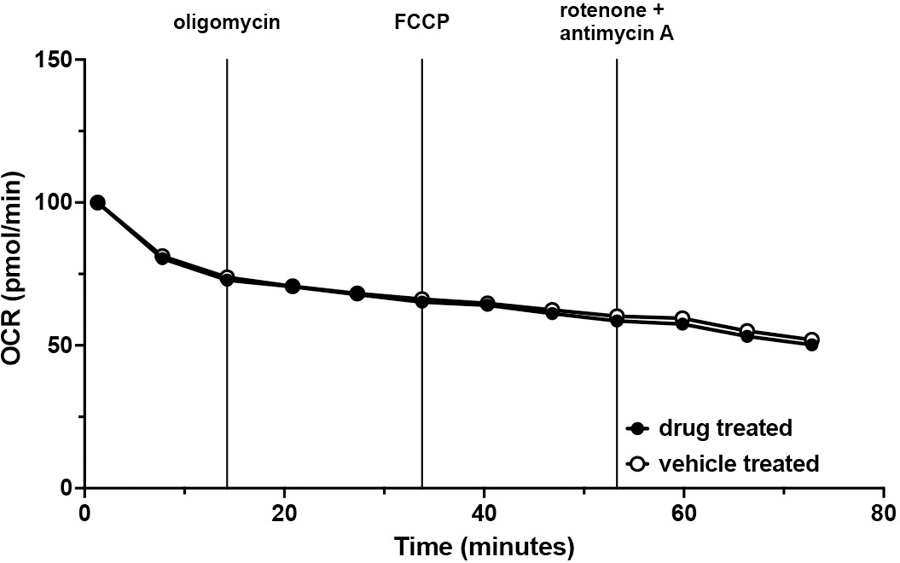
OCR readings of wild-type UPEC treated with vehicle (open circles) or treated with oligomycin, FCCP, and rotenone/antimycin A (closed circles) presented as percent OCR of time = 0; mean ± SEM. Data was fit to a one phase decay model (R2 > 0.9 for both groups) and statistically analyzed by comparing k (p = 0.6402). Data is representative of five biological replicates, each with at least three technical replicates.
Extended Data Fig. 6. Expression of respiratory oxidases in intracellular bacterial populations.

a, Abundance of respiratory oxidase transcripts in the inoculum used for infections and intracellular bacterial populations compared to gyrB. Dotted line indicates gyrB abundance; mean ± SEM; two-tailed unpaired t test. b, Relative abundance of respiratory oxidase transcript in the inoculum and intracellular populations. c, Representative peptide nucleic acid in situ hybridization (PNA-FISH) image of IBCs. All experiments were performed with a minimum of three biological replicates. Each point represents a biological replicate. Exact p-values are provided in the figure, with bold values indicating statistical significance (p < 0.05).
Extended Data Fig. 7. Intracellular infection modulates urothelial cell transcriptional programs.
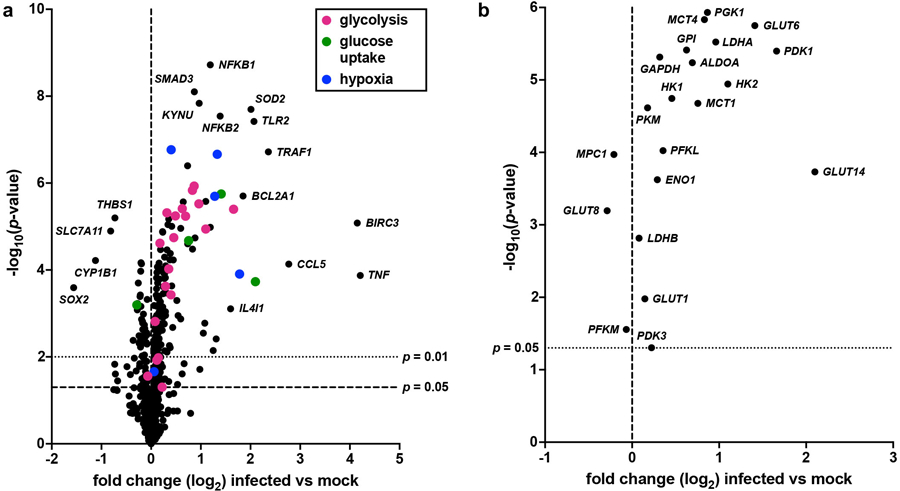
a, Volcano plot depicting changes in transcript abundance between wild-type and mock infected urothelial cells. Transcripts involved in glycolysis, glucose uptake, and hypoxia are denoted by color. b, Volcano plot depicting changes in the abundance of metabolic transcripts depicted in Figure 5e between wild-type and mock infected urothelial cells. Data is representative of at least three biological replicates per group. Transcript normalization, differential expression calculations, and statistical comparisons were performed on the nSolver Advanced Analysis platform using the Benjamini-Yekutieli method.
Extended Data Fig. 8. Cytochrome bd has minimal impact on urothelial cell immune response to intracellular infection.
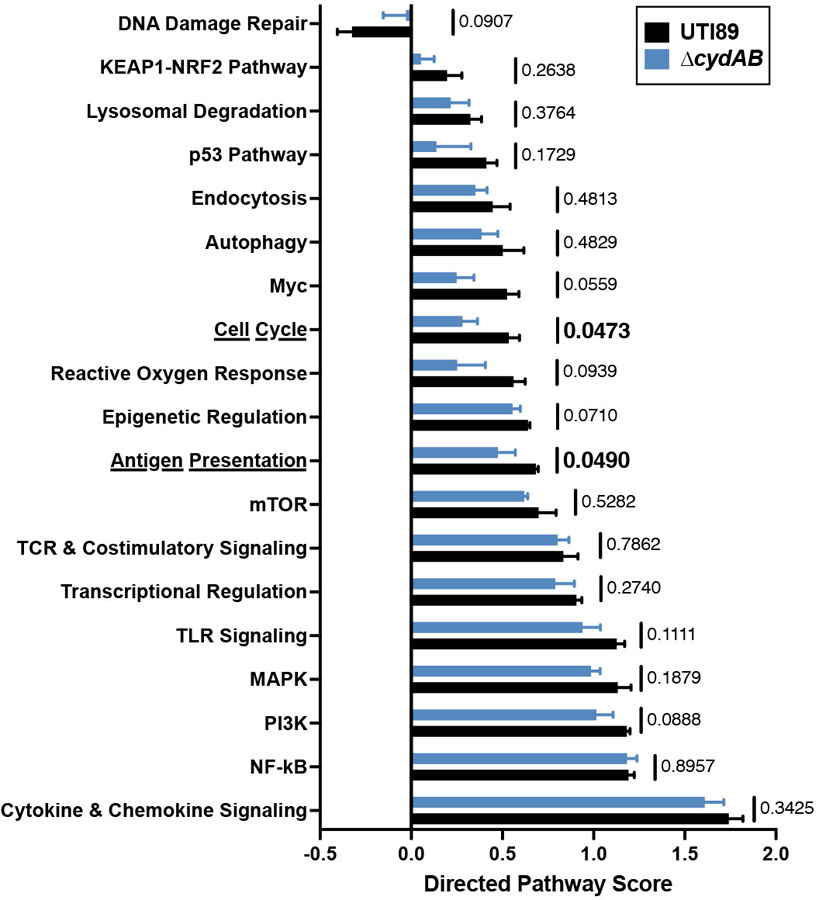
Directed pathway expression score for pathways not directly involved in central metabolism in wild-type and ∆cydAB infected compared to mock infected urothelial cells; mean ± SEM; two-tailed unpaired t test. Data is representative of at least three biological replicates per group. Exact p-values are provided in the figure, with bold values indicating statistical significance (p < 0.05).
Extended Data Fig. 9. Flow cytometry gating strategy.

Single cells were selected by gating on FSC-A and FSC-H. Debris and bacteria were subsequently excluded by gating out the FSC-Alow, SSC-Alow population. The remaining population was analyzed for UPEC (GFP) and annexin V (Pacific Blue) or caspase-3 activity (Pacific Blue). Because we are interested in quantifying cell death, dead cells were not specifically excluded from analyses. Each dot represents one cell. Relative population density is represented by a color spectrum (red indicates regions of high cell density, blue indicates regions of low cell density).
Extended Data Fig. 10. Proposed model.
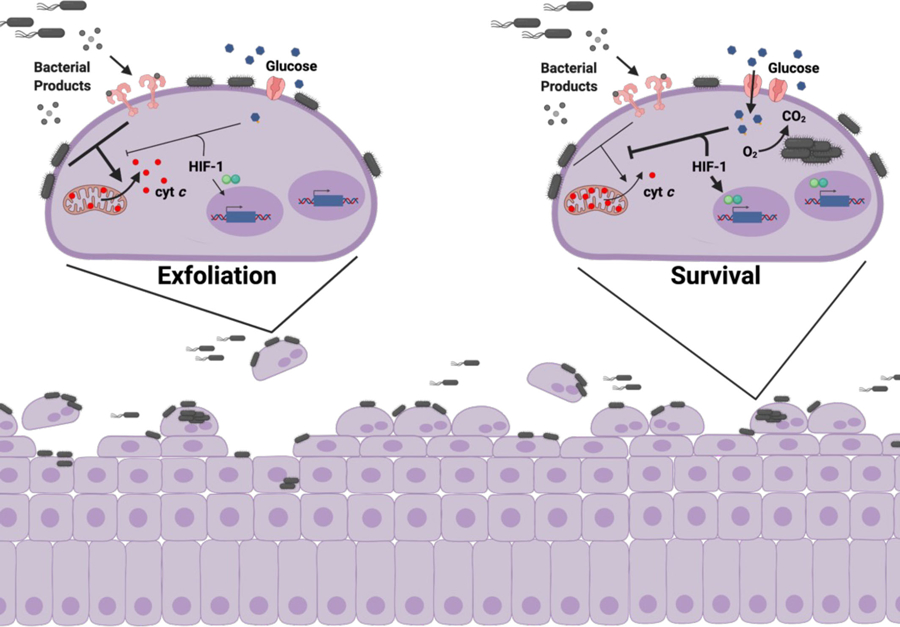
Schematic depicting the proposed model of how intracellular infection modulates urothelial cell metabolism and survival. left, During bladder infection UPEC induces a strong inflammatory response that triggers urothelial cell apoptosis and exfoliation. Urothelial cell exfoliation exposes underlying tissue layers to infection and promotes bacterial persistence in the bladder. right, By consuming oxygen and activating HIF-1 signaling, intracellular bacterial aerobic respiration alters urothelial cell metabolism and antagonizes apoptosis, allowing UPEC to complete its intracellular infection cascade and evade exfoliation.
Supplementary Material
ACKNOWLEDGEMENTS
The authors would like to thank Kelsey Voss and Hope Woods for technical assistance and helpful advice. This work was supported by National Institutes of Health (NIH) grants F30AI150077 (CJB), T32GM007347 (CJB and BIR), F99NS125829 (GLR), F30CA247202 (BIR), F32CA250258 (AMB), T32AI112541 (GHM), T32GM007569 (JRB), R01AI127793 (WJC), R01AI101171 (WJC), R01DK105550 (JCR), R35GM128915 (VG), RF1MH123971 (VG), R01AI107052 (MH), P20DK123967 (MH), and the Howard Hughes Medical Institute Gilliam Fellowship (GLR). Transmission electron microscopy was performed by Wandy Beatty at the Molecular Microbiology Imaging Facility (Washington University in St. Louis). Confocal laser scanning and structured illumination microscopy were performed at the Vanderbilt Cell Imaging Shared Resource, which is supported by NIH grant DK20593. NanoString analysis was performed at the Vanderbilt Technologies for Advanced Genomics core facility, which is supported by NIH grants UL1RR024975, P30CA68485, P30EY08126, and G20RR030956. Access to the Vanderbilt Advanced Computing Center for Research and Education was supported in part by NIH grants S10RR031634 and S10OD023680. Some images were created using BioRender.com.
Footnotes
COMPETING INTERESTS
The authors declare no conflicts of interest at the time of submission of this manuscript.
DATA AVAILABILITY
All data required for evaluation of these results are present in the text, figures, or supplemental material. Transcriptional profiling data has been deposited in the Gene Expression Omnibus (GEO) database (accession: GSE188981) and is also contained in Supplementary Table 2a. Data from the following publicly available databases was used in this study: NCBI Protein Database (FASTA sequence: NP_415261.2) and the RCSB Protein Data Bank (PDB) (PDB IDs: 6rko and 6rx4). Source data is provided in supplemental material.
REFERENCES
- 1.Foxman B The epidemiology of urinary tract infection. Nat Rev Urol 7, 653–660, doi:nrurol.2010.190 [pii] 10.1038/nrurol.2010.190 (2010). [DOI] [PubMed] [Google Scholar]
- 2.Klein RD & Hultgren SJ Urinary tract infections: microbial pathogenesis, host-pathogen interactions and new treatment strategies. Nat Rev Microbiol 18, 211–226, doi: 10.1038/s41579-020-0324-0 (2020). [DOI] [PMC free article] [PubMed] [Google Scholar]
- 3.Flores-Mireles AL, Walker JN, Caparon M & Hultgren SJ Urinary tract infections: epidemiology, mechanisms of infection and treatment options. Nat Rev Microbiol 13, 269–284, doi: 10.1038/nrmicro3432 (2015). [DOI] [PMC free article] [PubMed] [Google Scholar]
- 4.Martinez JJ, Mulvey MA, Schilling JD, Pinkner JS & Hultgren SJ Type 1 pilus-mediated bacterial invasion of bladder epithelial cells. Embo J 19, 2803–2812 (2000). [DOI] [PMC free article] [PubMed] [Google Scholar]
- 5.Mulvey MA, Schilling JD & Hultgren SJ Establishment of a persistent Escherichia coli reservoir during the acute phase of a bladder infection. Infect Immun 69, 4572–4579, doi: 10.1128/IAI.69.7.4572-4579.2001 (2001). [DOI] [PMC free article] [PubMed] [Google Scholar]
- 6.Anderson GG et al. Intracellular bacterial biofilm-like pods in urinary tract infections. Science 301, 105–107, doi: 10.1126/science.1084550 (2003). [DOI] [PubMed] [Google Scholar]
- 7.Reigstad CS, Hultgren SJ & Gordon JI Functional genomic studies of uropathogenic Escherichia coli and host urothelial cells when intracellular bacterial communities are assembled. J Biol Chem 282, 21259–21267 (2007). [DOI] [PubMed] [Google Scholar]
- 8.Conover MS et al. Metabolic Requirements of Escherichia coli in Intracellular Bacterial Communities during Urinary Tract Infection Pathogenesis. mBio 7, e00104–00116, doi: 10.1128/mBio.00104-16 (2016). [DOI] [PMC free article] [PubMed] [Google Scholar]
- 9.Hagan EC, Lloyd AL, Rasko DA, Faerber GJ & Mobley HL Escherichia coli global gene expression in urine from women with urinary tract infection. PLoS Pathog 6, e1001187, doi: 10.1371/journal.ppat.1001187 (2010). [DOI] [PMC free article] [PubMed] [Google Scholar]
- 10.Floyd KA et al. The UbiI (VisC) Aerobic Ubiquinone Synthase Is Required for Expression of Type 1 Pili, Biofilm Formation, and Pathogenesis in Uropathogenic Escherichia coli. J Bacteriol 198, 2662–2672, doi: 10.1128/JB.00030-16 (2016). [DOI] [PMC free article] [PubMed] [Google Scholar]
- 11.Eberly AR et al. Biofilm Formation by Uropathogenic Escherichia coli Is Favored under Oxygen Conditions That Mimic the Bladder Environment. Int J Mol Sci 18, doi: 10.3390/ijms18102077 (2017). [DOI] [PMC free article] [PubMed] [Google Scholar]
- 12.Beebout CJ et al. Respiratory Heterogeneity Shapes Biofilm Formation and Host Colonization in Uropathogenic Escherichia coli. MBio 10, doi: 10.1128/mBio.02400-18 (2019). [DOI] [PMC free article] [PubMed] [Google Scholar]
- 13.Beebout CJ, Sominsky LA, Eberly AR, Van Horn GT & Hadjifrangiskou M Cytochrome bd promotes Escherichia coli biofilm antibiotic tolerance by regulating accumulation of noxious chemicals. NPJ Biofilms Microbiomes 7, 35, doi: 10.1038/s41522-021-00210-x (2021). [DOI] [PMC free article] [PubMed] [Google Scholar]
- 14.Borisov VB & Verkhovsky MI Oxygen as Acceptor. EcoSal Plus 6 (2015). [DOI] [PMC free article] [PubMed] [Google Scholar]
- 15.Shepherd M et al. The cytochrome bd-I respiratory oxidase augments survival of multidrug-resistant Escherichia coli during infection. Sci Rep 6, 35285, doi: 10.1038/srep35285 (2016). [DOI] [PMC free article] [PubMed] [Google Scholar]
- 16.Borisov VB, Gennis RB, Hemp J & Verkhovsky MI The cytochrome bd respiratory oxygen reductases. Biochim Biophys Acta 1807, 1398–1413, doi: 10.1016/j.bbabio.2011.06.016 (2011). [DOI] [PMC free article] [PubMed] [Google Scholar]
- 17.Mason MG et al. Cytochrome bd confers nitric oxide resistance to Escherichia coli. Nat Chem Biol 5, 94–96, doi: 10.1038/nchembio.135 (2009). [DOI] [PubMed] [Google Scholar]
- 18.Giuffrè A, Borisov VB, Arese M, Sarti P & Forte E Cytochrome bd oxidase and bacterial tolerance to oxidative and nitrosative stress. Biochim Biophys Acta 1837, 1178–1187, doi: 10.1016/j.bbabio.2014.01.016 (2014). [DOI] [PubMed] [Google Scholar]
- 19.Hannan TJ et al. Host-pathogen checkpoints and population bottlenecks in persistent and intracellular uropathogenic Escherichia coli bladder infection. FEMS Microbiol Rev 36, 616–648, doi: 10.1111/j.1574-6976.2012.00339.x (2012). [DOI] [PMC free article] [PubMed] [Google Scholar]
- 20.Mulvey MA et al. Induction and evasion of host defenses by type 1-piliated uropathogenic Escherichia coli. Science 282, 1494–1497 (1998). [DOI] [PubMed] [Google Scholar]
- 21.Haugan MS, Charbon G, Frimodt-Møller N & Løbner-Olesen A Chromosome replication as a measure of bacterial growth rate during Escherichia coli infection in the mouse peritonitis model. Sci Rep 8, 14961, doi: 10.1038/s41598-018-33264-7 (2018). [DOI] [PMC free article] [PubMed] [Google Scholar]
- 22.Rivera-Chavez F et al. Depletion of Butyrate-Producing Clostridia from the Gut Microbiota Drives an Aerobic Luminal Expansion of Salmonella. Cell Host Microbe 19, 443–454, doi: 10.1016/j.chom.2016.03.004 (2016). [DOI] [PMC free article] [PubMed] [Google Scholar]
- 23.Mascolo L & Bald D Cytochrome bd in Mycobacterium tuberculosis: A respiratory chain protein involved in the defense against antibacterials. Prog Biophys Mol Biol 152, 55–63, doi: 10.1016/j.pbiomolbio.2019.11.002 (2020). [DOI] [PubMed] [Google Scholar]
- 24.Cai Y et al. Host immunity increases Mycobacterium tuberculosis reliance on cytochrome bd oxidase. PLoS Pathog 17, e1008911, doi: 10.1371/journal.ppat.1008911 (2021). [DOI] [PMC free article] [PubMed] [Google Scholar]
- 25.Mogi T et al. Probing the ubiquinol-binding site in cytochrome bd by site-directed mutagenesis. Biochemistry 45, 7924–7930, doi: 10.1021/bi060192w (2006). [DOI] [PubMed] [Google Scholar]
- 26.Safarian S et al. Active site rearrangement and structural divergence in prokaryotic respiratory oxidases. Science 366, 100–104, doi: 10.1126/science.aay0967 (2019). [DOI] [PubMed] [Google Scholar]
- 27.Lacerda Mariano L & Ingersoll MA The immune response to infection in the bladder. Nat Rev Urol 17, 439–458, doi: 10.1038/s41585-020-0350-8 (2020). [DOI] [PubMed] [Google Scholar]
- 28.Friedrich T et al. Two binding sites of inhibitors in NADH: ubiquinone oxidoreductase (complex I). Relationship of one site with the ubiquinone-binding site of bacterial glucose:ubiquinone oxidoreductase. Eur J Biochem 219, 691–698, doi: 10.1111/j.1432-1033.1994.tb19985.x (1994). [DOI] [PubMed] [Google Scholar]
- 29.Degli Esposti M Inhibitors of NADH-ubiquinone reductase: an overview. Biochim Biophys Acta 1364, 222–235, doi: 10.1016/s0005-2728(98)00029-2 (1998). [DOI] [PubMed] [Google Scholar]
- 30.Tiku V, Tan MW & Dikic I Mitochondrial Functions in Infection and Immunity. Trends Cell Biol 30, 263–275, doi: 10.1016/j.tcb.2020.01.006 (2020). [DOI] [PMC free article] [PubMed] [Google Scholar]
- 31.Marchi S, Morroni G, Pinton P & Galluzzi L Control of host mitochondria by bacterial pathogens. Trends Microbiol, doi: 10.1016/j.tim.2021.09.010 (2021). [DOI] [PubMed] [Google Scholar]
- 32.Marsboom G et al. Dynamin-related protein 1-mediated mitochondrial mitotic fission permits hyperproliferation of vascular smooth muscle cells and offers a novel therapeutic target in pulmonary hypertension. Circ Res 110, 1484–1497, doi: 10.1161/CIRCRESAHA.111.263848 (2012). [DOI] [PMC free article] [PubMed] [Google Scholar]
- 33.Krab K, Kempe H & Wikström M Explaining the enigmatic K(M) for oxygen in cytochrome c oxidase: a kinetic model. Biochim Biophys Acta 1807, 348–358, doi: 10.1016/j.bbabio.2010.12.015 (2011). [DOI] [PubMed] [Google Scholar]
- 34.Semenza GL Targeting HIF-1 for cancer therapy. Nat Rev Cancer 3, 721–732, doi: 10.1038/nrc1187 (2003). [DOI] [PubMed] [Google Scholar]
- 35.Rathmell JC et al. Akt-directed glucose metabolism can prevent Bax conformation change and promote growth factor-independent survival. Mol Cell Biol 23, 7315–7328, doi: 10.1128/MCB.23.20.7315-7328.2003 (2003). [DOI] [PMC free article] [PubMed] [Google Scholar]
- 36.Klumpp DJ et al. Uropathogenic Escherichia coli induces extrinsic and intrinsic cascades to initiate urothelial apoptosis. Infect Immun 74, 5106–5113, doi: 10.1128/IAI.00376-06 (2006). [DOI] [PMC free article] [PubMed] [Google Scholar]
- 37.Klumpp DJ et al. Uropathogenic Escherichia coli potentiates type 1 pilus-induced apoptosis by suppressing NF-kappaB. Infect Immun 69, 6689–6695, doi: 10.1128/IAI.69.11.6689-6695.2001 (2001). [DOI] [PMC free article] [PubMed] [Google Scholar]
- 38.Lin AE et al. Role of Hypoxia Inducible Factor-1α (HIF-1α) in Innate Defense against Uropathogenic Escherichia coli Infection. PLoS Pathog 11, e1004818, doi: 10.1371/journal.ppat.1004818 (2015). [DOI] [PMC free article] [PubMed] [Google Scholar]
- 39.Alteri CJ, Smith SN & Mobley HL Fitness of Escherichia coli during urinary tract infection requires gluconeogenesis and the TCA cycle. PLoS Pathog 5, e1000448 (2009). [DOI] [PMC free article] [PubMed] [Google Scholar]
- 40.Alteri CJ & Mobley HL Escherichia coli physiology and metabolism dictates adaptation to diverse host microenvironments. Curr Opin Microbiol 15, 3–9, doi: 10.1016/j.mib.2011.12.004 (2012). [DOI] [PMC free article] [PubMed] [Google Scholar]
- 41.Murphy KC & Campellone KG Lambda Red-mediated recombinogenic engineering of enterohemorrhagic and enteropathogenic E. coli. BMC Mol Biol 4, 11 (2003). [DOI] [PMC free article] [PubMed] [Google Scholar]
- 42.Hung CS, Dodson KW & Hultgren SJ A murine model of urinary tract infection. Nat Protoc 4, 1230–1243, doi: 10.1038/nprot.2009.116 (2009). [DOI] [PMC free article] [PubMed] [Google Scholar]
- 43.Hartmann R et al. Quantitative image analysis of microbial communities with BiofilmQ. Nat Microbiol 6, 151–156, doi: 10.1038/s41564-020-00817-4 (2021). [DOI] [PMC free article] [PubMed] [Google Scholar]
- 44.Pfaffl MW A new mathematical model for relative quantification in real-time RT-PCR. Nucleic Acids Res 29, e45 (2001). [DOI] [PMC free article] [PubMed] [Google Scholar]
- 45.Leaver-Fay A et al. ROSETTA3: an object-oriented software suite for the simulation and design of macromolecules. Methods Enzymol 487, 545–574, doi: 10.1016/B978-0-12-381270-4.00019-6 (2011). [DOI] [PMC free article] [PubMed] [Google Scholar]
- 46.Song Y et al. High-resolution comparative modeling with RosettaCM. Structure 21, 1735–1742, doi: 10.1016/j.str.2013.08.005 (2013). [DOI] [PMC free article] [PubMed] [Google Scholar]
- 47.Alford RF et al. An Integrated Framework Advancing Membrane Protein Modeling and Design. PLoS Comput Biol 11, e1004398, doi: 10.1371/journal.pcbi.1004398 (2015). [DOI] [PMC free article] [PubMed] [Google Scholar]
- 48.Koehler Leman J, Mueller BK & Gray JJ Expanding the toolkit for membrane protein modeling in Rosetta. Bioinformatics 33, 754–756, doi: 10.1093/bioinformatics/btw716 (2017). [DOI] [PMC free article] [PubMed] [Google Scholar]
- 49.Ashkenazy H et al. ConSurf 2016: an improved methodology to estimate and visualize evolutionary conservation in macromolecules. Nucleic Acids Res 44, W344–350, doi: 10.1093/nar/gkw408 (2016). [DOI] [PMC free article] [PubMed] [Google Scholar]
- 50.Landau M et al. ConSurf 2005: the projection of evolutionary conservation scores of residues on protein structures. Nucleic Acids Res 33, W299–302, doi: 10.1093/nar/gki370 (2005). [DOI] [PMC free article] [PubMed] [Google Scholar]
- 51.Glaser F et al. ConSurf: identification of functional regions in proteins by surface-mapping of phylogenetic information. Bioinformatics 19, 163–164, doi: 10.1093/bioinformatics/19.1.163 (2003). [DOI] [PubMed] [Google Scholar]
- 52.Park H et al. Simultaneous Optimization of Biomolecular Energy Functions on Features from Small Molecules and Macromolecules. J Chem Theory Comput 12, 6201–6212, doi: 10.1021/acs.jctc.6b00819 (2016). [DOI] [PMC free article] [PubMed] [Google Scholar]
- 53.Frenz B et al. Prediction of Protein Mutational Free Energy: Benchmark and Sampling Improvements Increase Classification Accuracy. Front Bioeng Biotechnol 8, 558247, doi: 10.3389/fbioe.2020.558247 (2020). [DOI] [PMC free article] [PubMed] [Google Scholar]
- 54.Conway P, Tyka MD, DiMaio F, Konerding DE & Baker D Relaxation of backbone bond geometry improves protein energy landscape modeling. Protein Sci 23, 47–55, doi: 10.1002/pro.2389 (2014). [DOI] [PMC free article] [PubMed] [Google Scholar]
- 55.Khatib F et al. Algorithm discovery by protein folding game players. Proc Natl Acad Sci U S A 108, 18949–18953, doi: 10.1073/pnas.1115898108 (2011). [DOI] [PMC free article] [PubMed] [Google Scholar]
- 56.Nivon LG, Moretti R & Baker D A Pareto-optimal refinement method for protein design scaffolds. PLoS One 8, e59004, doi: 10.1371/journal.pone.0059004 (2013). [DOI] [PMC free article] [PubMed] [Google Scholar]
- 57.Tyka MD et al. Alternate states of proteins revealed by detailed energy landscape mapping. J Mol Biol 405, 607–618, doi: 10.1016/j.jmb.2010.11.008 (2011). [DOI] [PMC free article] [PubMed] [Google Scholar]
- 58.Dwyer DJ et al. Antibiotics induce redox-related physiological alterations as part of their lethality. Proc Natl Acad Sci U S A 111, E2100–2109, doi: 10.1073/pnas.1401876111 (2014). [DOI] [PMC free article] [PubMed] [Google Scholar]
- 59.Rasmussen ML et al. MCL-1 Inhibition by Selective BH3 Mimetics Disrupts Mitochondrial Dynamics Causing Loss of Viability and Functionality of Human Cardiomyocytes. iScience 23, 101015, doi: 10.1016/j.isci.2020.101015 (2020). [DOI] [PMC free article] [PubMed] [Google Scholar]
- 60.Subramanian A et al. Gene set enrichment analysis: a knowledge-based approach for interpreting genome-wide expression profiles. Proc Natl Acad Sci U S A 102, 15545–15550, doi: 10.1073/pnas.0506580102 (2005). [DOI] [PMC free article] [PubMed] [Google Scholar]
Associated Data
This section collects any data citations, data availability statements, or supplementary materials included in this article.
Supplementary Materials
Data Availability Statement
All data required for evaluation of these results are present in the text, figures, or supplemental material. Transcriptional profiling data has been deposited in the Gene Expression Omnibus (GEO) database (accession: GSE188981) and is also contained in Supplementary Table 2a. Data from the following publicly available databases was used in this study: NCBI Protein Database (FASTA sequence: NP_415261.2) and the RCSB Protein Data Bank (PDB) (PDB IDs: 6rko and 6rx4). Source data is provided in supplemental material.


