

SUMMARY
In vitro studies suggest that mapping the spatiotemporal complexity of nuclear factor κB (NF-κB) signaling is essential to understanding its function. The lack of tools to directly monitor NF-κB proteins in vivo has hindered such efforts. Here, we introduce reporter mice with the endogenous RelA (p65) or c-Rel labeled with distinct fluorescent proteins and a double knockin with both subunits labeled. Overcoming hurdles in simultaneous live-cell imaging of RelA and c-Rel, we show that quantitative features of signaling reflect the identity of activating ligands, differ between primary and immortalized cells, and shift toward c-Rel in microglia from aged brains. RelA:c-Rel heterodimer is unexpectedly depleted in the nuclei of stimulated cells. Trajectories of subunit co-expression in immune lineages reveal a reduction at key cell maturation stages. These results demonstrate the power of these reporters in gaining deeper insights into NF-κB biology, with the spectral complementarity of the labeled NF-κB proteins enabling diverse applications.
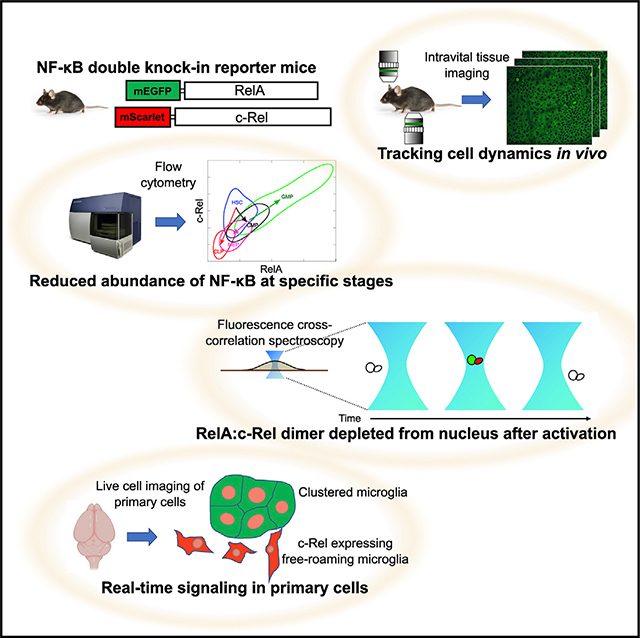
Graphical abstract
In brief
Rahman et al. present fluorescent knockin mice that track one or both of the canonical subunits of NF-κB. The power of these reporters is illustrated with several approaches that gain deeper insights into NF-κB biology. The mice enable diverse applications from single-molecule analyses to in situ identification of active inflammatory cells.
INTRODUCTION
Nuclear factor kB (NF-κB) is a ubiquitous stress-inducible transcription factor that regulates inflammatory responses in virtually all cell types in vivo.1,2 The canonical activation of NF-κB begins with the degradation of the inhibitor of NF-κB proteins (IκBs), its release from inhibition, and consequent accumulation in the nucleus. As part of the transcriptional response, NF-κB activates a multitude of genes including those encoding a negative or a positive feedback regulator that collectively shape the kinetic profiles of NF-κB activity.3,4 Given such a non-linear autoregulatory network, the signaling dynamics of NF-κB can be complex.
A striking example is an oscillatory time course with several cycles of activity after stimulation.5,6 In situations where NF-κB oscillations occur, the time window for NF-κB presence in the nucleus at concentrations sufficient for global gene regulation can be as brief as 15–20 min in each cycle. This presents a challenge for this transcriptional regulator, namely, searching and activating all the relevant target genes in the available epigenome.7,8 These observations invoke questions about how efficient gene regulation is attained with such time constraints on nuclear residence of a transcription factor. Furthermore, the nuclear influx cycles of NF-κB oscillations are out of synchrony between individual cells,5,6 defying detection even in quantitative single-cell assays if only snapshots are taken. Given the broad importance of NF-κB as a master regulator of inflammation and cell survival, the lack of proper tools to capture real-time dynamics of NF-κB RelA (also known as p65) and the less-examined c-Rel in single live cells has hampered efforts to gain deeper insights in diverse areas. A non-invasive, dynamics-accurate approach will advance our understanding of the functional relationship between complex signaling dynamics of NF-κB and the mechanisms of cellular decision making for context-specific outcomes in inflammation, cell survival, and stress responses.
The temporal features of NF-κB signaling dynamics have also been linked to stimulus- and tissue-selective gene regulation.9–14 Since NF-κB signaling dynamics can be oscillatory or otherwise complex in specific contexts,5,11,12,15–19 information content in such quantitative features of signaling may provide a covert regulatory layer that helps NF-κB fine-tune cellular decision making with a higher accuracy.9,20,21 Despite appreciation of the potential link between NF-κB dynamics and functional outcomes,22,23 it remains unclear whether the data, mostly from transformed cell lines expressing the RelA subunit of NF-κB, may directly apply to primary cells or in vivo systems. In particular, the immunological relevance of findings from quantitative single-cell signaling dynamics studies has been questionable, since many tissue-resident cell populations either do not survive or rapidly lose their epigenetic cell identity during long-term in vitro culture and manipulations.24
Prior attempts to provide tools for in vivo studies generated reporter mice of NF-κB signaling that were transgenic (lacking the natural control of expression by native genomic regulatory elements) or luciferase based (precluding high-resolution temporal measurements).25–28 An endogenous EGFP-RelA knockin mouse line was first generated in 2009,29 but this mouse strain has not been widely disseminated or utilized for various reasons. Given the complexity and asynchronous nature of NF-κB signaling5 with potential effects in gene regulation and cell fates,10,12,30,31 a gaping hole still exists in our understanding about NF-κB regulatory actions in primary cells and tissues at single-cell resolution.
To address this need, here we describe the generation and use of reporter animals that enable tracking of NF-κB proteins expressed from the endogenous loci. We created mice with either or both subunits RelA and c-Rel of the canonical NF-κB signaling network fluorescently labeled using precise knockin methods, then used primary cells from these animals to characterize the spatiotemporal dynamics of NF-κB. We optimized a quantitative analysis workflow for the low expression of endogenous proteins to capture the natural dynamics of NF-κB in primary macrophages, fibroblasts, and microglia, with live-cell microscopy and spectroscopy. Our results provide several insights regarding NF-κB composition, abundance, and signaling properties, including: (1) the signaling dynamics of primary cells have striking differences from the immortalized counterparts; (2) the lineage-specific trajectories of NF-κB protein abundance show downregulation at key maturation stages during immune cell development; (3) RelA:c-Rel heterodimers do not appear to act as a trans-activator; (4) there is coordinated signaling of the two subunits in cell-specific inflammatory signaling; and (5) microglia subpopulations shift toward c-Rel-driven amplification of NF-κB signaling during physiological aging. These insights stress the value of the reporter animals and their broad utility for tracking NF-κB in physiological contexts.
RESULTS
Generation of single and double NF-κB subunit knockin reporter mouse lines
We used CRISPR-Cas9 to introduce mEGFP in-frame into the mouse genome immediately upstream of the coding sequence of Rela, so that the genomic locus will produce an mEGFP-RelA fusion protein (Figures 1A [left] and S1A). After founder screening, backcrossing to C57BL/6, and breeding for desired genotypes, we established a homozygous colony of mEGFP-RelA endogenous knockin reporter mice. The fluorescence intensity of RelA in cells from homozygous mice was clearly separated from the background in C57BL/6, with the heterozygous cells in the intermediate range. This suggests that the RelA reporter intensity is well above the autofluorescence and the fusion gene expression is biallelic (Figure S2A). Since proper development requires functional RelA as shown by embryonic lethality of RelA knockout in mice,32 the fact that mice homozygous for the mEGFP-RelA fusion protein show normal embryogenesis, hematopoiesis, growth, and lifespan suggests the functionality of the molecule, which has also been supported by in vitro analyses.8,10–12,15,16,18,31,33,34 Pups from heterozygous breeders were born at Mendelian ratios, indicating no positive or negative selection of the fluorescently labeled allele. Animal census records showed that mEGFP-RelA mice had a median lifespan of 95 weeks, with some animals surviving up to 148 weeks, in line with the corresponding numbers from C57BL/6 in the same facility.
Figure 1. Accurate quantification of NF-κB abundance, composition, and spatiotemporal signaling using endogenous knockin fluorescent reporter mouse lines.
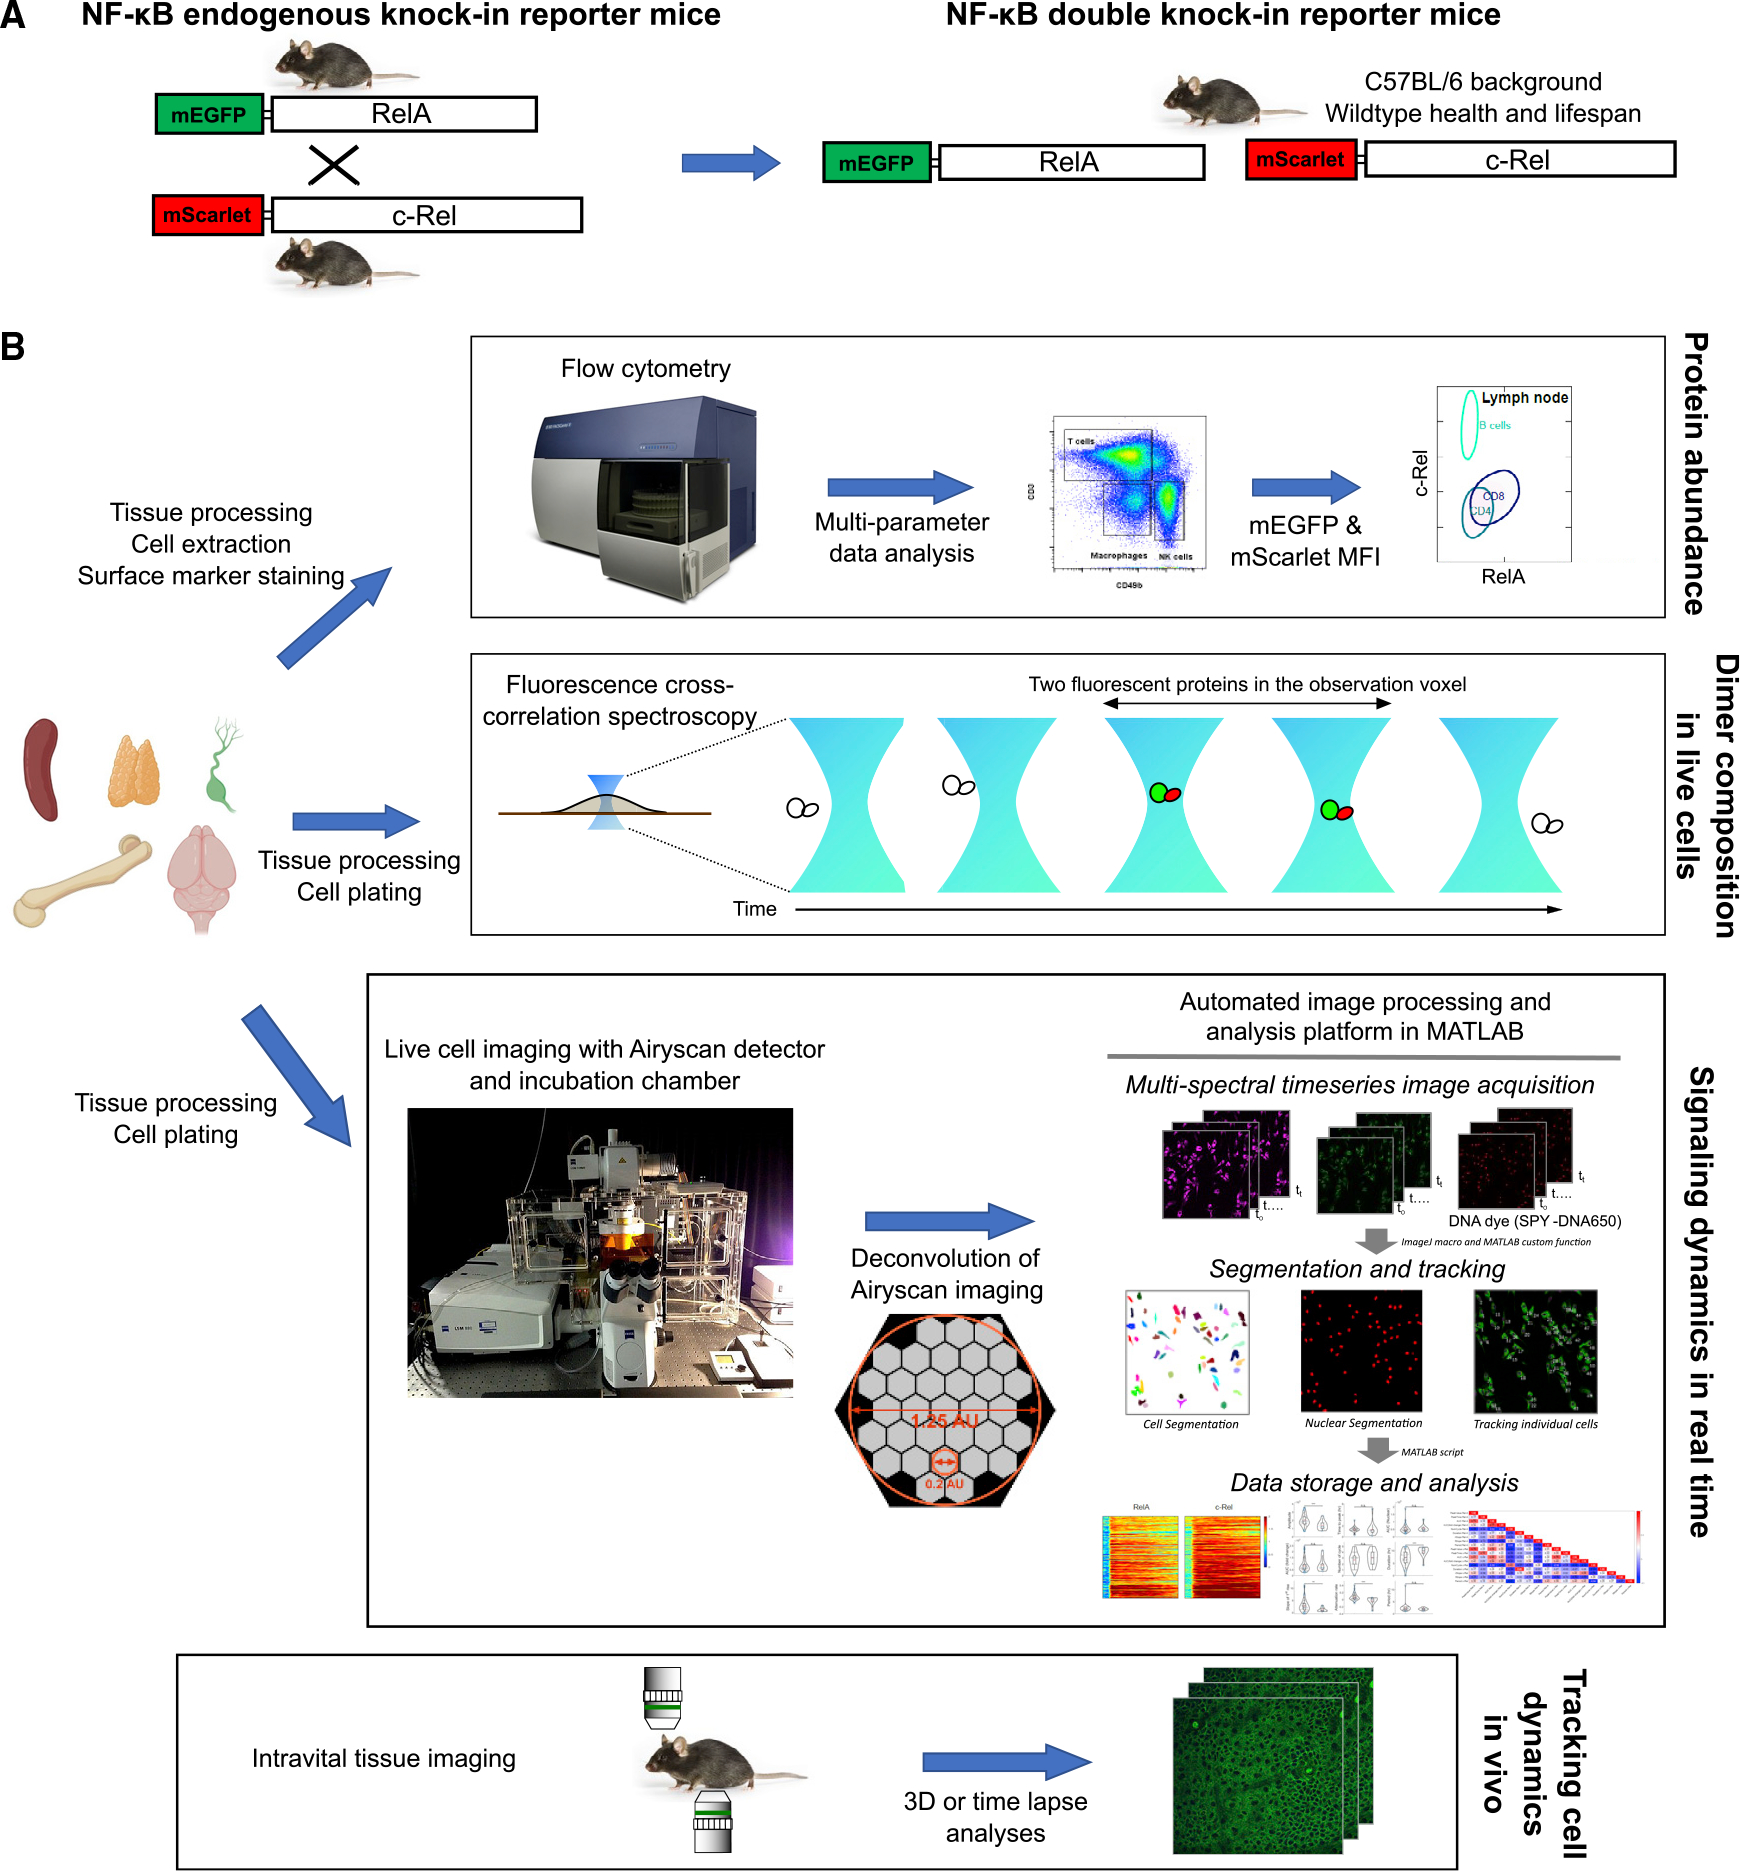
(A) Schematic depicting the generation of endogenous RelA knockin reporter and endogenous c-Rel knockin reporter mouse lines, and their crossbred double knockin reporter mice.
(B) Analysis platforms and workflows used in this study (see STAR Methods for details). Information gained from each analysis approach is noted on the right.
While c-Rel, encoded by Rel, is the other subunit important for canonical NF-κB signaling, much less is known about its dynamics at single-cell resolution in comparison with RelA. To close this gap, we generated a similar endogenous knockin mouse line, labeling c-Rel with a recently developed red fluorescent protein, mScarlet, which has superior brightness, rapid maturation kinetics, photostability, and good spectral separation from mEGFP35(Figures 1A [left] and S1D). mScarlet-c-Rel mice also showed normal development and health, and a lifespan similar to that of wild-type animals. Next, we crossed the mEGFP-RelA and mScarlet-c-Rel mice to generate a homozygous line of “green-red NF-κB double knockin” (DKI) reporter mice (Figure 1A, right). To allow flexibility in crossing with existing fluorescent reporter mice, we also generated the reciprocal endogenous knockin mouse lines mScarlet-RelA and mEGFP-c-Rel (Figures S1B and S1C).
To further ensure that the knockin reporter mice phenocopy the wild type C57BL/6, we performed comparisons at multiple levels, from molecular to behavioral tests (Figures S2–S4). mEGFP-RelA had protein stability similar to that of the endogenous RelA of the wild-type mice (Figures S2C and S2D). The c-Rel signaling time course was comparable between C57BL/6 and the mScarlet-c-Rel mice (Figure S3). The knockin reporter mice were also virtually indistinguishable from the wild type in terms of the hematopoietic cellular composition, locomotor function, memory, tissue morphology and pathology across the lifetime (Figures S2B and S4; data not shown).
These single and double knockin mouse lines enable several analyses that have previously been prone to major limitations attributable to available experimental models (Table 1 and Figure 1B). For example, the fluorescent intensities of mEGFP or mScarlet in flow cytometry analyses can be used to accurately measure protein abundance without any issues related to antibody specificity or labeling. Single-molecule-resolution spectroscopy techniques can be harnessed to probe for NF-κB hetero- or homodimers. The knockin reporter mice can also provide primary cell or tissue material for live-cell microscopy that captures real-time dynamics of endogenous NF-κB signaling (Figure 1B).
Table 1.
Approaches that can be applied to the NF-κB endogenous knockin reporter mouse lines and advantages over alternative approaches
| Experiment | Information from data | Advantages over alternative approaches |
|---|---|---|
|
| ||
| Flow cytometry/imaging-based flow cytometry | expression of RelA, c-Rel | no artifacts from RelA/c-Rel antibody specificity or non-uniform penetration/labeling in immunofluorescence |
| Fluorescence-activated cell sorting (FACS) | isolation of in vivo activated cells for downstream analysis | stain-free rapid harvesting of primary cells with inflammatory signaling activity in vivo |
| Time-lapse live-cell imaging | expression and signaling dynamics of RelA, c-Rel | no artifacts from overexpression or nonnatural regulation of a reporter transgene |
| analysis of primary cells and tissues, or cell types impossible to immortalize or culture in vitro | ||
| Multi-photon intravital imaging | expression and signaling dynamics of RelA, c-Rel | non-invasive tracking within intact tissues of live animals |
| Fluorescence resonance energy transfer (FRET) | protein interaction between NF-κB subunits or with another protein (if crossed with another fusion reporter line) | antibody-free direct analysis of live cells |
| mEGFP and mScarlet are an optimal spectral pair for FRET | ||
| Fluorescence correlation spectroscopy/fluorescence cross-correlation spectroscopy (FCS/FCCS) | absolute concentrations of RelA, c-Rel, and relative abundance of the heterodimer abundance, in live cells | antibody-free direct analysis of live cells |
| FCS measurements are more reliable with low-abundance endogenous proteins than with highly expressed transgene fluorescent fusion protein | ||
| Single-molecule tracking (SMT) | NF-κB: chromatin interactions, diffusion characteristics | tracking NF-κB molecules within intact nuclei of live cells |
| Generation of modified reporter mice by crossing existing genetic models with spectrally complementary knockin reporter mouse strain | NF-κB expression and signaling in a mutant; or in a reporter of another factor or a target gene | all of the above assays can be applied |
Primary cells show distinct NF-κB signaling dynamics that differ from immortalized counterparts
Immortalized cell lines expressing a fluorescent fusion of RelA have been the principal tool of choice in numerous studies of NF-κB signaling dynamics. While valuable information has been obtained by this approach, the extent to which the previously reported findings are shared by endogenous NF-κB in primary cells is unknown. To address this issue, we generated a stable cell line from the green-red NF-κB double knockin mice, termed immortalized ear fibroblasts (IEFs). Fibroblasts have been the most widely employed cell type in previous studies of NF-κB signaling.5,11,15,16,18,19,34 Since IEFs and primary ear fibroblasts (PEFs) are from the same source tissue, this analysis allowed us to compare them as a matching pair of immortalized and primary cells without confounding factors, using the identical live-cell imaging and quantification analysis workflow (Figure 1B).
Live imaging of fluorescent proteins expressed at endogenous concentrations presents technical challenges due to the low signal-to-noise ratio,5 especially for multi-channel acquisitions that can lead to phototoxicity. We optimized various aspects of the imaging protocols to identify microscopy and incubation conditions that support three-channel live imaging and quantitative data analyses (Figure 1B). For example, detection sensitivity was enhanced by the Airyscan detector employing minimal excitation, a large pinhole, and fast scanning. In addition to the mEGFP and mScarlet channels, the intensity of the DNA dye SPY650-DNA was acquired for automated nuclear segmentation. This was carried out in the far-red spectral range, which is benign in comparison with the phototoxic short wavelength required for commonly used nuclear dyes such as Hoechst.
We applied this imaging and analysis framework and quantified RelA and c-Rel time-series data for single IEFs and PEFs stimulated with lipopolysaccharide (LPS) or tumor necrosis factor α (TNF-α) (Figure 2A). First, the IEF data showed RelA responses that are similar to previously reported patterns of RelA dynamics, including faster responses to TNF-α in comparison with LPS,5,16,34 which confirms that our IEFs recapitulate the behavior of other permanent fibroblast lines. Both IEFs and PEFs showed oscillatory dynamics in response to TNF-α as expected, and not in response to LPS. Importantly, we obtained c-Rel signaling dynamics in single live cells (Figures 2A and S5), which has not been examined by previous studies. The expression and response of c-Rel from the green-red NF-κB DKI reporter were generally weak in both IEFs and PEFs, likely reflecting the non-immune ontogeny of fibroblasts, with IEF c-Rel being particularly insensitive to LPS.
Figure 2. Primary cells show signaling dynamics different from immortalized counterparts.
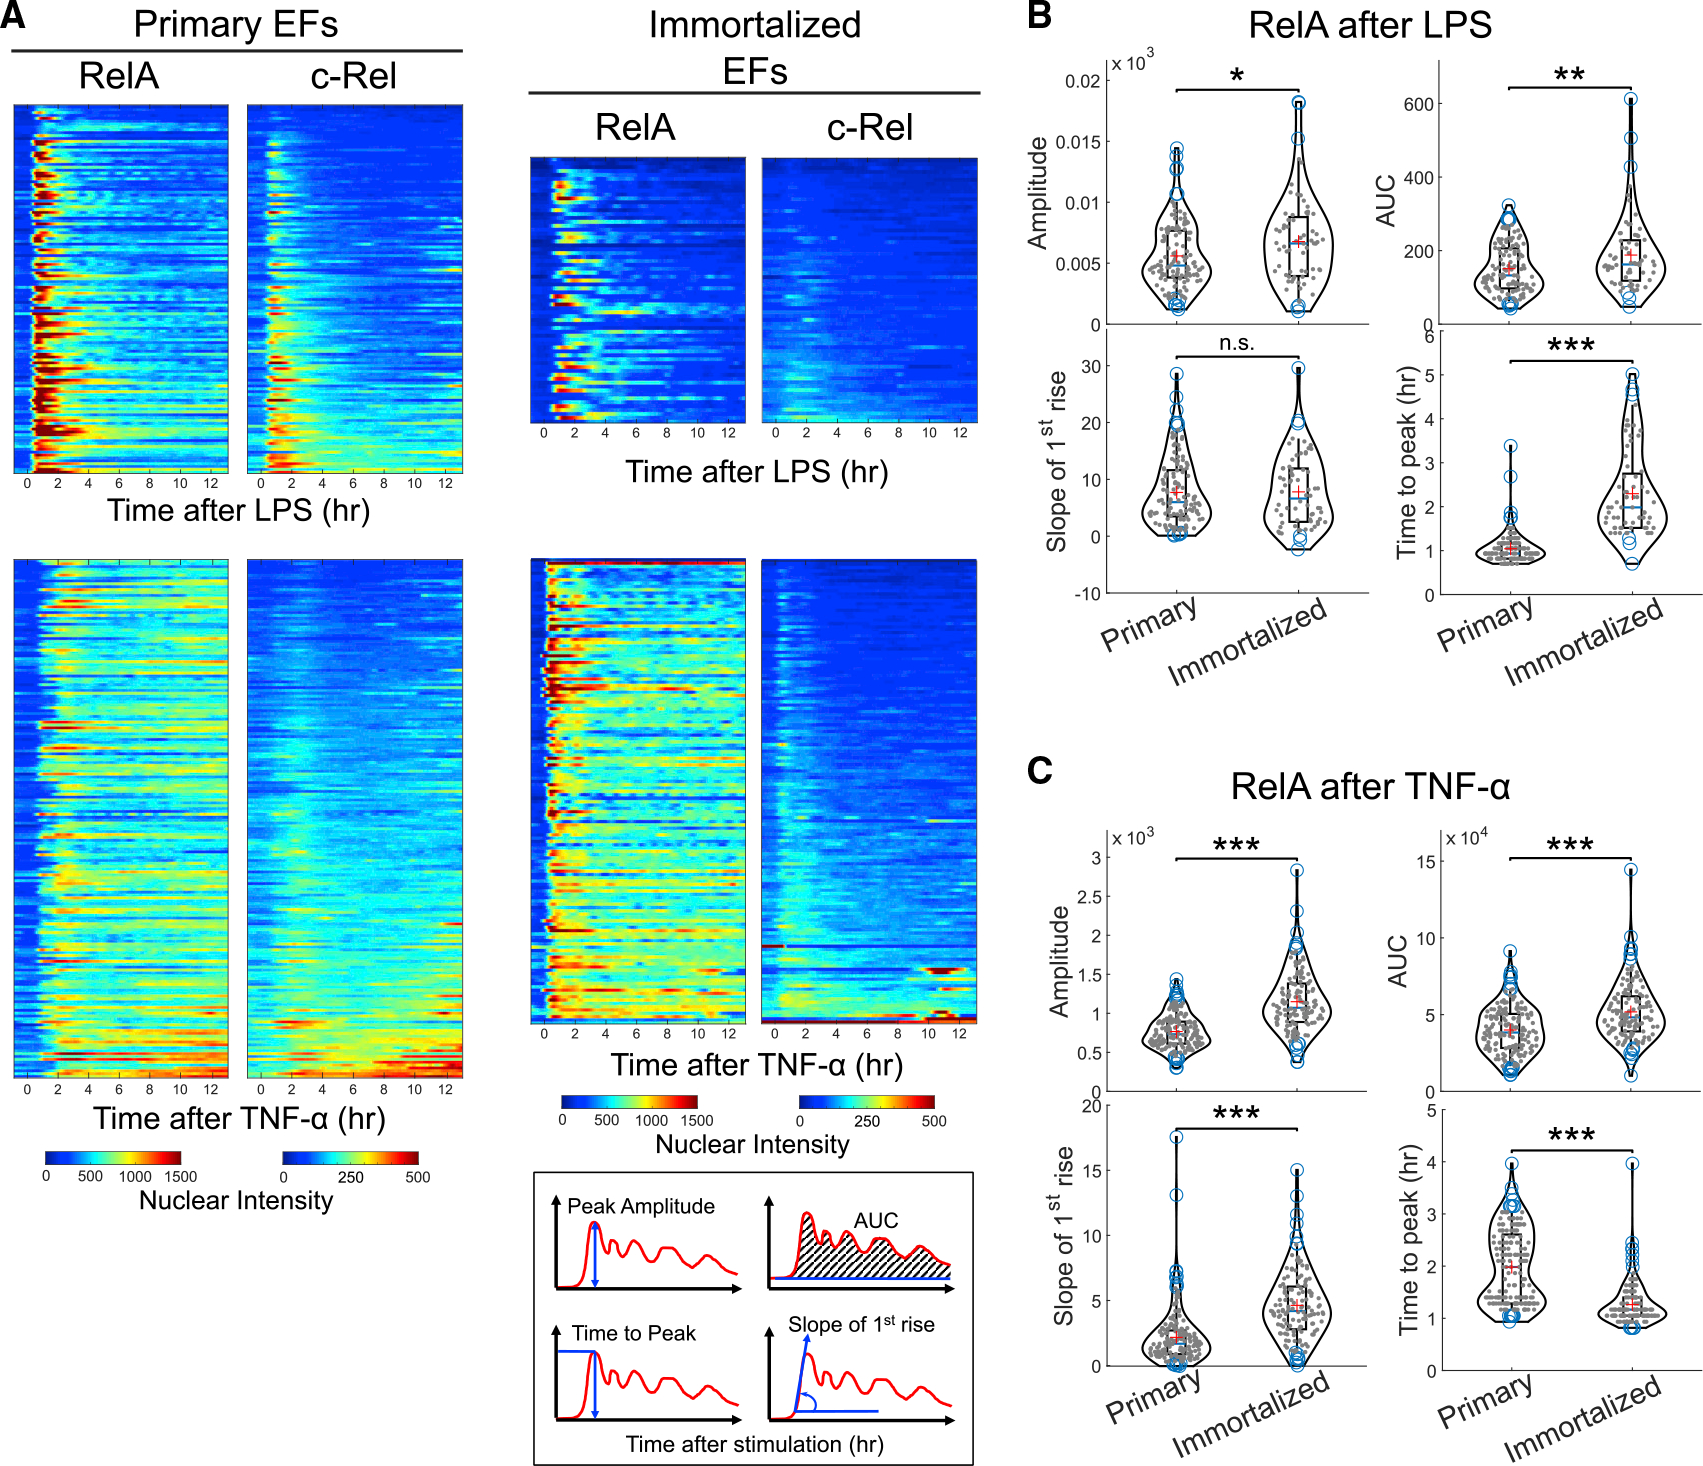
(A) Immortalized ear fibroblasts (IEFs; n = 68 for LPS and n = 141 for TNF-α) and primary ear fibroblasts (PEFs; n = 127 for LPS and n = 179 for TNF-α) isolated from young green-red double knockin reporter mice (~10 weeks of age) were plated in a fibronectin-coated, glass-bottom imaging chamber slide. One hour before the start of imaging, cells were stained with the SPY650-DNA dye for nuclear segmentation. Cells were stimulated with either LPS or TNF-α 1 h after the start of the imaging experiment. Three fluorescent channels were acquired at 7-min intervals for more than 12 h. The acquired images were processed using custom-written MATLAB scripts. The individual rows of the heatmap show the time series of the nuclear intensity of RelA and c-Rel for the same cells. The rows are sorted based on the area under the curve (AUC) of c-Rel signal. The data are representative of at least three individual biological replicates. Inset: quantitative features of RelA or c-Rel signaling dynamics extracted from the time-series data.
(B) Signaling features of RelA in LPS-stimulated cells.
(C) Signaling features of RelA in TNF-α-stimulated cells. The corresponding violin plots for c-Rel are provided in Figure S5A.
*p < 0.05, **p < 0.001, and ***p < 0.0001 from Mann-Whitney U test; n.s., not significant.
Although sharing some features with each other and prior studies on immortalized cell lines, the ligand-specific responses of IEFs and PEFs showed several distinct features of RelA and c-Rel signaling (Figures 2B, 2C, and S5). For example, the timing of peak nuclear translocation of RelA after LPS treatment was faster in PEFs than in IEFs or the published fibroblast data.11,16 This pattern was reversed for TNF-α responses, where PEFs had longer times to peak nuclear translocation in comparison with IEFs and published data from fibroblast lines.5,11,34 The differences between the primary and immortalized cells could not be attributed to the younger cell-intrinsic age of the primary cells, as PEFs from aged mice also had different signaling dynamics (Figure S5). The impact of immortalization was not limited to fibroblasts, since primary macrophages also exhibited distinct dynamics compared with the immortalized macrophage-like cells widely used in previous studies (Figure 3A).11,12 Regardless of the mechanisms underlying the observed differences, these results prompt a cautious interpretation of the existing data about ligand and tissue specificity of NF-κB signaling dynamics that are largely based on immortalized cell lines.
Figure 3. Live-cell imaging shows distinct ligand-specific signaling features and cell-type-dependent cross-correlation between RelA and c-Rel dynamics.
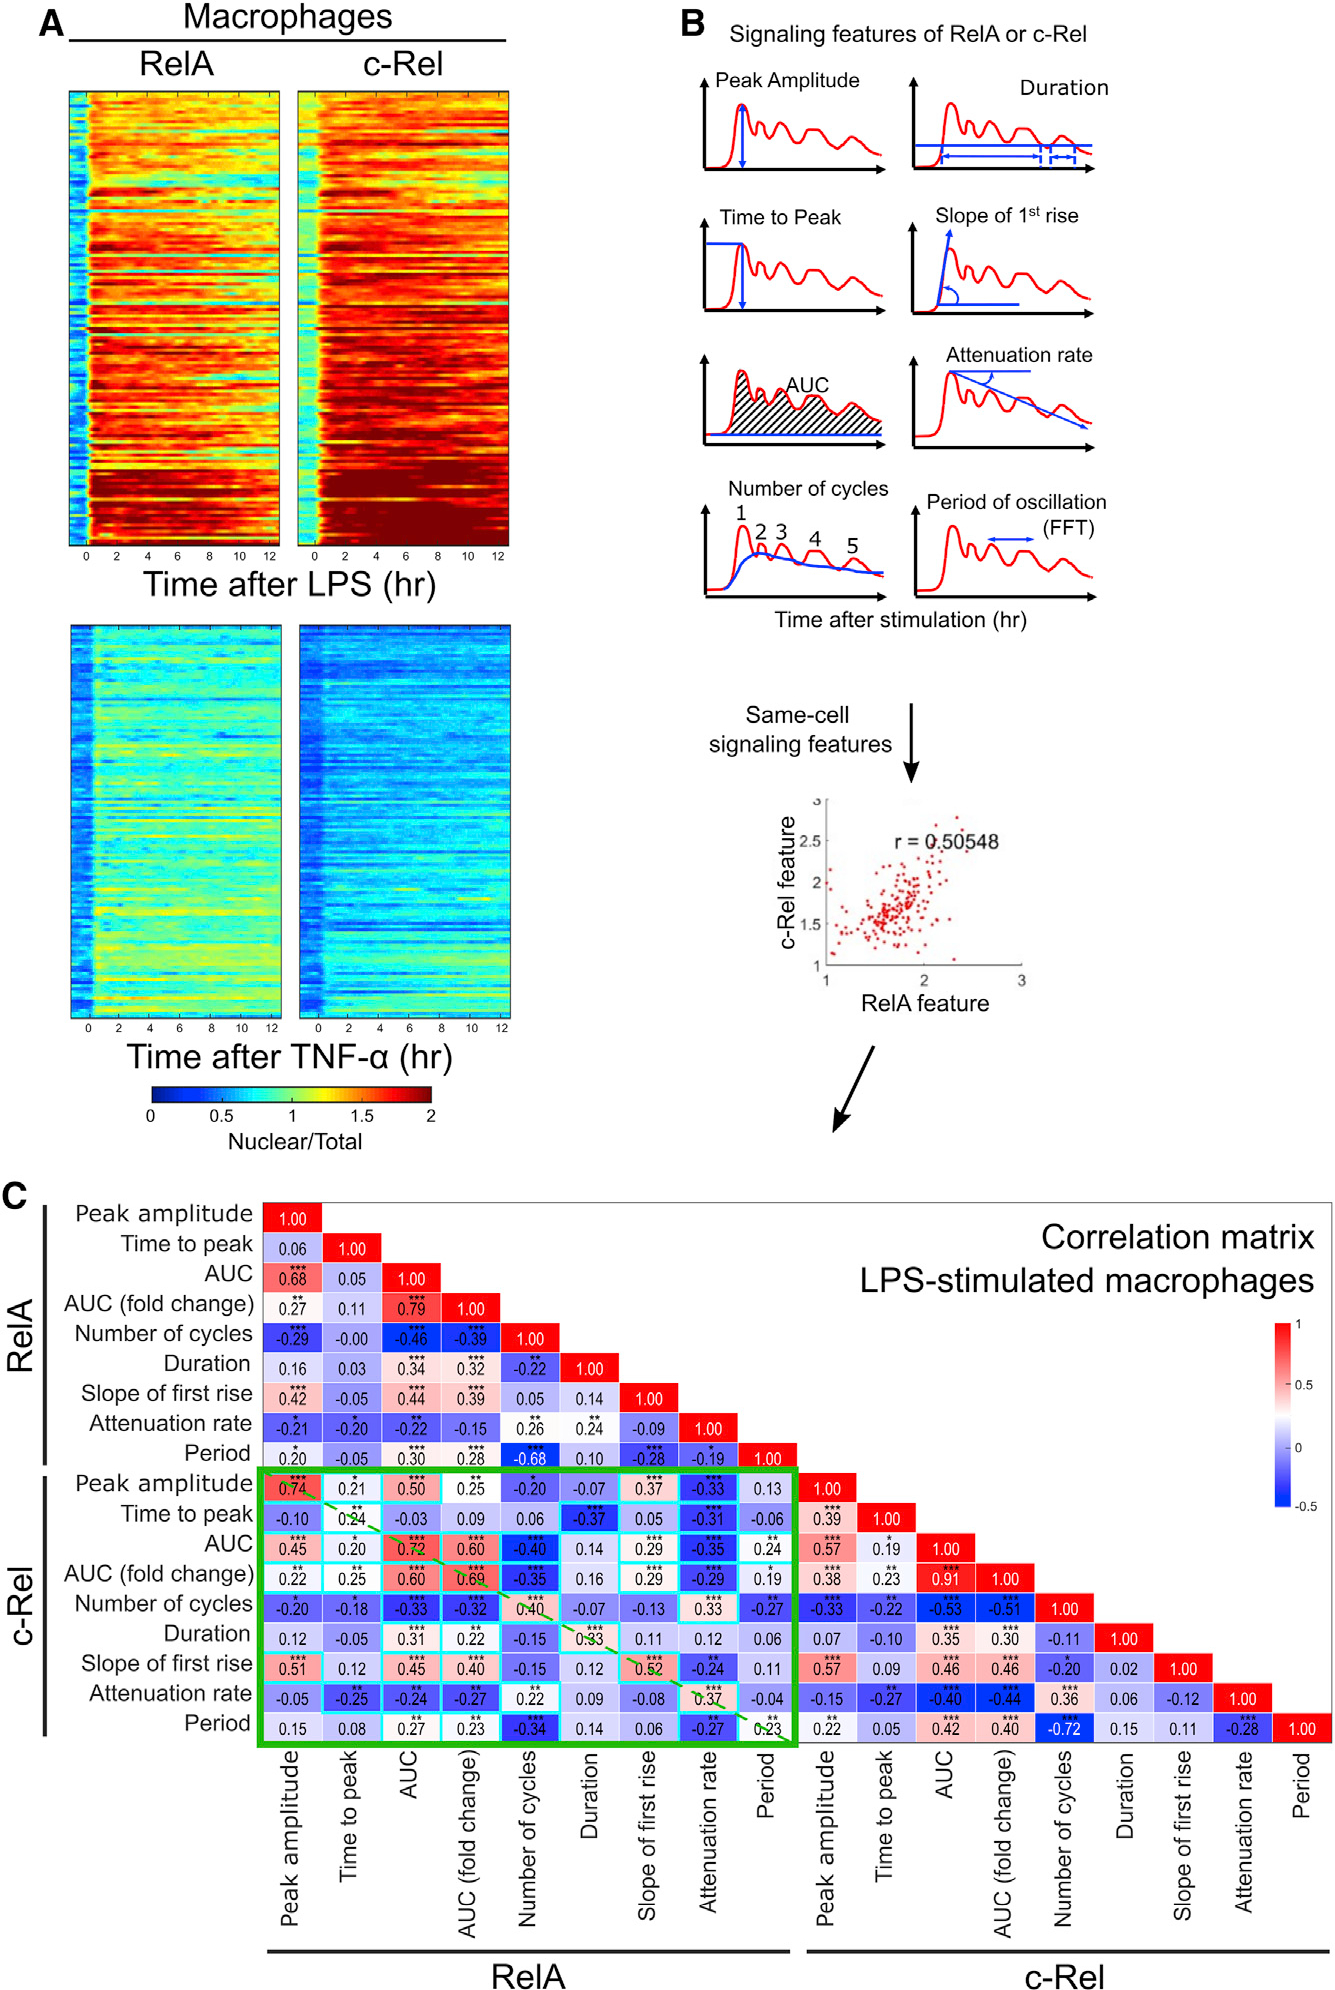
(A) Primary BMDMs (n = 143 for LPS and n = 126 forTNF-α) isolated from adult double knockin reporter mice (~10 weeks of age) were plated in a fibronectin-coated, glass-bottom imaging chamber slide. Live-cell imaging and data processing were performed as in Figure 2. The individual rows of the heatmap show the time series of nuclear-to-total mean intensity ratio of RelA and c-Rel for the same cells. The rows are sorted based on the area under the curve (AUC) of c-Rel signal. The data are representative of at least three individual biological replicates.
(B) The eight signaling features extracted from single-cell time series of RelA or c-Rel signal are depicted. All possible pairs of signaling features are considered for correlation matrix analysis.
(C) The correlation matrix heatmap of RelA and c-Rel signaling features is a summary of all pairwise correlation analyses from the LPS-stimulated BMDM data shown in (A). The individual correlation coefficient is shown inside each cell, with asterisks denoting statistical significance. The green boxes mark RelA and c-Rel cross-correlations. The dashed diagonal lines indicate cross-correlations between the same signaling features of RelA and c-Rel. Cyan boxes indicate that permutation test p value was less than 0.01 from 100 random shuffles of RelA:c-Rel same-cell pairing. *p < 0.05, **p < 0.001, ***p < 0.0001.
Intravital imaging captures the endogenous protein expression and dynamics in situ
The direct comparison above indicated that quantitative features of NF-κB signaling obtained from in vitro cell lines may not reflect the behaviors of primary cells in vivo. We therefore sought to capture dynamic features of NF-κB responses in situ using two-photon intravital microscopy, despite the low signal-to-noise ratio of the endogenously expressed fluorescent fusion proteins in a tissue environment. The ear epidermis was imaged using either the mEGFP-RelA or the mEGFP-c-Rel single knockin mouse under identical acquisition parameter settings for detection of mEGFP (Figure S6). Three-dimensional imaging from the surface to the deeper layers suggested that RelA expression was higher than c-Rel overall (Videos S1 and S2), which is in line with RelA being the prominent NF-κB subunit in non-immune tissues. Both subunits were localized in the cytoplasm, indicating that the intravital imaging conditions did not cause unintended inflammatory NF-κB signaling. Importantly, both RelA and c-Rel could be visualized at a subcellular resolution, despite the melanin-associated autofluorescence present in the C57BL/6 genetic background. Crossing with a pigmentation-free mouse strain would allow improved signals and resolution of the intravital imaging of the skin.
To capture inflammatory responses in live tissue, the peritoneal wall of mEGFP-RelA mice was imaged after LPS administration (Video S3). Two-photon imaging with simultaneous antibody staining confirmed that macrophages as well as other resident cells showed nuclear translocation of RelA within 30 min of LPS treatment. These results, as well as forthcoming improvements in intravital imaging technology, indicate that the reporter mice will enable real-time monitoring of NF-κB signaling in intact tissues of live animals.
Live-cell imaging shows ligand-specific signaling and quantitative inter-relationships between RelA and c-Rel dynamics
While RelA signaling dynamics have been linked to the encoding of ligand information,9 the degree of additional information that may potentially be encoded by c-Rel remains unknown. To address this in a widely used immune cell type, bone marrow-derived macrophages (BMDMs) were analyzed by time-lapse live microscopy and quantitative imaging data analysis (Figures 1B, 3A, 3B, and S7). NF-κB was activated in BMDMs by treating the cells with either TNF-α or LPS. The responses of both RelA and c-Rel were much stronger for LPS than for TNF-α. Whereas previous studies have mostly focused on RelA signaling dynamics, c-Rel responses to LPS were even stronger than RelA in terms of area under the curve (AUC) and duration. This suggests a rather substantial contribution of c-Rel in transcriptional reprogramming of wild-type macrophages exposed to LPS, even though macrophages may utilize RelA to achieve similar global gene-regulatory outcomes in the absence of c-Rel.36 On the contrary, TNF-α-induced NF-κB signaling was predominantly mediated by RelA, as reflected in the peak amplitude, duration, and AUC.
To discern hidden patterns of cross-subunit dependency in same-cell signaling, we performed a correlation matrix analysis based on all pairwise correlation coefficients between signaling features of the two subunits. Features of RelA signaling dynamics were generally linked to their c-Rel counterparts, with some exceptions (Figure 3C, dashed diagonal within the green box). Features related to the strength of signaling, such as peak amplitude and AUC, were strongly correlated between RelA and c-Rel, while timing-related features (time to peak, period, and attenuation rate) had lower correlations. It is intriguing to observe some cross-feature correlations between RelA and c-Rel dynamics (Figure 3C, off-diagonal within the green box) because they suggest interdependence of the two subunits. For example, the correlation between the slope of first rise in c-Rel and RelA AUC (fold change) means that cells with a faster c-Rel increase early on had a strong and sustained RelA response over the whole LPS response. Notably, the cross-subunit correlations were completely lost if the same-cell pairing of the RelA and c-Rel dataset was randomly shuffled in a permutation test (Figures S8 and S9). This highlights that the use of double knockin mouse line was absolutely critical, and these correlation patterns do not simply reflect the general similarities of RelA and c-Rel data taken separately.
Fluorescence cross-correlation spectroscopy suggests the depletion of nuclear RelA:c-Rel heterodimers after stimulation
Dimer composition of NF-κB proteins in intact cells is the least examined aspect of their biochemistry.3,33 This deficiency is a serious impediment because in vitro binding data have shown that the different RelA- or c-Rel-containing dimers have distinct affinity for individual κB motifs in the DNA sequences, and this may have consequences for gene regulation.37,38
Live-cell microscopy techniques, such as number and brightness, fluorescence resonance energy transfer (FRET), or fluorescence cross-correlation spectroscopy (FCCS), can be used to probe certain binding or dimerization properties of molecular species within live cells. FCCS is particularly suitable for probing low-concentration molecules such as endogenously expressed proteins.
We therefore performed FCCS on PEFs from the DKI mice, which allowed us to quantify the relative abundance of the RelA:c-Rel heterodimer before and after stimulation with TNF-α.39 FCCS analysis of the cytoplasmic and the nuclear compartments provided live-cell evidence for the existence of the heterodimer. The heterodimer species represented a small fraction of all the dimers containing RelA or c-Rel, as appreciated by the much lower range of the FCCS y-intercept values in comparison with fluorescence correlation spectroscopy (FCS) (Figure 4A). Despite the low abundance, FCCS revealed that the relative concentrations of the heterodimer were higher in the nucleus of resting cells and in the cytoplasm of cells stimulated with TNF-α (Figure 4B, right). Notably, this pattern indicates the opposite of the expected nuclear translocation of transactivating NF-κB dimers following stimulation (Figure 4B, left and middle). Even though the RelA:c-Rel heterodimer is seldom considered in biochemical analyses or genomic assays, this dimer is a complex of two subunits each containing a transactivation domain, thus presumed to function as a transcriptional activator. However, our finding suggests that the RelA:c-Rel heterodimer does not participate directly in transcriptional activation of target genes in fibroblasts.
Figure 4. FCCS reveals that the RelA:c-Rel heterodimers are depleted in the nucleus of stimulated fibroblasts.
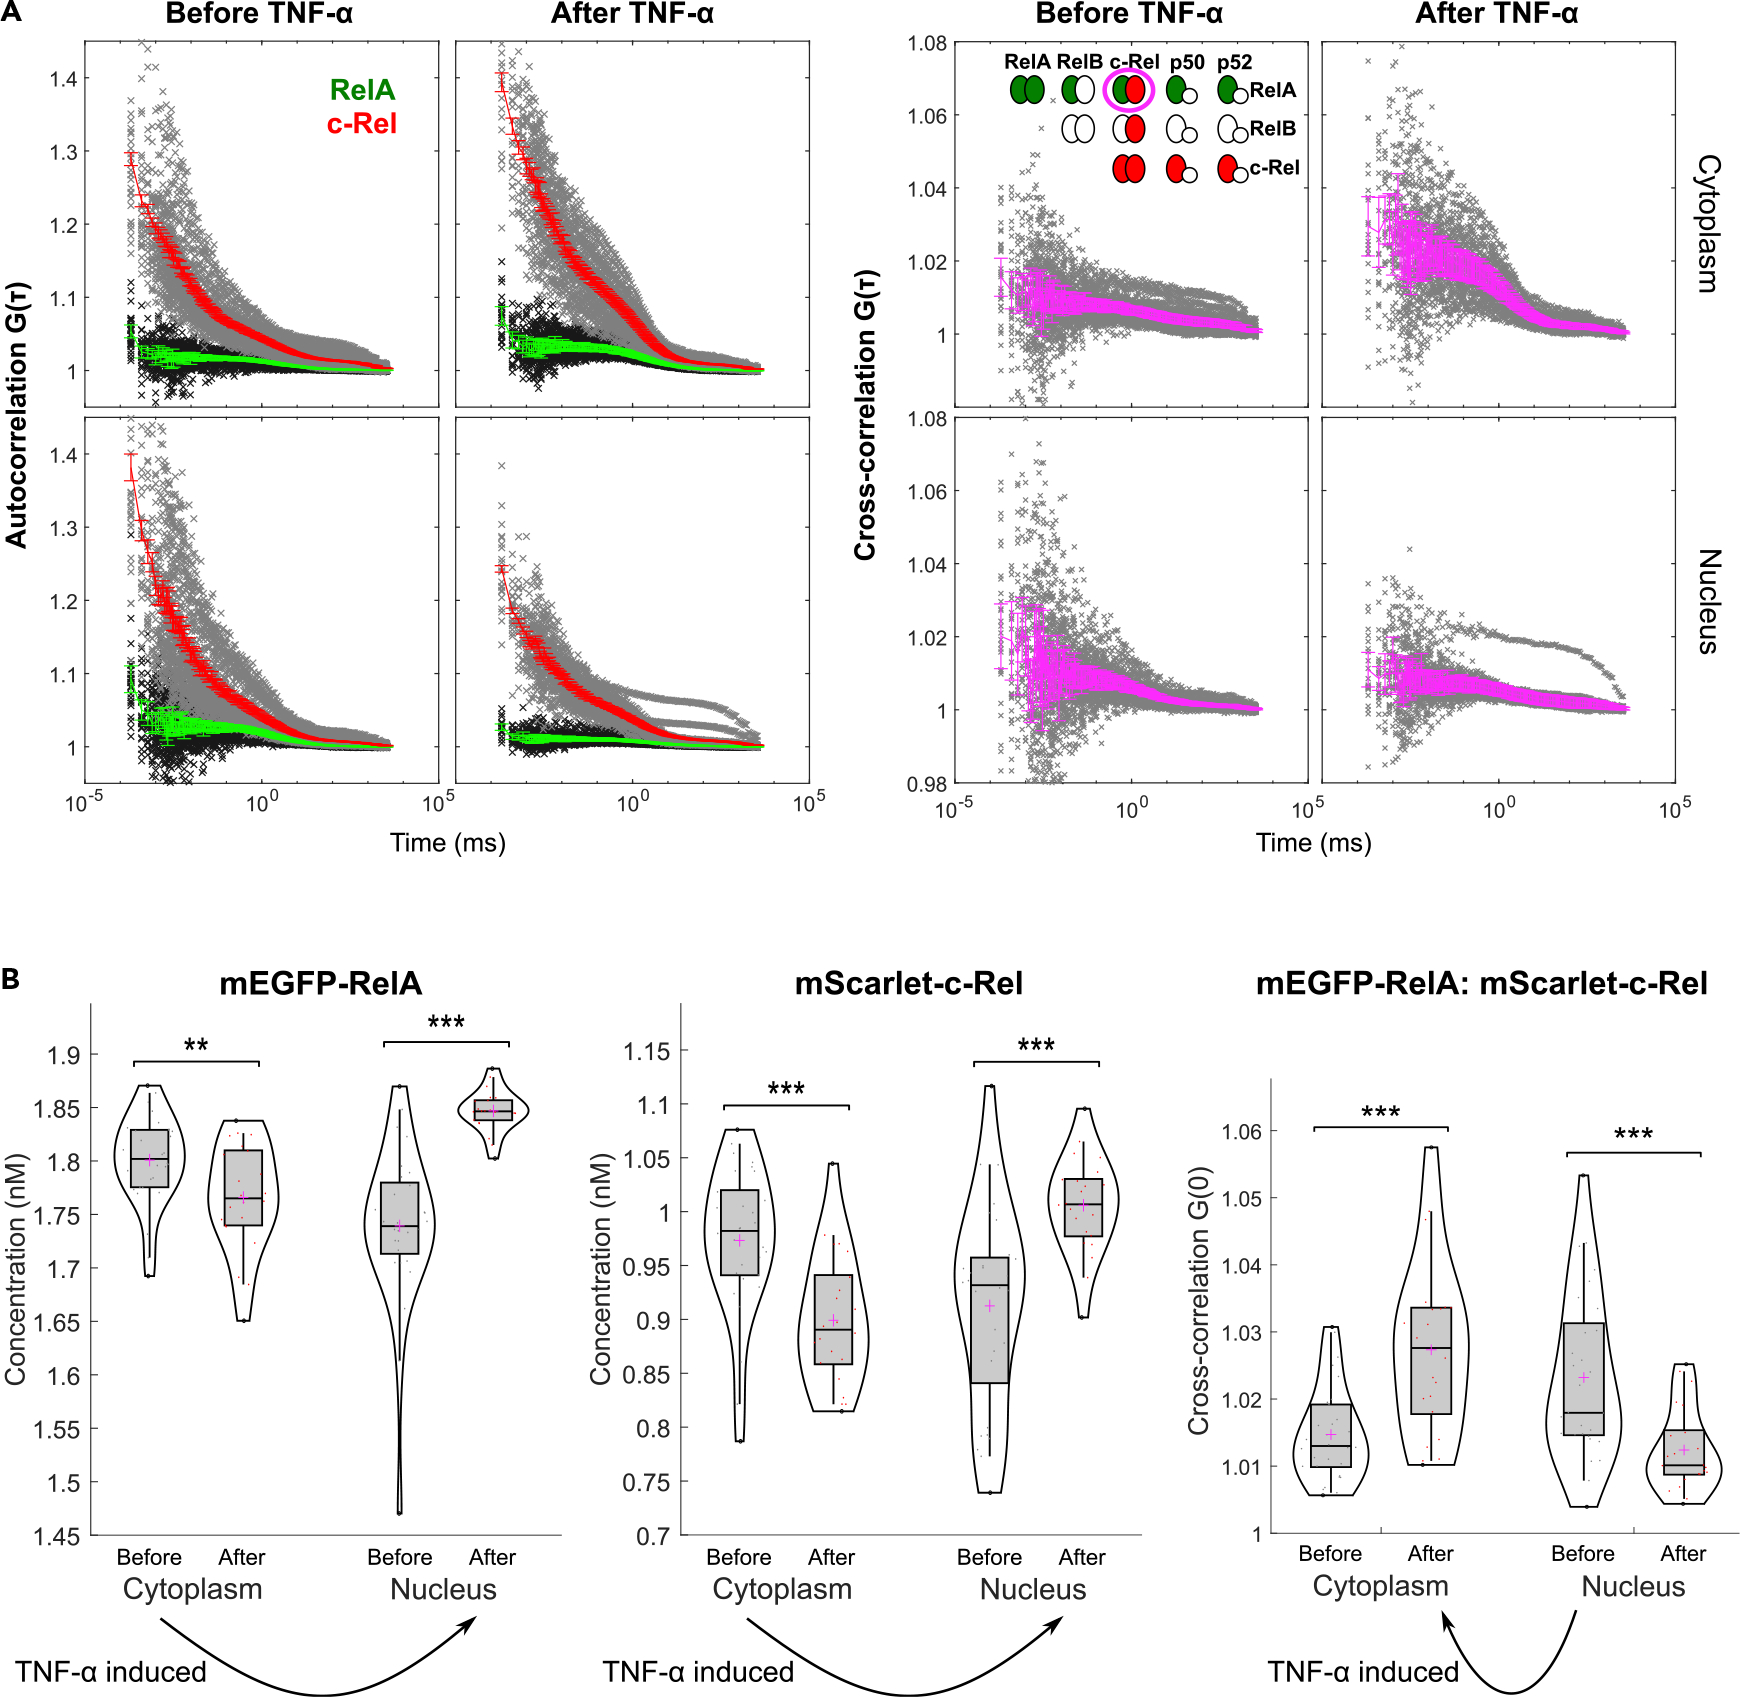
(A) Left: autocorrelation curves of mEGFP-RelA and mScarlet-c-Rel for nuclear and cytoplasmic compartments of cells without TNF-α or cells during the first nuclear peak after TNF-α stimulation. The green and red curves represent the average mEGFP-RelA and mScarlet-c-Rel autocorrelation curves, respectively. The error bars denote 95% confidence intervals. The black and gray crosses represent experimental autocorrelation data points for mEGFP-RelA and mScarlet-c-Rel, respectively. Right: cross-correlation curves of mEGFP-RelA and mScarlet-c-Rel for nuclear and cytoplasmic compartments of cells without TNF-α or cells during the first nuclear peak after TNF-α stimulation. The magenta curves represent the average of the mScarlet-c-Rel to mEGFP-RelA and mEGFP-RelA to mScarlet-c-Rel cross-correlations. The error bars denote 95% confidence intervals. The gray crosses represent experimental data points. The dimer schematic shown in the inset illustrates all potential NF-κB dimer species containing RelA or c-Rel, with the magenta circle highlighting the heterodimer examined by the FCCS.
(B) Concentrations of mEGFP-RelA (left) and mScarlet-c-Rel (middle) estimated from the FCS data and model fitting. The right violin plot shows the y intercept G(0) of the FCCS data from model fitting. Arrows indicate the direction of the relative enrichment induced by TNF-α stimulation. **p < 0.01, ***p < 0.001 from Mann-Whitney U test.
The FCCS data-analysis framework also produced simultaneous FCS data from the same cells, which can be used to infer absolute concentrations and diffusion coefficients of RelA and c-Rel (Figures 4B and S10). Consistent with the expected nuclear translocation of most dimers containing RelA or c-Rel (the uncircled dimers labeled green or red in Figure 4A, right) after stimulation, the concentrations of both subunits were relatively higher in the cytoplasm of resting cells and in the nucleus of stimulated cells, (Figure 4B; see “limitations of the study” regarding the estimation of nuclear concentrations before TNF-α). The concentration of RelA was in the nanomolar range and higher in comparison with c-Rel in resting PEFs. Despite technical issues in quantifying absolute concentrations, the relative trends in FCCS/FCS are valid. These results call for a reassessment of current concepts about NF-κB dimers.
RelA and c-Rel expression trajectories in immune lineage development
Since both RelA and c-Rel proteins are fluorescently labeled at the endogenous loci in the green-red NF-κB DKI strain, these mice should also enable accurate quantification of their co-abundance without technical issues from staining with antibodies to intracellular or nuclear RelA and c-Rel. To demonstrate that a widely used method can provide such quantitative information for the hematopoietic system, we harvested bone marrow, spleen, thymus, and lymph nodes and performed multi-parameter flow cytometry analysis of immune cell subsets (Figures 5 and S11). Overall, RelA and c-Rel showed concordant relative patterns of expression across the immune lineages. Only the B cell population had a prominent bias toward a high c-Rel-to-RelA ratio. Granulocyte-monocyte progenitors (GMPs) had an extremely high level of both RelA and c-Rel abundance, far greater than the other populations.
Figure 5. RelA and c-Rel trajectory analysis along the hematopoietic lineages by flow cytometry shows stage-specific subunit abundance during immune cell differentiation.
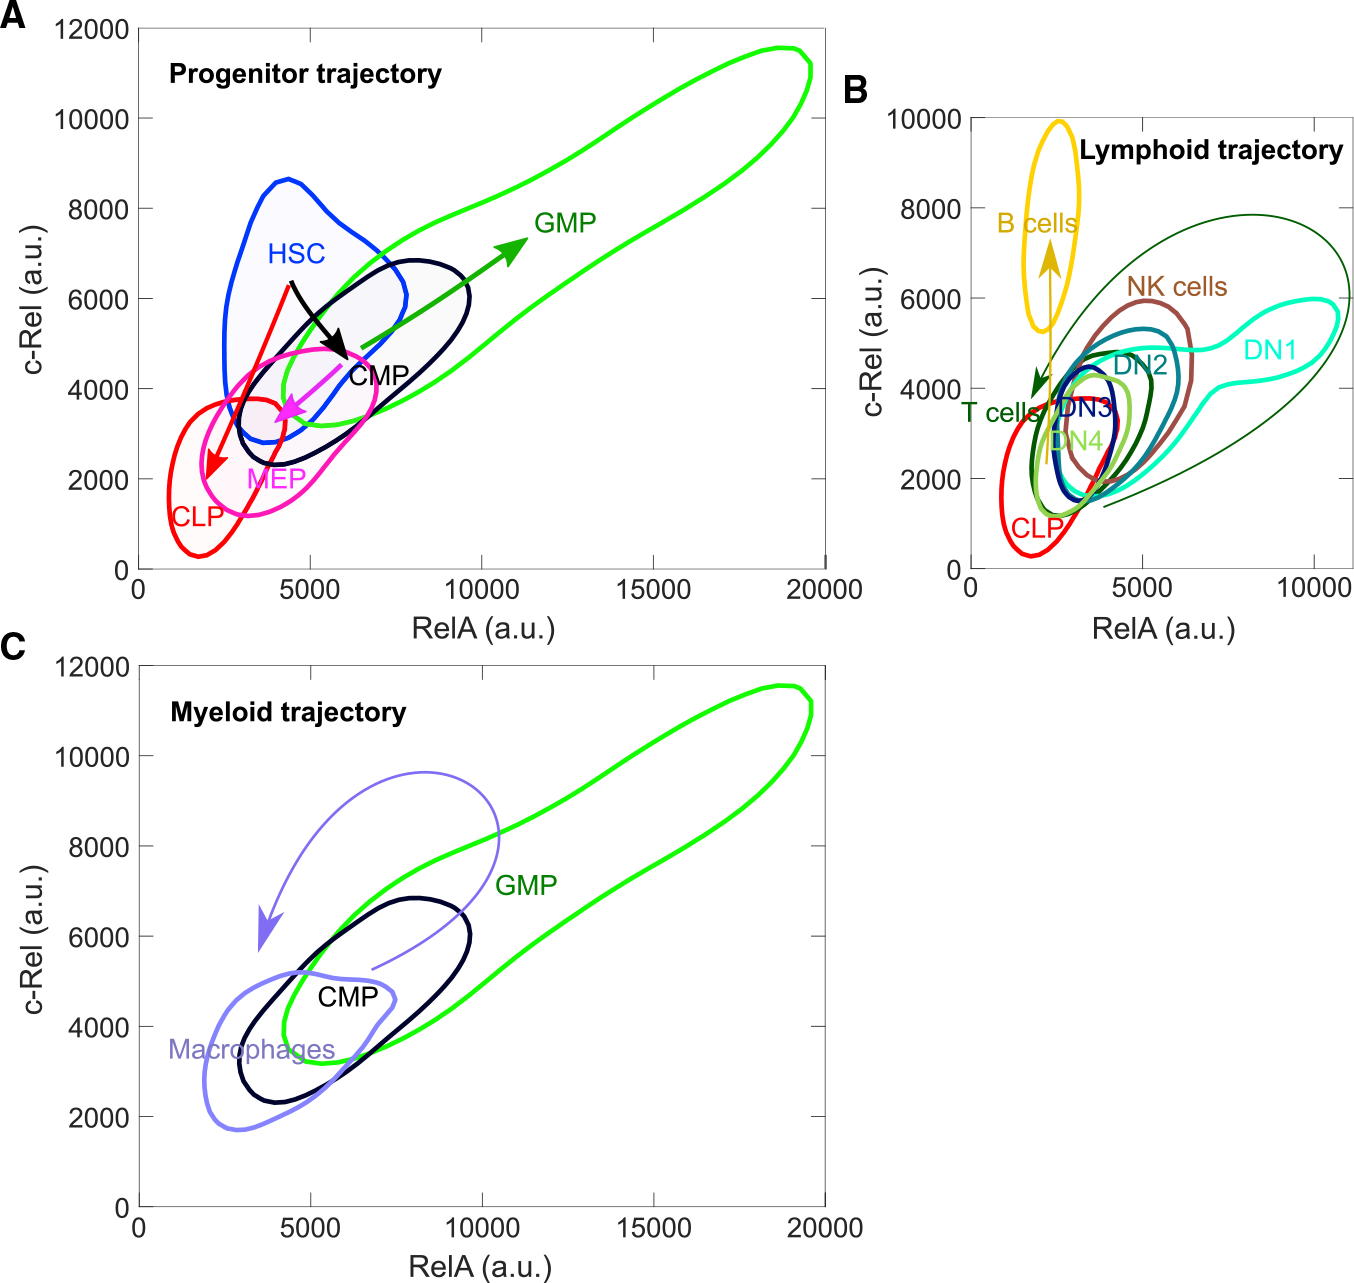
(A–C) Mean fluorescent intensities of mEGFP-RelA and mScarlet-c-Rel from flow cytometry measurements. Contours are plotted for each immune cell subset as the region containing 68.3% of data points from a non-parametric probability density estimation of raw data (using the MATLAB function ksdensity), which shows multiple cell subsets in a single plot. Arrows indicate the direction of the differentiation along the hematopoietic lineages. Trajectories from progenitor (A), lymphoid (B), and myeloid (C) populations are shown separately. HSC, hematopoietic stem cells; CLP, common lymphoid progenitors; CMP, common myeloid progenitors; GMP, granulocyte-monocyte progenitors; MEP, megakaryocyte-erythrocyte progenitors; DN1, -2, -3, -4, double-negative thymocytes 1–4; NK, natural killer. Fluorescent intensity scales are comparable across the panels without batch effects, as data were obtained from the same experiment. A representative dataset of three biologically independent experiments.
We initially expected an increase in the abundance of NF-κB subunit proteins as cells differentiate from multipotent progenitors, because fully mature cells are the effectors of the immune system and robust NF-κB action is required for their functional responses. Instead, we observed substantial decreases in NF-κB subunit expression at key maturation transition steps in some cell lineages. For example, the hematopoietic stem cell (HSC)-to-common lymphoid progenitor (CLP) or HSC-to-common myeloid progenitor (CMP)-to-megakaryocyte-erythrocyte progenitor transition coincided with a marked reduction of both RelA and c-Rel (Figure 5A). Taking advantage of the largely linear differentiation trajectory of early thymocytes, we chose to examine the thymic T cell progenitor populations DN1 through DN4. After an early transient rise from CLP leading to DN1, further differentiation showed downregulation from DN1 through DN4, then a further decrease in mature T cells (Figure 5B).
In contrast, for the B lineage, the abundance of c-Rel, but not RelA, dramatically increased from CLP to B cells, placing the latter as the highest c-Rel-expressing cells among mature immune cells in our analysis. The abundance of NF-κB proteins in mature T and B lymphocytes was independent of the peripheral source, spleen or lymph node (Figure S11), suggesting that expression of these proteins might be determined either before reaching the periphery or through a mechanism shared by the secondary lymphoid tissues. Meanwhile, the myeloid differentiation trajectory showed a transient increase of RelA and c-Rel from CMPs to GMPs, and a subsequent reduction during further maturation into macrophages (Figure 5C).
Live-cell imaging indicates c-Rel-dominated amplification of inflammatory NF-κB signaling in microglia from aged brains
A powerful aspect of the reporter animals is the ability to study NF-κB expression and signaling dynamics in a wide diversity of cell types, including those that have been intractable due to a lack of in vitro models. For a proof of principle, we chose to perform quantitative live-cell imaging of primary microglia, a brain-resident macrophage population, from green-red NF-κB DKI reporter mice (Video S4). The isolated cells comprised two distinct subpopulations distinguished by morphology and motility. The majority of microglia cells (85%) formed a tight cell cluster, which we termed “clustered microglia” (Figure 6A, dashed region). The clustered microglia had little or no mScarlet-c-Rel expression. The rest was a subpopulation of microglia with smaller cell size and high motility, termed “free-roaming microglia,” which express c-Rel and did not physically engage with the clustered microglia or other free-roaming microglia (Figure 6A, arrowheads). Both subpopulations were confirmed to have the microglial cell identity, expressing CD11b as well as the microglia-specific in vivo markers CX3CR1 and P2ry12, which are lost after a few weeks of in vitro culture.24 Given the clearly distinguishable properties, we sought to computationally automate the classification of the two subsets for a comparative quantitative analysis. After exploring cell size, morphology, and other features, we noted that the best separation could be accomplished based on the mean intensity of the DNA dye used for the segmentation of nuclear-cytoplasmic boundaries (Figures S12A–S12C). To find out whether the two microglia subsets are only observed in the reporter animals, we also isolated microglia from wild-type C57BL/6 mice. The existence of clustered microglia with lower mean DNA-dye intensities was confirmed in the wild-type animals, with a notable lack of proliferation as detected by Ki67 (Figure S13).
Figure 6. Quantitative live-cell imaging indicates c-Rel dominated amplification of inflammatory NF-κB signaling in microglia from aged brains.
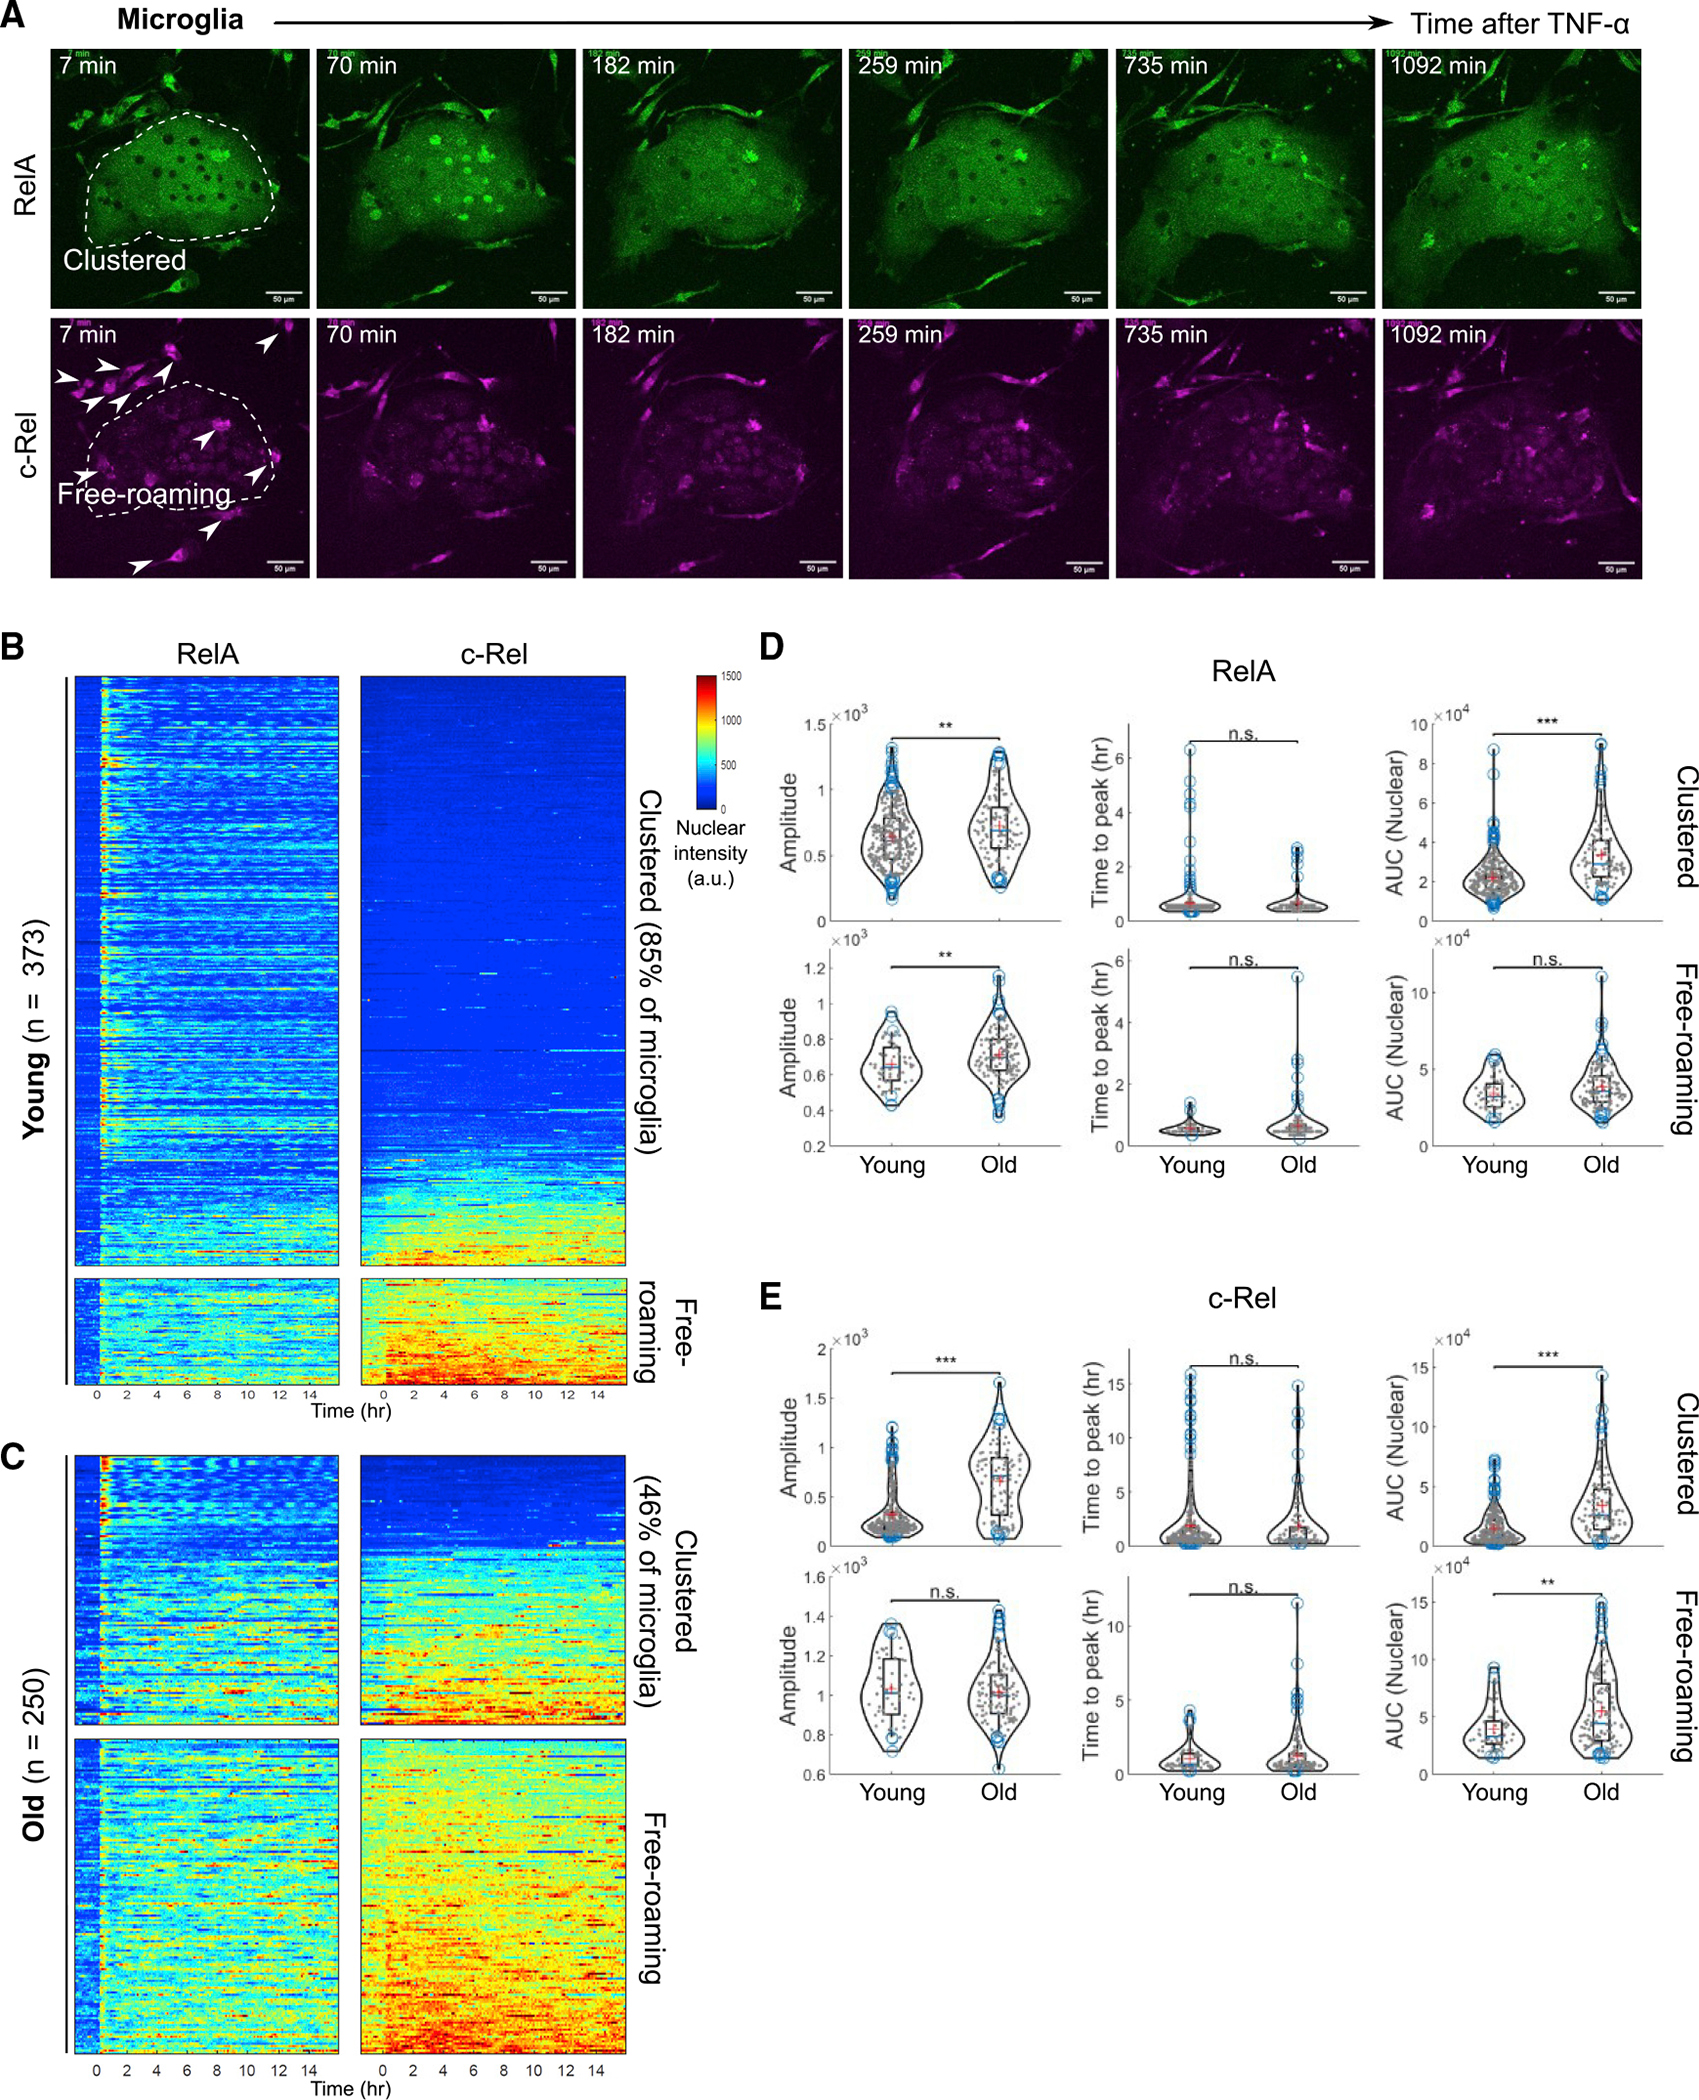
(A) Representative montage of RelA (green, upper panels) and c-Rel (magenta, lower panels) in primary microglia stimulated with TNF-α. Freshly isolated microglia were briefly cultured until they showed stably adherent morphology, in medium containing M-CSF and TGF-β to maintain cell identity. Clustered (within white dotted area) and free-roaming (white arrowheads) microglia are shown from the same field of imaging. Scale bars, 50 μm.
(B) Heatmaps of RelA and c-Rel responses to TNF-α stimulation in clustered (upper panels) and free-roaming (lower panels) primary microglia from young double knockin reporter mice (19 weeks of age). Data are representative of three biological replicates.
(C) Heatmaps of RelA and c-Rel responses to TNF-α stimulation in clustered (upper panels) and free-roaming (lower panels) primary microglia from old double knockin reporter mice (107 weeks of age). Data are representative of three biological replicates.
(D) Violin plots showing comparison of RelA signaling features between age groups for the clustered and free-roaming primary microglia. The red plus (+) sign denotes the mean and the blue bar denotes the median of data points. p values are calculated using the Mann-Whitney U test (**p < 0.001, ***p < 0.0001; n.s., not significant).
(E) Violin plots showing the comparison of c-Rel signaling features between age groups for the clustered and free-roaming primary microglia. The red plus (+) sign denotes the mean and the blue bar denotes the median of data points. p values are calculated using the Mann-Whitney U test (**p < 0.001, ***p < 0.0001; n.s., not significant).
Interestingly, the two microglia subsets showed different NF-κB RelA and c-Rel responses to TNF-α (Figure 6B). Clustered microglia had a higher amplitude of the first RelA peak but a faster attenuation and lower AUC of nuclear RelA intensity in comparison with free-roaming microglia (Figure 6B). Free-roaming microglia, with their characteristic expression of c-Rel, showed features of strong c-Rel signaling as well as more sustained RelA responses, as reflected by the AUC (Figures 6 and S12D).
Next, taking advantage of the wild-type aging phenotype of the reporter mice, we directly compared microglia isolated from young adults with those from old animals. The composition of clustered versus free-roaming subsets was shifted toward a higher prevalence of free-roaming microglia from old animals (Figures 6B and 6C). Furthermore, even among the clustered cells, a substantial proportion expressed c-Rel, in contrast to their young counterparts, and exhibited features of RelA and c-Rel signaling dynamics resembling those of free-roaming microglia (Figures 6C–6E and S12D). Taken together, we identified two distinct microglia subsets where the free-roaming, c-Rel expressing cells show a more sustained canonical NF-κB signaling, becoming the predominant subpopulation in aged brains.
DISCUSSION
Here, we showed that the endogenous NF-κB knockin reporter mice for RelA and c-Rel provide opportunities to study how these key transcription factors behave in primary cells ex vivo and in a tissue setting in vivo. Using these mouse strains, we report significant differences in signaling dynamics between primary and immortalized cells of the same tissue origin, emphasizing that experiments using engineered cell lines may not provide faithful models of physiological behaviors. Using cells isolated from lymphoid tissues of these mice, we find unexpected patterns of NF-κB protein expression as different cell lineages mature, with some such as T lymphocytes and some myeloid cells showing a surprising decrease in expression with terminal differentiation. FCCS measurements in cells from dual reporter mice provided evidence that RelA:c-Rel heterodimers do not play a substantial role in stimulus-induced gene transcription. Finally, analysis of isolated primary microglia cells from young and old animals revealed distinct subpopulations of microglia and changes in the behavior of NF-κB proteins with aging. Collectively, these findings indicate the value of these reporter animals.
Our endogenous knockin reporter mice can support studies in a wide range of research areas because they are free of detrimental baseline phenotypes. For all four endogenous knockin reporter lines and the double knockin reporter mice, the animals have normal development, health, and lifespan, indistinguishable from C57BL/6. These mice can provide primary cells from any tissue of interest, widening the avenue of quantitative live-cell dynamic analyses well beyond the relatively few immortalized reporter cell lines which have been employed so far. Moreover, the endogenous knockin reporter mice allow intravital imaging analyses with a signal-to-noise ratio above the autofluorescence background, despite the extremely low expression range of the endogenous RelA and c-Rel proteins.
Live-cell imaging of primary macrophages and fibroblasts from the DKI reporter mice showed important differences in NF-κB signaling dynamics from previous studies using immortalized fluorescent fusion-expressing cell lines.6,11,12,16,18,19,34 Such differences may arise during the serial passaging of in vitro cultures as well as from the immortalization process itself. We note that the IEFs were generated directly from our reporter mice and did not go through propagation and passages across multiple labs as do commonly used cell lines. The underlying mechanisms that distinguish the primary versus immortalized cells of the same tissue may involve receptor abundance, concentrations of signaling proteins and inhibitory proteins, metabolic states, chromatinscapes, and autocrine/paracrine factors of the microenvironment. Moreover, the relevant alterations may depend on the tissue type. Regardless of the possible causes, our findings call for a reassessment of the response timing, duration, amplitude, and other ligand- and tissue-specific features of NF-κB signaling elicited by host or microbe-derived inflammatory stimuli. Live-cell analysis of the DKI reporter mice also revealed the inter-relationship between RelA and c-Rel signaling features through correlation matrix analysis, which has been impossible with other methods.
The same-cell analysis of microglia RelA and c-Rel dynamics was crucial for the identification of microglia subpopulations distinguishable based on morphology, c-Rel expression, and features of TNF-α-induced RelA and c-Rel signaling dynamics. Further in vivo validation would be necessary to understand the functional significance of the observation that the microglia from aged brains had skewed subset compositions toward c-Rel-dominant amplification of NF-κB signaling. These results represent a cogent example of how the knockin reporter mice can be used to approach critical questions that could not be addressed using pre-existing models. One such avenue is investigating the mechanisms involving NF-κB in chronic inflammatory states during organismal aging in vivo, given the role of NF-κB in amplifying and propagating cellular senescence through promotion of a senescence-associated secretory phenotype.
Antibody-free flow cytometry quantification of NF-κB subunits reveals that the abundance of the two subunits follows a line-age-specific trajectory with the surprising reduction of NF-κB proteins at distinct differentiation stages. The earliest downregulation occurs when HSCs produce the progenitors of lymphoid and myeloid cells. Thereafter, the trajectory may go up or down depending on the specific lineage. The CLP cells entering the thymus seem to upregulate both RelA and c-Rel until the highest point at the DN1 stage. One possibility is that the pathways (such as pre-T cell receptor (TCR)/Akt/protein kinase B or TNF receptor)40 that the thymocytes need for survival may be relatively inefficient in activating NF-κB in comparison with the full TCR signaling established later at DN4. To compensate for the inefficiency, DN1 cells may rely on the general abundance of NF-κB proteins.
Surprisingly, the overall trend that most cells follow during differentiation is settling at a low-expression regime in mature cells, with the exception of B cells. This suggests that fully mature immune effector cells do not require a high concentration of NF-κB RelA and c-Rel subunits for their functions, even though they depend on NF-κB signaling for antigen/ligand recognition, proliferation, and further effector polarization. For example, the DN3-to-DN4 transition coincides with pre-TCR/NF-κB signaling and proliferation,41 yet shows a slight downward trend in RelA and c-Rel expression. The downregulation observed in some stages may result from cell-division-associated dilution of protein concentrations, given the long half-life of NF-κB proteins. Another interesting observation was that a fraction of HSCs has a slightly higher c-Rel abundance. Given that HSCs have the lowest protein synthesis rate among bone marrow cells42 and NF-κB proteins are generally long-lived,43 the protein turnover of NF-κB may be extremely low in HSCs. It will be important to examine the relatively elevated c-Rel expression and how the low turnover may affect molecular function of NF-κB in aged HSCs.
The dosage of NF-κB has not been widely considered as a lineage-determining factor, with few studies so far focusing on the tolerated range that supports each immune cell developmental stage. However, there have been some indications that certain T lymphocyte differentiations require a narrowly defined range of NF-κB expression and signaling.44 The abundance trajectory revealed in our double knockin mice suggest that such tight regulation may have a broader role in immune cell development.
The fluorescence spectroscopy analyses revealed insights about molecular properties of NF-κB proteins in living cells. This is a convincing demonstration of the existence of the RelA:c-Rel heterodimer, albeit as a small fraction of the total NF-κB dimer species. Existing data have been obtained from biochemical, computational, and genetic studies, mostly about RelA:p50 and c-Rel:p50 heterodimers, RelB:p52 heterodimers, RelA homodimers, c-Rel homodimers, p50 homodimers, or p52 homodimers. Except for the p50 or p52 homodimers that lack the transactivation domain, these dimers are thought to activate transcription of target genes. Few data or predictions had been generated regarding the RelA:c-Rel heterodimer. Our FCCS data showed that stimulated cells had a surprising reduction of RelA:c-Rel heterodimers in the nucleus. The significance of this behavior and impact on gene regulation will need to be examined by future studies.
There are other avenues where our endogenous knockin reporter mice can be harnessed to facilitate previously difficult experimentation (Table 1). Crossbreeding to existing reporters of transcription factor or cytokine expression would be feasible, owing to the flexible choice of fluorescent protein in the panel of single knockin reporter lines. With the advent of technologies combining methods with complementary advantages such as image-enabled cell sorting45 and live-cell RNA sequencing,46 the NF-κB endogenous knockin reporter mice will find even broader uses than demonstrated here in immunology, inflammatory conditions, and mammalian aging. The diverse insights gained from our initial experiments hint that much remains to be understood about how NF-κB operates to exert its biological impact in vivo and during organismal aging.
Limitations of the study
A general issue in any fluorescence-based cellular readout is autofluorescence, which may affect the quantification of mEGFP or mScarlet intensities from certain cell types in our knockin mice. While we observed a clear separation of the mEGFP-RelA signal in the examined cells and tissues, specific physiological conditions may produce increased autofluorescence.47 We have adjusted the excitation and acquisition parameters to minimize the impact of autofluorescence in the quantified data from the cell types used here. When optimizing imaging parameters for a different cell type, we recommend that the autofluorescence in each acquired imaging channel should be assessed using the corresponding cell types from age-/sex-matched wild-type C57BL/6 mice.
It is unclear which processes underlie the apparent depletion of the RelA:c-Rel heterodimer in the nucleus. The FCCS analysis does not distinguish between scenarios of active reverse translocation of the dimer (out of the nucleus) versus subunit exchange and a consequent compositional change of the dimer repertoire. For example, selective degradation of specific IκB proteins may induce reorganization of RelA and c-Rel into different dimer or larger protein complexes in stimulated cells. Regardless of the mechanisms involved, the depletion may potentially support functional gene regulation. For example, the dimer may be transcriptionally repressive at certain loci, allowing their derepression following stimulus. Further studies will be required to resolve these possibilities.
Even though FCS is better suited for low-abundance molecules in comparison with other assays such as FRET, technical issues in the FCS model fitting make it difficult to estimate the absolute concentrations in the extremely low range with high confidence. This may have affected the estimation of nuclear RelA or c-Rel concentrations before stimulation and, consequently, the rather modest difference between stimulated and resting cells. Complementary techniques would be necessary for more accurate estimates of low absolute concentrations.
STAR★METHODS
Detailed methods are provided in the online version of this paper and include the following:
RESOURCE AVAILABILITY
Lead contact
Further information and requests for resources and reagents should be directed to and will be fulfilled by the lead contact, Myong-Hee Sung (sungm@nih.gov).
Materials availability
The NF-κB single or double knock-in reporter mice are available upon completion of a Material Transfer Agreement according to the NIH guidelines.
Data and code availability
Microscopy data reported in this paper will be shared by the lead contact upon request.
All original code has been deposited and is publicly available at https://github.com/Toufiq54/LiveCell_NFkB.git. The download link is also listed in the key resources table.
Any additional information required to reanalyze the data reported in this paper is available from the lead contact upon request.
KEY RESOURCES TABLE.
| REAGENT or RESOURCE | SOURCE | IDENTIFIER |
|---|---|---|
|
| ||
| Antibodies | ||
|
| ||
| Anti-c-Rel Antibody (B-6) Alexa Fluor® 488 | Santa Cruz | sc-6955 AF488; RRID:AB_670194 |
| APC anti-mouse CD117 (c-Kit) | Biolegend | Cat#105812, Clone 2B8; RRID:AB_313221 |
| PE/Cyanine7 anti-mouse Ly-6A/E (Sca-1) | Biolegend | Cat#122513, Clone E13-161.7; RRID:AB_756198 |
| APC/Cyanine7 anti-mouse CD16/32 | Biolegend | Cat#156611, Clone S17011E; RRID:AB_2800709 |
| PerCP/Cyanine5.5 anti-mouse CD34 | Biolegend | Cat#128607, Clone HM34; RRID:AB_1279222 |
| APC anti-mouse CD19 | Biolegend | Cat#152409, Clone 1D3/CD19; RRID:AB_2629838 |
| PE/Cyanine7 anti-mouse/human CD45R/B220 | Biolegend | Cat#103221, Clone RA3-6B2; RRID:AB_313004 |
| Pacific Blue™ anti-mouse CD3 | Biolegend | Cat#100214, Clone 17A2; RRID:AB_493645 |
| PerCP/Cyanine5.5 anti-mouse CD49b | Biolegend | Cat#108915, Clone DX5; RRID:AB_1595599 |
| Pacific Blue™ anti-mouse Lineage Cocktail | Biolegend | Cat#133306, Clone 17A2, RB6-8C5, RA3-6B2, Ter-119, M1/70; RRID:AB_11126978 |
| BV711 Rat Anti-Mouse CD44 | BD Biosciences | Cat#563971, Clone IM7; RRID:AB_2738518 |
| APC-R700 Rat Anti-Mouse CD25 | BD Biosciences | Cat#565135, Clone PC61 |
| APC Rat Anti-Mouse CD4 | BD Biosciences | Cat#561091, Clone RM4-5; RRID:AB_10562037 |
| PerCP/Cyanine5.5 anti-mouse CD8a | Thermo Fisher Scientific | Cat#45-0081-82, Clone 53-6.7; RRID:AB_1107004 |
| Ki-67 rat monoclonal antibody (SolA15), eBioscience | ThermoFisher Scientific | Cat#14-5698-82; RRID:AB_10854564 |
| P2RY12 recombinant rabbit monoclonal antibody (4H5L19) | ThermoFisher Scientific | Cat#702516; RRID:AB_2689476 |
| Goat anti-rat IgG (H + L) cross-adsorbed secondary antibody, Alexa Fluor 488 | ThermoFisher Scientific | Cat#A-11006; RRID:AB_141373 |
| Goat anti-rabbit IgG (H + L) highly cross-adsorbed secondary antibody, Alexa Fluor 594 | ThermoFisher Scientific | Cat#A-11037; RRID:AB_2534095 |
| Anti-NF-kB p65 antibody | Santa Cruz Biotechnology | Cat#sc-372; RRID:AB_632037 |
| Anti-I kappa B alpha antibody | Santa Cruz Biotechnology | Cat#sc-371; RRID:AB_2235952 |
| Anti-Rho-GDI antibody | Sigma-Aldrich | Cat#R3025; RRID:AB_261317 |
| HRP-conjugated Donkey Anti-Rabbit IgG | GE Healthcare | Cat#NA934V; RRID:AB_772206 |
|
| ||
| Biological samples | ||
|
| ||
| Primary ear fibroblast G/R cells | ||
| Primary bone marrow-derived macrophage (BMDM) G/R cells | ||
| Primary microglia G/R cells | ||
| Primary cells from Thymus, Spleen, Lymph nodes and Bone marrow | ||
|
| ||
| Chemicals, peptides, and recombinant proteins | ||
|
| ||
| MEGAshortscript™ T7 Transcription Kit | Thermo Fisher Scientific | AM1354 |
| MEGAclear™ Transcription Clean-Up Kit | Thermo Fisher Scientific | AM1908 |
| CleanCap® Cas9 mRNA | TriLink Biotechnologies | L-7606 |
| Lipopolysaccharide from Salmonella | Enzo | ALX-581-008-L001 |
| rmTNF-a (aa 80-235) | R & D Systems | 410-MT-010 |
| SPY 650 DNA | Cytoskeleton Inc | CY-SC 501 |
| Mouse adult brain dissociation kit | Miltenyi Biotec | Cat#130-107-677 |
| Percoll | GE Healthcare | Cat#17-0891-01 |
| PBS | Gibco | Cat#10010023 |
| DMEM/F-12 media | Gibco | Cat#21041025 |
| Recombinant Mouse M-CSF Protein | R&D Systems | Cat#416-ML-010 |
| Recombinant Human TGF-beta 1 Protein | R&D Systems | Cat#240-B-010 |
| Paraformaldehyde | Sigma-Aldrich | Cat#158127 |
| Goat serum | Sigma-Aldrich | Cat#G9023 |
| Triton X-100 | Sigma-Aldrich | Cat#T8787 |
| BSA | Sigma-Aldrich | Cat#A8806 |
| Sodium azide | Acros organics | Cat#19038-1000 |
| Prolong gold antifade mountant with DAPI | ThermoFisher Scientific | Cat#P36931 |
| Cycloheximide | Sigma-Aldrich | Cat#01810 |
| RIPA cell lysis buffer | Millipore | Cat#20-188 |
| NuPAGE 4–12% Bis-Tris Gel | Invitrogen | Cat#NP0321 |
| NuPAGE MOPS SDS running buffer | Life technologies | Cat#NP0001 |
|
| ||
| Experimental models: Cell lines | ||
|
| ||
| Immortalized ear fibroblast G/R cells | This paper | |
|
| ||
| Experimental models: Organisms/strains | ||
|
| ||
| C57BL/6Ncrl mice | Charles River Laboratories | RRID:IMSR_CRL:027 |
| B6D2F1 mice | Charles River Laboratories | RRID:IMSR_CRL:099 |
| Double knock-in G/R mice | This paper | |
|
| ||
| Recombinant DNA | ||
|
| ||
| mEGFP-RelA dsDNA donor plasmid | Genewiz | Custom made: https://www.genewiz.com/ |
| mScarlet-c-Rel dsDNA donor plasmid | Genewiz | Custom made: https://www.genewiz.com/ |
|
| ||
| Software and algorithms | ||
|
| ||
| MATLAB | MathWorks | |
| ImageJ (Fiji) | National Institute of Health | |
| Imaging data quantification and analysis code | This paper | https://github.com/Toufiq54/LiveCell_NFkB.git |
| FlowJo Ver.10 | BD Biosciences | https://www.flowjo.com |
| ANY-Maze Ver. 7.1 | Stoelting | Cat#60000 |
| Video Freeze Ver. 3.01 | MED-Associates | Cat#SOF-843 |
|
| ||
| Other | ||
|
| ||
| Cell strainers | Fisher Scientific | Cat#22-363-548 |
| Grip strength meter | Bioseb | Cat#BIO-GS3 |
| Mouse fear conditioning chamber | MED-Associates | Cat#MED-VFC-USB-M |
EXPERIMENTAL MODEL AND SUBJECT DETAILS
Mice
The mEGFP-RelA knock-in (KI) mice were generated by inserting the mEGFP coding sequence (without stop codon) after the start codon (ATG) of Rela at the endogenous locus using CRISPR/Cas9 editing technology. Briefly, specific sgRNAs targeting the proximity region of Rela start codon were designed using the online tool MIT CRISPR Design (crispr.mit.edu) and generated in vitro using MEGAshortscript T7 transcription kit (Thermo Fisher Scientific). sgRNAs were purified using MEGAclear kit (Thermo Fisher Scientific). A double strand (ds) DNA donor template (~7 kb) containing the mEGFP fusion sequence was obtained from Genewiz (genewiz. com). Cas9 mRNA (100 ng/μL, TriLink Biotechnologies), sgRNAs (50 ng/μL) and dsDNA donor template (3 ng/μL) were microinjected into one-cell stage zygotes obtained from C57BL/6Ncr × B6D2F1/J mice to generate mEGFP-RelA KI animals. The mScarlet-c-Rel KI mice were generated with a similar approach, using a DNA donor template containing mScarlet fusion sequence and sgRNAs targeting the endogenous region proximal to the start codon of Rel.
Founders were screened by isolating fibroblasts from tail clips and checking for nuclear translocation of fluorescent fusion protein after TNF-α stimulation by live-cell imaging. The selected animals were genotyped and backcrossed to C57BL/6 for two generations.
All animals were bred and maintained under specific pathogen-free conditions at the animal facility of National Institute on Aging. All the animal care and procedures in this study were carried out in accordance with the guidelines of NIH and approved by the NIA Animal Care and Use Committee.
Primary ear fibroblast culture
The primary fibroblast cells were isolated from an ear of homozygous green-red DKI mice at 9–12 weeks age. After enzymatic dissociation of ear tissue, cells were cultured in growth media (DMEM with 10% FBS, 1% penicillin, streptomycin, and glutamine) for 1–2 weeks. Cells were re-plated in fibronectin-coated imaging dish 24 h before the live-cell imaging experiment. One hour after the start of live-cell imaging experiment, cells were stimulated with lipopolysaccharide (LPS, Enzo Life Science), or with murine TNF-α (R&D Systems, Cat#410-MT-010).
Immortalization of ear fibroblasts
Primary ear fibroblasts were cultured in regular growth media (DMEM with 10% FBS, 1% penicillin, streptomycin, and glutamine) and passaged every 3 days for 20–25 rounds. In late passages, the cell division became more active, and the cell size was reduced. When the cells reached immortalization, cell cultures were confluent within 3 days when re-plating was done at 1:10 ratio.
Primary BMDM culture
Bone marrow-derived macrophages (BMDMs) were obtained by culturing the bone marrow monocytes from femurs of homozygous green-red DKI mice (9–12 weeks age) in M-CSF containing media for 6 days. BMDMs were re-plated in fibronectin-coated glass-bottom μ-Slide 8-well high (ibidi) on day 6. Coated glass-bottom surface was prepared by incubating 5 μg/cm2 plasma fibronectin (Fisher Scientific, cat# FC010) for 1hr at 37°C. The next day, BMDMs were stimulated with 10 ng/mL of lipopolysaccharide (LPS, Enzo Life Science) or murine TNF-α (R&D Systems, Cat#410-MT-010).
Isolation and culture of microglia
Microglia were isolated following the protocol described elsewhere.47 Briefly, whole brains were isolated from animals after euthanization following institutional regulations. Tissue dissociation was executed using Miltenyi Biotec’s mouse adult brain dissociation kit (#130-107-677) according to the manufacturer’s protocol. Microglia were purified by suspending the cell pellet in 5 mL of a room temperature (RT) 70% isotonic Percoll solution, which was carefully overlaid with 5 mL of 37% RT Percoll solution in a 15 mL tube. This Percoll suspension was centrifuged at 800g for 25 min at RT without brake. Enriched microglial population was collected carefully from the interphase of 37%/70% Percoll suspension. The collected cells were washed twice before being cultured in DMEM-F12 media with M-CSF (10ng/ml) and TGF-β (50ng/ml). The media was replenished after 3 days of culture. Culture media was supplemented with 10% FBS and penicillin/streptomycin (1,000 units/ml/1,000 μg/mL). The cells were subjected to either live-cell imaging or immunostaining at day 7.
METHOD DETAILS
Behavior testing
Mice were habituated to general handling at least three days prior to testing.
Grip strength was tested using a metal T-bar horizontally affixed to a grip strength meter (Bioseb; Pinellas Park, FL). The maximum value obtained from 5 trials per day was recorded on two days, with corresponding values averaged.
Spontaneous alternation was assessed in a custom-built opaque Plexiglas Y-maze (Total Plastics International; Baltimore, MD) with 30 × 5 cm arms extending at 120° angles from one another. During a 10-min trial, arm entries were automatically detected by overhead camera and ANY-Maze software (Stoelting; Wood Dale, IL). Each arm entry was scored as an alternation if it and the two preceding arm entries were all to unique arms. Alternation rate was calculated by the formula (# alternations)/(# arm entries – 2). Repeat entries to the same arm were excluded in analysis; thus, a rate of 50% indicated random chance. One aged male mScarlet-c-Rel mouse was excluded from analysis due to low exploration (3 arm entries vs population-wide average 28.1 ± 1.5).
Fear conditioning was performed and scored using an automated camera-based system (MED-Associates). Mice were placed in the chamber for a 2 min habituation period before receiving two 2-s, 0.5mA unsignaled scrambled footshocks separated by 60 s. Mice were removed from the chamber 60 s after the last footshock. The next day, mice were placed in the chamber for 5 min.
Tissue pathology
Young and old animals from single and double knock-in strains were sent for pathology analyses at the Division of Veterinary Resources, NIH. Animals were selected from both sexes. We also included animals with spontaneous sickness conditions. Gross necropsy analysis was followed by detailed tissue histopathology of any tumor or lesion, brain, heart, lung, liver, kidneys, spleen, lymph nodes, and thymus.
Tissue collection and flow cytometry analysis
Thymus, spleen, lymph nodes, and bone marrow were harvested and processed into single cell suspensions for flow cytometry analysis by following standard protocols. Bone marrow cells were harvested from the tibia and femur of the animals and processed further accordingly. Cells were incubated with Fc block (CD16/32, BioLegend, San Diego, CA) followed by staining with antibodies. The cells were fixed with 1% paraformaldehyde and flow cytometry was performed on FACS Canto II (BD Biosciences). The data were analyzed using FlowJo (TreeStar, Ashland, OR). The following antibodies were purchased from BioLegend: APC anti-mouse c-Kit (2B8), PE/Cyanine7 anti-mouse Sca-1 (E13-161.7), APC/Cyanine7 anti-mouse CD16/32 (S17011E), PerCP/Cyanine5.5 anti-mouse CD34 (HM34), APC anti-mouse CD19 (1D3/CD19), PE/Cyanine7 anti-mouse/human CD45R/B220 (RA3-6B2), Pacific Blue anti-mouse CD3 (17A2) and PerCP/Cyanine5.5 anti-mouse CD49b (DX5). The LIN cocktail was conjugated with Pacific Blue and contained anti-mouse CD3 (17A2), anti-mouse Ly-6G/Ly-6C (RB6-8C5), anti-mouse CD11b (M1/70), anti-mouse CD45R/B220 (RA3-6B2), anti-mouse TER-119/Erythroid cells (Ter-119). We used BV711 Rat Anti-Mouse CD44 (IM7), APC-R700 Rat Anti-Mouse CD25 (PC61) and APC Rat Anti-Mouse CD4 (RM4-5) antibodies from BD Biosciences (San Jose, CA). PerCP/Cyanine5.5 anti-mouse CD8a antibody was procured from eBioscience, Thermo Fisher Scientific, Inc.
Western blotting
BMDMs were generated from either C57BL/6 or mEGFP-RelA knock-in reporter mice. The cells were then treated with different concentrations of cycloheximide (Sigma, 01,810) and harvested at 1, 3, and 6 h post treatment. Cells without cycloheximide treatment served as a control. Whole cell extracts per condition were prepared in ice-cold RIPA cell lysis buffer (Millipore, 20–188). Cell lysates were centrifuged at 13,000 rpm for 20 min at 4°C and equal amounts of protein were resolved with a 4 to 12% Bis-tris Gel/MOPS running buffer system (Invitrogen), and then transferred to nitrocellulose membranes. The membranes were analyzed by Western blotting with the following antibodies: rabbit anti-NF-κB p65 (sc-372), rabbit anti-IκB-α (sc-371), rabbit anti-Rho-GDI (Sigma, R3025) and horseradish peroxidase (HRP)-conjugated donkey anti-rabbit secondary antibody (GE Healthcare, NA934V).
Immunofluorescence
Primary microglia cells at day 7 of culture were fixed with 4% paraformaldehyde (Sigma) for 30 min at room temperature and washed with PBS (Gibco). The fixed cells were permeabilized and blocked with blocking solution (5% goat serum (Sigma) in PBS containing 0.3% Triton X-100 (Sigma)) for 1 h at room temperature. Then they were probed with primary antibodies (Ki-67, 1:100, eBioscience 14-5698-82; P2RY12, 1:500, Invitrogen 702,516) overnight at 4°C, washed with PBS, and followed by incubation with fluorochrome-conjugated secondary antibodies (Alexa Fluor 488 A-11006 and 594 A-11037, 1:500, Invitrogen, respectively) for 1 h at room temperature. Samples were washed with PBS and mounted on glass coverslips no. 1 (Electron Microscopy Sciences 72,195-15) using Prolong gold antifade reagent with DAPI (Invitrogen). A confocal laser scanning microscope (Carl Zeiss LSM880) was used to acquire images with a multi-track configuration.
For c-Rel immunostaining time-series experiment, PEFs isolated from young wild-type C57BL/6 (age: 17 weeks, sex: F) or mScarlet-c-Rel knock-in mouse (age: 13 weeks, sex: M) were plated in 8-well imaging dish. 24 h later, cells were stimulated with 10 ng/mL LPS and fixed with 4% Paraformaldehyde at 0, 1, 2, 3, 4 h after stimulation. Fixed cells were stained with Anti-c-Rel antibody (B-6) Alexa Fluor 488 (Santa Cruz Biotecnology) at 1:200 dilution and imaged using Zeiss LSM880 confocal microscope with Airyscan detector. Cells were stained with nuclear dye SPY650-DNA (Cytoskeleton Inc) (1 ug/ml) before imaging.
Fluorescence cross-correlation spectroscopy
Primary ear fibroblast cells were plated in fibronectin-coated glass-bottom μ-Slide 8 Well high chambered coverslip (ibidi). 24 h after cell plating, the samples were taken for FCCS experiment. Two-color FCCS experiments were performed for both nuclear and cytoplasmic compartments in each cell. Each FCCS experiment was performed for 10 s with 3 technical repeats on the same spot. The experiments were performed using Zeiss LSM880 Airyscan/FCS confocal microscope system with environmental control. The mEGFP was excited with the 488-nm Argon laser line and the mScarlet was excited with the 561-nm DPSS laser line. The C-Apochromat, 40x, 1.2 NA water-immersion objective was used for all the experiments. The emission signal was split by a dichroic mirror MBS 488/561/633 and detected at 505–530 nm for mEGFP and 570–600 nm for mScarlet using the GaAsP PMT array detector. The confocal pinhole was set for 1.0 airy unit (approximately 0.8756 and 1.33 fL for 488 nm and 561 nm) for both channels calibrated in the x-y plane for maximum signal intensity.
Live-cell microscopy
Primary cells from NF-κB green-red double knock-in reporter mice were plated in fibronectin-coated glass-bottom μ-Slide 8-well high imaging chamber (ibidi, Cat# 80806) and cultured for 24 h in phenol red free DMEM/F-12 (Gibco, Cat# 21041025) supplemented with 10% FBS, 1% penicillin, streptomycin, and glutamine. Cells were stained with SPY650-DNA dye (1× or 1.5× of recommended dilution, molarity not indicated by manufacturer) one hour before the live-cell imaging experiment. Cells were then placed in a Zeiss LSM880 Airyscan AxioObserver confocal microscope system with incubation, and were maintained at 37°C in a humidified environment containing 5% CO2. Cells were incubated about 1–2 h before the live-cell imaging experiment started. Time-lapse images were acquired at 7-min intervals for a time course of ~12.5 h (150 frames). Excitation laser wavelengths were 488 for EGFP, 561 nm for mScarlet, and 633 nm for SPY650-DNA dye. Fluorescence signals were detected using Airyscan detector. Imaging parameters were: a 40×/1.4 NA Plan-Apochromat oil objective, pinhole size 5.16 AU, 4.60 AU, and 4.07 AU for mEGFP, mScarlet, and SPY650-DNA, respectively. Frame scan mode, 0.6 scan zoom, 2.06 μs pixel time, line time 30.00 μs, frame time 1.90 s, unidirectional scan direction, 12 bit, 512 × 512 image size. The detector and digital gains are 960.5, 850.0, 760.0 and 1.0, 1.4, 1.2 for mEGFP, mScarlet, and SPY650-DNA, respectively. Images were saved in.czi file and later converted to.tiff for further analysis.
Intravital microscopy
Ear skin epidermis
Two-photon imaging was conducted as described previously.48 Mice between 7 and 8 months of age were anesthetized with vaporized isoflurane administered in a chamber, then maintained throughout the experimental course via a nose cone while placed on a warming pad. Skin on the ear was depilated, then secured on a mounting spatula with a coverslip. Three dimensional stacks were acquired in 1-μm steps along the z axis using a LaVision TriM Scope II (LaVision Biotec) microscope equipped with a Chameleon Vision II (Coherent) 2-photon laser (excitation 940 nm) through a Nikon 40×/1.15 water immersion objective. Image processing was conducted using ImageJ (NIH Image).
Peritoneal wall
Two-photon microscopy of the peritoneal subserosa was performed as previously described.49 Mice were anesthetized with isoflurane, the parietal peritoneal wall was exposed through a midline incision, and sterile, pre-warmed HBSS buffer containing 0.2 μg anti-CD88 Alexa Fluor 594 (Biolegend; clone 20/70) was applied to the tissue surface after it had been mounted on a special base plate. After a 10-min rest period, 100 ng of LPS in HBSS was applied topically to the peritoneal serosa before a sterilized coverslip was placed on the surface. Immediately afterward, dynamic imaging was started on a Zeiss 710 microscope equipped with a femtosecond pulsed Chameleon laser (Coherent) and a 20× water immersion objective (NA 1.0, Zeiss). Data were acquired at a resolution of 512×512 (16 bits) in batches of 12 images, each 3 mm apart, at a frame rate of 968 ms using ZEN software (Zen 2012; Zeiss). For imaging, the laser was set to 930 nm with a power of approximately 80 mW and the following filter cubes were used: GFP (565DCXR, 525/50; Zeiss), Alexa Fluor 594 (565DCXR, 575–640; Zeiss), SHG (495DCLP, 447/60; Zeiss). Raw imaging data were processed and analyzed with Imaris (Bitplane).
QUANTIFICATION AND STATISTICAL ANALYSIS
Specific method details about statistical tests, number of analyzed cells or animals, p value thresholds, definition of error bars, etc. are described in the legends of the corresponding figures. We employed non-parametric statistical methods (e.g. permutation tests) whenever possible to avoid introducing assumptions about the data distributions.
Fluorescence cross-correlation spectroscopy data analysis
The effective observation volumes were calculated using the following equation:
The auto-correlation and cross-correlation curves for mEGFP and mScarlet were obtained by the Levenberg-Marquardt algorithm used in the open-source browser-based software package.50 A simplest 2D diffusion model with no triplet anomaly was used to fit the experimental data. Because we used low laser powers for both the mEGFP and mScarlet channels, the blinking component was neglected in the fit. From the fitted data and effective observation volume information, the concentrations of mEGFP-RelA and mScarlet-c-Rel were calculated.
Quantitative analysis of time lapse imaging
The live-cell microscopy images were analyzed to obtain the single-cell signaling measurements using custom-written MATLAB script (MATLAB 2020b). In brief, acquired.czi files were first converted to.tif files for all positions and channels. The nuclear area of individual cells was segmented using the SPY650-DNA nuclear dye channel images. The cellular area was segmented using either the mEGFP or the mScarlet channel. Segmented cells were tracked across successive images using the lineage mapper tracking tool.51 Then, nuclear, cytosolic, and total fluorescence intensities were calculated from the background-subtracted images for both mEGFP and mScarlet channels. The cells coming in or going out from the field of view, along with apoptotic or dividing cells, were excluded from the analysis. The analysis codes are available upon request.
Supplementary Material
Highlights.
NF-κB double knockin mice have fluorescently labeled RelA and c-Rel
Live imaging reveals single-cell signaling features unique to primary cells
NF-κB signaling shifts toward c-Rel in brain-resident microglia from aged animals
RelA and c-Rel protein expression is reduced during specific immune cell maturations
ACKNOWLEDGMENTS
We thank Theodorus Gadella Jr. for sharing the mScarlet plasmid, Deborah Swing for the microinjections, Sayantan Chakraborty for an early testing of reporter mice, Mary Ellen Palko for technical help with southern blotting, and Amit Singh and Christopher Dunn for technical support with flow cytometry. All the animal care and housing were provided by the Comparative Medicine Section of the National Institute on Aging. Tissue pathology and histology analyses were provided by Michael Eckhaus at the Division of Veterinary Resources, Office of Research Services at NIH. This research was supported by the National Institutes of Health Intramural Research Program at the National Cancer Institute, the National Institute of Allergy and Infectious Diseases, and the National Institute on Aging.
Footnotes
DECLARATION OF INTERESTS
The authors declare no competing interests.
INCLUSION AND DIVERSITY
One or more of the authors of this paper self-identifies as an underrepresented ethnic minority in their field of research or within their geographical location. One or more of the authors of this paper self-identifies as a gender minority in their field of research.
SUPPLEMENTAL INFORMATION
Supplemental information can be found online at https://doi.org/10.1016/j.celrep.2022.111682.
REFERENCES
- 1.Hayden MS, and Ghosh S (2008). Shared principles in NF-kappaB signaling. Cell 132, 344–362. 10.1016/j.cell.2008.01.020. [DOI] [PubMed] [Google Scholar]
- 2.Hayden MS, and Ghosh S (2012). NF-kappaB, the first quarter-century: remarkable progress and outstanding questions. Genes Dev. 26, 203–234. 10.1101/gad.183434.111. [DOI] [PMC free article] [PubMed] [Google Scholar]
- 3.O’Dea E, and Hoffmann A (2010). The regulatory logic of the NF-kappaB signaling system. Cold Spring Harbor Perspect. Biol. 2, a000216. 10.1101/cshperspect.a000216. [DOI] [PMC free article] [PubMed] [Google Scholar]
- 4.Werner SL, Kearns JD, Zadorozhnaya V, Lynch C, O’Dea E, Boldin MP, Ma A, Baltimore D, and Hoffmann A (2008). Encoding NF-kappaB temporal control in response to TNF: distinct roles for the negative regulators IkappaBalpha and A20. Genes Dev. 22, 2093–2101. 10.1101/gad.1680708. [DOI] [PMC free article] [PubMed] [Google Scholar]
- 5.Sung MH, Salvatore L, De Lorenzi R, Indrawan A, Pasparakis M, Hager GL, Bianchi ME, and Agresti A (2009). Sustained oscillations of NF-kappaB produce distinct genome scanning and gene expression profiles. PLoS One 4, e7163. 10.1371/journal.pone.0007163. [DOI] [PMC free article] [PubMed] [Google Scholar]
- 6.Nelson DE, Ihekwaba AE, Elliott M, Johnson JR, Gibney CA, Foreman BE, Nelson G, See V, Horton CA, Spiller DG, et al. (2004). Oscillations in NF-kappaB signaling control the dynamics of gene expression. Science 306, 704–708. 10.1126/science.1099962. [DOI] [PubMed] [Google Scholar]
- 7.Brignall R, Moody AT, Mathew S, and Gaudet S (2019). Considering abundance, affinity, and binding site availability in the NF-kappaB target selection puzzle. Front. Immunol. 10, 609. 10.3389/fimmu.2019.00609. [DOI] [PMC free article] [PubMed] [Google Scholar]
- 8.Bosisio D, Marazzi I, Agresti A, Shimizu N, Bianchi ME, and Natoli G (2006). A hyper-dynamic equilibrium between promoter-bound and nucleoplasmic dimers controls NF-kappaB-dependent gene activity. EMBO J. 25, 798–810. 10.1038/sj.emboj.7600977. [DOI] [PMC free article] [PubMed] [Google Scholar]
- 9.Adelaja A, Taylor B, Sheu KM, Liu Y, Luecke S, and Hoffmann A (2021). Six distinct NFkappaB signaling codons convey discrete information to distinguish stimuli and enable appropriate macrophage responses. Immunity 54, 916–930.e7. 10.1016/j.immuni.2021.04.011. [DOI] [PMC free article] [PubMed] [Google Scholar]
- 10.Lane K, Van Valen D, DeFelice MM, Macklin DN, Kudo T, Jaimovich A, Carr A, Meyer T, Pe’er D, Boutet SC, and Covert MW (2017). Measuring signaling and RNA-seq in the same cell links gene expression to dynamic patterns of NF-kappaB activation. Cell Syst. 4, 458–469.e5. 10.1016/j.cels.2017.03.010. [DOI] [PMC free article] [PubMed] [Google Scholar]
- 11.Martin EW, Pacholewska A, Patel H, Dashora H, and Sung MH (2020). Integrative analysis suggests cell type-specific decoding of NF-kappaB dynamics. Sci. Signal. 13, eaax7195. 10.1126/scisignal.aax7195. [DOI] [PMC free article] [PubMed] [Google Scholar]
- 12.Sung MH, Li N, Lao Q, Gottschalk RA, Hager GL, and Fraser ID (2014). Switching of the relative dominance between feedback mechanisms in lipopolysaccharide-induced NF-kappaB signaling. Sci. Signal. 7, ra6. 10.1126/scisignal.2004764. [DOI] [PMC free article] [PubMed] [Google Scholar]
- 13.Ashall L, Horton CA, Nelson DE, Paszek P, Harper CV, Sillitoe K, Ryan S, Spiller DG, Unitt JF, Broomhead DS, et al. (2009). Pulsatile stimulation determines timing and specificity of NF-kappaB-dependent transcription. Science 324, 242–246. 10.1126/science.1164860. [DOI] [PMC free article] [PubMed] [Google Scholar]
- 14.Zambrano S, De Toma I, Piffer A, Bianchi ME, and Agresti A (2016). NF-kappaB oscillations translate into functionally related patterns of gene expression. Elife 5, e09100. 10.7554/eLife.09100. [DOI] [PMC free article] [PubMed] [Google Scholar]
- 15.DeFelice MM, Clark HR, Hughey JJ, Maayan I, Kudo T, Gutschow MV, Covert MW, and Regot S (2019). NF-kappaB signaling dynamics is controlled by a dose-sensing autoregulatory loop. Sci. Signal. 12, eaau3568. 10.1126/scisignal.aau3568. [DOI] [PMC free article] [PubMed] [Google Scholar]
- 16.Lee TK, Denny EM, Sanghvi JC, Gaston JE, Maynard ND, Hughey JJ, and Covert MW (2009). A noisy paracrine signal determines the cellular NF-kappaB response to lipopolysaccharide. Sci. Signal. 2, ra65. 10.1126/scisignal.2000599. [DOI] [PMC free article] [PubMed] [Google Scholar]
- 17.Heltberg M, Kellogg RA, Krishna S, Tay S, and Jensen MH (2016). Noise induces hopping between NF-kappaB entrainment modes. Cell Syst. 3, 532–539.e3. 10.1016/j.cels.2016.11.014. [DOI] [PMC free article] [PubMed] [Google Scholar]
- 18.Kellogg RA, and Tay S (2015). Noise facilitates transcriptional control under dynamic inputs. Cell 160, 381–392. 10.1016/j.cell.2015.01.013. [DOI] [PubMed] [Google Scholar]
- 19.Kellogg RA, Tian C, Etzrodt M, and Tay S (2017). Cellular decision making by non-integrative processing of TLR inputs. Cell Rep. 19, 125–135. 10.1016/j.celrep.2017.03.027. [DOI] [PMC free article] [PubMed] [Google Scholar]
- 20.Zhang Q, Gupta S, Schipper DL, Kowalczyk GJ, Mancini AE, Faeder JR, and Lee REC (2017). NF-kappaB dynamics discriminate between TNF doses in single cells. Cell Syst. 5, 638–645.e5. 10.1016/j.cels.2017.10.011. [DOI] [PMC free article] [PubMed] [Google Scholar]
- 21.Selimkhanov J, Taylor B, Yao J, Pilko A, Albeck J, Hoffmann A, Tsimring L, and Wollman R (2014). Systems biology. Accurate information transmission through dynamic biochemical signaling networks. Science 346, 1370–1373. 10.1126/science.1254933. [DOI] [PMC free article] [PubMed] [Google Scholar]
- 22.Levine JH, Lin Y, and Elowitz MB (2013). Functional roles of pulsing in genetic circuits. Science 342, 1193–1200. 10.1126/science.1239999. [DOI] [PMC free article] [PubMed] [Google Scholar]
- 23.Purvis JE, Karhohs KW, Mock C, Batchelor E, Loewer A, and Lahav G (2012). p53 dynamics control cell fate. Science 336, 1440–1444. 10.1126/science.1218351. [DOI] [PMC free article] [PubMed] [Google Scholar]
- 24.Butovsky O, Jedrychowski MP, Moore CS, Cialic R, Lanser AJ, Gabriely G, Koeglsperger T, Dake B, Wu PM, Doykan CE, et al. (2014). Identification of a unique TGF-beta-dependent molecular and functional signature in microglia. Nat. Neurosci. 17, 131–143. 10.1038/nn.3599. [DOI] [PMC free article] [PubMed] [Google Scholar]
- 25.Carlsen H, Moskaug JO, Fromm SH, and Blomhoff R (2002). In vivo imaging of NF-kappa B activity. J. Immunol. 168, 1441–1446. 10.4049/jimmunol.168.3.1441. [DOI] [PubMed] [Google Scholar]
- 26.Gross S, and Piwnica-Worms D (2005). Real-time imaging of ligand-induced IKK activation in intact cells and in living mice. Nat. Methods 2, 607–614. 10.1038/nmeth779. [DOI] [PubMed] [Google Scholar]
- 27.Magness ST, Jijon H, Van Houten Fisher N, Sharpless NE, Brenner DA, and Jobin C (2004). In vivo pattern of lipopolysaccharide and anti-CD3-induced NF-kappa B activation using a novel gene-targeted enhanced GFP reporter gene mouse. J. Immunol. 173, 1561–1570. 10.4049/jimmunol.173.3.1561. [DOI] [PubMed] [Google Scholar]
- 28.Blackwell TS, Yull FE, Chen CL, Venkatakrishnan A, Blackwell TR, Hicks DJ, Lancaster LH, Christman JW, and Kerr LD (2000). Multiorgan nuclear factor kappa B activation in a transgenic mouse model of systemic inflammation. Am. J. Respir. Crit. Care Med. 162, 1095–1101. 10.1164/ajrccm.162.3.9906129. [DOI] [PubMed] [Google Scholar]
- 29.De Lorenzi R, Gareus R, Fengler S, and Pasparakis M (2009). GFP-p65 knock-in mice as a tool to study NF-kappaB dynamics in vivo. Genesis 47, 323–329. 10.1002/dvg.20468. [DOI] [PubMed] [Google Scholar]
- 30.Lee RE, Qasaimeh MA, Xia X, Juncker D, and Gaudet S (2016). NF-kappaB signalling and cell fate decisions in response to a short pulse of tumour necrosis factor. Sci. Rep. 6, 39519. 10.1038/srep39519. [DOI] [PMC free article] [PubMed] [Google Scholar]
- 31.Lee RE, Walker SR, Savery K, Frank DA, and Gaudet S (2014). Fold change of nuclear NF-kappaB determines TNF-induced transcription in single cells. Mol. Cell 53, 867–879. 10.1016/j.molcel.2014.01.026. [DOI] [PMC free article] [PubMed] [Google Scholar]
- 32.Beg AA, Sha WC, Bronson RT, Ghosh S, and Baltimore D (1995). Embryonic lethality and liver degeneration in mice lacking the RelA component of NF-kappa B. Nature 376, 167–170. 10.1038/376167a0. [DOI] [PubMed] [Google Scholar]
- 33.Martin EW, Chakraborty S, Presman DM, Tomassoni Ardori F, Oh KS, Kaileh M, Tessarollo L, and Sung MH (2019). Assaying homodimers of NF-kappaB in live single cells. Front. Immunol. 10, 2609. 10.3389/fimmu.2019.02609. [DOI] [PMC free article] [PubMed] [Google Scholar]
- 34.Tay S, Hughey JJ, Lee TK, Lipniacki T, Quake SR, and Covert MW (2010). Single-cell NF-kappaB dynamics reveal digital activation and analogue information processing. Nature 466, 267–271. 10.1038/nature09145. [DOI] [PMC free article] [PubMed] [Google Scholar]
- 35.Bindels DS, Haarbosch L, van Weeren L, Postma M, Wiese KE, Mastop M, Aumonier S, Gotthard G, Royant A, Hink MA, and Gadella TW Jr. (2017). mScarlet: a bright monomeric red fluorescent protein for cellular imaging. Nat. Methods 14, 53–56. 10.1038/nmeth.4074. [DOI] [PubMed] [Google Scholar]
- 36.Sanjabi S, Hoffmann A, Liou HC, Baltimore D, and Smale ST (2000). Selective requirement for c-Rel during IL-12 P40 gene induction in macrophages. Proc. Natl. Acad. Sci. USA 97, 12705–12710. 10.1073/pnas.230436397. [DOI] [PMC free article] [PubMed] [Google Scholar]
- 37.Siggers T, Chang AB, Teixeira A, Wong D, Williams KJ, Ahmed B, Ragoussis J, Udalova IA, Smale ST, and Bulyk ML (2011). Principles of dimer-specific gene regulation revealed by a comprehensive characterization of NF-kappaB family DNA binding. Nat. Immunol. 13, 95–102. 10.1038/ni.2151. [DOI] [PMC free article] [PubMed] [Google Scholar]
- 38.Wong D, Teixeira A, Oikonomopoulos S, Humburg P, Lone IN, Saliba D, Siggers T, Bulyk M, Angelov D, Dimitrov S, et al. (2011). Extensive characterization of NF-kappaB binding uncovers non-canonical motifs and advances the interpretation of genetic functional traits. Genome Biol. 12, R70. 10.1186/gb-2011-12-7-r70. [DOI] [PMC free article] [PubMed] [Google Scholar]
- 39.Bacia K, Kim SA, and Schwille P (2006). Fluorescence cross-correlation spectroscopy in living cells. Nat. Methods 3, 83–89. 10.1038/nmeth822. [DOI] [PubMed] [Google Scholar]
- 40.Webb LV, Ley SC, and Seddon B (2016). TNF activation of NF-kappaB is essential for development of single-positive thymocytes. J. Exp. Med. 213, 1399–1407. 10.1084/jem.20151604. [DOI] [PMC free article] [PubMed] [Google Scholar]
- 41.Lopez-Rodriguez C, Aramburu J, and Berga-Bolanos R (2015). Transcription factors and target genes of pre-TCR signaling. Cell. Mol. Life Sci. 72, 2305–2321. 10.1007/s00018-015-1864-8. [DOI] [PMC free article] [PubMed] [Google Scholar]
- 42.Signer RA, Magee JA, Salic A, and Morrison SJ (2014). Haematopoietic stem cells require a highly regulated protein synthesis rate. Nature 509, 49–54. 10.1038/nature13035. [DOI] [PMC free article] [PubMed] [Google Scholar]
- 43.Li J, Cai Z, Vaites LP, Shen N, Mitchell DC, Huttlin EL, Paulo JA, Harry BL, and Gygi SP (2021). Proteome-wide mapping of short-lived proteins in human cells. Mol. Cell 81, 4722–4735.e5. 10.1016/j.molcel.2021.09.015. [DOI] [PMC free article] [PubMed] [Google Scholar]
- 44.Goudeau B, Huetz F, Samson S, Di Santo JP, Cumano A, Beg A, Israel A, and Memet S (2003). IkappaBalpha/IkappaBepsilon deficiency reveals that a critical NF-kappaB dosage is required for lymphocyte survival. Proc. Natl. Acad. Sci. USA 100, 15800–15805. 10.1073/pnas.2535880100. [DOI] [PMC free article] [PubMed] [Google Scholar]
- 45.Schraivogel D, Kuhn TM, Rauscher B, Rodriguez-Martinez M, Paulsen M, Owsley K, Middlebrook A, Tischer C, Ramasz B, Ordonez-Rueda D, et al. (2022). High-speed fluorescence image-enabled cell sorting. Science 375, 315–320. 10.1126/science.abj3013. [DOI] [PMC free article] [PubMed] [Google Scholar]
- 46.Chen W, Guillaume-Gentil O, Rainer PY, Gabelein CG, Saelens W, Gardeux V, Klaeger A, Dainese R, Zachara M, Zambelli T, et al. (2022). Live-seq enables temporal transcriptomic recording of single cells. Nature 608, 733–740. 10.1038/s41586-022-05046-9. [DOI] [PMC free article] [PubMed] [Google Scholar]
- 47.Burns JC, Cotleur B, Walther DM, Bajrami B, Rubino SJ, Wei R, Franchimont N, Cotman SL, Ransohoff RM, and Mingueneau M (2020). Differential accumulation of storage bodies with aging defines discrete subsets of microglia in the healthy brain. Elife 9, e57495. 10.7554/eLife.57495. [DOI] [PMC free article] [PubMed] [Google Scholar]
- 48.Pineda CM, Park S, Mesa KR, Wolfel M, Gonzalez DG, Haberman AM, Rompolas P, and Greco V (2015). Intravital imaging of hair follicle regeneration in the mouse. Nat. Protoc. 10, 1116–1130. 10.1038/nprot.2015.070. [DOI] [PMC free article] [PubMed] [Google Scholar]
- 49.Uderhardt S, Martins AJ, Tsang JS, Lammermann T, and Germain RN (2019). Resident macrophages cloak tissue microlesions to prevent neutrophil-driven inflammatory damage. Cell 177, 541–555.e17. 10.1016/j.cell.2019.02.028. [DOI] [PMC free article] [PubMed] [Google Scholar]
- 50.Waithe D (2021). Open-source browser-based software simplifies fluorescence correlation spectroscopy data analysis. Nat. Photonics 15, 790–791. [Google Scholar]
- 51.Chalfoun J, Majurski M, Dima A, Halter M, Bhadriraju K, and Brady M (2016). Lineage mapper: a versatile cell and particle tracker. Sci. Rep. 6, 36984. 10.1038/srep36984. [DOI] [PMC free article] [PubMed] [Google Scholar]
Associated Data
This section collects any data citations, data availability statements, or supplementary materials included in this article.
Supplementary Materials
Data Availability Statement
Microscopy data reported in this paper will be shared by the lead contact upon request.
All original code has been deposited and is publicly available at https://github.com/Toufiq54/LiveCell_NFkB.git. The download link is also listed in the key resources table.
Any additional information required to reanalyze the data reported in this paper is available from the lead contact upon request.
KEY RESOURCES TABLE.
| REAGENT or RESOURCE | SOURCE | IDENTIFIER |
|---|---|---|
|
| ||
| Antibodies | ||
|
| ||
| Anti-c-Rel Antibody (B-6) Alexa Fluor® 488 | Santa Cruz | sc-6955 AF488; RRID:AB_670194 |
| APC anti-mouse CD117 (c-Kit) | Biolegend | Cat#105812, Clone 2B8; RRID:AB_313221 |
| PE/Cyanine7 anti-mouse Ly-6A/E (Sca-1) | Biolegend | Cat#122513, Clone E13-161.7; RRID:AB_756198 |
| APC/Cyanine7 anti-mouse CD16/32 | Biolegend | Cat#156611, Clone S17011E; RRID:AB_2800709 |
| PerCP/Cyanine5.5 anti-mouse CD34 | Biolegend | Cat#128607, Clone HM34; RRID:AB_1279222 |
| APC anti-mouse CD19 | Biolegend | Cat#152409, Clone 1D3/CD19; RRID:AB_2629838 |
| PE/Cyanine7 anti-mouse/human CD45R/B220 | Biolegend | Cat#103221, Clone RA3-6B2; RRID:AB_313004 |
| Pacific Blue™ anti-mouse CD3 | Biolegend | Cat#100214, Clone 17A2; RRID:AB_493645 |
| PerCP/Cyanine5.5 anti-mouse CD49b | Biolegend | Cat#108915, Clone DX5; RRID:AB_1595599 |
| Pacific Blue™ anti-mouse Lineage Cocktail | Biolegend | Cat#133306, Clone 17A2, RB6-8C5, RA3-6B2, Ter-119, M1/70; RRID:AB_11126978 |
| BV711 Rat Anti-Mouse CD44 | BD Biosciences | Cat#563971, Clone IM7; RRID:AB_2738518 |
| APC-R700 Rat Anti-Mouse CD25 | BD Biosciences | Cat#565135, Clone PC61 |
| APC Rat Anti-Mouse CD4 | BD Biosciences | Cat#561091, Clone RM4-5; RRID:AB_10562037 |
| PerCP/Cyanine5.5 anti-mouse CD8a | Thermo Fisher Scientific | Cat#45-0081-82, Clone 53-6.7; RRID:AB_1107004 |
| Ki-67 rat monoclonal antibody (SolA15), eBioscience | ThermoFisher Scientific | Cat#14-5698-82; RRID:AB_10854564 |
| P2RY12 recombinant rabbit monoclonal antibody (4H5L19) | ThermoFisher Scientific | Cat#702516; RRID:AB_2689476 |
| Goat anti-rat IgG (H + L) cross-adsorbed secondary antibody, Alexa Fluor 488 | ThermoFisher Scientific | Cat#A-11006; RRID:AB_141373 |
| Goat anti-rabbit IgG (H + L) highly cross-adsorbed secondary antibody, Alexa Fluor 594 | ThermoFisher Scientific | Cat#A-11037; RRID:AB_2534095 |
| Anti-NF-kB p65 antibody | Santa Cruz Biotechnology | Cat#sc-372; RRID:AB_632037 |
| Anti-I kappa B alpha antibody | Santa Cruz Biotechnology | Cat#sc-371; RRID:AB_2235952 |
| Anti-Rho-GDI antibody | Sigma-Aldrich | Cat#R3025; RRID:AB_261317 |
| HRP-conjugated Donkey Anti-Rabbit IgG | GE Healthcare | Cat#NA934V; RRID:AB_772206 |
|
| ||
| Biological samples | ||
|
| ||
| Primary ear fibroblast G/R cells | ||
| Primary bone marrow-derived macrophage (BMDM) G/R cells | ||
| Primary microglia G/R cells | ||
| Primary cells from Thymus, Spleen, Lymph nodes and Bone marrow | ||
|
| ||
| Chemicals, peptides, and recombinant proteins | ||
|
| ||
| MEGAshortscript™ T7 Transcription Kit | Thermo Fisher Scientific | AM1354 |
| MEGAclear™ Transcription Clean-Up Kit | Thermo Fisher Scientific | AM1908 |
| CleanCap® Cas9 mRNA | TriLink Biotechnologies | L-7606 |
| Lipopolysaccharide from Salmonella | Enzo | ALX-581-008-L001 |
| rmTNF-a (aa 80-235) | R & D Systems | 410-MT-010 |
| SPY 650 DNA | Cytoskeleton Inc | CY-SC 501 |
| Mouse adult brain dissociation kit | Miltenyi Biotec | Cat#130-107-677 |
| Percoll | GE Healthcare | Cat#17-0891-01 |
| PBS | Gibco | Cat#10010023 |
| DMEM/F-12 media | Gibco | Cat#21041025 |
| Recombinant Mouse M-CSF Protein | R&D Systems | Cat#416-ML-010 |
| Recombinant Human TGF-beta 1 Protein | R&D Systems | Cat#240-B-010 |
| Paraformaldehyde | Sigma-Aldrich | Cat#158127 |
| Goat serum | Sigma-Aldrich | Cat#G9023 |
| Triton X-100 | Sigma-Aldrich | Cat#T8787 |
| BSA | Sigma-Aldrich | Cat#A8806 |
| Sodium azide | Acros organics | Cat#19038-1000 |
| Prolong gold antifade mountant with DAPI | ThermoFisher Scientific | Cat#P36931 |
| Cycloheximide | Sigma-Aldrich | Cat#01810 |
| RIPA cell lysis buffer | Millipore | Cat#20-188 |
| NuPAGE 4–12% Bis-Tris Gel | Invitrogen | Cat#NP0321 |
| NuPAGE MOPS SDS running buffer | Life technologies | Cat#NP0001 |
|
| ||
| Experimental models: Cell lines | ||
|
| ||
| Immortalized ear fibroblast G/R cells | This paper | |
|
| ||
| Experimental models: Organisms/strains | ||
|
| ||
| C57BL/6Ncrl mice | Charles River Laboratories | RRID:IMSR_CRL:027 |
| B6D2F1 mice | Charles River Laboratories | RRID:IMSR_CRL:099 |
| Double knock-in G/R mice | This paper | |
|
| ||
| Recombinant DNA | ||
|
| ||
| mEGFP-RelA dsDNA donor plasmid | Genewiz | Custom made: https://www.genewiz.com/ |
| mScarlet-c-Rel dsDNA donor plasmid | Genewiz | Custom made: https://www.genewiz.com/ |
|
| ||
| Software and algorithms | ||
|
| ||
| MATLAB | MathWorks | |
| ImageJ (Fiji) | National Institute of Health | |
| Imaging data quantification and analysis code | This paper | https://github.com/Toufiq54/LiveCell_NFkB.git |
| FlowJo Ver.10 | BD Biosciences | https://www.flowjo.com |
| ANY-Maze Ver. 7.1 | Stoelting | Cat#60000 |
| Video Freeze Ver. 3.01 | MED-Associates | Cat#SOF-843 |
|
| ||
| Other | ||
|
| ||
| Cell strainers | Fisher Scientific | Cat#22-363-548 |
| Grip strength meter | Bioseb | Cat#BIO-GS3 |
| Mouse fear conditioning chamber | MED-Associates | Cat#MED-VFC-USB-M |