

Abstract
Introduction
Maternal pushing techniques during the second stage of labor may affect women's pelvic floor function. Our main objective was to assess the impact of the type of pushing used at delivery on the mother's medium‐term pelvic floor function.
Material and methods
This is a secondary analysis of a randomized clinical trial (clinicaltrials.gov: NCT02474745) that took place in four French hospitals from 2015 through 2017 (n = 250). Women in labor with a singleton fetus in cephalic presentation at term who had undergone standardized training in both of these types of pushing were randomized after cervical dilation ≥7 cm. The exclusion criteria were a previous cesarean, a cesarean delivery in this pregnancy or a fetal heart rate anomaly. In the intervention group, open‐glottis (OG) pushing was defined as a prolonged exhalation contracting the abdominal muscles to help move the fetus down the birth canal. Closed‐glottis (CG) pushing was defined as Valsalva pushing. The principal outcome was the stage of pelvic organ prolapse (POP) assessed by the Pelvic Organ Prolapse‐Quantification 2 months after delivery. A secondary outcome was incidence of urinary incontinence (UI). The results of our multivariable, modified intention‐to‐treat analysis are reported as crude relative risks (RRs) with their 95% confidence intervals.
Results
Our analysis included 207 women. Mode of birth was similar in both groups. The two groups did not differ for stage II POP: 10 of 104 (9.4%) in the OG group compared with 7 of 98 (7.1%) in the CG group, for a RR 1.32, 95% confidence interval [CI] 0.52–3.33, and an adjusted RR of 1.22, 95% CI 0.42–3.6. Similarly, the incidence of UI did not differ: 26.7% in the OG group and 28.6% in the CG group (aRR 0.81, 95% CI 0.42–1.53). Subgroup analysis suggests that for secundiparous and multiparous women, OG pushing could have a protective effect on the occurrence of UI (RR 0.33, 95% CI 0.13–0.80).
Conclusions
The type of directed pushing used at delivery did not impact the occurrence of pelvic organ prolapse 2 months after delivery. OG pushing may have a protective effect against UI among secundiparous and multiparous women.
Keywords: delivery; directed pushing; open glottis pushing; pelvic floor; pelvic organ prolapse; urinary incontinence; Valsalva pushing, closed glottis pushing
The type of directed pushing,open‐glottis vs closed‐glottis, used by women with epidural analgesia during delivery does not affect their pelvic floor function 6‐8 weeks after delivery. The type of maternal pushing used during delivery should be chosen according to women’s preferences, experience and ability.

Abbreviations
- CG
closed‐glottis
- CI
confidence interval
- OG
open‐glottis
- POP
pelvic organ prolapse
- RR
relative risk
- UI
urinary incontinence
Key message.
Vaginal delivery affects pelvic floor function, and some techniques, such as perineal protection and the type of pushing, should be studied. When directed pushing is used, its type may affect urinary incontinence for parous and multiparous women.
1. INTRODUCTION
Pelvic floor disorders such as urinary incontinence (UI), anal incontinence and pelvic organ prolapse (POP) affect millions of women throughout the world. These disorders are associated with substantial physical and psychological morbidity as well as with high societal costs. 1 , 2 , 3 , 4 Vaginal childbirth is strongly associated with the incidence of pelvic floor disorder later in life. 5 The onset of urinary or fecal incontinence during pregnancy or in the first year postpartum increases the risk of long‐term incontinence. 6 , 7 It therefore seems important to assess the obstetric practices that may affect the onset of these disorders. Mode of delivery and neonatal indicators such as birthweight have been associated with an increased risk of UI in the medium‐ to long‐term. 5 , 8 The type of pushing used at delivery may also affect the occurrence of pelvic floor disorders. Three studies have assessed the impact of closed‐glottis (CG) pushing (Valsalva type) vs spontaneous pushing on urodynamic indices and have reached contradictory results. 9 , 10 , 11 No study has examined the use of directed (that is, coached) open‐glottis (OG) pushing.
Our research hypothesis is that the use of directed CG pushing at delivery (also called Valsalva pushing) may also have harmful consequences for pelvic floor function. That is, during these pushing efforts, the diaphragm is projected downward, accompanied by organs. Its use of high abdominal pressure might induce pressure on the perineum, which in turn would respond by bulging and contracting, due to the myotatic reflex to stretching. 12 This perineal pressure may increase the risk of perineal lacerations and also promote the factors leading to UI, pelvic floor problems and eventually prolapse. 13
The aim of this study was to assess the impact of the type of pushing used at delivery— directed OG (ie pushing while exhaling) vs CG pushing (ie Valsalva pushing)—on the mother's medium‐term pelvic floor function. The main objective concerned the occurrence of stage 2 POP at 6–8 weeks after the birth. The secondary objectives focused on urogynecologic measures of pelvic floor structures and UI at the same time and analyzed both POP and UI according to parity.
2. MATERIAL AND METHODS
2.1. Study design
This was a planned secondary analysis of the EOLE study, a randomized, controlled, non‐blinded multicenter superiority trial with two parallel groups intended to assess the efficacy of directed OG pushing vs directed CG pushing during the active phase of the second stage of labor. 14 The details of the EOLE study have been published previously. 13 The study presented here assessed the effect of the type of pushing used during the second stage of labor (directed OG pushing vs directed CG pushing) on pelvic floor function, that is, on POP and UI. The EOLE study took place in four French centers: two university hospitals and two general hospitals. For this secondary analysis we work with data from only three of these centers.
2.2. Study participants
Women of any parity with a singleton pregnancy in cephalic presentation between 37–42 weeks of gestation, with a planned vaginal birth after spontaneous or induced labor, were eligible for the trial if they had taken a prenatal class that included the specific training developed for the study for both types of pushing. Exclusion criteria were an age younger than 18 years, a previous cesarean birth or other uterine surgery, a disease contraindicating pushing or that might justify emergency delivery (hemolysis‐elevated‐liver‐enzyme‐low‐platelet [HELLP] syndrome, placental abruption, etc.) or any of the following: severe genital hemorrhage, major fetal malformation, polyhydramnios, oligohydramnios, intrauterine growth restriction diagnosed in utero (ie below the 5th percentile for gestational age and sex), a fetal heart rate anomaly according to the French guidelines before randomization, 15 or in utero fetal death. All participants in the trial provided written informed consent before randomization. Women could be included by the investigating midwives (n = 156) at any moment of the day or night. These investigators enrolled participants in the study, during labor, after verifying the inclusion and exclusion criteria, and collected the signed informed consents. They could then randomize the women after cervical dilation ≥7 cm and guide them with the allocated type of pushing during the expulsion phase. Of the 255 women randomized in the EOLE Study, 12 were excluded from the primary analysis: four for non‐adherence to the protocol (2 did not meet the eligibility criteria and two had midwives who were not investigators, as required by the protocol), one who decided not to participate before the intervention (Figure 1), and eight because of cesarean sections.
FIGURE 1.
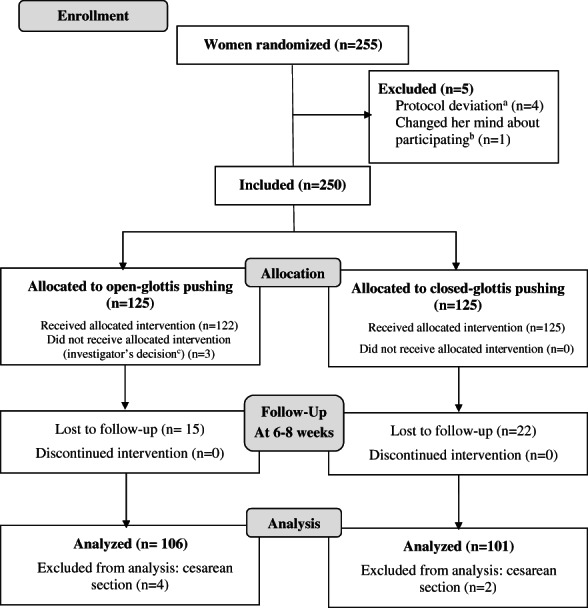
EOLE trial profile. Study flow chart. aTwo deliveries were supervised by midwives who were not study investigators and two failed to comply with inclusion criteria. bRefusal after randomization and before intervention (pushing). cFetal heart rate abnormalities were associated with posterior positions in two cases and in one case with a fetus suspected of macrosomia.
2.3. Interventions
In the intervention group, directed OG pushing (with prolonged exhalation) was explained as follows: “After inhaling deeply, you should exhale while pulling in your stomach so that you can use the contraction of your abdominal muscles to help the fetus descend through the birth canal. You should push as long as possible.” In the control group, directed CG pushing (pushing while holding one's breath) was explained as follows: “After inhaling deeply, you should push very hard downwards to the perineum, while holding the inhaled breath in your lungs. You should push as hard and as long as possible”.
2.4. Methods
After each birth, the midwife‐investigator responsible for it, completed a brief summary in the women's electronic case report file including, for example, the techniques of perineal protection used. Monitoring of labor as well as any associated interventions (analgesia, oxytocin, maternal position, etc.) were identical to standard management in the participating maternity units. During their mandatory, free (in France) postnatal visit 6–8 weeks after birth, participating women underwent a standardized pelvic floor evaluation and a UI questionnaire by well‐trained gynecologist‐obstetricians (n = 4) or midwives (n = 3) blinded to the women's allocation groups. Pelvic floor function was assessed with the Pelvic Organ Prolapse Quantification (POP‐Q) examination and the International Consultation on Incontinence modular Questionnaire‐Short Form validated in French (ICIQ‐SF). 16 The POP‐Q measurement relative to the hymen was made during Valsalva with the woman in the dorsal lithotomy position. 17 The ICIQ Study Group authorized the use of their questionnaire for the EOLE study.
2.5. Outcomes
The primary outcome of this preplanned secondary study was stage of POP. Our secondary outcomes were POP‐Q evaluation (with comparison at each point) and incidence and type of UI. These outcomes were analyzed for the entire population and by parity (except for the POP‐Q point comparison). The International Continence Society defines four stages (0–IV) of POP based on the POP‐Q, considering the leading edge of POP relative to the hymen. 18 Since recurrent POP is defined from POP stage II, 18 we defined no POP as stages 0 and I and POP as stage II or greater. ICIQ‐SF scores range from 0 (no incontinence) to 21 (UI if score >0); a score between 1 and 5 is considered slight incontinence. 19 UI symptoms were classified by the answer to the question “When does urine leak?”: “stress UI” if the answer to this question was “when I cough or sneeze” or “when I am physically active/exercising, “urge incontinence” if the answer was “before I can get to the toilet;” and “mixed” if she marked both options.
2.6. Statistical analyses
The power calculation for the initial analyses of the effectiveness of pushing and the randomization technique have been published elsewhere. 14 Randomization (1:1 allocation) was initially performed with a randomization list created by a computer program designed by an independent group at the hospital's clinical research center. It was in blocks of four to six and stratified by maternity ward and within maternity wards by both parity (primiparous vs secundiparous and multiparous women; for brevity's sake, the latter group will henceforth be referred to as multiparas) and epidural analgesia use at randomization. Both randomization and data collection took place at a secure website available 24 hours a day. The analysis considered a modified intention to treat population. In this single‐blinded study, the practitioners performing the assessment had no information about the type of pushing used.
In this study, all women who were randomized and assigned to the interventional (directed OG pushing) or the control group (directed CG pushing) and who had given birth vaginally were analyzed on a modified intention‐to‐treat basis (that is, excluding the same 12 randomized women excluded from the primary analysis). Population characteristics were compared by chi‐square, Fisher's exact or Student t‐tests. The principal results are reported as crude relative risks (RR) with their 95% confidence intervals (CI). A multivariate generalized linear analysis was performed with a manual backwards stepwise procedure to take the clinically relevant confounding factors and prognostic factors into account and obtain an adjusted relative risk (aRR) with its 95% CI. Because the publications assessing the types of pushing at birth have not looked for confounding factors, and thus no authors have published a multivariate analysis, we chose the clinically relevant confounding factors identified by the univariate analyses (p ≤ 0.20) and pre‐pregnancy body mass index (BMI), suggested in the literature. 20 We also looked for clinically relevant interactions between the type of pushing and other factors. The same procedure was used to analyze the secondary outcomes. The threshold for statistical significance was set at 5%. One per protocol analysis was also performed including only women with compliance ≥50% in each group (number of uterine contractions for which pushing complied with allocated group/total number of uterine contractions with pushing). The statistical analysis was conducted with SAS software (Statistics Program for Public Health on IBM‐compatible microcomputer, version 9.4).
2.7. Ethics statement
This study was approved by a French Institutional Review Board on May 21, 2015 (Patient Protection Committee Southeast VI, AU 1168). The protocol is available online. 13 The EOLE trial was registered at clinicaltrials.gov (NCT02474745).
3. RESULTS
The study took place from July 9, 2015, through June 14, 2017, including follow‐up, when we reached the predetermined sample size. In all, 204 women underwent a clinical examination with a POP‐Q, and 203 responded to the ICIQ‐SFM questionnaire, for follow‐up rates of respectively 81.6% and 81.2%. Baseline characteristics did not differ significantly between the two groups (Table 1), nor did most characteristics of labor, birth and the neonate (Table 2). The duration of the expulsion phase was higher among the OG pushing group (23.6 ± 17.6 vs 18.4 ± 15.3, p = 0.03) and was thus identified as a relevant clinical prognostic factor. The mean compliance of the OG group (63.6% ± 30.6) was significantly lower than that of the CG group (98.3% ± 9.4, p < 0.0001; Table 3).
TABLE 1.
Baseline characteristics of the trial participants
| Baseline characteristics | Open‐glottis pushing (n = 106) | Closed‐glottis pushing (n = 101) | P‐value |
|---|---|---|---|
| Age (years), mean ± SD | 30.3 ± 3.8 | 30.7 ± 3.8 | 0.4 |
| 20–34 years (%) | 96 (90.6) | 87 (86.1) | 0.3 |
| ≥35–34 years (%) | 10 (9.4) | 14 (13.9) | |
| Body mass index; prepregnancy (kg/m2), mean ± SD | 22.6 ± 3.4 | 23.0 ± 4.2 | 0.5 |
| <25 kg/m2, n (%) | 84 (79.3) | 76 (75.3) | 0.5 |
| ≥25 kg/m2, n (%) | 22 (20.8) | 25 (24.8) | |
| Lives with partner (%) | 101 (95.3) | 97 (96.0) | 1.0 |
| Geographic origin: Metropolitan France, n (%) | 102 (96.2) | 92 (91.1) | 0.19 |
| Post‐secondary education, n (%) | 86 (81.1) | 78 (77.2) | 0.33 |
| Worked during pregnancy, n (%) | 89 (84.0) | 92 (91.1) | 0.49 |
| Obstetric history, n or n/n (%) | |||
| Nulliparous | 71 (67.0) | 69 (68.3) | 0.8 |
| Parous (≥1 child) | 35 (33.0) | 32 (31.7) | |
| Previous child with BW > 4000 g | 1/35 (2.9) | 2/32 (6.25) | |
| Smoked at the beginning of pregnancy, n (%) | 20 (18.9) | 13 (12.9) | 0.22 |
Abbreviations: BW, birthweight; SD, standard deviation.
TABLE 2.
Characteristics of participants' labor, birth and neonatal data by treatment group
| Characteristics of labor and birth | Open‐glottis pushing (n = 106) | Closed‐glottis pushing (n = 101) | P‐value |
|---|---|---|---|
| Gestational age at birth (weeks), mean ± SD | 40.0 ± 1.0 | 40.1 ± 1.0 | 0.52 |
| Epidural analgesia, n (%) | 102 (96.2) | 95 (94.1) | 0.47 |
| Duration of labor | |||
| Passive descent of second stage a (min), mean ± SD | 113.7 ± 76.2 | 94.0 ± 73.7 | 0.06 |
| Use of oxytocin, n (%) | 58 (54.7) | 44 (43.6) | 0.13 |
| Dorsal decubitus position with stirrups or footholds at birth, n (%) | 101 (95.3) | 97 (96.0) | 0.48 |
| Fetal station at start of pushing, n (%) | |||
| High‐station −5 to −1 | 1 (0.9) | 1 (1.0) | 0.06 |
| Mid‐station 0 to +1 | 59 (55.7) | 54 (53.5) | |
| Low‐station +2 to +3 | 13 (12.3) | 25 (24.8) | |
| Outlet – station +4 to +5 | 33 (31.1) | 21 (20.8) | |
| Duration of the expulsion phase (min), mean ± SD | 23.6 ± 17.6 | 18.4 ± 15.3 | 0.03 |
| <15 min, n (%) | 40 (37.7) | 51 (50.5) | 0.09 |
| <30 min, n (%) | 69 (65.1) | 81 (80.2) | 0.02 |
| ≥30 min, n (%) | 37 (34.9) | 20 (19.8) | 0.02 |
| Technique of perineal protection, n (%) | |||
| Perineal massage | 32 (30.2) | 30 (29.7) | 0.94 |
| Warm compresses | 24 (22.6) | 24 (23.8) | 0.85 |
| Maintenance of the fetal head, n (%) | |||
| Hands‐on b | 79 (97.5) | 75 (94.9) | 0.39 |
| Mode of birth, n (%) | |||
| Spontaneous vaginal birth | 81 (76.4) | 79 (78.2) | 0.76 |
| Operative vaginal birth c | 25 (23.6) | 22 (21.8) | |
| Perineal laceration, n (%) | |||
| Intact perineum or first‐degree perineal tears | 63 (59.4) | 63 (62.4) | 0.67 |
| Perineal tears and lacerations d | 75 (70.8) | 73 (72.3) | 0.70 |
| First‐degree | 58 (77.3) | 56 (76.7) | |
| Second‐degree | 13 (17.3) | 16 (21.9) | |
| Third‐degree | 4 (5.3) | 1 (1.4) | |
| Episiotomy d | 27 (25.5) | 22 (21.8) | 0.81 |
| Neonatal data at birth | |||
| Fetus in occiput anterior position at birth, n (%) | 105 (99.1) | 98 (97.0) | 0.13 |
| Weight (g), mean ± SD | 3294.7 ± 372.6 | 3305.7 ± 386.6 | 0.83 |
| <3500 | 70 (66.0) | 71 (70.3) | 0.51 |
| ≥3500 | 36 (34.0) | 30 (29.7) | |
| Macrosomia (≥4000 g) | 3 (2.8) | 4 (4.0) | 0.72 |
| Head circumference (cm), mean ± SD | n = 106 34.5 ± 1.5 | n = 100 e 34.6 ± 1.4 | 0.55 |
Abbreviation: SD, standard deviation.
Time from full dilation until the start of pushing.
Only during spontaneous vaginal births.
22 had a birth assisted by vacuum in the open glottis group and 17 in the closed‐glottis group, and respectively, 0 and 1 by forceps, 1 and 2 by vacuum and forceps, 1 and 1 by vacuum and spatulas, and 1 and 0 by spatula; finally 0 and 1 had a maneuver for shoulder dystocia.
There were no fourth‐degree perineal lacerations in the study and no secundiparous or multiparous woman had an episiotomy.
One missing data item.
TABLE 3.
Adherence to the allocated type of pushing
| Open‐glottis pushing (n = 106) | Closed‐glottis pushing (n = 101) | P‐value | |
|---|---|---|---|
| Adherence to the allocated intervention, mean ± SD | |||
| All women (%) a | 63.6 ± 30.6 | 98.3 ± 9.4 | <0.0001 |
| By parity (%) a | |||
| Primiparae | 56.5 ± 30.1 | 98.8 ± 8.5 | <0.0001 |
| Multiparae (%) | 78.0 ± 26.8 | 97.2 ± 11.1 | <0.0001 |
Note: Data are expressed as means ± standard deviation.
% = ([Number of uterine contractions where the women used the allocated type of pushing/total number of uterine contractions where the women pushed] × 100).
The occurrence of stage II POP Q did not differ significantly between the groups: we found 10 women in the OG group (9.4%) vs 7 women in the CG group (7.1%) with POP stage II at 2 months after delivery (crude RR 1.32, 95% CI 0.68–2.26; Table 4).
TABLE 4.
Maternal pelvic floor function according to trial group
| Open‐glottis pushing (n = 106) | Closed‐glottis pushing (n = 101) | Crude RR | 95% CI | Adjusted RR a | 95% CI | |
|---|---|---|---|---|---|---|
| POP‐Q | ||||||
| Stage of POP, n (%) | n = 104 | n = 98 | ||||
| Stage 0 | 64 (60.4) | 54 (55.1) | — | — | — | |
| Stage I | 32 (30.2) | 39 (37.8) | — | — | — | |
| Stage II | 10 (9.4) | 7 (7.1) | 1.32 | 0.52–3.33 | 1.22 | 0.42–3.6 |
| Nulliparous | 6 (17.1) | 3 (9.7) | 0.94 | 0.25–3.62 | — | — |
| Multiparous | 4 (5.6) | 4 (6.0) | 1.77 | 0.48–6.5 | — | ‐ |
| ICIQ‐SF | N = 105 | N = 98 | ||||
| Global score, means ± SD | 1.7 ± 3.4 | 2.0 ± 3.6 | 0.82 | 0.49–1.39 | 0.79 | 0.47–1.36 |
| Score >0 = UI, n (%) | 28 (26.7) | 28 (28.6) | 0.93 | 0.60–1.46 | 0.81 | 0.42–1.55 |
| Primiparous | 23 (67.6) | 14 (20.9) | 1.55 | 0.87–2.75 | — | — |
| Multiparous | 5 (14.7) | 14 (45.2) | 0.33 | 0.13–0.80 | ‐ | ‐ |
| Score >5 = moderate or severe UI, n/n (%) | 14/104 (13.5) | 18/97 (18.6) | 0.73 | 0.38–1.38 | 0.67 | 0.30–1.49 |
| Primiparous | 12 (17.1) | 10 (15.2) | 1.13 | 0.52–2.44 | — | — |
| Multiparous | 2 (5.9) | 8 (25.8) | 0.23 | 0.05–0.99 | — | ‐ |
| Type of UI, n (%) | ||||||
| Stress UI | 18 (17.1) | 19 (19.4) | 0.88 | 0.49–1.58 | 0.80 | 0.38–1.68 |
| Urge UI | 12 (11.4) | 11 (11.2) | 1.01 | 0.47–2.2 | 1.01 | 0.41–2.53 |
| Mixed UI | 4 (3.81) | 4 (4.1) | 0.93 | 0.24–3.63 | — | — |
Abbreviations: CI, confidence interval; RR, relative risk; SD, standard deviation. POP‐Q, Pelvic Organ Prolapse Quantification; ICIQ‐SF, International Consultation on Incontinence modular Questionnaire‐Short Form validated in French; UI, urinary incontinence.
RR adjusted for confounding factor (pre‐pregnancy BMI <25 vs ≥25) and clinically relevant predictive factors (maternal age < 35 vs ≥35 years, parity 1 vs >1, perineal protection [perineal massage and/or warm compresses] yes vs no, duration of the expulsion phase [continuous], mode of birth spontaneous vaginal birth vs operative vaginal birth, perineal laceration [second‐, third‐ or fourth‐degree and/or episiotomy] no vs yes and birthweight <3500 vs ≥3500 g).
After adjustment for the confounding factor (pre‐pregnancy BMI) and the clinically relevant prognostic factors (maternal age, parity, perineal protection, duration of the expulsion phase, mode of birth, perineal laceration and birthweight), we again found no statistically significant difference in the occurrence of POP stage II between the two groups (aRR 1.22, 95% CI 0.42–3.6; Table 4). Table 5 presents the details of POP‐Q measurements for each group; these, too, do not differ significantly.
TABLE 5.
POP‐Q measurements in cm for open‐glottis women (in bold) compared with closed‐glottis women
|
n = 106; −2.7 ± 0.7 n = 98; −2.7 ± 0.7 |
n = 104; −2.7 ± 0.9 n = 97; −2.6 ± 0.8 |
n = 106; −8.2 ± 1.9 n = 98; −8.7 ± 1.8 |
|
n = 105; 3.6 ± 1.1 n = 98; 3.5 ± 1.1 |
n = 105; 3.6 ± 1.0 n = 98; 3.6 ± 0.9 |
n = 106; 9.7 ± 1.6 n = 97; 9.9 ± 1.7 |
|
n = 105; −2.8 ± 0.6 n = 97; −2.8 ± 0.4 |
n = 105; −2.8 ± 0.7 n = 97; −2.9 ± 0.4 |
n = 104; −8.8 ± 1.9 n = 98; −9.2 ± 1.7 |


Note: Data are expressed as mean cm ± standard deviation. All P‐values comparing measures between groups were nonsignificant.
Defined points: Aa, Anterior vaginal wall; Ap, Posterior vaginal wall, they both range − 3 to +3 proximal to the hymen; Ba, the most distal position of the anterior vaginal wall; Bp, the most distal position of the posterior vaginal wall, they both range − 3 to +tvl; C, most distal edge of the cervix; D, location of the posterior fornix gh, genital hiatus; pb, the perineal body; POP‐Q Pelvic Organ Prolapse Quantification; tvl, total vaginal length.
Neither UI nor its type differed significantly between the two groups in either the crude or adjusted RRs (Table 4). Analysis by parity found that OG pushing had a protective effect among multiparous women with a crude RR 0.33 (95% CI 0.13–0.80) for UI (score >0) and RR 0.23 (95% CI 0.05–0.99) for moderate or severe UI (score >5; Table 4).
The per protocol analysis of women who adhered to the allocated pushing for at least 50% of their contractions also found no significant differences in the occurrence of POP stage II (File S1). OG pushing maintained its protective effect in the per protocol analysis for multiparous women for UI with a crude RR 0.23 (95% CI 0.08–0.72) and for moderate or severe UI with a crude RR 0.23 (95% CI 0.05–0.99; Table S1). We encountered no adverse effects attributable to maternal pushing in our trial.
4. DISCUSSION
Our study found no statistically significant difference in the occurrence of POP at 2 months postpartum between women randomized to directed OG and to directed CG pushing: 10% of the women in the OG and 7% of those in the CG group (aRR 1.22, 95% CI 0.42–3.6). Nor did our study find differences in either UI incidence or intensity at 2 months postpartum. This is likely related to our other published results: perineal outcomes did not differ between the groups. 14 These results are consistent with those of Low et al., who compared their groups (n =/n =) with a “Leakage Index” and found no significant difference between them. 10 Our finding of no significant difference for POP, contrasts with the results of Schaffer et al. (n = 128), who reported that their Valsalva group had a poorer value for the Bp point on the POP‐Q, as well as decreased bladder capacity and first urge to void at 3 months postpartum. 9 Similarly, Koyucu et al. (n = 80) found a higher angle at maximum straining during the Q‐tip test in the Valsalva pushing group. 11 It must be noted that these two studies 9 , 11 found much worse POP‐Q values than those reported by us and by other authors. 21 , 22
These three previous randomized controlled trials are the only ones besides ours to have examined the effect of maternal pushing on pelvic floor function at 2–3 months postpartum. 9 , 10 , 11 In contrast, many studies have assessed UI rates from 6 weeks to 1 year after giving birth. Although we found incidence rates of 26.7% and 28.6% in our groups between 6 and 8 weeks after delivery, this rate varies in the literature from 10% to 63%, with a mean weighted prevalence among 31 studies of 31% (95% CI 26.0%–36.0%) postpartum and 24% (95% CI 17.0%–32.0%) at 6 weeks. 23 Potential explanations for this variation include different populations (with ethnic differences) and different co‐interventions during labor and delivery. 24
Numerous studies have also focused their outcomes on perineal lacerations at delivery (Cochrane perineal protection, position, pushing, etc.) and very few studies have tried to link labor and delivery interventions (positions, perineal massage, warm compresses, etc.) with pelvic floor function in later life. A cohort study found that supine positions are an independent risk factor for the onset of de novo UI and another study found that upright maternal positions during labor do not reduce the likelihood of UI. 25 A large randomized controlled trial comparing positions during the late stages of labor among nulliparous women with an epidural found no differences between the groups in the incidence or severity of urinary or fecal incontinence; 26 at assessments 1 year after delivery, authors found that 48.8% and 49.2% of women had leaked during the first 3 months. Other midwifery interventions during labor, such as perineal massage, warm compresses and a hand on the fetal head, appear to be associated with a lower risk of severe perineal trauma. 27 , 28 These techniques might therefore be associated with a low risk of pelvic floor consequences. Further studies to assess this possibility are needed. In our crude analysis, we found that OG pushing had a protective effect against UI among multiparous women. A recent meta‐analysis found that greater parity is associated with UI at 3 months postpartum and throughout the rest of the first year postpartum. 29 In our study, the UI incidence for multiparous women in the OG group was 10.3%, whereas we found an incidence between 24.0% and 33.0% for primiparous women and 44.4% for multiparous women in the CG group.
One strength of our study is that we assessed pelvic floor function with both an anatomic (POP‐Q) and a functional (ICIQ‐SF) assessment, using two methods widely validated by the international community. Moreover, these evaluations were performed by a limited number of professionals, all trained in this common procedure. Another strength is that, unlike most studies on this topic, we standardized the training for both pregnant women and professionals with a specific training session and two separate films specifically created for the study. 13 Our study is also the only one to include principally women using epidural analgesia (>95%). This inclusion rate is an important strength in view of the need for evidence‐based practices for the increasing number of women choosing epidural analgesia (82.2% in France in 2016). Finally, we had a very good follow‐up rate for this evaluation 6–8 weeks after delivery.
One limitation of this multicenter study is that finally it took place mainly at a single center, which prevented us from identifying any center effect. A second limitation is the less than optimal compliance in the OG group (63.6 ± 30.6% compared with 98.3 ± 9.4% in the CG group). The practice of OG pushing, even when directed, may be hampered by the use of epidural analgesia, which may reduce the desire to push. 30 A third limitation is that there was no a priori power calculation for these outcomes: it is possible that the lack of difference is due to the small sample size. Moreover, we had no data on pelvic floor function and UI before delivery, although they are risk factors for UI, and our study lacks power for a multivariate subgroup analysis according to parity (primiparous/multiparous).
5. CONCLUSION
The type of directed pushing—OG vs CG—used by women with epidural analgesia during delivery does not affect their pelvic floor function 6–8 weeks after delivery. The type of maternal pushing used during delivery should be chosen according to women's preferences, experience and ability. These findings are not inconsistent with the hypothesis that CG pushing increases perineal pressure, leading to pelvic floor problems, especially for multiparous women. Future research should focus on this group, who are at higher risk of UI, to identify techniques that protect pelvic floor function. Other midwifery practices should be considered to prevent POP.
AUTHOR CONTRIBUTIONS
CB: Conceptualization, methodology, software, investigation, writing—original draft, project administration, visualization. ADL: Formal analysis, data curation, writing—review & editing. DS: conceptualization, writing—review & editing. PB and SC: investigation, writing—review & editing. FV: funding acquisition, conceptualization, methodology, formal analysis, supervision, writing—review & editing, visualization.
FUNDING INFORMATION
This study was supported by a grant from the French Ministry of Health (PHRC 2005 05.09).
CONFLICT OF INTEREST
The authors have stated explicitly that there are no conflicts of interest in connection with this article.
Supporting information
Table S1
ACKNOWLEDGMENTS
The authors thank the investigators in each maternity unit for their local study support: Mme Sylvie Bonnefont (Centre Hospitalier de Vichy), Dr Erdogan Nohuz (Centre Hospitalier de Thiers), Mme Claire Paganelli (Centre Hospitalier de Thiers) and Mme Valérie Martinez (Centre Hospitalier Universitaire de Grenoble). No compensation for the investigators or maternity wards was planned for this study.We are grateful to all the maternity unit teams, especially Prof. Denis Gallot and Miss Florence Delpirou for supporting the study at the Clermont‐Ferrand maternity unit, and to all the midwives‐investigators and midwives in non‐hospital private practice for their participation in the study by informing, training, recruiting and providing the interventions to all the pregnant women in the study, especially Miss Marion Truchot, Miss Cécile Courteix, Miss Sandrine Brachi. We also thank Jo Ann Cahn for translating the manuscript into English, funded by the study budget (private practice).
Barasinski C, Debost‐Legrand A, Savary D, Bouchet P, Curinier S, Vendittelli F. Does the type of pushing at delivery influence pelvic floor function at 2 months postpartum? A pragmatic randomized trial—The EOLE study. Acta Obstet Gynecol Scand. 2023;102:67‐75. doi: 10.1111/aogs.14461
REFERENCES
- 1. Abrams P, Smith AP, Cotterill N. The impact of urinary incontinence on health‐related quality of life (HRQoL) in a real‐world population of women aged 45–60 years: results from a survey in France, Germany, the UK and the USA. BJU Int. 2015;115:143‐152. [DOI] [PubMed] [Google Scholar]
- 2. Wood LN, Anger JT. Urinary incontinence in women. BMJ. 2014;349:g4531. [DOI] [PubMed] [Google Scholar]
- 3. Subak LL, Brown JS, Kraus SR, et al. The “costs” of urinary incontinence for women. Obstet Gynecol. 2006;107:908‐916. [DOI] [PMC free article] [PubMed] [Google Scholar]
- 4. Vrijens D, Berghmans B, Nieman F, van Os J, van Koeveringe G, Leue C. Prevalence of anxiety and depressive symptoms and their association with pelvic floor dysfunctions—a cross sectional cohort study at a pelvic care Centre. Neurourol Urodyn. 2017;36:1816‐1823. [DOI] [PubMed] [Google Scholar]
- 5. Leng B, Zhou Y, Du S, et al. Association between delivery mode and pelvic organ prolapse: a meta‐analysis of observational studies. Eur J Obstet Gynecol Reprod Biol. 2019;235:19‐25. [DOI] [PubMed] [Google Scholar]
- 6. Hallock JL, Handa VL. The epidemiology of pelvic floor disorders and childbirth: an update. Obstet Gynecol Clin North Am. 2016;43:1‐13. [DOI] [PMC free article] [PubMed] [Google Scholar]
- 7. Gartland D, MacArthur C, Woolhouse H, McDonald E, Brown SJ. Frequency, severity and risk factors for urinary and faecal incontinence at 4 years postpartum: a prospective cohort. BJOG. 2016;123:1203‐1211. [DOI] [PubMed] [Google Scholar]
- 8. Wesnes SL, Hannestad Y, Rortveit G. Delivery parameters, neonatal parameters and incidence of urinary incontinence six months postpartum: a cohort study. Acta Obstet Gynecol Scand. 2017;96:1214‐1222. [DOI] [PubMed] [Google Scholar]
- 9. Schaffer JI, Bloom SL, Casey BM, McIntire DD, Nihira MA, Leveno KJ. A randomized trial of the effects of coached vs uncoached maternal pushing during the second stage of labor on postpartum pelvic floor structure and function. Am J Obstet Gynecol. 2005;192:1692‐1696. [DOI] [PubMed] [Google Scholar]
- 10. Low LK, Miller JM, Guo Y, Ashton‐Miller JA, DeLancey JOL, Sampselle CM. Spontaneous pushing to prevent postpartum urinary incontinence: a randomized, controlled trial. Int Urogynecol J. 2012;24:453‐460. [DOI] [PMC free article] [PubMed] [Google Scholar]
- 11. Koyucu RG, Demirci N. Effects of pushing techniques during the second stage of labor: a randomized controlled trial. Taiwan J Obstet Gynecol. 2017;56:606‐612. [DOI] [PubMed] [Google Scholar]
- 12. Shafik A, El‐Sibai O, Shafik AA, Ahmed I. Effect of straining on perineal muscles and their role in perineal support: identification of the straining‐perineal reflex. J Surg Res. 2003;112:162‐167. [DOI] [PubMed] [Google Scholar]
- 13. Barasinski C, Vendittelli F. Effect of the type of maternal pushing during the second stage of labour on obstetric and neonatal outcome: a multicentre randomised trial—the EOLE study protocol. BMJ Open. 2016;6:e012290. [DOI] [PMC free article] [PubMed] [Google Scholar]
- 14. Barasinski C, Debost‐Legrand A, Vendittelli F. Is directed open‐glottis pushing more effective than directed closed‐glottis pushing during the second stage of labor? A pragmatic randomized trial – the EOLE study. Midwifery. 2020;91:102843. [DOI] [PubMed] [Google Scholar]
- 15. Martin A. Rythme cardiaque foetal pendant le travail: définitions et interprétation [fetal heart rate during labour: definitions and interpretation] in French. J Gynecol Obstet Biol Reprod (Paris). 2008;37(Suppl 1):S34‐S45. [DOI] [PubMed] [Google Scholar]
- 16. Avery K, Donovan J, Peters TJ, Shaw C, Gotoh M, Abrams P. ICIQ: a brief and robust measure for evaluating the symptoms and impact of urinary incontinence. Neurourol Urodyn. 2004;23:322‐330. [DOI] [PubMed] [Google Scholar]
- 17. Haylen BT, Maher CF, Barber MD, et al. An international Urogynecological association (IUGA)/international continence society (ICS) joint report on the terminology for female pelvic organ prolapse (POP). Neurourol Urodyn. 2016;35:137‐168. [DOI] [PubMed] [Google Scholar]
- 18. Bump RC, Mattiasson A, Bø K, et al. The standardization of terminology of female pelvic organ prolapse and pelvic floor dysfunction. Am J Obstet Gynecol. 1996;175:10‐17. [DOI] [PubMed] [Google Scholar]
- 19. Klovning A, Avery K, Sandvik H, Hunskaar S. Comparison of two questionnaires for assessing the severity of urinary incontinence: the ICIQ‐UI SF vs the incontinence severity index. Neurourol Urodyn. 2009;28:411‐415. [DOI] [PubMed] [Google Scholar]
- 20. Deruelle P, Servan‐Schreiber E, Riviere O, Garabedian C, Vendittelli F. Does a body mass index greater than 25 kg/m2 increase maternal and neonatal morbidity? A French historical cohort study. J Gynecol Obstet Hum Reprod. 2017;46:601‐608. [DOI] [PubMed] [Google Scholar]
- 21. Reimers C, Stær‐Jensen J, Siafarikas F, Saltyte‐Benth J, Bø K, Ellström EM. Change in pelvic organ support during pregnancy and the first year postpartum: a longitudinal study. BJOG. 2016;123:821‐829. [DOI] [PubMed] [Google Scholar]
- 22. Bø K, Hilde G, Stær‐Jensen J, Siafarikas F, Tennfjord MK, Engh ME. Postpartum pelvic floor muscle training and pelvic organ prolapse—a randomized trial of primiparous women. Am J Obstet Gynecol. 2015;212:38.e1‐38.e7. [DOI] [PubMed] [Google Scholar]
- 23. Moossdorff‐Steinhauser HFA, Berghmans BCM, Spaanderman MEA, Bols EMJ. Prevalence, incidence and bothersomeness of urinary incontinence between 6 weeks and 1 year post‐partum: a systematic review and meta‐analysis. Int Urogynecol J. 2021;32:1675‐1693. [DOI] [PMC free article] [PubMed] [Google Scholar]
- 24. Gonzalez DC, Khorsandi S, Mathew M, Enemchukwu E, Syan R. A systematic review of racial/ethnic disparities in female pelvic floor disorders. Urology. 2022;163:8‐15. [DOI] [PubMed] [Google Scholar]
- 25. Siahkal SF, Iravani M, Mohaghegh Z, Sharifipour F, Zahedian M. Maternal, obstetrical and neonatal risk factors' impact on female urinary incontinence: a systematic review. Int Urogynecol J. 2020;31:2205‐2224. [DOI] [PubMed] [Google Scholar]
- 26. Bick D, Briley A, Brocklehurst P, et al. A multicentre, randomised controlled trial of position during the late stages of labour in nulliparous women with an epidural: clinical effectiveness and an economic evaluation (BUMPES). Health Technol Assess. 2017;21:1‐176. [DOI] [PMC free article] [PubMed] [Google Scholar]
- 27. Rasmussen OB, Yding A, Andersen CS, Boris J, Lauszus FF. Which elements were significant in reducing obstetric anal sphincter injury? A prospective follow‐up study. BMC Pregnancy Childbirth. 2021;21:781. [DOI] [PMC free article] [PubMed] [Google Scholar]
- 28. Aasheim V, Nilsen ABV, Reinar LM, Lukasse M. Perineal techniques during the second stage of labour for reducing perineal trauma. Cochrane Database Syst Rev. 2017;(6):CD006672. [DOI] [PMC free article] [PubMed] [Google Scholar]
- 29. Wuytack F, Moran P, Daly D, Begley C. Is there an association between parity and urinary incontinence in women during pregnancy and the first year postpartum?: a systematic review and meta‐analysis. Neurourol Urodyn. 2022;41:54‐90. [DOI] [PubMed] [Google Scholar]
- 30. Lemos A, Amorim MMR, Dornelas de Andrade A, de Souza AI, Cabral Filho JE, Correia JB. Pushing/bearing down methods for the second stage of labour. Cochrane Database Syst Rev. 2017;(3):CD009124. [DOI] [PMC free article] [PubMed] [Google Scholar]
Associated Data
This section collects any data citations, data availability statements, or supplementary materials included in this article.
Supplementary Materials
Table S1