

Abstract
Introduction
We hypothesized that lower untreated systolic blood pressure (SBP) would be associated with a lower risk of dementia and death up to age 95.
Methods
SBP measured between 2000 and 2006 was evaluated in relationship to dementia risk and brain biomarkers from 2009‐2020 (n = 177) in the Gingko Evaluation of Memory Study (GEMS), mean age 95 in 2020. Participants had measurements of brain amyloid beta (Aβ) and repeat clinical‐cognitive evaluations every 6 months.
Results
By 2020, only 9 of 177 patients (5%) were alive and cognitively unimpaired (CU). Mean SBP from 2000 to 2006 was 120 mm Hg for nine alive/CU, 125 mm Hg for alive/mild cognitive impairment (MCI), and 130 mm Hg for alive/dementia (P = .03). The amount of Aβ was directly related to SBP levels. In multivariate analysis, Aβ+ in 2009 and thinner cortex were significant predictors of dementia. Excluding Aβ, SBP became a significant predictor of dementia.
Discussion
Low SBP untreated by antihypertensive medications was associated with significant decreased risk of dementia and less Aβ.
Keywords: aging, Alzheimer's disease, amyloid beta, blood pressure, vascular stiffness
1. INTRODUCTION
Elevated systolic blood pressure (SBP), especially in middle age, increases the risk of dementia. 1 Controversy remains as to whether (1) elevated BP contributes to the amount of amyloid β (Aβ) deposition in the brain 2 , 3 ; (2) higher BP is a risk factor for brain vascular disease that then leads to Aβ and phosphorylated tau (pTau) deposition and neurodegeneration and dementia 4 ; or (3) brain vascular disease is a determinant of neurodegeneration independent of the amount of Aβ deposition or pTau, that is, vascular dementia and Alzheimer's disease (AD) are separate entities. 5
Participants on or not on anti‐hypertensive medication (AHM) confound many studies of hypertension, brain vascular disease, and risk of dementia. 6 , 7 , 8 Individuals who have low BP throughout life and individuals who have lower BP following treatment of their elevated BP may have already caused brain microvascular disease and amyloidosis leading to dementia. 9
Trials of BP‐lowering drugs have had a small effect on reducing incidence of dementia. 10 , 11 There is practically no information from these clinical trials as to whether the treatment reduced the progression of Aβ, neurodegeneration, or white matter abnormalities. 12 , 13 Most of these trials did not have dementia as a primary outcome and therefore had relatively poorly quantified measurements of dementia and brain biomarkers or too short a follow‐up.
We previously reported on the follow‐up study of the Ginkgo Evaluation of Memory Study (GEMS) in Pittsburgh, PA, that the amount of cortical Aβ, white matter abnormalities, and neurodegeneration were predictors of dementia risk. 14 Higher pulse‐wave velocity (PWV), a measure of vascular stiffness, was associated with an increased risk of dementia and also with an increased prevalence and progression of cortical Aβ in GEMS. This was replicated in the Atherosclerosis Risk in Communities studies. 15 , 16 We also reported that lower pulse pressure was associated with a slower progression of brain Aβ in GEMS. 17
2. METHODS
One hundred seventy‐seven individuals had cortical Aβ measured with Pittsburgh compound‐B‐positron emission tomography (PiB‐PET) 18 in 2009 and were followed to 2020. Only 9 of the 177 participants (5%) remained cognitively unimpaired (CU); average age was 95. This cohort provided a unique opportunity to test whether lower BP from around age 80 to practical exhaustion of the cohort in 2020 was associated with a risk of both dementia and the development of brain cortical Aβ. The follow‐up study was limited to the Pittsburgh Field Center of GEMS.
GEMS has been described in detail. 19 In 2009, in the Pittsburgh Field Center only, ∼10 months after the GEMS close out, 182 of 575 possible eligible alive volunteers without dementia underwent magnetic resonance imaging (MRI) of the brain and PiB‐PET imaging, and 177 of these were followed to 2020 (Figure 1). The MRI and PET imaging was repeated every 2 years from 2009 to 2018 (n = 97).
FIGURE 1.
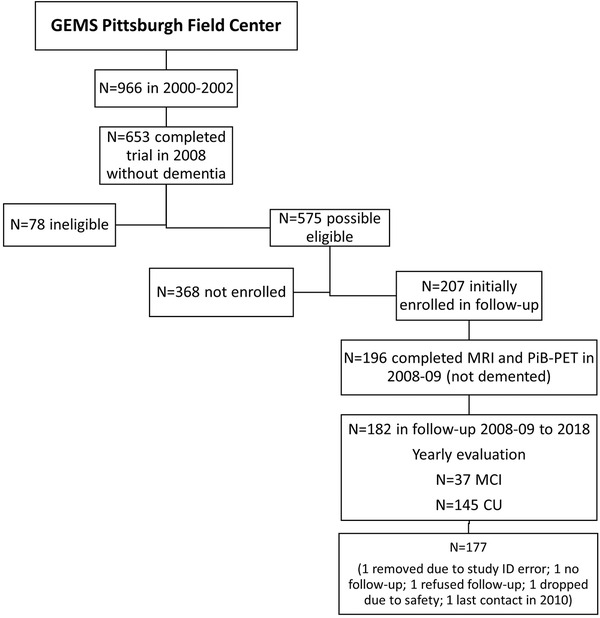
Description of GEMS Imaging Study Recruitment. This illustration shows the method of recruitment for the current study of 177 GEMS participants in Pittsburgh
2.1. Cognitive status
The participants were evaluated every 6 months to measure cognition and to diagnose mild cognitive impairment (MCI) or dementia. The diagnosis of dementia and MCI was determined by consensus among a neurologist, psychiatrist, and a neuropsychologist. The diagnosis of dementia was based on a deficit in test performance in two or more cognitive domains of sufficient severity to affect activities of daily living, with normal intellectual function before the onset of cognitive abnormalities. If a participant died between visits, then further evaluation was conducted with family informants and a review of medical care to identify cognitive changes within that 6‐month window. The adjudication team was blind to PiB‐PET status, cortical thickness, quantitative measures of white matter lesions (WMLs), and laboratory studies.
The Functional Activity Questionnaire was used to evaluate disability. The mean (SD) score was 0.50 (0.72) for those alive and CU in 2020 as compared to 1.33 (0.78) for participants with dementia (P = .03). Only two of nine CU participants had disability scores ≥2. All testing was done within 1 year from the end of study by 2020, except for one of the nine CU alive participants. 20
HIGHLIGHTS
Few individuals survive to very old age, 95+, cognitively unimpaired, that is, 5%.
Lower untreated systolic blood pressure (SBP) is associated with a significantly lower risk of dementia.
Lower SBP is correlated with lower pulse wave velocity and a lower risk of dementia.
SBP decreases prior to dementia or death, thereby confounding studies of BP and outcomes.
Lower SBP may link vascular disease, aging, and amyloid beta (Aβ) to dementia.
RESEARCH IN CONTEXT
Systematic review: There have been several recent meta‐analyses evaluating the relationship of hypertension and dementia and amyloid beta (Aβ). We and others have previously published a positive association of low systolic blood pressure (SBP) with low pulse wave velocity, that is, vascular stiffness and lower risk of dementia and Aβ.
Interpretation: Brain vascular disease, aging and proteinopathy, amyloid beta, and phosphorylated tau (pTau) are the primary hypotheses for the cause of older age dementia. A small number of participants survive to age 95+ cognitively unimpaired (5%). Lower untreated SBP and lower vascular stiffness were associated with both lower risk of dementia and Aβ to age 95.
Future directions: To further test the hypothesis that untreated lower SBP, that is, < 120 mm Hg, is associated with less Aβ and dementia requires studies in younger individuals using genetic models of lower or higher BP and evaluation of dementia and amyloid in clinical diseases associated with higher BP.
2.2. PiB‐PET and MRI methods
The technique using PiB‐PET and the MRI methods to evaluate cortical Aβ, hippocampal volume, WMLs, infarcts, and cortical thickness have been described (see Appendix Methods). 14 , 21 , 22 ,
2.3. Arterial stiffness
In 2011, ∼2 years following the initial neuroimaging studies, 91 of the GEMS Imaging Sub‐Study participants without dementia returned to the clinic for measures of arterial stiffness as determined by PWV using a noninvasive automated wave‐form analyzer (VP2000, Omron Co., Komaki, Japan). 23
2.4. Measurement of BP
Seated BP was measured in the study clinic from 2000 to 2006. There was no standardized BP measurement protocol in GEMS. Ninety‐three participants were not receiving AHM and 87 were receiving AHM in 2000 to 2002, whereas 57 participants were not receiving AHM and 117 were receiving AHM in 2006, the end of the GEMS trial. Mean BP in 2006 for participants not taking AHM was 127 (18) mm Hg and for those not taking AHM was 125±17 mm Hg. The slope of change in BP for participants not taking AHM in 2006 from 2000 to 2006 was 0.21±2.1 mm Hg per year, median of 0. For participants taking AHM in 2006, the slope of the SBP trajectory from 2000 to 2006 was −0.1±2.9 mm Hg per year, with a median of −0.93 mm Hg.
2.5. Statistical analyses
Continuous variables were presented as mean and standard deviation (SD) and categorical variables as N (%). Log‐transformation was applied to PWV due to skewed distribution. Between‐group differences were tested with chi‐square or Fisher exact (for categorized variables), t tests, and analysis of variance (ANOVA) (for continuous variables). SBP was analyzed in continuous form as well as in categorical form by quartiles. A Cox proportional hazards model that controlled for age, education level, presence of the apolipoprotein E (APOE) ε4 allele, PiB status, WML, and cortical thickness was used to examine the association between BP and incident dementia. Time to the event was defined as time from the 2009 visit date to the dementia date or, for those censored cases, to the last follow‐up visit date. All the analyses were conducted using SAS 9.4.
The results of follow‐up cognitive testing and the relationship to the risk of dementia have been published and not included in this article. 17
3. RESULTS
At 2009 at entry to the GEMS Imaging Sub‐Study, 140 of 177 (79%) were classified as CU and 37 (21%) as MCI. Fifty‐nine participants alive at 2020, including 9 (5%) of the total who were CU, 20 (11%) with MCI, and 30 (17%) with dementia. By 2020, 27 of 37 (73%) of MCI participants in 2009 were deceased as compared to 91 of 140 (65%) CU in 2009. Among the participants with MCI in 2009, none of those who survived to 2020 reverted to CU and 26 of the 37 (70%) converted to dementia by 2020 as compared to 64 of the 140 (46%) CU in 2009.
The mean age at death (n = 118) was 93 years and the age at diagnosis of dementia (n = 88) 91 years. The average time from dementia diagnosis to death (n = 59) was 2.7 years.
Table 1 shows the demographic and neuroimaging characteristics of the cohort by clinical diagnosis and survival (deceased/alive). At entry to GEMS in 2000, SBP was 115 mm Hg for the nine who were CU and 131 mm Hg for the 60 who were demented and deceased (P = .05) (Table 1). Among the 140 CU in 2009, SBP varied from 115 mm Hg for the 9 alive and CU to 133 mm Hg for deceased and demented by 2020 (P = 0.02). There were no differences in diastolic blood pressure (DBP) in 2000 or at any visit from 2000‐2006. Participants who remained CU and alive in 2020 (n = 9), with mean age of 76 at entry to the study in 2000, were better educated (17 years of education) and had higher Mini‐Mental Status Examination scores (Table 1). Eight of the nine CU and alive were APOE ε3/ε3 and one was ε3/ε4. All reported excellent or very good health in 2000 (Table 1). They had a significantly lower PiB standardized uptake value ratio (SUVR). Only one of nine CU and alive were PiB+ (SUVR ≥1.57) as compared to 40 of 60 (65%) demented and dead, and 18 of 30 (60%) of those alive and demented, P = .004. WML volume (adjusted for brain volume) was greater for demented participants (P = .04). Cortical thickness was greater for CU and alive participants (Table 1). There were no significant differences in body mass index (BMI), white blood cell count, cigarette smoking, history of stroke or coronary heart disease, or diabetes, and no differences by lipid levels in 2009 (not shown).
TABLE 1.
GEMS baseline data by dementia and survival status at 2020 (n = 177)
| CU and Alive (n = 9) | MCI and Alive (n = 20) | Dementia and Alive (n = 30) | CU and Deceased (n = 28) | MCI and Deceased (n = 30) | Dementia and Deceased (n = 60) | |||||||||
|---|---|---|---|---|---|---|---|---|---|---|---|---|---|---|
| Variables measured in 2000 | Mean (SD) | Median | Mean (SD) | Median | Mean (SD) | Median | Mean (SD) | Median | Mean (SD) | Median | Mean (SD) | Median | P | Age‐adjusted P‐value |
| Age, year | 76.0 (2.1) | 75.0 | 76.1 (1.7) | 75.0 | 77.6 (2.8) | 77.0 | 77.3 (2.8) | 76.5 | 79.2 (2.6) | 78.5 | 78.2 (2.7) | 78.0 | .0003 | – |
| Years of education | 17.4 (2.9) | 18.0 | 14.6 (2.7) | 14.5 | 14.6 (2.7) | 14.0 | 14.5 (2.5) | 14.0 | 14.1 (2.4) | 14.0 | 14.6 (2.6) | 15.0 | .038 | .065 |
| 3MSE score | 97.1 (2.4) | 97.0 | 93.6 (6.1) | 95.0 | 95.2 (3.2) | 96.0 | 95.1 (3.3) | 95.5 | 94.9 (4.7) | 96.5 | 93.2 (5.7) | 95.0 | .108 | .113 |
| APOE * | ||||||||||||||
| 2/2, 2/3 | 0 (0) | 5 (25) | 1 (4) | 3 (12) | 4 (14) | 7 (13) | .453 | .629 | ||||||
| 3/3 | 8 (89) | 10 (50) | 21 (75) | 20 (77) | 17 (61) | 35 (66) | ||||||||
| 2/4, 3/4, 4/4 | 1 (11) | 5 (25) | 6 (21) | 3 (11) | 7 (25) | 11 (21) | ||||||||
| SBP (mmHg) | 115.0 (9.3) | 118.0 | 129.5 (16.1) | 126.0 | 137.2 (21.7) | 134.0 | 129.9 (17.0) | 127.5 | 135.1 (17.2) | 135.0 | 131.2 (20.0) | 131.0 | .047 | .053 |
| DBP (mmHg) | 66.8 (9.0) | 63.0 | 74.2 (7.1) | 75.5 | 73.7 (8.6) | 73.0 | 70.3 (7.9) | 69.5 | 70.0 (9.8) | 69.0 | 70.8 (10.1) | 71.0 | .207 | .248 |
| Gender* | ||||||||||||||
| Male | 8 (89) | 14 (70) | 15 (50) | 14 (50) | 14 (47) | 39 (65) | .108 | |||||||
| Female | 1(11) | 6 (30) | 15 (50) | 14 (50) | 16 (53) | 21 (35) | .64 | |||||||
| Variables measured in 2009 | ||||||||||||||
| WMLs (i3) | 1540.0 | 1055.0 | 1604.9 | 1383.0 | 2250.0 | 1909.0 | 1776.7 | 1414.0 | 2031.2 | 2103.5 | 2733.0 | 2124.0 | .014 | .043 |
| PiB value (6 regions) | 1.4 (0.2) | 1.5 | 1.6 (0.4) | 1.5 | 1.8 (0.5) | 1.8 | 1.6 (0.4) | 1.5 | 1.8 (0.5) | 1.6 | 1.9 (0.5) | 2.0 | .003 | .006 |
| Cortical thickness | 3.2 (0.3) | 3.2 | 3.1 (0.4) | 3.2 | 3.0 (0.4) | 3.1 | 3.2 (0.3) | 3.2 | 3.2 (0.4) | 3.2 | 3.0 (0.4) | 3.0 | .048 | .051 |
| PiB status* | ||||||||||||||
| + | 8 (89) | 12 (60) | 12 (40) | 17 (61) | 10 (33) | 20 (33) | ||||||||
| − | 1 (11) | 8 (40) | 18 (60) | 11 (39) | 20 (67) | 40 (67) | .005 | |||||||
Abbreviations: 3MSE, Modified Mini‐Mental State Exam; APOE, apolipoprotein; CU, cognitively unimpaired; DBP, diastolic blood pressure; MCI, mild cognitive impairment; PiB, Pittsburgh compound‐B; SBP, systolic blood pressure; SD, standard deviation; WMLs, white matter lesions.
N (%).
Average SBP in 2000‐2006 was 120.7 mm Hg for those who were alive and CU in 2020 as compared to 130.2 mm Hg for those who were demented and alive (P = .03) (Table 2). The average SBP (119.7 mm Hg) was also lower for participants alive and not taking AHM in 2000 as compared to those alive and demented (132.3 mm Hg) (P = .009). There was no significant difference by cognitive status in average SBP for participants taking AHM in 2000: 124 versus 127 mm Hg (Table 2). There was also no significant difference in average SBP for participants deceased by 2020.
TABLE 2.
Averaged BP from 2000 to 2006 by diagnosis in 2020 among those alive at 2020
| All Participants (n = 59) | ||||||||||||
|---|---|---|---|---|---|---|---|---|---|---|---|---|
| CU | MCI (M) | Dementia (D) | P | |||||||||
| Average 2000‐2006 | n | Mean | SD | n | Mean | SD | n | Mean | SD | CU vs M | CU vs D | M vs D |
| SBP (mmHg) | 9 | 120.70 | 8.02 | 20 | 125.33 | 13.54 | 30 | 130.19 | 12.44 | .361 | .031 | .176 |
| DBP (mmHg) | 9 | 64.49 | 7.14 | 20 | 70.23 | 5.97 | 30 | 67.48 | 5.91 | .036 | .085 | .277 |
| Participants Not on AHM at 2000 (n = 37) | ||||||||||||
|---|---|---|---|---|---|---|---|---|---|---|---|---|
| CU | MCI (M) | Dementia (D) | p‐value | |||||||||
| Average 2000‐2006 | n | Mean | SD | n | Mean | SD | n | Mean | SD | CU vs M | CU vs D | M vs D |
| SBP (mmHg) | 7 | 119.73 | 8.99 | 13 | 122.35 | 9.73 | 17 | 132.33 | 12.19 | .338 | .009 | .007 |
| DBP (mmHg) | 7 | 65.49 | 7.89 | 13 | 69.31 | 4.71 | 17 | 67.67 | 6.65 | .083 | .229 | .937 |
| Participants on AHM at 2000 (n = 22) | ||||||||||||
|---|---|---|---|---|---|---|---|---|---|---|---|---|
| CU | MCI (M) | Dementia (D) | P | |||||||||
| Average 2000‐2006 | n | Mean | SD | n | Mean | SD | n | Mean | SD | CU vs M | CU vs D | M vs D |
| SBP (mmHg) | 2 | 124.13 | 0.08 | 7 | 130.85 | 18.34 | 13 | 127.38 | 12.69 | .145 | .746 | .478 |
| DBP (mmHg) | 2 | 60.96 | 1.36 | 7 | 71.93 | 7.96 | 13 | 67.23 | 5.04 | .013 | .200 | .137 |
Abbreviations: AHM, antihypertensive medications; CU, cognitively unimpaired; DBP, diastolic blood pressure; MCI, mild cognitive impairment; SBP, systolic blood pressure; SD, standard deviation.
3.1. Aβ deposition
PiB‐PET status did not vary by SBP measured at any time point between 2000 and 2006 for the total sample (Table 3). Participants alive (n = 32) and PiB− (SUVR ≤1.57) had significantly lower BP at almost every time point between 2000 and 2006 than participants who were alive and PiB+. For example, in 2000, the SBP for those PiB− was 125 mm Hg (n = 32) and for those PiB+ was 142 mm Hg (n = 27), P = .0001 (Table 3). There was no association between PiB+ and BP levels as measured in either 2000 or 2006 among those who were deceased by 2020 (not shown).
TABLE 3.
SBP by PiB status in 2009 by year of BP measurement
| PiB Status at 2009 – All Participants | PiB Status at 2009 – Alive Participants in 2020 | |||||
|---|---|---|---|---|---|---|
| Negative (n = 79) | Positive* (n = 98) | Age‐adjusted | Negative (n = 32) | Positive* (n = 27) | Age‐adjusted | |
| Year | Mean (SD) | Mean (SD) | P‐value | Mean (SD) | Mean (SD) | P‐value |
| 2000 | 130.4 (17.0) | 134.7 (15.8) | .105 | 124.9 (15.5) | 141.7 (15.8) | .0001 |
| 2001 | 127.3 (14.9) | 130.4 (13.5) | .138 | 122.5 (12.6) | 133.2 (13.0) | .002 |
| 2002 | 126.2 (15.9) | 128.9 (13.6) | .238 | 122.3 (13.8) | 129.4 (13.3) | .051 |
| 2003 | 126.9 (16.6) | 129.8 (16.1) | .294 | 122.5 (13.5) | 129.3 (13.8) | .068 |
| 2004 | 123.8 (15.4) | 128.1 (16.4) | .063 | 121.4 (14.1) | 128.6 (11.4) | .041 |
| 2005 | 126.0 (17.1) | 130.0 (14.8) | .102 | 122.1 (15.4) | 132.7 (16.1) | .014 |
| 2006 | 124.0 (18.2) | 128.7 (18.3) | .096 | 119.7 (14.4) | 135.3 (20.1) | .001 |
Abbreviations: PiB, Pittsburgh compound‐B; SBP, systolic blood pressure; SD, standard deviation; SUVR, standard uptake value ratio.
*SUVR ≥1.57.
The association of SBP and PiB‐PET as a continuous variable was further evaluated for PiB‐PET measured in 2009‐2011 and 2013. At each time point there was a linear relationship between the SBP levels as measured in 2000 or in 2006 and the amount of cortical Aβ, that is, PiB‐PET SUVR, for those who were alive and not taking AHM in 2020 (not shown).
The relationship of the amount of PiB‐PET by SBP levels was then further quantified within final cognitive diagnosis categories in 2020, irrespective of survival status by 2020 (CU = 23, MCI = 26, incident dementia = 46) in the longitudinal analysis and PiB measured in 2009, 2011, and 2013 (n = 95). Only 31% of the participants in the lowest BP category, that is, < 122 mm Hg, were demented as compared to 76% (16 of 18) in the highest BP category, that is, > 143 mm Hg. At each level of SBP, the SUVR for PiB was higher for participants demented by 2020 as compared to CU or MCI. PiB‐PET increased within each cognitive category, CU, MCI, and dementia, over three measurements, 2009, 2011, and 2013. Level of SBP was related to amount of PiB‐PET within cognitive categories but not linearly (Table 4).
TABLE 4.
PiB SUVR by quartile of SBP in 2000 and last diagnosis in 2020 (n = 95) (Longitudinal cohort*)
| Q1: SBP ≤122 | Q2: SBP 123‐132 | Q3: SBP 133‐143 | Q4: SBP > 143 | Age‐adjusted P‐value† | Age‐adjusted P‐value for trends† | Total | ||||||
|---|---|---|---|---|---|---|---|---|---|---|---|---|
| Last diagnosis in 2020 | PiB SUVR | n | Mean (SD) | n | Mean (SD) | n | Mean (SD) | n | Mean (SD) | |||
| CU | 2009 | 12 | 1.47 (0.14) | 4 | 1.37 (0.13) | 5 | 1.81 (0.39) | 2 | 1.31 (0.03) | .034 | .813 | 23 |
| 2011 | 12 | 1.68 (0.16) | 4 | 1.47 (0.10) | 5 | 2.04 (0.50) | 3 | 1.47 (0.22) | .024 | .928 | ||
| 2013 | 10 | 1.72 (0.21) | 3 | 1.57 (0.10) | 3 | 2.11 (0.59) | 2 | 1.47 (0.03) | .175 | .627 | ||
| MCI | 2009 | 8 | 1.64 (0.50) | 9 | 1.88 (0.36) | 6 | 1.60 (0.40) | 3 | 1.56 (0.32) | .430 | .631 | 26 |
| 2011 | 7 | 1.62 (0.21) | 9 | 2.23 (0.42) | 7 | 2.00 (0.54) | 3 | 1.76 (0.40) | .054 | .796 | ||
| 2013 | 6 | 1.77 (0.39) | 7 | 2.23 (0.41) | 5 | 1.73 (0.34) | 1 | 1.39 (–) | .042 | .299 | ||
| Dementia | 2009 | 9 | 1.74 (0.52) | 12 | 1.80 (0.40) | 9 | 2.25 (0.59) | 16 | 1.95 (0.48) | .165 | .173 | 46 |
| 2011 | 9 | 2.07 (0.65) | 12 | 2.10 (0.50) | 8 | 2.42 (0.66) | 16 | 2.21 (0.48) | .628 | .447 | ||
| 2013 | 9 | 2.08 (0.58) | 10 | 2.23 (0.57) | 7 | 2.42 (0.69) | 13 | 2.38 (0.53) | .685 | .268 | ||
| Total n (%)‐Dementia | 29 (31) | 25 (48) | 20 (45) | 21 (76) | 95 (100) | |||||||
Abbreviations: .;CU, cognitively unimpaired; MCI, mild cognitive impairment; PiB SUVR, Pittsburgh compound‐B standard uptake value ratio; Q, quartile; SBP, systolic blood pressure; SD, standard deviation.
*More than 1 PiB‐PET measurement between 2009 and 2020.
†P‐value comparison across categories (CU, MCI, dementia) by year.
The association of low SBP, especially not on AHM, and risk of dementia and the amount of cortical Aβ could be a function of the relationship of BP with other variables. Participants in the lowest quartile of SBP < 122 mm Hg had more years of education (P = .06) and faster gait speed for the 15 foot walk (P = .07) (Table A.1). There was no difference in the distribution of SBP in relationship to age, BMI, creatinine, number of blocks walked, or general health status in 2002. The amount of cigarette smoking and alcohol consumption was also very low and not related to BP. The relationship between the 15 foot walk (gait speed) and level of SBP was significant only for participants not taking AHM in 2000. There was, however, no relationship between gait speed in 2000 to 2002 and incidence of dementia for the sample from 2009 to 2020 or for those taking or not taking AHM.
In the multivariate Cox proportional hazards models, PiB+ in 2009 (SUVR >1.57) and cortical thickness in the lowest quartile (Table 5) were the only significant predictors of dementia to 2020. For higher SBP, the hazard ratio (HR) was 1.51 (0.78‐2.92) for the fourth versus first quartile. BP levels, as noted, were strongly related to the amount of PiB and the risk of dementia. It was possible that the effect of BP on the risk of dementia was modulated, in part, by the association with cortical Aβ and the strong association, as noted, of PiB positivity and risk of dementia in Cox models. The Cox models were therefore re‐run excluding PiB in the model. The HR for the fourth quartile of SBP versus the first for predicting dementia was 1.84 (0.96‐3.57). Cortical thickness remained a strong predictor of dementia in this model but not age, years of education, prevalence of APOE ε4 or amount of WMLs (Table 6). The analysis was then further restricted to participants who were alive in 2020. SBP in the fourth quartile was a strong independent predictor of dementia, with an HR of 4.75 (1.35‐16.8) (P = .015). Cortical thickness remained a significant predictor of dementia.
TABLE 5.
Cox Proportional Hazards Models For Prediction of Dementia in 2009‐2020
| Including PiB SUVR | Excluding PiB SUVR | |||||||
|---|---|---|---|---|---|---|---|---|
| All Participants in 2020 (n = 163, 80 dementia) | Alive in 2020 (n = 56, 27 dementia) | All Participants in 2020 (n = 163, 80 dementia) | Alive in 2020 (n = 56, 27 dementia) | |||||
| HR (95% CI) | P | HR (95% CI) | P | HR (95% CI) | P | HR (95% CI) | P | |
| Age, years | 1.08 (0.99‐1.17) | .079 | 1.18 (0.99‐1.41) | .062 | 1.07 (0.99‐1.17) | .090 | 1.18 (0.99‐1.41) | .069 |
| Years of education | 0.97 (0.88‐1.06) | .448 | 0.89 (0.74‐1.06) | .184 | 0.97 (0.89‐1.07) | .554 | 0.90 (0.76‐1.08) | .245 |
| APOE ε4 | 0.93 (0.52‐1.66) | .804 | 0.74 (0.24‐2.27) | .602 | 1.21 (0.70‐2.12)* | .495 | 1.38 (0.52‐3.70) † | .520 |
|
SBP in 2000, mm Hg 123‐132 133‐143 >143 |
1.01 (0.51‐1.97) 1.08 (0.55‐2.10) 1.51 (0.78‐2.92) |
.988 .823 .226 |
0.62 (0.15‐2.64) 1.24 (0.31‐4.90) 1.69 (0.37‐7.70) |
.518 .764 .497 |
1.13 (0.58‐2.20) 1.36 (0.71‐2.61) 1.84 (0.96‐3.53) |
.716 .358 .065 |
0.97 (0.24‐3.94) 2.60 (0.75‐8.97) 4.75 (1.35‐16.78) |
.961 .131 .015 |
| PiB+ in 2009 (≥1.57 SUVR) | 2.40 (1.44‐3.98) | .001 | 4.63 (1.51‐14.17) | .007 | ||||
| WML+ ‡ | 1.43 (0.83‐2.45) | .194 | 1.94 (0.65‐5.83) | .237 | 1.36 (0.79‐2.33) ¶ | .269 | 1.51 (0.50‐4.49) | .464 |
| Cortical thickness <2.78 mm (first quartile) | 2.74 (1.65‐4.55) | .0001 | 4.42 (1.54‐12.69) | .006 | 2.30 (1.39‐3.82) # | .0012 | 2.80 (0.99‐7.95) | .053 |
Abbreviations: APOE ε4, apolipoprotein E ε4 variant; CI, confidence interval; CU, cognitively unimpaired; MCI, mild cognitive impairment; PiB, Pittsburgh compound‐B; SBP, systolic blood pressure; SUVR, standard uptake value ratio; WML, white matter lesion.
n = 33 (20.2%).
n = 12 (21.4%).
WML+ was defined as volumes >75th percentile of those iCU participants.
n = 41 (25.2%).
n = 37 (22.7%).
3.2. Post‐first PiB‐PET MRI—2009 to 2020
BP was measured in participants as part of the annual visits after the first PiB‐PET MRI from 2009 to 2020. Mean SBP at the last visit in 2009‐2020 was 136 (22) mm Hg, with no difference between participants who were alive or dead by 2020 or on drugs or treatment for hypertension. Average SBP for the alive and CU participants (n = 9) by 2020 was 128 mm Hg, alive and MCI (n = 16) was 136 mm Hg, and alive and demented (n = 25) was 136 mm Hg; for participants who were classified as CU prior to death at last visit between 2009 and 2020 (n = 24), 134 mm Hg, MCI (n = 25) 136 mm Hg, and dead and demented (n = 47) 138 mm Hg.
At the last visit between 2009 and 2020, 58 (37%) of 154 reported a history of cardiovascular disease (CVD) defined as heart attack, angina, stroke, angioplasty, or coronary bypass surgery. Only 1 of 9 (11%) alive and CU reported CVD as compared to 8 of 28 (29%) alive and demented and 22 of 50 (44%) deceased and demented and 5 of 22 (23%) deceased and CU prior to death had CVD.
4. DISCUSSION
Brain vascular disease, brain aging, and amyloidosis, that is, Aβ and pTau, are the major hypothesized determinants of dementia in older individuals. To develop dementia at older ages, one has to both live to older age and develop incident dementia. Increased vascular stiffness, higher PWV resulting in higher SBP, is strongly related to biological aging and to brain vascular disease; previous reports from GEMS and other studies have shown it to be related to brain Aβ and it may provide the link between the three hypotheses above.
This is one of the few longitudinal studies that has evaluated low SBP in untreated older individuals and brain biomarkers. 7 Many studies are either cross‐sectional, relating BP to the amount of Aβ or to dementia, or are longitudinal in which the extent of Aβ was determined at postmortem examination but the relationship between the time of the BP elevations and the development of Aβ are not available. 2 , 24 , 25 , 26 , 27 , 28
Few participants in this study remained alive and CU (9 of 177, 5%) at approximately age 95 by 2020. The unique characteristic of those who were alive and not demented at 2020 was low SBP in 2000 to 2002 at entry to the trial or averaged between 2000 and 2006. Participants with lower SBP, especially those not taking AHM, had a lower risk of dementia by 2020, lower cortical Aβ (PiB‐PET), and lower amount of WMLs. Individuals with low untreated SBP to older ages may either have a lower genetic susceptibility to elevated BP or lifetime lower exposure to elevated BP risk factors, such as salt intake, obesity, and so on.
We previously reported that lower PWV in GEMS, that is, less vascular stiffness, was associated with lower risk of dementia, a lower amount of cortical Aβ and progression of Aβ over time. 15 , 23 PWV as measured in 2011 was higher for participants who were demented by 2018 (Table A.2), and lower SBP was strongly related to lower PWV in GEMS (Table A.3). The follow‐up was to 2018 rather than 2020 was due to very small sample size of measures of PWV and follow‐up to 2020.
Low SBP from earlier in life and lower PWV as well as a smaller increase in both vascular stiffness and SBP with increasing age may be key determinants of successful aging free of dementia. Unfortunately, probably <20% of the population has consistently very low SBP, that is, <115‐120 mm Hg and not taking AHM. Therefore, an increasing risk of AD may be caused by elevated SBP and greater vascular stiffness in younger adults, leading to brain arteriosclerosis and small vessel disease, injury to the neurovascular unit, and consequently, changes in blood‐brain barrier function including reduced clearance of Aβ, that is, decreased Aβ 1‐42 (Aβ1‐42) levels in blood and cerebrospinal fluid, which in turn leads to increased pTau deposition, especially among genetically susceptible individuals (ie, APOE ε4 and so on) and secondary neurodegeneration. 29 , 30 , 31 , 32 , 33
Studies have reported that higher SBP in older individuals is associated with a lower risk of cognitive decline and dementia or no risk of dementia. 34 There are several reasons that elevated BP may be associated with a lower risk of dementia in older individuals. First, SBP tends to decline in the years before the onset of dementia or death so that a higher SBP in the very elderly could be a marker of good health—reverse causality,35 that is, better cardiac function, and so on. The association between SBP and risk of dementia was limited to participants not taking AHM and alive in either 2018 or 2020. This could be due to the effects of changes in BP over time between 2000 and 2006, prior to the imaging studies. In this study (Table A.4), there was a decline in SBP between 2002 and 2006 for participants not taking AHM who became demented or died.
Second, elevated BP and arterial hemodynamics over time affects small arterioles in the brain. There is a substantial drop in SBP levels across the arterioles to the capillaries in the brain. Lowering SBP may have adverse effects by decreasing cerebral blood flow and the available supply of nutrients, oxygen, and glucose, leading to an increased risk of dementia.
In the Cardiovascular Health Study‐Cognition Study (CHS‐CS), 36 we noted that among the 19 CU survivors of 532 participants over the age of 90, a total of 3 (15.8%) had SBP >140 mm Hg in 1997 to 1999 at entry to the study as compared to 29 of 113 (26.6%) demented and alive (P = .19). Further evaluation of these 90+‐ year‐old participants through 2011 showed that 12 of 18 (67%) of those alive and CU had a SBP < 120 mm Hg as compared to 14 of 65 (29%) alive and demented (P = .04). In addition, we previously reported in the CHS‐CS that higher PWV was a significant predictor of incident dementia. 37
A positive association of higher BP levels and lower cognitive test scores in younger individuals has been reported. 38 Aβ deposition in the brain leading to Alzheimer's pathology and dementia is present many years before clinical dementia diagnosis. 39 Subtle changes in cognition are reported years prior to clinical diagnosis of MCI and dementia. 40 Elevated SBP at younger ages may be most important during the earlier phases of cognitive decline and development of brain biomarkers and brain small vessel artery disease. 41
Treatment of elevated BP in older individuals may reduce dementia incidence in older individuals by decreasing the risk of stroke or brain microvascular disease but have little effect on Alzheimer's pathology. 10 , 42
Aggregated Aβ and pTau, brain proteinopathies, are hallmarks of AD and dementia. Whether vascular stiffness and elevated SBP from early ages are major risk factors for these proteinopathies needs further investigation in prospective, longitudinal studies and clinical trials.
The lower BP levels as noted may also be a marker of successful aging related to unique lifestyles. 43 For example, higher levels of physical activity are associated with less stiffness and lower SBP. 44 Populations in which BP is low throughout the lifetime secondary to specific genetic attributes may have a lower prevalence of dementia at older ages and less Alzheimer's pathology. 45 , 46 Whether genetic risk scores for elevated BP are associated with earlier‐age brain biomarkers of Alzheimer's pathology has also not been determined. 47 , 48 , 49 , 50 Specific diseases related to higher BP, such as hyperaldosteronism, 51 could be evaluated to determine their association with early Alzheimer's pathology as well as the risk of dementia at younger ages.
It would be important to determine whether “epigenetic aging” is associated with lower SBP and less vascular stiffness at younger ages and include early markers of cortical brain Aβ and pTau. Similarly, there are genetic polymorphisms related to aging or biological markers of aging 52 that may be related to both low SBP and Aβ and pTau proteinopathies. A genetic risk score for AD could be evaluated in relation to BP levels and vascular stiffness at younger ages. 53
Studies in younger individuals are necessary to evaluate the early stages of Aβ and tau proteinopathies, genetic susceptibility, BP, premature aging, and AD biomarkers. An alternative hypothesis is that lower SBP in this study is a measure of aging and successful longevity, but not to incident AD or AD pathology. Clinical trials to evaluate maintaining low SBP from young ages or preventing an increase in vascular stiffness with age and their relationship to brain biomarkers may also be of great interest and are feasible now.
Studies of very old individuals, including the present study, have small sample sizes as the likelihood of reaching older ages free of dementia and frailty is small. We did not have standardized BP measurements but were able to average six BP measurements over a 6 to 8‐year period.
CONFLICTS OF INTEREST
Dr. Mathis receives royalty payments from GE Healthcare (indirect through a license agreement with the University of Pittsburgh). GE Healthcare holds a license agreement with the University of Pittsburgh based on the technology described in this article. Dr. Mathis is a co‐inventor of PiB and, as such, has a financial interest in this license agreement. GE Healthcare provided no grant support for this study and had no role in the design or interpretation of the results or the preparation of this manuscript. All other authors have no conflicts of interest related to this work. Dr Chang conducted the statistical analysis.
ACKNOWLEDGEMENTS
This work was supported by grants U01 AT000162 from the National Center for Complementary and Alternative Medicine (NCCAM) and the Office of Dietary Supplements, and P01‐AG025204, P30 AG066468, and RF1 AG052525 from the National Institute on Aging.
Positron Emission Tomography (PET) Imaging
Pittsburgh compound‐B‐PET (PiB‐PET) data acquisition has been described in great detail and involved 20 minute acquisition (4 × 5 minute frames) beginning 50 minutes after injection of 15±1.5 mCi of PiB on a Siemens/CTI ECAT HR+ scanner in three‐dimensional imaging mode equipped with a NeuroInsert. 1 The data were reconstructed using filtered back projection. The final reconstructed PET image resolution was ∼6 mm (transverse and axial). An iterative mild outlier cutoff method defined participants as Aβ positive if the atrophy‐corrected composite standardized uptake value ratio (SUVR) of six regions was >1.57, and later modified to 1.67 SUVR at subsequent follow‐up examinations for longitudinal analysis. A continuous variable was the mean PiB SUVR value in six regions of interest (ROIs): anterior cingulate gyrus; anterior ventral striatum; frontal cortex; lateral temporal cortex; parietal cortex; precuneus cortex, bilaterally. 1
Magnetic Resonance Imaging (MRI) Scans
MRI scans were performed on a GE Signa scanner with a standard head coil, including fluid‐attenuated inversion recovery and spoiled echo gradient images. Brain Apptissue volumes ( (gray matter, white matter, and cerebrospinal fluid [CSF]) were calculated by segmenting the skull‐stripped T1‐weighted image in native anatomical space using the FMRIB's Automated Segmentation Tool (FAST, FSL 4.1.4). 1 , 2 , 3 Total intracranial volume (ICV) was computed as the volume contained within the “inner skull” using the Brain Extraction Tool with an advanced option (‐A). A fuzzy‐connectedness algorithm was used to segment the white matter lesions (WMLs) from each individual's T2‐weighted, fluid‐attenuated inversion recovery images. The volume of WMLs is presented as the proportion of the ICV, and volumes >75th percentile of those in normal participants were considered abnormal or WML+. These classifications were done before the data analysis.
TABLE A.1 Variables Measured in 2000 by Quartiles of SBP in 2000
| Q1: SBP ≤122 | Q2: SBP 123‐132 | Q3: SBP 133‐143 | Q4: SBP >143 | |||||||||||
|---|---|---|---|---|---|---|---|---|---|---|---|---|---|---|
| n | Mean (SD) | Median | n | Mean (SD) | Median | n | Mean (SD) | Median | n | Mean (SD) | Median | P | Age‐adjusted P‐value | |
| Age | 48 | 78.0 (3.0) | 77.0 | 42 | 77.0 (2.4) | 76.0 | 46 | 77.8 (2.8) | 77.0 | 41 | 78.3 (2.6) | 78.0 | .162 | – |
| Years of education | 48 | 15.4 (2.7) | 16.0 | 42 | 14.9 (2.9) | 14.5 | 46 | 14.3 (2.6) | 14.0 | 41 | 13.9 (2.1) | 14.0 | .047 | .056 |
| Body mass index | 48 | 26.6 (3.5) | 26.5 | 42 | 26.9 (4.1) | 26.6 | 46 | 27.0 (3.8) | 27.1 | 41 | 26.9 (4.3) | 26.3 | .962 | .947 |
| Creatinine | 48 | 1.0 (0.2) | 1.0 | 42 | 1.0 (0.2) | 1.0 | 46 | 1.0 (0.2) | 0.9 | 41 | 0.9 (0.2) | 0.9 | .400 | .396 |
| 15‐foot corridor walk, seconds | 46 | 4.9 (1.3) | 4.5 | 39 | 5.2 (1.2) | 5.0 | 46 | 4.9 (0.9) | 4.9 | 40 | 5.6 (1.8) | 5.2 | .072 | .072 |
| N | % | N | % | N | % | N | % | |||||||
| General health | ||||||||||||||
| Good/fair | 16 | 33.3 | 21 | 50.0 | 22 | 47.8 | 18 | 43.9 | ||||||
| Excellent/very good | 32 | 66.7 | 21 | 50.0 | 24 | 52.2 | 23 | 56.1 | .377 | .340 | ||||
| Number of blocks walked/week | ||||||||||||||
| ≤58 | 31 | 66.0 | 31 | 73.8 | 31 | 67.4 | 32 | 80.0 | ||||||
| >58 | 16 | 34.0 | 11 | 26.2 | 15 | 32.6 | 8 | 20.0 | .455 | .451 | ||||
Abbreviations: Q, quartile; SD, standard deviation; SBP, systolic blood pressure
TABLE A.2 Dementia and Survival Status in 2018 or Last Contact by PWV Measured in 2011
| CU and Alive (n = 13) | MCI and Alive (n = 13) | Dementia and Alive (n = 13) | CU and Deceased (n = 11) | MCI Deceased (n = 15) | Dementia Deceased (n = 20) | ||||||||
|---|---|---|---|---|---|---|---|---|---|---|---|---|---|
| Mean (SD) | Median | Mean (SD) | Median | Mean (SD) | Median | Mean (SD) | Median | Mean (SD) | Median | Mean (SD) | Median | Age‐adjusted P‐value* | |
| cfPWV (cm/s) | 1461.4 (343.1) | 1472.5 | 1236.6 (284.6) | 1197.0 | 1792.6 (379.7) | 1897.5 | 1495.6 (603.7) | 1348.0 | 1810.4 (993.7) | 1412.5 | 1608.7 (367.9) | 1677.5 | .030 |
| hfPWV (cm/s) | 1338.04 (186.4) | 1333.0 | 1278.9 (209.5) | 1239.5 | 1621.1 (348.5) | 1493.5 | 1222.5 (252.1) | 1153.5 | 1391.3 (352.8) | 1372.0 | 1444.4 (177.7) | 1444.3 | .005 |
| baPWV (cm/s) | 1755.7 (316.8) | 1785.8 | 1678.8 (215.2) | 1713.8 | 2081.5 (388.5) | 2030.5 | 1768.6 (222.5) | 1781.8 | 1847.3 (295.0) | 1722.1 | 1884.7 (200.6) | 1918.5 | .010 |
| faPWV (cm/s) | 1016.8 (138.7) | 992.5 | 1035.3 (128.0) | 1046.3 | 1101.7 (171.8) | 1080.8 | 1035.5 (39.6) | 1030.3 | 1097.2 (141.7) | 1092.0 | 1160.5 (272.8) | 1085.0 | .196 |
Abbreviations: cfPWV , carotid‐femoral pulse‐wave velocity; CU, cognitively unimpaired; hfPWV, heart‐femoral pulse‐wave velocity; brachial‐ankle pulse‐wave velocity; faPWV , femoral‐ankle pulse‐wave velocity; MCI, mild cognitive impairment; PWV, pulse‐wave velocity
*All P‐values were based on log‐transformed values.
TABLE A.3 Relation Between SBP in 2007 and baPWV in 2009
| SBP in 2007 | ||||||
|---|---|---|---|---|---|---|
| Subjects | baPWV | n | Mean (SD) | Median | P | Age‐adjusted P‐value |
| All | 1Q | 21 | 117.57 (13.90) | 114.0 | ||
| 2Q | 18 | 120.06 (13.62) | 122.5 | |||
| 3Q | 24 | 125.17 (12.32) | 121.0 | |||
| 4Q | 22 | 128.82 (14.57) | 131.0 | .038 | .046 | |
| Not on AHM in 2000 | 1Q | 8 | 107.50 (6.26) | 108.5 | ||
| 2Q | 12 | 125.00 (12.74) | 126.0 | |||
| 3Q | 15 | 125.33 (13.09) | 120.0 | |||
| 4Q | 14 | 129.21 (15.71) | 134.0 | .004 | .004 | |
| On AHM in2000 | 1Q | 12 | 123.83 (14.39) | 118.0 | ||
| 2Q | 6 | 110.17 (9.89) | 110.0 | |||
| 3Q | 9 | 124.89 (11.69) | 122.0 | |||
| 4Q | 8 | 128.13 (13.31) | 130.0 | .077 | .083 | |
| Not on AHM in 2000‐2007 | 1Q | 6 | 105.33 (5.68) | 106.5 | ||
| 2Q | 4 | 123.75 (17.52) | 128.0 | |||
| 3Q | 8 | 124.88 (12.65) | 124.0 | |||
| 4Q | 8 | 133.63 (11.98) | 136.5 | .003 | .002 | |
| On AHM in 2000‐2007 | 1Q | 15 | 122.47 (13.21) | 118.0 | ||
| 2Q | 14 | 119.00 (12.90) | 119.0 | |||
| 3Q | 16 | 125.31 (12.57) | 121.0 | |||
| 4Q | 14 | 126.07 (15.60) | 127.0 | .500 | .512 | |
Abbreviations: AHM, antihypertensive medication; baPWV, brachial‐ankle pulse‐wave velocity; Q, quartile; SBP, systolic blood pressure.
note: baPWV (cm/s) quartiles are 1Q: ≤1607.88, 2Q: 1607.89‐817.00, 3Q: 1817.01‐1997.88, 4Q: >1997.88
TABLE A.4 Change in SBP from 2000 to 2006 by Dementia and Survival Status int 2018 (n = 177)
| All Participants | Participants Not on AHM in 2000 | Participants on AHM in 2000 | ||||||||||
|---|---|---|---|---|---|---|---|---|---|---|---|---|
| Change in SBP from 2000 to 2006 | Change in SBP from 2000 to 2006 | Change in SBP from 2000 to 2006 | ||||||||||
| Status in 2018 | n | Mean | SD | median | n | Mean | SD | median | N | Mean | SD | median |
| Alive and CU | 21 | 1.76 | 16.94 | 1.50 | 13 | 3.62 | 19.23 | 3.00 | 8 | ‐1.25 | 12.99 | ‐2.00 |
| Alive and MCI | 24 | ‐5.86 | 17.61 | ‐3.00 | 15 | ‐8.90 | 16.69 | ‐3.50 | 9 | ‐0.81 | 18.92 | ‐0.50 |
| Alive and Dementia | 31 | ‐9.68 | 16.89 | ‐8.50 | 16 | ‐4.72 | 14.02 | ‐2.25 | 15 | ‐14.97 | 18.52 | ‐13.50 |
| Deceased and CU | 22 | ‐5.84 | 21.91 | ‐4.25 | 13 | ‐7.73 | 16.20 | ‐7.50 | 8 | ‐1.06 | 30.52 | 7.75 |
| Deceased and MCI | 29 | ‐6.03 | 16.22 | ‐3.50 | 14 | ‐7.18 | 16.25 | ‐8.25 | 15 | ‐4.97 | 16.69 | ‐1.50 |
| Deceased and Dementia | 49 | ‐7.96 | 20.06 | ‐10.00 | 21 | ‐10.95 | 14.02 | ‐10.00 | 28 | ‐5.71 | 23.61 | ‐11.00 |
Abbreviations: AHM, antihypertensive medication; CU, cognitively unimpaired; MCI, mild cognitive impairment; SBP, systolic blood pressure.
REFERENCE
Lopresti BJ, Campbell EM, Yu Z, et al. Influence of apolipoprotein‐E genotype on brain amyloid load and longitudinal trajectories. Neurobiol Aging 2020;94:111‐120.
Lopez OL, Klunk WE, Mathis C, et al. Amyloid, neurodegeneration, and small vessel disease as predictors of dementia in the oldest‐old. Neurology 2014;83(20):1804‐1811.
Lopez OL, Becker JT, Chang Y, et al. Amyloid deposition and brain structure as long‐term predictors of MCI, dementia, and mortality. Neurology 2018;90(21):e1920‐e1928.
Kuller LH, Snitz BE, Hughes TM, et al. Low Untreated systolic blood pressure over 18 years is associated with survival free of dementia age 90+. Alzheimer's Dement. 2022;18:2176–2187. 10.1002/alz.12493
REFERENCES
- 1. Walker KA, Power MC, Gottesman RF. Defining the relationship between hypertension, cognitive decline, and dementia: a review. Curr Hypertens Rep. 2017;19(3):24. [DOI] [PMC free article] [PubMed] [Google Scholar]
- 2. Nation DA, Edmonds EC, Bangen KJ, et al. Pulse pressure in relation to tau‐mediated neurodegeneration, cerebral amyloidosis, and progression to dementia in very old adults. JAMA Neurol. 2015;72(5):546‐553. [DOI] [PMC free article] [PubMed] [Google Scholar]
- 3. Vemuri P, Knopman DS, Lesnick TG, et al. Evaluation of Amyloid Protective Factors and Alzheimer Disease Neurodegeneration Protective Factors in Elderly Individuals. JAMA Neurol. 2017;74(6):718‐726. [DOI] [PMC free article] [PubMed] [Google Scholar]
- 4. Gottesman RF, Schneider AL, Zhou Y, et al. Association Between Midlife Vascular Risk Factors and Estimated Brain Amyloid Deposition. JAMA. 2017;317(14):1443‐1450. [DOI] [PMC free article] [PubMed] [Google Scholar]
- 5. Roseborough A, Ramirez J, Black SE, et al. Associations between amyloid beta and white matter hyperintensities: a systematic review. Alzheimers Dement. 2017;13(10):1154‐1167. [DOI] [PubMed] [Google Scholar]
- 6. Lennon MJ, Makkar SR, Crawford JD, et al. Midlife Hypertension and Alzheimer's Disease: a Systematic Review and Meta‐Analysis. J Alzheimers Dis. 2019;71(1):307‐316. [DOI] [PubMed] [Google Scholar]
- 7. Elias MF, Wolf PA, D'Agostino RB, et al. Untreated blood pressure level is inversely related to cognitive functioning: the Framingham Study. Am J Epidemiol. 1993;138(6):353‐364. [DOI] [PubMed] [Google Scholar]
- 8. Launer LJ, Masaki K, Petrovitch H, et al. The association between midlife blood pressure levels and late‐life cognitive function. The Honolulu‐Asia Aging Study. JAMA. 1995;274(23):1846‐1851. [PubMed] [Google Scholar]
- 9. Liu K, Colangelo LA, Daviglus ML, et al. Can Antihypertensive Treatment Restore the Risk of Cardiovascular Disease to Ideal Levels?: the Coronary Artery Risk Development in Young Adults (CARDIA) Study and the Multi‐Ethnic Study of Atherosclerosis (MESA). J Am Heart Assoc. 2015;4(9):e002275. [DOI] [PMC free article] [PubMed] [Google Scholar]
- 10. Hughes D, Judge C, Murphy R, et al. Association of Blood Pressure Lowering With Incident Dementia or Cognitive Impairment: a Systematic Review and Meta‐analysis. JAMA. 2020;323(19):1934‐1944. [DOI] [PMC free article] [PubMed] [Google Scholar]
- 11. Peters R, Warwick J, Anstey KJ, et al. Blood pressure and dementia: what the SPRINT‐MIND trial adds and what we still need to know. Neurology. 2019;92(21):1017‐1018. [DOI] [PubMed] [Google Scholar]
- 12. Dufouil C, Chalmers J, Coskun O, et al. Effects of blood pressure lowering on cerebral white matter hyperintensities in patients with stroke: the PROGRESS (Perindopril Protection Against Recurrent Stroke Study) Magnetic Resonance Imaging Substudy. Circulation. 2005;112(11):1644‐1650. [DOI] [PubMed] [Google Scholar]
- 13. Nasrallah IM, Gaussoin SA, Pomponio R, et al. Association of Intensive vs Standard Blood Pressure Control With Magnetic Resonance Imaging Biomarkers of Alzheimer Disease: secondary Analysis of the SPRINT MIND Randomized Trial. JAMA Neurol. 2021. [DOI] [PMC free article] [PubMed] [Google Scholar]
- 14. Lopez OL, Becker JT, Chang Y, et al. Amyloid deposition and brain structure as long‐term predictors of MCI, dementia, and mortality. Neurology. 2018;90(21):e1920‐e1928. [DOI] [PMC free article] [PubMed] [Google Scholar]
- 15. Hughes TM, Kuller LH, Barinas‐Mitchell EJ, et al. Arterial stiffness and beta‐amyloid progression in nondemented elderly adults. JAMA Neurol. 2014;71(5):562‐568. [DOI] [PMC free article] [PubMed] [Google Scholar]
- 16. Hughes TM, Wagenknecht LE, Craft S, et al. Arterial stiffness and dementia pathology: atherosclerosis Risk in Communities (ARIC)‐PET Study. Neurology. 2018;90(14):e1248‐e1256. [DOI] [PMC free article] [PubMed] [Google Scholar]
- 17. Snitz BE, Chang Y, Tudorascu DL, et al. Predicting resistance to amyloid‐beta deposition and cognitive resilience in the oldest‐old. Neurology. 2020;95(8):e984‐e994. [DOI] [PMC free article] [PubMed] [Google Scholar]
- 18. Klunk WE, Engler H, Nordberg A, et al. Imaging brain amyloid in Alzheimer's disease with Pittsburgh Compound‐B. Ann Neurol. 2004;55(3):306‐319. [DOI] [PubMed] [Google Scholar]
- 19. DeKosky ST, Williamson JD, Fitzpatrick AL, et al. Ginkgo biloba for prevention of dementia: a randomized controlled trial. JAMA. 2008;300(19):2253‐2262. [DOI] [PMC free article] [PubMed] [Google Scholar]
- 20. McDougall F, Edgar C, Mertes M, et al. Psychometric Properties of the Clinical Dementia Rating ‐ Sum of Boxes and Other Cognitive and Functional Outcomes in a Prodromal Alzheimer's Disease Population. J Prev Alzheimers Dis. 2021;8(2):151‐160. [DOI] [PubMed] [Google Scholar]
- 21. Lopez OL, Klunk WE, Mathis C, et al. Amyloid, neurodegeneration, and small vessel disease as predictors of dementia in the oldest‐old. Neurology. 2014;83(20):1804‐1811. [DOI] [PMC free article] [PubMed] [Google Scholar]
- 22. Lopresti BJ, Campbell EM, Yu Z, et al. Influence of apolipoprotein‐E genotype on brain amyloid load and longitudinal trajectories. Neurobiol Aging. 2020;94:111‐120. [DOI] [PMC free article] [PubMed] [Google Scholar]
- 23. Hughes TM, Kuller LH, Barinas‐Mitchell EJ, et al. Pulse wave velocity is associated with beta‐amyloid deposition in the brains of very elderly adults. Neurology. 2013;81(19):1711‐1718. [DOI] [PMC free article] [PubMed] [Google Scholar]
- 24. Lane CA, Barnes J, Nicholas JM, et al. Associations between blood pressure across adulthood and late‐life brain structure and pathology in the neuroscience substudy of the 1946 British birth cohort (Insight 46): an epidemiological study. Lancet Neurol. 2019;18(10):942‐952. [DOI] [PMC free article] [PubMed] [Google Scholar]
- 25. Langbaum JB, Chen K, Launer LJ, et al. Blood pressure is associated with higher brain amyloid burden and lower glucose metabolism in healthy late middle‐age persons. Neurobiol Aging. 2012;33(4):827. e811‐829. [DOI] [PMC free article] [PubMed] [Google Scholar]
- 26. Petrovitch H, White LR, Izmirilian G, et al. Midlife blood pressure and neuritic plaques, neurofibrillary tangles, and brain weight at death: the HAAS. Honolulu‐Asia aging Study. Neurobiol Aging. 2000;21(1):57‐62. [DOI] [PubMed] [Google Scholar]
- 27. Clark LR, Koscik RL, Allison SL, et al. Hypertension and obesity moderate the relationship between beta‐amyloid and cognitive decline in midlife. Alzheimers Dement. 2019;15(3):418‐428. [DOI] [PMC free article] [PubMed] [Google Scholar]
- 28. Corrada MM, Sonnen JA, Kim RC, et al. Microinfarcts are common and strongly related to dementia in the oldest‐old: the 90+ study. Alzheimers Dement. 2016;12(8):900‐908. [DOI] [PMC free article] [PubMed] [Google Scholar]
- 29. Zlokovic BV, Gottesman RF, Bernstein KE, et al. Vascular contributions to cognitive impairment and dementia (VCID): a report from the 2018 National Heart, Lung, and Blood Institute and National Institute of Neurological Disorders and Stroke Workshop. Alzheimers Dement. 2020. [DOI] [PubMed] [Google Scholar]
- 30. Rius‐Perez S, Tormos AM, Perez S, et al. Vascular pathology: cause or effect in Alzheimer disease? Neurologia. 2018;33(2):112‐120. [DOI] [PubMed] [Google Scholar]
- 31. Bateman RJ, Munsell LY, Morris JC, et al. Human amyloid‐beta synthesis and clearance rates as measured in cerebrospinal fluid in vivo. Nat Med. 2006;12(7):856‐861. [DOI] [PMC free article] [PubMed] [Google Scholar]
- 32. O'Rourke MF, Safar ME. Relationship between aortic stiffening and microvascular disease in brain and kidney: cause and logic of therapy. Hypertension. 2005;46(1):200‐204. [DOI] [PubMed] [Google Scholar]
- 33. Ma Y, Song A, Viswanathan A, et al. Blood Pressure Variability and Cerebral Small Vessel Disease: a Systematic Review and Meta‐Analysis of Population‐Based Cohorts. Stroke. 2020;51(1):82‐89. [DOI] [PMC free article] [PubMed] [Google Scholar]
- 34. Euser SM, van Bemmel T, Schram MT, et al. The effect of age on the association between blood pressure and cognitive function later in life. J Am Geriatr Soc. 2009;57(7):1232‐1237. [DOI] [PubMed] [Google Scholar]
- 35. Delgado J, Bowman K, Ble A, et al. Blood Pressure Trajectories in the 20 Years Before Death. JAMA Intern Med. 2018;178(1):93‐99. [DOI] [PMC free article] [PubMed] [Google Scholar]
- 36. Kuller LH, Lopez OL, Becker JT, et al. Risk of dementia and death in the long‐term follow‐up of the Pittsburgh Cardiovascular Health Study‐Cognition Study. Alzheimers Dement. 2016;12(2):170‐183. [DOI] [PMC free article] [PubMed] [Google Scholar]
- 37. Cui C, Sekikawa A, Kuller LH, et al. Aortic Stiffness is Associated with Increased Risk of Incident Dementia in Older Adults. J Alzheimers Dis. 2018;66(1):297‐306. [DOI] [PMC free article] [PubMed] [Google Scholar]
- 38. Yaffe K, Bahorik AL, Hoang TD, et al. Cardiovascular risk factors and accelerated cognitive decline in midlife: the CARDIA Study. Neurology. 2020;95(7):e839‐e846. [DOI] [PMC free article] [PubMed] [Google Scholar]
- 39. Bilgel M, An Y, Zhou Y, et al. Individual estimates of age at detectable amyloid onset for risk factor assessment. Alzheimers Dement. 2016;12(4):373‐379. [DOI] [PMC free article] [PubMed] [Google Scholar]
- 40. Vermunt L, Sikkes SAM, van den Hout A, et al. Duration of preclinical, prodromal, and dementia stages of Alzheimer's disease in relation to age, sex, and APOE genotype. Alzheimers Dement. 2019;15(7):888‐898. [DOI] [PMC free article] [PubMed] [Google Scholar]
- 41. Wardlaw JM, Smith C, Dichgans M. Mechanisms of sporadic cerebral small vessel disease: insights from neuroimaging. Lancet Neurol. 2013;12(5):483‐497. [DOI] [PMC free article] [PubMed] [Google Scholar]
- 42. Hachinski V, Einhaupl K, Ganten D, et al. Preventing dementia by preventing stroke: the Berlin Manifesto. Alzheimers Dement. 2019;15(7):961‐984. [DOI] [PMC free article] [PubMed] [Google Scholar]
- 43. Ungvari Z, Tarantini S, Sorond F, et al. Mechanisms of Vascular Aging, A Geroscience Perspective: jACC Focus Seminar. J Am Coll Cardiol. 2020;75(8):931‐941. [DOI] [PMC free article] [PubMed] [Google Scholar]
- 44. Havlik RJ, Simonsick EM, Sutton‐Tyrrell K, et al. Association of physical activity and vascular stiffness in 70‐ to 79‐year‐olds: the Health ABC Study. J Aging Phys Act. 2003;11:156‐166. [Google Scholar]
- 45. Marques FZ. Missing Heritability of Hypertension and Our Microbiome. Circulation. 2018;138(14):1381‐1383. [DOI] [PubMed] [Google Scholar]
- 46. Warren HR, Evangelou E, Cabrera CP, et al. Genome‐wide association analysis identifies novel blood pressure loci and offers biological insights into cardiovascular risk. Nat Genet. 2017;49(3):403‐415. [DOI] [PMC free article] [PubMed] [Google Scholar]
- 47. Yeung CHC, Lau KWD, SL AuYeung, et al. Amyloid, tau and risk of Alzheimer's disease: a Mendelian randomization study. Eur J Epidemiol. 2021;36(1):81‐88. [DOI] [PubMed] [Google Scholar]
- 48. Cosentino S, Schupf N, Christensen K, et al. Reduced prevalence of cognitive impairment in families with exceptional longevity. JAMA Neurol. 2013;70(7):867‐874. [DOI] [PMC free article] [PubMed] [Google Scholar]
- 49. Chouliaras L, Pishva E, Haapakoski R, et al. Peripheral DNA methylation, cognitive decline and brain aging: pilot findings from the Whitehall II imaging study. Epigenomics. 2018;10(5):585‐595. [DOI] [PMC free article] [PubMed] [Google Scholar]
- 50. Degerman S, Josefsson M, Nordin Adolfsson A, et al. Maintained memory in aging is associated with young epigenetic age. Neurobiol Aging. 2017;55:167‐171. [DOI] [PubMed] [Google Scholar]
- 51. Pitt B, Byrd JB. Primary Aldosteronism: new Insights Into its Detection and Cardiac Involvement. JACC Cardiovasc Imaging. 2020;13(10):2160‐2161. [DOI] [PubMed] [Google Scholar]
- 52. Franceschi C, Garagnani P, Olivieri F, et al. The Contextualized Genetics of Human Longevity: jACC Focus Seminar. J Am Coll Cardiol. 2020;75(8):968‐979. [DOI] [PubMed] [Google Scholar]
- 53. Filshtein TJ, Brenowitz WD, Mayeda ER, et al. Reserve and Alzheimer's disease genetic risk: effects on hospitalization and mortality. Alzheimers Dement. 2019;15(7):907‐916. [DOI] [PMC free article] [PubMed] [Google Scholar]