

Summary
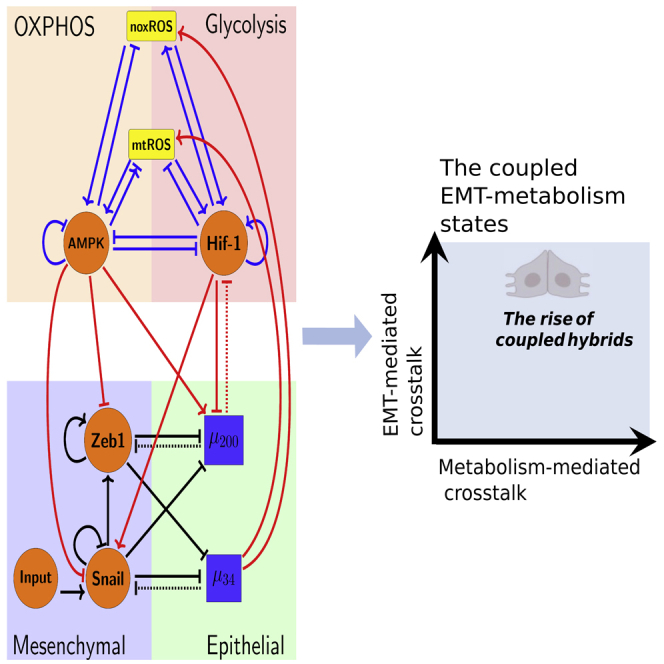
Cancer metastasis relies on an orchestration of traits driven by different interacting functional modules, including metabolism and epithelial-mesenchymal transition (EMT). During metastasis, cancer cells can acquire a hybrid metabolic phenotype (W/O) by increasing oxidative phosphorylation without compromising glycolysis and they can acquire a hybrid epithelial/mesenchymal (E/M) phenotype by engaging EMT. Both the W/O and E/M states are associated with high metastatic potentials, and many regulatory links coupling metabolism and EMT have been identified. Here, we investigate the coupled decision-making networks of metabolism and EMT. Their crosstalk can exhibit synergistic or antagonistic effects on the acquisition and stability of different coupled metabolism-EMT states. Strikingly, the aggressive E/M-W/O state can be enabled and stabilized by the crosstalk irrespective of these hybrid states’ availability in individual metabolism or EMT modules. Our work emphasizes the mutual activation between metabolism and EMT, providing an important step toward understanding the multifaceted nature of cancer metastasis.
Subject areas: Cancer systems biology, Metabolic flux analysis
Graphical abstract
Highlights
-
•
The crosstalk between EMT and metabolism circuits enables nine coupled states
-
•
Crosstalk exhibit synergistic or antagonistic effects in stabilizing coupled states
-
•
The E/M-W/O state emerges even when individual circuits do not enable hybrids
-
•
The mtROS/HIF-1 axis is critical to stabilize the aggressive E/M-W/O state
Cancer systems biology; Metabolic flux analysis
Introduction
Metastasis remains the leading cause of cancer-related deaths1 and it is critical to understand the physiological properties of cells that migrate from the primary tumor and initiate metastatic lesions. Typically, these properties have been studied one at a time. For example, during metastasis, cancer cells can engage a developmental program epithelial-mesenchymal transition (EMT), by which cells progressively lose epithelial (E) features such as cell-cell adhesion and apical-basal polarity, and acquire mesenchymal (M) features such as migration, invasion, and resistance to immune response.2 EMT has consistently been implicated in cells acquiring metastatic potential3 and therapeutic resistance.4 Recently, the bimodal picture of EMT has been superseded by a more complex scenario involving the hybrid epithelial/mesenchymal (E/M) phenotype which exhibits combined traits of epithelial (cell-cell adhesion) and mesenchymal (invasion) at the single-cell level. The existence of a hybrid E/M state has since been experimentally verified and associated with therapy resistance alongside poor survival rates.5,6,7,8 Importantly, hybrid E/M cells migrate collectively and appear to be the most capable of initiating metastatic growth.8,9,10,11,12,13 Fully understanding the behavior of the hybrid E/M phenotype is still an active area of research.
Metabolic reprogramming (MR), another hallmark of cancer, enables cancer cells to adjust their metabolic activity for biomass and energy supply to survive in hostile environments.1,14 Normal cells typically utilize oxidative phosphorylation (OXPHOS, O) under normoxic conditions and glycolysis under hypoxic conditions. However, cancer cells often prefer glycolysis even when oxygen is available (i.e., the Warburg effect (W) or aerobic glycolysis).15,16 During metastasis, cancer cells adjust their metabolic phenotype to survive in varying environments, resulting in cells switching between different types of metabolism.17,18,19 Metabolic reprogramming can enable cancer cells to combine different metabolic modes, such as acquisition of a hybrid W/O phenotype.20 The W/O phenotype is associated with enhanced metabolic potentials, high metastatic potential,21,22 and actively uses both glycolysis and OXPHOS.23,24,25 This suggests a tight connection between metabolic plasticity and cancer metastasis, specifically the hybrid W/O state with high metastatic potential.
As already mentioned, many studies of metastasis have focused on either EMT or metabolism.10,11,12,13,17,18,19 However, it has become increasingly clear extensive crosstalk exists between EMT and metabolism.22 Recent studies show metabolic reprogramming can drive EMT and increase metastatic potential, or induction of EMT can drive metabolic reprogramming.26,27,28,29,30 The underlying mechanisms that control how the metabolism functional module drives the EMT functional model, and vice versa, remain poorly understood, with several hypotheses discussed below. Kang et al. suggested that cancer cells typically undergo metabolic reprogramming first and then trigger EMT.31 This coupling, presumably, is a consequence of changes in the tumor microenvironment (TME) fostering metabolic reprogramming which drives EMT.29,30 Another hypothesis is that mutual activation between EMT and metabolic reprogramming contribute to flexible coupling of various EMT states with metabolic states. Possibly, the two hybrid phenotypes (E/M and W/O) become coupled under certain crosstalk conditions, leading to a greatly increased metastatic potential.22 Evidence supporting this connection has recently been noticed in circulating tumor cells (CTCs) which exhibit enhanced OXPHOS with no compromise in glycolysis32, and they may consist mainly of hybrid E/M cells, especially at high levels of the antioxidant regulator NRF2.33 In addition, hybrid E/M-like breast cancer stem cells exhibit increased levels of OXPHOS and glycolysis.34,35 Although there have been preliminary indications of the coupling of EMT and metabolic states, a systematic analysis of this coupling remains to be explored.
To decode the coupled decision-making of EMT and metabolism, we developed a mathematical model which couples the core gene regulatory circuit of EMT – miR-34(/SNAIL/miR-200(/ZEB10 with that of metabolism – AMPK/HIF-1/reactive oxygen species (ROS).20 By analyzing the coupled circuit, we identified that the /HIF-1/mitochondrial ROS (mtROS)//SNAIL axis is a key promoter of the coupled E/M-W/O state. In addition, HIF-1 may play a more important role in driving EMT than AMPK. Strikingly, we found the bi-directional crosstalk between EMT and metabolism ensures parameter regions in which only the coupled E/M-W/O state is accessible, and the biological significance of these parameters will depend on details of the microenvironment. Of interest, even if the individual circuits cannot give rise to the hybrid phenotype (i.e., neither the E/M or W/O states are initially accessible), on including crosstalk, the coupled E/M-W/O state emerges. Our results therefore suggest a highly aggressive plastic phenotype along both the EMT and metabolic axes (E/M-W/O) is a likely choice for a subset of cancer cells and, speculatively, may be critical for metastasis.
Model: Coupling the regulatory networks of EMT and metabolism
Previous investigations provided insights into individual EMT and individual metabolism networks. Exploration of the core EMT network by Lu et al. showed the /ZEB module was responsible for EMT tristability – epithelial (E, high /low ZEB), mesenchymal (M, low /low ZEB), and hybrid E/M (intermediate /intermediate ZEB) – whereas the /SNAIL module mainly acted as a noise buffer by reducing the effect of external noise on the decision-making of the EMT circuit10(see Figure 1B, STAR Methods, and parameters in Tables S1, S2, S3, S4, S5, S6, S8 and S9). In a separate line of investigation, through modeling the regulatory circuit of metabolism - AMPK/HIF-1/ROS, Yu et al. showed cancer cells can acquire at least three metabolic phenotypes – OXPHOS (O, high AMPK/low HIF-1), Warburg (W, low AMPK/high HIF-1), and W/O (intermediate AMPK/intermediate HIF-1)20 (see Figure 1C).
Figure 1.

The coupled EMT/MR circuit results in nine possible steady states
(A) The network showing the core EMT module (bottom), the core metabolic module (top), and the crosstalk as noted in red. The dashed lines denote miRNA-based regulation. Regulatory links ending in bars represent inhibition while arrows represent activation.
(B) The nullclines of the EMT network. The blue and the red nullclines represent the values of μ200 and mZ that lead to dmZ/dt (Equation 25) = 0 and du200/dt (Equation 26) = 0 respectively. The intersections of these two nullclines represent the steady states of the EMT network. The black dots represent stable steady states, and the hollow dots represent unstable steady states). The system is tristable with states E (high /low Zeb), M (low /high ZEB), and E/M (intermediate /ZEB).
(C) The nullclines of the metabolic network. The system is tristable with stable states O (high AMPK/low HIF-1), W (low AMPK/high HIF-1), and W/O (intermediate AMPK/HIF-1).
(D) The nine possible coupled states when all crosstalks between EMT and metabolism are inactive. The blue, purple, and black markers represent the EMT states. The circle, cross, and square represent the metabolism states (e.g., the coupled E/M-W/O state is represented as a purple cross).
To couple the regulatory circuits of EMT and metabolism, we did extensive literature search and identified the main bidirectional crosstalk between these two circuits (see Figure 1A). Please refer to Table S5 for a detailed description of the included crosstalk. The crosstalk between the EMT and metabolism circuits can be direct (e.g., HIF-1 upregulating SNAIL) or indirect (e.g., upregulating mtROS), the latter arising because our formulation focuses only on a few core components and effective interactions between them can occur via intermediate reactants. We initially investigate the role of various crosstalk on the coupling of different EMT states with different metabolism states. Then we examine whether the crosstalk can contribute to the emergence of the hybrid states (E/M, W/O) and the coupling of the E/M state with the W/O state.
We treat the coupled EMT-metabolim network as a transcription-translation chimeric circuit.10 The transcriptional regulation is mathematically represented as a shifted Hill function,36 where the fold change () represents the magnitude of the activation (>1) or inhibition (0=<<1). For readability of the figures, we define the parameter Λ = 1-λ such that maximal inhibition occurs when Λ = 1 (λ = 0) and no inhibition when Λ = 0 (λ = 1). We also consider the binding/unbinding dynamics (e.g., μ200 silencing HIF-1), where the functions, , and represent the active miRNA degradation rate, the active mRNA degradation rate, and the translation rate (details in STAR Methods and Figure S1).
We start with parameters such that both the EMT and metabolic networks are tristable. When the crosstalk is inactive, nine possible combinations of the EMT and metabolic phenotypes occur: E-W, E-O, E-W/O, M-W, M-O, M-W/O, E/M-W, E/M-O, and E/M-W/O (Figure 1D, details of numerical integration and analysis are given in STAR Methods). By activating the crosstalk, we can identify how the crosstalk affects the coupling between the EMT states and the metabolism states.
We must develop a classification method for the coupled states generated in various conditions when different types of crosstalk are included. Although the W state is characterized by high HIF-1/low AMPK and the E state by high /low ZEB expression, including the crosstalk will quantitatively alter the expression profiles of the various steady states. Therefore, the use of fixed thresholds to determine the state of the cell is no longer appropriate. Instead, we apply a distance metric using the nine coupled states generated by the decoupled network as reference states (Figure 1D). When a coupled state is generated, through calculating the distance between and each of the nine reference states (Figure 1D, see Table S9 for expression values), is thereby assigned to be in that reference state that has minimal distance with , as calculated by Equation 31. With our baseline decoupled network parameters, we show the hybrid states (W/O and E/M) are most populous followed by the W and M states, with the O and E states being least populated (Figures S2, S3 and S4, note how the frequency of these states depends on the model parameters).
Results
Individual crosstalk can push the downstream circuit toward a single state
Let us start by making just one crosstalk active, e.g., caused by an EMT-related microRNA. Now, in our model there is an unaffected upstream subnetwork (EMT, from where the link originates) and a regulated downstream one. (Note the model ignores any possible dilution of the microRNA because of its action on ROS; see below).
When NADPH oxidase derived ROS (noxROS) is upregulated by (Figure 2A), as there is no feedback to the EMT network, the occupancy of the E, E/M, and M states are unchanged. As the level of noxROS increases, the W-associated states are lost; first the E-W state, then the E/M−W, and finally the M−W state (Figure 2B andSTAR Methods). In addition, as noxROS increases, the W/O-associated states are stabilized and little change occurs for O-associated states (Figure 2C). Upon analyzing the coupled states, if noxROS increases then the E/M state becomes more likely to be associated with the W/O state (Figure 2D). In addition, the W state is most associated with the M state which is expected because the M state has the lowest level, resulting in a smaller increase of noxROS compared with other EMT states (Figure 2E).
Figure 2.

noxROS upregulated by stabilizes the W/O state and enhances the E/M-W/O coupled state
(A) A diagram of the core EMT (bottom) and metabolic (top) circuits connected by the crosstalk upregulating noxROS (red link). The EMT network is unchanged, as there is no feedback.
(B) As upregulates noxROS, four distinct phases occur; all nine coupled states followed by loss of the E-W, E/M−W, and M−W states (yellow, red, tan, and pink regions, respectively).
(C) The lines represent the percentage of initial conditions leading to the W (green), O (black), or W/O (blue) states as noxROS increases. (Background colors correspond to the phase colors of (B).)
(D) The frequency of the W/O-associated states (i.e., E-W/O, M-W/O, and E/M-W/O) compared to the inactive system (). All W/O-associated states are promoted, with the E/M-W/O state being greatly increased once .
(E) Same as (D) but for W-associated states. The W-associated states are suppressed with the M-W state lasting longest.
Similar changes have been observed via upregulating mtROS. Consistent with μ34 upregulating noxROS, the E-W and E/M−W states are suppressed first and the E/M-W/O state is stabilized (Figure S5). In addition, upregulating mtROS exhibited a greater increase in the frequency of the E/M-W/O state than upregulating noxROS. Further, activation of mtROS stabilizes the W/O state but reduces occupancy of the O state and W state. Together, these results suggest mtROS and noxROS may be critical factors in regulating the coupling of two hybrid states (E/M-W/O).
Regulation of HIF-1 affects both subcircuits
While the links only affect the downstream network, the miRNA regulation of HIF-1 by can affect both networks. This arises in our model because mediates the transcription and translation of HIF-1 mRNA, and as a result, can be recycled or degraded. Therefore, although the downstream metabolic network is modulated, the upstream EMT network is also affected via change of We have defined a silencing function to simulate the above-mentioned effect of on HIF-1 (details of function can be found in STAR Methods). Note as silencing increases, the restriction of the EMT states occur immediately; close to the only EMT state allowed is M while all the metabolic phenotypes are allowed. As silences HIF-1, the W/O and W states are suppressed sequentially, and the O state is promoted. In addition, as HIF-1 levels decrease, less degradation of (caused by binding to HIF-1 RNA) occurs, resulting in gradual disappearance of the M state. Thus, when HIF-1 mRNA is fully silenced, only the E-O and E/M-O states remain (Figure S6). Because the E/M state does not reappear until after the metabolic system has fully transitioned to O, the E/M-W/O state is not observed for any value of silencing HIF-1 mRNA. These results suggest overexpression could promote the O-associated states (E-O and E/M-O) and destabilize the coupled E/M-W/O state.
Inclusion of multiple miRNAs of the EMT network can stabilize the hybrid W/O phenotype
We next wish to determine how including links emanating from both and can synergistically drive metabolic reprogramming and promote the coupled E/M-W/O state. While upregulating ROS causes an increase in the E/M-W/O state, we show silencing HIF-1 suppresses the E/M-W/O state; therefore, we expect some suppression of the E/M-W/O state when including both and crosstalks. Of interest, the E/M-W/O state can be fully suppressed when decreasing HIF-1 and upregulating noxROS, but only partially suppressed when decreasing HIF-1 and upregulating mtROS (Figure S7). These results suggest the type of ROS present has different effects on the existence of the E/M-W/O state.
The E/M-W/O state is stabilized if mtROS is upregulated, but upregulating noxROS has minimal effect on the E/M-W/O state. Strikingly, when all miRNA crosstalks are active ( silencing HIF-1, and upregulating noxROS and mtROS, Figure 3A) the E/M-W/O state can be suppressed even if the W/O state is present (Figure 3B). Further, the E/M-W/O state is present for all values of noxROS but is only present at increased levels of mtROS (Figures 3B, 3C and S8). In addition, at high levels of mtROS, the E/M and W/O states are likely to be associated, suggesting upregulating mtROS can stabilize the E/M-W/O state (Figure 3C). Depending on the initial conditions, the E/M-W/O state is accessible if HIF-1 is partially silenced and the levels of noxROS and mtROS are high (Figure 3D). This suggests there is a synergistic effect between the crosstalks, resulting in an increased parameter space enabling the E/M-W/O state than expected based on the individual crosstalks. Further, the difference in the effect of noxROS and mtROS seems to result from the frustrated regulation of mtROS by HIF-1 and . Therefore, feedback loops between mtROS, HIF-1, , and together control the appearance of the E/M-W/O state.
Figure 3.

can upregulate the W/O phenotype
The E/M-W/O state can also be upregulated and mtROS seems to be a key regulator.
(A) Schematic illustration of the coupled metabolic (top) and EMT (bottom) networks with all miRNA-mediated regulatory links active ( upregulating mtROS, upregulating noxROS, and silencing HIF-1).
(B) The phase plane corresponding to all miRNA-mediated links (pictured in A). In this phase plane, silencing HIF-1 corresponds to the rightmost blue region of Figure S6 (all metabolic phenotypes are possible), increased noxROS suppresses the W state, and increasing mtROS causes the E/M-W/O coupled state to appear (black dotted region).
(C) The coupled states of (B), zoomed in on the middle region. The E/M-W/O state exists when mtROS is upregulated.
(D) At maximum noxROS levels, increased mtROS levels (x-axis), and moderately silenced HIF-1 (y-axis) there are regions where the E/M-W/O state is possible (black dotted regions).
Metabolic reprogramming can drive EMT
We next consider information flowing in the opposite direction, from metabolism to EMT and determine the effect of each metabolism-driven crosstalk on the coupled states. First, we analyze the links in which HIF-1 upregulates SNAIL (Figures 4A and S9) or inhibits (Figure S10). As expected, both HIF-1 mediated links push the system toward the M state. Further, both the E and E/M states are most associated with the O state (when the HIF-1 level is relatively low) whereas the M state is initially associated with the W state. This correlation between the E-O and M-W states is assumed in much of the literature.22 Similarly, modulating the EMT-inducing signals, such as TGF-β, that activate SNAIL can alter the stability of the E/M state and the coupled states (see Figure S11). Opposite to the HIF1-mediated crosstalks, AMPK-mediated crosstalks (upregulating , downregulating SNAIL, or downregulating ZEB) push the EMT network to adopt the E state and suppress the E/M state, followed by the suppression of the M state (Figures 4B,S12, S13 and S14). In addition, when AMPK regulates the EMT circuit alone, the E and M states are still mostly associated with the O and W states; however, the E/M state is associated with the W state. This is in direct contrast to HIF-1 driven crosstalk in which the E/M state is coupled with O state. The results suggest the E/M state has metabolic plasticity because neither OXPHOS nor Warburg metabolism automatically associate with it.
Figure 4.

The role of metabolism in driving EMT
HIF-1 mediated crosstalks drive the EMT circuit toward the M state, while AMPK mediated crosstalks drive the EMT network toward the E state.
(A) The frequency of the E/M, M, and E states as HIF-1 upregulates SNAIL.
(B) The frequency of the E/M, M, and E states as AMPK upregulates . The E/M state exists for larger portions of the parameter space enabled by the HIF-1-mediated crosstalk relative to the AMPK-mediated crosstalks.
The metabolic network can stabilize the E/M phenotype
Two distinct events are at play when the metabolic network regulates the EMT circuit. AMPK regulation quickly suppresses the E/M state and pushes the system toward the E state, whereas HIF-1 regulation can allow the system to maintain the E/M state for a range of strengths while ultimately pushing the system toward the M state (Figures 4A and 4B). Thus, HIF-1 and AMPK-mediated crosstalk should act antagonistically to stabilize the hybrid state.
When at least one of the AMPK crosstalks and one of the HIF-1 crosstalks are activated, the E/M state is stabilized. In addition, if AMPK and HIF-1 target different EMT-inducing transcription factors (EMT-TFs), the E/M-W/O state may exist in larger parameter spaces than if they target the same EMT-TF (Figure S15). This suggests activating multiple crosstalks and targeting multiple TFs is likely to stabilize the E/M-W/O state. Therefore, if all HIF-1 and AMPK-mediated crosstalks are active (Figure 5A) then significant regions occur in which the E/M state exists (Figure 5B). However, the E/M-W/O state only exists in a small region where is minimally upregulated. Moreover, the HIF-1-mediated crosstalks can maintain the E/M state longer than the AMPK-mediated crosstalks suggesting, the reduction of the E/M-W/O state is likely because of the suppression of the E/M state by AMPK-mediated crosstalks, as mentioned above (see Figures S12, S13 and S14). This suggests the HIF-1-mediated crosstalk is more strongly correlated with the E/M state than the AMPK-mediated crosstalk.
Figure 5.

AMPK and HIF-1 cooperate to upregulate the hybrid E/M state
When all HIF-1 and AMPK controlled crosstalks are active (HIF1->Snail, HIF1-|, AMPK-|Snail, AMPK-|Zeb, AMPK->) the E/M-W/O state can be stabilized. The metabolism-mediated crosstalks work antagonistically to stabilize the E/M state.
(A) Schematic illustration of the network showing the metabolism-mediated crosstalk.
(B) The phase plane of potential EMT states when all metabolic driven crosstalks are active. The E/M state is only accessible when λAMPK-> μ200 is near 1 or very high (i.e., at the extremes of regulation). The black dots highlight the existence of the coupled E/M-W/O states. At the bottom left, the E/M-W/O state is depicted as black dots overlaying the yellow region (with yellow being the E/M state coupled to any metabolic state).
(C) The coupled states when the EMT circuit is regulated by the metabolic circuit (pictured in A). The results suggest a direct correlation between the E, E/M, and M states to the O, W/O, and W states, respectively.
If all EMT regulating crosstalks are active, then there are regions where the E/M-W/O state exists. In addition, the E state is typically coupled to the O state (E-O), the M state is associated with the W state (M-W), and when the E/M state is present, it is typically associated with the hybrid W/O state (Figure 5C). Indeed, for the specific crosstalk and for the wide range of parameters that we have investigated in this study, if only three coupled states are available and each has a distinct phenotype of the EMT network (e.g., each E, M, and E/M phenotype is present) and metabolic network (e.g., each W, O, and W/O phenotype is present), then the only possible set of states is E-O, M-W, and E/M-W/O. This is indeed an important finding as it shows the baseline expectation for how EMT and metabolism affect each other when they are strongly coupled. But, however unlikely, we cannot rule out that for other parameters this must always be the case, and we certainly cannot ensure that models with other couplings and more complex networks would continue to have this property. This behavior represents the full coordination of EMT and metabolism and suggests clusters of migrating cells utilize a combination of aerobic glycolysis and OXPHOS. Given that tumors are metabolically heterogeneous, this result suggests the topology and parameters of the system may only represent certain microenvironments and is a limitation of our study.
The hybrid E/M-W/O phenotype
Recently, it has been suggested the most aggressive cancer phenotype is characterized by the hybrid E/M or W/O states.22 Therefore, we now focus on how the crosstalk between EMT and metabolism networks affects the coupled E/M-W/O state.
The hybrid E/M-W/O state can be promoted for multiple combinations of crosstalk. For example, the E/M-W/O state can be stabilized when AMPK downregulates SNAIL, HIF-1 downregulates , and upregulates mtROS (Figures 6A and S16A). Further, the E/M-W/O state becomes more prevalent when replacing HIF-1 downregulating by increasing the EMT inducing signal to SNAIL (Figures 6B and S16B). Of interest, although the E/M-W/O state is stabilized in both cases (Figures 6A and 6B), neither set of crosstalks can enable only the E/M-W/O state. However, it is possible to enable only the E/M-W/O state with just three regulatory links; HIF-1 inhibiting , upregulating mtROS, and modulating the EMT-inducing signal (Figures 6C and S16C). In addition, this region, which only includes the E/M-W/O state, persists if all crosstalks are activated (Figures 6D and S16D).
Figure 6.

The coupling of the EMT and metabolic regulatory networks can enable a coupled hybrid E/M-hybrid W/O state
Minimally, three links (one effecting the metabolic network and two controlling the EMT network) are necessary to enable only the E/M-W/O state.
(A) Phase diagrams of the coupled states when considering three crosstalks; the Input = 60,000 molecules, AMPK downregulates SNAIL, and upregulates mtROS. The E/M-W/O state is promoted when mtROS levels are increased.
(B) The phase diagram of the coupled states when considering AMPK inhibiting SNAIL, HIF-1 inhibiting μ200, and upregulating mtROS. The E/M-W/O state is stabilized for some regions.
(C) When considering the bidirectional regulation between EMT and metabolism by the three minimally necessary regulatory links ( upregulating mtROS, HIF-1 inhibiting , and an EMT-inducing signal on SNAIL) parameter regions exist enabling only the E/M-W/O state.
(D) When all crosstalks are active there are regions where only the E/M-W/O state exists. Similar sets of phases in (C) and (D) suggest a progression drives the system toward the E/M-W/O state.
The proximal phases of the phase enabling only the E/M-W/O state suggests stabilization of the E/M-W/O state requires mutual activation between metabolism and EMT. When the E/M-W/O state is the only available coupled state, the surrounding phases (E-O and E-W/O) are the same whether only three crosstalks (Figure 6C) or all crosstalks (Figure 6D) are active, suggesting there may be a sequential path to generate the E/M-W/O state. Further, if the E/M-W/O state is not the only allowed state (Figures 6A and 6B), the surrounding phases include both E-associated and M-associated states. Together, the results suggest to reach the E/M-W/O state, epithelial cancer cells first undergo metabolic reprogramming (acquiring the E-W/O state), followed by partial EMT (E/M-W/O). Although it is outside the scope of this manuscript, other crosstalk combinations may also stabilized the E/M-W/O state, and based on these results we would expect HIF-1 suppressing and upregulating mtROS to be prominent among all such combinations.
Hybrid phenotypes are enabled by crosstalk in cells initially without the E/M or W/O state
To investigate whether the crosstalk between EMT and metabolism promotes cancer plasticity (e.g., by acquiring the hybrid states) we simulate scenarios where the individual EMT and metabolism networks cannot acquire a hybrid state. This scenario corresponds to normal physiological conditions where we expect most cells will be restricted to a binary choice of E versus M and W versus O37 (see Figure S17). Then we systematically analyze whether any crosstalk can enable the hybrid state to emerge.
To analyze how the EMT network can drive metabolic reprogramming, we first keep the individual metabolic circuit as a bistable system where only the W and O states are available (i.e., no W/O state). Through gradually activating the μ34-mediated crosstalk, we find the hybrid W/O state emerges and the E/M-W/O state is stabilized when upregulates mtROS (Figure 7A) but they do not appear when upregulating noxROS or downregulating HIF-1 (Figure S18). This suggests that noxROS may play a context-dependent role on the coupled state, whereas mtROS often stabilizes the E/M-W/O state.
Figure 7.

Crosstalk can generate the hybrid states
The activation of a single crosstalk can generate the hybrid state of the downstream network (W/O or E/M).
(A) The phase diagram showing coupled states for the bistable metabolism network (O or W when the crosstalk is inactive ). Once mtROS is increased (near ), there is a sharp change with the hybrid W/O state becoming the most often occupied state.
(B) The phase diagram of coupled states when the hybrid E/M state is not available initially when the crosstalk is inactive. As μ200 decreases, the E/M state becomes accessible.
(C) Combining the models from (A) and (B), we generate a network which only has 4 possible coupled states if the crosstalk is inactive (E-O, E-W, M−O, and M−W). At maximum upregulation of mtROS and downregulation of , only the E/M-W/O state is enabled, similar to Figure 6C.
Next, to see how metabolic reprogramming can possibly drive the hybrid E/M state, we set the EMT network to be bistable (i.e., unable to acquire the E/M state). We find the E/M state can be generated and coupled with the W/O state when HIF-1 inhibits (Figure 7B) or HIF-1 upregulates SNAIL (Figure S19). This suggests the master regulator of glycolysis, HIF-1, can drive cells toward the hybrid E/M state. Conversely, an individual AMPK-mediated crosstalk is unable to generate the hybrid E/M state (Figure S19). In addition, as with the tristable networks, two competing crosstalks (e.g., AMPK upregulating SNAIL and HIF-1 downregulating ) can stabilize the hybrid E/M-W/O (Figure S20).
When both networks are in the parameter regime where the hybrid state is not available (i.e., neither the E/M or W/O state), the crosstalk can still enable the emergence of these two hybrid states. Recall for the coupled tristable circuits, the simplest set of crosstalk with a parameter region enabling only the E/M-W/O state consisted of three regulatory links; HIF-1 inhibiting , upregulating mtROS, and EMT-inducing signaling acting on SNAIL. When these same links are active for the bistable EMT and metabolism circuits, there are parameter spaces where only the E/M-W/O state is enabled. The results here qualitatively agree with the coupling results when both individual EMT circuit and individual metabolism circuit are tristable (Figures 7C and S21 compared to Figure 6C).
In summary upregulating mtROS can generate the W/O state and upregulate the E/M-W/O state when the metabolism circuit itself can only acquire the W and O states. Conversely, a HIF-1 mediated crosstalk can generate the E/M state and stabilize the E/M-W/O state even when the EMT circuit itself cannot acquire the E/M state. If both networks are bistable it is possible to enable only the E/M-W/O state with three regulations. These results suggest the E/M-W/O state can be generated and promoted by the crosstalk, independent of the initially available states.
GRHL2 and OVOL can stabilize the coupled E/M-W/O state
Previously, we reported transcription factors, such as OVOL and GRHL2 can stabilize the hybrid E/M state,7,38 referred to as the phenotypic stability factors (PSFs) of the E/M state. We are curious how these PSFs regulate the coupling of the E/M state with metabolism states, specifically the E/M-W/O state. We extend the original coupled EMT-metabolism network by including OVOL and GRHL2 (Figure 8A, parameters and modified equations of the PSF stabilized network are in STAR Methods, Tables S8 and S10). As coupling PSFs with the EMT-metabolism circuit (Figure 8A) changes the values of the nine reference states, updated reference states are used to classify the coupled states when PSFs are present (Table S10,see STAR Methods for details). When a single crosstalk is active, the E/M-W/O state can exist for the entire parameter space when one of the following crosstalk is active - AMPK downregulating SNAIL, AMPK upregulating , upregulating mtROS, or upregulating noxROS (see Figure S22). The E/M-W/O state is also stabilized when HIF-1 downregulates or upregulates SNAIL (Figure S22).
Figure 8.

PSFs stabilizing the E/M state can stabilize the association of the E/M state with the W/O state
(A)The coupled EMT-metabolism network including the PSFs GRHL2 and OVOL2.
(B) The phase diagram of the coupled states shows the E/M-W/O state is present in a larger parameter space due to the PSFs stabilizing the E/M state.
(C) The phase diagram of the coupling states when the three links (-> mtROS, HIF1-|, and reducing the EMT-inducing signal) are active. The parameter regime of the phase enabling only the E/M-W/O state is significantly enlarged compared to the coupled network without PSFs.
(D) The difference in the frequency of the E/M-W/O state between (C, PSFs are present) and the original model (Figure S23, PSFs are not present). The dark red region shows the phases where only the PSF stabilized model can enable the E/M-W/O state, whereas the top right corner is the region where only the E/M-W/O state is enabled irrespective of the presence of PSFs.
Next, we studied the effect of the PSFs when multiple crosstalks are active. If two competing crosstalks acting on the EMT circuit are active (e.g., one HIF-1 and one AMPK mediated crosstalk), the E/M-W/O state is available for most of the parameter space (Figure 8B). Further, the E/M-W/O state can be stabilized by activating the three crosstalks (i.e., upregulating mtROS, HIF-1 downregulating , and including the EMT-inducing signaling acting on Snail) that enable only the E/M-W/O state in the absence of these PSFs. In addition, the parameter space enabling only E/M-W/O is much larger in the presence of the PSFs (Figures 8C, 8D and S23) relative to the absence of the PSFs. Further, the coupled states in the phases surrounding the phase containing only the E/M-W/O state are the same as those identified in the absence of PSFs (Figure 8B). These results show the PSFs can stabilize the coupled E/M-W/O state.
Discussion
Cancer malignancy relies on the orchestration of multiple hallmarks driven by different functional modules, such as metabolism and metastasis.1 It has become increasingly clear different hallmarks of cancer are extensively coupled. In this work, we focused on how reprogrammed cancer metabolism is coordinated with cancer metastasis. Because EMT is often employed by cancer as part of the metastatic process, we analyzed the mutual regulation between metabolism and EMT through coupling their corresponding gene regulatory circuits. We systematically analyzed the effect of both individual and multiple crosstalks on each of the nine coupled states. The stability of the coupled states was found to vary depending on which crosstalk was active, and multiple crosstalks could exhibit synergistic or antagonistic effects (see Figures 3 and 5). Therefore, we primarily focused on the E/M-W/O state, as we expect these cells to be the most metastatically capable. We found (1) the E/M-W/O state can be stabilized by a single crosstalk mediated by μ34 (Figure 2) or two antagonistic EMT-driven crosstalks (Figure 5); (2) the similarities between the effects of different crosstalk (e.g., HIF1 suppressing μ200 compared to HIF-1 upregulating SNAIL; see Figures S9 and S10) suggest a degree of consistency in how EMT drives metabolic reprogramming, and vice versa; (3) if crosstalk is bi-directional, it is possible to enable only the E/M-W/O state and this stabilization can be facilitated even under conditions when the individual core circuits do not generate hybrid states (Figures 6C, 6D and 7C); (4) the E/M stabilizing PSFs (OVOL, GRHL2) also stabilize the coupled E/M-W/O state (Figure 8C). Together, the results highlight the vital role of the EMT-metabolism crosstalk in mediating cancer metastasis.
The results of our model suggest metabolic reprogramming can drive EMT, but metabolic reprogramming does not have to be complete before EMT begins; this feature allows stabilizing of the most aggressive E/M-W/O state (Figures 6C, 7C, and 8C). Further, we identified a scenario wherein the system can follow a progression from the E-O state, first undergoing metabolic reprogramming while maintaining epithelial characteristics (E-W/O state), before undergoing partial EMT to stabilize the E/M-W/O state. Strikingly, the prevalence of the E/M-W/O state is increased by EMT-metabolism crosstalk regardless of initial phenotypic availability (i.e., whether the initial system is significantly E/M-W/O or only E-O, E-W, M-O, and M-W). Therefore, our current model provides a possible explanation for the mutual activation of metabolic reprogramming and EMT, depending on the initiating signal.
Our findings indicate that all else being equal, undergoing EMT tends to correlate with using additional glycolysis. This qualitatively agrees with a recent pan-cancer study based on NCBI GEO microarray datasets and other studies.22,39 We find HIF-1 (a marker of glycolysis) is strongly associated with EMT, suggesting the E/M state can be stabilized if HIF-1 (glycolysis) is upregulated. In addition, our model predicts the coupling of the hybrid E/M state and high glycolysis/high OXPHOS (W/O). Notably, our model is unable to explain the cases wherein low glycolysis metabolism is correlated with EMT. However, extending the model to explicitly include coupling with additional metabolic pathways25 may be able to explain the low glycolysis states of the pan-cancer study.39
The coupling of the E/M and W/O states is somewhat surprising given the widespread impression that primary tumors often exhibit the Warburg effect, possibly because of their need to limit the amount of ATP produced in favor of maximizing biomass production and growth (see40 and references therein). However, this finding is consistent with the general idea that moving from E to E/M correlates with increasing stemness, and stem-like capabilities often rely on glycolysis. It is also consistent with HIF-1 activation diminishing OXPHOS while driving EMT. Note that this tendency might be over-ridden for cells requiring sufficient energy production to enable motility, such as leader cells. One possibility is that during the transition between E-O to E-W/O, when cells first become malignant, the Warburg effect is activated. Then as cells undergo EMT they tend to switch to more W until reaching a mesenchymal-like E/M state with mostly W. Lastly, as cells complete EMT and fully differentiate, they revert back to using mostly OXPHOS. The connection between EMT and metabolism may also depend on other external signals, such as the level of oxygen in the TME. For example, mesenchymal cells that reduce proliferation and have to traverse the extracellular matrix should switch to more OXPHOS, whereas ones that become quiescent in a hypoxic metastatic niche should favor glycolysis. Resolution of this issue must await a more precise idea of the phrase ‘all else being equal’.
The importance of the //HIF-1/ROS/SNAIL axis for the regulation of the E/M-W/O state arises from our analysis. Our results suggest mtROS is critical for the metabolic activation of EMT (see Figure 3), in agreement with recent experimental work that posited mtROS can drive EMT,41 control cancer invasiveness,42 and have a stronger role than noxROS.41,43 Our results also suggest the mtROS/HIF-1 axis is critical to stabilizing the highly aggressive E/M-W/O state (see Figure 6), and this axis has previously been associated with hypoxia-induced cancer aggressiveness.44 In addition, both mtROS and HIF-1 are controlled by the miRNAs of the EMT network, and , confirming the importance of miRNAs in mediating the coupling of EMT and metabolism.45
In line with the above, this work is a first step, and it is quite likely that incorporating additional pathways, especially those regulating cell motility, may be necessary to fully decode EMT-metabolism coupling. For instance, the RHO-ROCK signaling network regulates the transition of cancer cells from collective migration of E/M cells to individual migration of ameboid cells.13,46 Inclusion of RHO-ROCK signaling could provide a detailed understanding of how metabolism is coupled to different modes of cancer cell migration. Overall, the importance of external signaling in our model is in conceptual agreement with a hypothesis by Sciacovelli and Frezza that in an adverse TME metabolic reprogramming drives EMT to allow cells to find favorable metabolic niches.29
The overall goal of this project is toward understanding all the interrelated aspects of cancer metastasis. Previous studies coupling EMT, stemness, and Notch signaling have shown that therapy resistance and increased metastatic potential are associated with stem-like hybrid E/M cells.47,48,49 Furthermore, these couplings also resulted in unexpected behaviors such as the co-localization of hybrid E/M cells47 and a tunable stemness window.48 Studying individual gene regulatory network modules, even in the presence of signals, is unable to provide a thorough understanding of the network properties. Therefore, multiple modules and their crosstalk should be studied concurrently to understand the correlation between cancer traits and potentially identify key regulators.
Limitations of the study
Although we have parameterized the model with values from literature whenever available to ensure biological relevance, one limitation of this study is knowing how these results translate to experimental cancer studies. Thus, the significance of the mtROS/HIF-1 feedback loop should be experimentally tested by, e.g., modulating ROS level via antioxidant factors such as NRF2, or modulating hypoxia to perturb HIF-1.
STAR★Methods
Key resources table
| REAGENT or RESOURCE | SOURCE | IDENTIFIER |
|---|---|---|
| Software and algorithms | ||
| Code for generating and analyzing the data | https://github.com/madgal/EMT_MR | This paper |
Resource availability
Lead contact
Further information and requests for resources and reagents should be directed to and will be fulfilled by the lead contact, Dongya Jia (dongya.jia@nih.gov).
Materials availability
This study did not generate new unique reagents.
Method details
Regulation modeled by shifted hill function
For the cases in which transcription factors are regulating other pieces or there is indirect miRNA regulation (e.g., μ34 regulating ROS) then the regulation is modeled as a shifted Hill function
| (Equation 1) |
where the transcription factor X is regulating Y. X0 is the threshold of X when the regulation becomes stronger. The cooperativity, n, represents the sensitivity to X. The foldchange (λ) represents the amount of regulation and can be λ<1, λ = 1, or λ>1 representing inhibition, no regulation, or activation. Therefore maximum inhibition occurs when λ = 0 but there is no upper bound on activation.
miRNA regulation
We utilize the framework for miRNA regulation developed by Lu and collaborators.10 This framework was developed to model the binding of miRNA and mRNA to form an miRNA-mRNA complex and the subsequent translation of a protein. The miRNA concentration is μ, the threshold of miRNA regulation is μ0, the mRNA concentration is m, the number of mRNA binding sites for miRNA is n, and the protein concentration is B. The reaction is assumed to occur at steady state and the binding/unbinding of miRNA and mRNA is assumed to be much faster than production/degradation of the protein.
Any number of binding sites may be occupied resulting in Cin possible combinations when i binding sites are occupied, where
| (Equation 2) |
when i binding sites are occupied, then
| (Equation 3) |
where
| (Equation 4) |
leading to the total translation rate
| (Equation 5) |
the active mRNA degradation rate
| (Equation 6) |
and the active miRNA degradation rate
| (Equation 7) |
Therefore, the dynamics of miRNA-mRNA binding complex and transcribed protein B are modeled by the following equations,
| (Equation 8) |
| (Equation 9) |
| (Equation 10) |
Competition in metabolism model
In the metabolic circuit, AMPK and Hif1 competitively regulate the level of mtROS
| (Equation 11) |
and noxROS
| (Equation 12) |
The coupled EMT-metabolism network
| (Equation 13) |
| (Equation 14) |
| (Equation 15) |
| (Equation 16) |
| (Equation 17) |
| (Equation 18) |
| (Equation 19) |
| (Equation 20) |
| (Equation 21) |
| (Equation 22) |
| (Equation 23) |
| (Equation 24) |
Parameter determination for coupled EMT-metabolic network
The values of parameters for the core EMT are given by Tables S1, S2 and S3, and the parameters for the core metabolic network are given by Table S4. We define the parameters based on an extensive literature search. For example, regarding EMT regulating metabolism, ROS levels are increased by via downregulating the NRF2-dependent antioxidant capability,43,50,51 downregulating SOD2,52 or upregulating the p53 pathway.53,54 Next, family members can either upregulate or downregulate Hif1 expression.55While miR-429 upregulates HIF-1, both miR-200b56 and miR-200c57 downregulate HIF-1 expression. We focus on the negative feedback loop which seems to be present in a larger portion of the miR-200 family members.55,58 Regarding metabolism regulating EMT, HIF-1 inhibits miR-200b through upregulation of the HIF-1 downstream target ASCL2.56 Therefore, there is a mutual inhibitory feedback loop between and HIF-1. Additionally, HIF-1 can directly upregulate SNAIL,59while AMPK represses the production of SNAIL60 by activating FOXO3. Similarly, AMPK suppresses ZEB2 by activating FOXO1.61,62Additionally, CREB, after being activated by AMPK via phosphorylation, can transcribe resulting in the upregulation of miR-200.63,64,65,66,67
Any parameter in Table S5 with a citation is an experimentally derived value that we are using. Any parameter without a reference is estimated based on what is known of the system and other parameters. The values for the L, Ym, and Yu functions are estimated and set in ranges to ensure the behavior mimics biological systems.
Since Hif1 is regulated by miRNA μ200, it was required to also include Hif1 messenger RNA which was not included in the original circuit studied by Yu et al.20 This ensured new parameters for Hif1, and Hif1 mRNA, were required therefore we went through a range of parameters and found the parameters that gave the most similar result with or without μ200 regulating Hif1. See Tables S4and S5 for parameter values.
The parameters for the coupled links are defined within a range from inactive to fully active. Unless specified, all crosstalks are assumed to be in the inactive state. For crosstalks modeled as shifted Hill functions, the value of the foldchange is set to one (λcrosstalk = 1). If the crosstalk for between μ200 and Hif1 is inactive (μ200 − | HIF-1), the production of HIF-1 is decoupled from μ200. This decoupling reflects how HIF-1 production was initially defined in the metabolic network of Yu and collaborators.20 To mathematically model this decoupling, the value of LH(μ200) = 1, Ym,H(μ200) = 0, and Yμ,H(μ200) = 0.
Coupled EMT-metabolism network without hybrid phenotypes
To generate a model that is missing the hybrid phenotype we adjusted the following parameters. For the results labeled “noEM”: λSu = 0.85 and λSZ = 17
For the results labeled noWO: kmh = 0.158, kh = 2.2, and γ = 6
For the results label noHH: We removed the initial ability to access the WO or EM states.
λSu = 0.85, λSZ = 17, kmh = 0.158, kh = 2.2, and γ = 6
The states were confirmed by calculating the nullclines of the EMT and metabolic circuit with the new parameters.
Coupled EMT-metabolism network with phenotype stability factors
When introducing the PSFs OVOL and GRHL2 we add four equations to our model that represent the protein and mRNA levels of OVOL and GRHL2. We also must adjust the equations for μ200 to include inhibition by OVOL, Zeb mRNA to include inhibition by OVOL and GRHL2, and ROS to include upregulation by GRHL2. The parameters that have changed or been added are listed in Table S7.
| (Equation 25) |
| (Equation 26) |
| (Equation 27) |
| (Equation 28) |
| (Equation 29) |
| (Equation 30) |
when the crosstalks are inactive, we find the PSF stabilized network is mainly in the E/M-W/O state with less than 10% occupancy of the E/M-O state.
Solving the model
Starting from a set of 1000 distinct random conditions sampled from a uniform distribution (ranges for each component in Table S8), we solve the model with the Euler method. For each initial condition we use a timestep of dt = 0.1 with relaxation time of 1000 hr, and the values are assumed to have converged at the end of the simulation. The results presented here for each foldchange value, except for μ200 − |Hif1, are the average of the results generated from these 1000 initial conditions. The regulation of Hif1 by μ200 has nine distinct parameter values that can be modified, so the results for each initial condition are individually analyzed and then combined. If the parameters for this crosstalk are changed the quantitative results may be misleading, therefore we focus on qualitative results for this crosstalk.
Quantification and statistical analysis
Nullclines
To confirm the stability of these states we calculated the continuity and nullclines of the systems using PyDSTool.68 We calculated the nullclines for the system with inactive crosstalks allowing us to independently model the EMT and metabolic networks. The maximum search was set to 1e + 4, the error was set to 1e − 10, maximum step size was 1e + 2, minimum step size was 1e + 0, and all bifurcation points were found.
Coupled state classification
To determine the states we compare to the coupled circuits with inactive crosstalks and original snail input (I = 50000). The coupled network excluding the hybrid states were also compared to the inactive crosstalks.
Because the coupled network with the PSFs generates the hybrid state with a different expression profile than the inactive circuit, we generated a new set of gene profiles corresponding to the E/M, E, and M states.
The state is then calculated by determining which of the 9 possible coupled states of the inactive system is closest to the coupled result
| (Equation 31) |
Whichever state (k) corresponds to the minimum distance for the ith generated expression profile (dCi ) is then the assumed state. By taking the square of the log before summing we ensure that deviations from the gene expression profile in opposite directions do not cancel out.
To classify the coupled state x generated when there is active crosstalk, we calculate the normalized distance of x to each of the nine reference states using Equation 31. For example, when calculating the distance between x and the reference state E-W,
| (Equation 32) |
where is the steady state Zeb expression value for the E-W coupled state in the inactive network (i.e., no crosstalk is active), and this equation gives the “distance” from the E-W coupled state. This calculation is then repeated to obtain the distance from all nine reference coupled states. The coupled state x is classified as being in the E/M-W/O coupled state if the distance between x and the reference E/M-W/O is minimal.
Phase planes and calculating up/downregulations
To generate the how the possible coupled states change as the regulation changes we determine this by looking at a phase plane of the results. For all regulatory crosstalks that are modeled by a shifted Hill function (all crosstalks except miRNA regulation of Hif-1 by μ200), all 1000 initial conditions at a specific value of the foldchange for that crosstalkλA−>|B are classified as one of the nine possible coupled states. For μ200 − | Hif1, the silencing value takes the place of the foldchange value. Thus, we have transformed potentially 1000 different results to between 1 and 9 different results (coupled states). So for each regulatory value (λA−>|B or PH(μ200) we have a set of possible coupled states. Each set is identified by a unique color (with each set of possible coupled states noted either directly on the plot or in a nearby legend). As our focus is on the presence and stability of the E/M-W/O state, we can overlay all plots with black or red dots. The black dots overlaying a plot reference the regulatory parameters for which the E/M-W/O coupled state is possible, while the red dots overlaying a plot are in the regions of regulatory parameters where only the E/M-W/O coupled state exists (i.e., all other coupled states are suppressed).
To determine if a state is up/downregulated relative to the inactive circuit we simply calculate the fraction of initial conditions leading to the E/M-W/O state for the coupled circuit compared to the inactive system. For the coupled network and the coupled network excluding the hybrid states, the inactive network is the tristable network with all crosstalks inactive. For the coupled network including the PSFs, the inactive network is only able to access the E/M-W/O and E/M-O states.
Silencing Hif-1 mRNA
As the miRNA regulation has three sets of possible parameters changing (l,ym, and yμ), we utilize the silencing function to incorporate all changing parameters into a single variable.
The silencing function is defined as
| (Equation 33) |
We use the degradation rate of the Hif-1 mRNA(kmh = 0.143).
We calculate the silencing value of each initial condition for a distinct set of parameters.
Acknowledgments
This work was supported by the National Science Foundation by sponsoring the Center for Theoretical Biological Physics – award PHY-2019745 (J.N.O., H.L.) and by awards PHY-1605817 (H.L.), PHY-2210291 (J.N.O.), and PHY-1522550 (J.N.O., M.G.). J.N.O. is a CPRIT Scholar in Cancer Research. M.G. was also supported by the NSF GRFP-1842494.
Author contributions
Conceptualization – H.L., J.N.O., and D.J.; Data curation – M.G.; Formal analysis – M.G., H.L., J.N.O., and D.J.; Funding acquisition – H.L. and J.N.O.; Methodology – M.G. and D.J.; Project administration – H.L., J.N.O., and D.J.; Resources – J.N.O.; Software – M.G.; Supervision – H.L., J.N.O., and D.J.; Writing – original draft preparation: M.G. and D.J.; Writing – review and editing: M.G., H.L., J.N.O., and D.J.
Declaration of interests
M.G. is an employee of Gritstone bio. The remaining authors declare no competing interest.
Published: January 20, 2023
Footnotes
Supplemental information can be found online at https://doi.org/10.1016/j.isci.2022.105719.
Contributor Information
Herbert Levine, Email: h.levine@northeastern.edu.
José N. Onuchic, Email: jonuchic@rice.edu.
Dongya Jia, Email: dongya.jia@nih.gov.
Supplemental information
Data and code availability
-
•
All data here was generated using code and parameters available in the supplemental information and at https://github.com/madgal/EMT_MR.
-
•
All code used to generate and analyze data is available at https://github.com/madgal/EMT_MR.
-
•
Any additional information required to reanalyze the data reported in this paper is available from the lead contactupon request.
References
- 1.Hanahan D. Hallmarks of cancer: new dimensions. Cancer Discov. 2022;12:31–46. doi: 10.1158/2159-8290.cd-21-1059. [DOI] [PubMed] [Google Scholar]
- 2.Hay E.D. The mesenchymal cell, its role in the embryo, and the remarkable signaling mechanisms that create it. Dev. Dyn. 2005;233:706–720. doi: 10.1002/dvdy.20345. [DOI] [PubMed] [Google Scholar]
- 3.Pietilä M., Ivaska J., Mani S.A. Whom to blame for metastasis, the epithelial–mesenchymal transition or the tumor microenvironment? Cancer Lett. 2016;380:359–368. doi: 10.1016/j.canlet.2015.12.033. [DOI] [PubMed] [Google Scholar]
- 4.Cho E.S., Kang H.E., Kim N.H., Yook J.I. Therapeutic implications of cancer epithelial-mesenchymal transition (EMT) Arch Pharm. Res. (Seoul) 2019;42:14–24. doi: 10.1007/s12272-018-01108-7. [DOI] [PubMed] [Google Scholar]
- 5.Fustaino V., Presutti D., Colombo T., Cardinali B., Papoff G., Brandi R., Bertolazzi P., Felici G., Ruberti G. Characterization of epithelial-mesenchymal transition intermediate/hybrid phenotypes associated to resistance to EGFR inhibitors in non-small cell lung cancer cell lines. Oncotarget. 2017;8:103340–103363. doi: 10.18632/oncotarget.21132. [DOI] [PMC free article] [PubMed] [Google Scholar]
- 6.George J.T., Jolly M.K., Xu S., Somarelli J.A., Levine H. Survival outcomes in cancer patients predicted by a partial EMT gene expression scoring metric. Cancer Res. 2017;77:6415–6428. doi: 10.1158/0008-5472.can-16-3521. [DOI] [PMC free article] [PubMed] [Google Scholar]
- 7.Jolly M.K., Tripathi S.C., Jia D., Mooney S.M., Celiktas M., Hanash S.M., Mani S.A., Pienta K.J., Ben-Jacob E., Levine H. Stability of the hybrid epithelial/mesenchymal phenotype. Oncotarget. 2016;7:27067–27084. doi: 10.18632/oncotarget.8166. [DOI] [PMC free article] [PubMed] [Google Scholar]
- 8.Pastushenko I., Brisebarre A., Sifrim A., Fioramonti M., Revenco T., Boumahdi S., Van Keymeulen A., Brown D., Moers V., Lemaire S., et al. Identification of the tumour transition states occurring during EMT. Nature. 2018;556:463–468. doi: 10.1038/s41586-018-0040-3. [DOI] [PubMed] [Google Scholar]
- 9.Simeonov K.P., Byrns C.N., Clark M.L., Norgard R.J., Martin B., Stanger B.Z., Shendure J., McKenna A., Lengner C.J. Single-cell lineage tracing of metastatic cancer reveals selection of hybrid EMT states. Cancer Cell. 2021;39:1150–1162.e9. doi: 10.1016/j.ccell.2021.05.005. [DOI] [PMC free article] [PubMed] [Google Scholar]
- 10.Lu M., Jolly M.K., Levine H., Onuchic J.N., Ben-Jacob E. MicroRNA-based regulation of epithelial–hybrid–mesenchymal fate determination. Proc. Natl. Acad. Sci. USA. 2013;110:18144–18149. doi: 10.1073/pnas.1318192110. [DOI] [PMC free article] [PubMed] [Google Scholar]
- 11.Saitoh M. Involvement of partial EMT in cancer progression. J. Biochem. 2018;164:257–264. doi: 10.1093/jb/mvy047. [DOI] [PubMed] [Google Scholar]
- 12.Bakir B., Chiarella A.M., Pitarresi J.R., Rustgi A.K. EMT, MET, plasticity, and tumor metastasis. Trends Cell Biol. 2020;30:764–776. doi: 10.1016/j.tcb.2020.07.003. [DOI] [PMC free article] [PubMed] [Google Scholar]
- 13.Saxena K., Jolly M.K., Balamurugan K. Hypoxia, partial EMT and collective migration: emerging culprits in metastasis. Transl. Oncol. 2020;13:100845. doi: 10.1016/j.tranon.2020.100845. [DOI] [PMC free article] [PubMed] [Google Scholar]
- 14.Dey P., Kimmelman A.C., DePinho R.A. Metabolic codependencies in the tumor microenvironment. Cancer Discov. 2021;11:1067–1081. doi: 10.1158/2159-8290.cd-20-1211. [DOI] [PMC free article] [PubMed] [Google Scholar]
- 15.Warburg O., Wind F., Negelein E. The metabolism of tumors in the body. J. Gen. Physiol. 1927;8:519–530. doi: 10.1085/jgp.8.6.519. [DOI] [PMC free article] [PubMed] [Google Scholar]
- 16.Liberti M.V., Locasale J.W. The Warburg effect: how does it benefit cancer cells? Trends Biochem. Sci. 2016;41:211–218. doi: 10.1016/j.tibs.2015.12.001. [DOI] [PMC free article] [PubMed] [Google Scholar]
- 17.Ohshima K., Morii E. Metabolic reprogramming of cancer cells during tumor progression and metastasis. Metabolites. 2021;11:28. doi: 10.3390/metabo11010028. [DOI] [PMC free article] [PubMed] [Google Scholar]
- 18.Nagao A., Kobayashi M., Koyasu S., Chow C.C.T., Harada H. HIF-1-Dependent reprogramming of glucose metabolic pathway of cancer cells and its therapeutic significance. Int. J. Mol. Sci. 2019;20:238. doi: 10.3390/ijms20020238. [DOI] [PMC free article] [PubMed] [Google Scholar]
- 19.Cheng Y., Lu Y., Zhang D., Lian S., Liang H., Ye Y., Xie R., Li S., Chen J., Xue X., et al. Metastatic cancer cells compensate for low energy supplies in hostile microenvironments with bioenergetic adaptation and metabolic reprogramming. Int. J. Oncol. 2018;53:2590–2604. doi: 10.3892/ijo.2018.4582. [DOI] [PubMed] [Google Scholar]
- 20.Yu L., Lu M., Jia D., Ma J., Ben-Jacob E., Levine H., Kaipparettu B.A., Onuchic J.N. Modeling the genetic regulation of cancer metabolism: interplay between glycolysis and oxidative phosphorylation. Cancer Res. 2017;77:1564–1574. doi: 10.1158/0008-5472.can-16-2074. [DOI] [PMC free article] [PubMed] [Google Scholar]
- 21.Dupuy F., Tabariès S., Andrzejewski S., Dong Z., Blagih J., Annis M.G., Omeroglu A., Gao D., Leung S., Amir E., et al. PDK1-Dependent metabolic reprogramming dictates metastatic potential in breast cancer. Cell Metab. 2015;22:577–589. doi: 10.1016/j.cmet.2015.08.007. [DOI] [PubMed] [Google Scholar]
- 22.Jia D., Park J.H., Kaur H., Jung K.H., Yang S., Tripathi S., Galbraith M., Deng Y., Jolly M.K., Kaipparettu B.A., et al. Towards decoding the coupled decision-making of metabolism and epithelial-to-mesenchymal transition in cancer. Br. J. Cancer. 2021;124:1902–1911. doi: 10.1038/s41416-021-01385-y. [DOI] [PMC free article] [PubMed] [Google Scholar]
- 23.Porporato P.E., Payen V.L., Pérez-Escuredo J., De Saedeleer C.J., Danhier P., Copetti T., Dhup S., Tardy M., Vazeille T., Bouzin C., et al. A mitochondrial switch promotes tumor metastasis. Cell Rep. 2014;8:754–766. doi: 10.1016/j.celrep.2014.06.043. [DOI] [PubMed] [Google Scholar]
- 24.Jia D., Park J.H., Jung K.H., Levine H., Kaipparettu B.A. Elucidating the metabolic plasticity of cancer: mitochondrial reprogramming and hybrid metabolic states. Cells. 2018;7:21. doi: 10.3390/cells7030021. [DOI] [PMC free article] [PubMed] [Google Scholar]
- 25.Jia D., Lu M., Jung K.H., Park J.H., Yu L., Onuchic J.N., Kaipparettu B.A., Levine H. Elucidating cancer metabolic plasticity by coupling gene regulation with metabolic pathways. Proc. Natl. Acad. Sci. USA. 2019;116:3909–3918. doi: 10.1073/pnas.1816391116. [DOI] [PMC free article] [PubMed] [Google Scholar]
- 26.Sung J.-Y., Cheong J.-H. Pan-cancer analysis reveals distinct metabolic reprogramming in different epithelial–mesenchymal transition activity states. Cancers. 2021;13:1778. doi: 10.3390/cancers13081778. [DOI] [PMC free article] [PubMed] [Google Scholar]
- 27.Choudhary K.S., Rohatgi N., Halldorsson S., Briem E., Gudjonsson T., Gudmundsson S., Rolfsson O. EGFR signal-network reconstruction demonstrates metabolic crosstalk in EMT. PLoS Comput. Biol. 2016;12:e1004924. doi: 10.1371/journal.pcbi.1004924. [DOI] [PMC free article] [PubMed] [Google Scholar]
- 28.Feng S., Zhang L., Liu X., Li G., Zhang B., Wang Z., Zhang H., Ma H. Low levels of AMPK promote epithelial-mesenchymal transition in lung cancer primarily through HDAC4- and HDAC5-mediated metabolic reprogramming. J. Cell Mol. Med. 2020;24:7789–7801. doi: 10.1111/jcmm.15410. [DOI] [PMC free article] [PubMed] [Google Scholar]
- 29.Sciacovelli M., Frezza C. Metabolic reprogramming and epithelial-to-mesenchymal transition in cancer. FEBS J. 2017;284:3132–3144. doi: 10.1111/febs.14090. [DOI] [PMC free article] [PubMed] [Google Scholar]
- 30.Huang R., Zong X. Aberrant cancer metabolism in epithelial–mesenchymal transition and cancer metastasis: mechanisms in cancer progression. Crit. Rev. Oncol. Hematol. 2017;115:13–22. doi: 10.1016/j.critrevonc.2017.04.005. [DOI] [PubMed] [Google Scholar]
- 31.Kang X., Wang J., Li C. Exposing the underlying relationship of cancer metastasis to metabolism and epithelial-mesenchymal transitions. iScience. 2019;21:754–772. doi: 10.1016/j.isci.2019.10.060. [DOI] [PMC free article] [PubMed] [Google Scholar]
- 32.LeBleu V.S., O’Connell J.T., Gonzalez Herrera K.N., Wikman H., Pantel K., Haigis M.C., de Carvalho F.M., Damascena A., Domingos Chinen L.T., Rocha R.M., et al. PGC-1α mediates mitochondrial biogenesis and oxidative phosphorylation in cancer cells to promote metastasis. Nat. Cell Biol. 2014;16:992–1003.1-15. doi: 10.1038/ncb3039. [DOI] [PMC free article] [PubMed] [Google Scholar]
- 33.Bocci F., Tripathi S.C., Vilchez Mercedes S.A., George J.T., Casabar J.P., Wong P.K., Hanash S.M., Levine H., Onuchic J.N., Jolly M.K. NRF2 activates a partial epithelial-mesenchymal transition and is maximally present in a hybrid epithelial/mesenchymal phenotype. Integr. Biol. 2019;11:251–263. doi: 10.1093/intbio/zyz021. [DOI] [PMC free article] [PubMed] [Google Scholar]
- 34.Luo M., Shang L., Brooks M.D., Jiagge E., Zhu Y., Buschhaus J.M., Conley S., Fath M.A., Davis A., Gheordunescu E., et al. Targeting breast cancer stem cell state equilibrium through modulation of redox signaling. Cell Metab. 2018;28:69–86.e6. doi: 10.1016/j.cmet.2018.06.006. [DOI] [PMC free article] [PubMed] [Google Scholar]
- 35.Colacino J.A., Azizi E., Brooks M.D., Harouaka R., Fouladdel S., McDermott S.P., Lee M., Hill D., Madden J., Boerner J., et al. Heterogeneity of human breast stem and progenitor cells as revealed by transcriptional profiling. Stem Cell Rep. 2018;10:1596–1609. doi: 10.1016/j.stemcr.2018.03.001. [DOI] [PMC free article] [PubMed] [Google Scholar]
- 36.Lu M., Jolly M.K., Gomoto R., Huang B., Onuchic J., Ben-Jacob E. Tristability in cancer-associated MicroRNA-TF chimera toggle switch. J. Phys. Chem. B. 2013;117:13164–13174. doi: 10.1021/jp403156m. [DOI] [PubMed] [Google Scholar]
- 37.Tripathi S., Kessler D.A., Levine H. Biological networks regulating cell fate choice are minimally frustrated. Phys. Rev. Lett. 2020;125:088101. doi: 10.1103/physrevlett.125.088101. [DOI] [PubMed] [Google Scholar]
- 38.Jia D., Li X., Bocci F., Tripathi S., Deng Y., Jolly M.K., Onuchic J.N., Levine H. Quantifying cancer epithelial-mesenchymal plasticity and its association with stemness and immune response. J. Clin. Med. 2019;8:725. doi: 10.3390/jcm8050725. [DOI] [PMC free article] [PubMed] [Google Scholar]
- 39.Muralidharan S., Sahoo S., Saha A., Chandran S., Majumdar S.S., Mandal S., Levine H., Jolly M.K. Quantifying the patterns of metabolic plasticity and heterogeneity along the epithelial–hybrid–mesenchymal spectrum in cancer. Biomolecules. 2022;12:297. doi: 10.3390/biom12020297. [DOI] [PMC free article] [PubMed] [Google Scholar]
- 40.Tripathi S., Park J.H., Pudakalakatti S., Bhattacharya P.K., Kaipparettu B.A., Levine H. A mechanistic modeling framework reveals the key principles underlying tumor metabolism. PLoS Comput. Biol. 2022;18:e1009841. doi: 10.1371/journal.pcbi.1009841. [DOI] [PMC free article] [PubMed] [Google Scholar]
- 41.Radisky D.C., Levy D.D., Littlepage L.E., Liu H., Nelson C.M., Fata J.E., Leake D., Godden E.L., Albertson D.G., Nieto M.A., et al. Rac1b and reactive oxygen species mediate MMP-3-induced EMT and genomic instability. Nature. 2005;436:123–127. doi: 10.1038/nature03688. [DOI] [PMC free article] [PubMed] [Google Scholar]
- 42.Ishikawa K., Takenaga K., Akimoto M., Koshikawa N., Yamaguchi A., Imanishi H., Nakada K., Honma Y., Hayashi J.-I. ROS-generating mitochondrial DNA mutations can regulate tumor cell metastasis. Science. 2008;320:661–664. doi: 10.1126/science.1156906. [DOI] [PubMed] [Google Scholar]
- 43.Kovac S., Angelova P.R., Holmström K.M., Zhang Y., Dinkova-Kostova A.T., Abramov A.Y. Nrf2 regulates ROS production by mitochondria and NADPH oxidase. Biochim. Biophys. Acta. 2015;1850:794–801. doi: 10.1016/j.bbagen.2014.11.021. [DOI] [PMC free article] [PubMed] [Google Scholar]
- 44.Shida M., Kitajima Y., Nakamura J., Yanagihara K., Baba K., Wakiyama K., Noshiro H. Impaired mitophagy activates mtROS/HIF-1α interplay and increases cancer aggressiveness in gastric cancer cells under hypoxia. Int. J. Oncol. 2016;48:1379–1390. doi: 10.3892/ijo.2016.3359. [DOI] [PubMed] [Google Scholar]
- 45.Babaei G., Raei N., Toofani Milani A., Gholizadeh-Ghaleh Aziz S., Pourjabbar N., Geravand F. The emerging role of miR-200 family in metastasis: focus on EMT, CSCs, angiogenesis, and anoikis. Mol. Biol. Rep. 2021;48:6935–6947. doi: 10.1007/s11033-021-06666-6. [DOI] [PubMed] [Google Scholar]
- 46.Graziani V., Rodriguez-Hernandez I., Maiques O., Sanz-Moreno V. The amoeboid state as part of the epithelial-to-mesenchymal transition programme. Trends Cell Biol. 2022;32:228–242. doi: 10.1016/j.tcb.2021.10.004. [DOI] [PubMed] [Google Scholar]
- 47.Bocci F., Gearhart-Serna L., Boareto M., Ribeiro M., Ben-Jacob E., Devi G.R., Levine H., Onuchic J.N., Jolly M.K. Toward understanding cancer stem cell heterogeneity in the tumor microenvironment. Proc. Natl. Acad. Sci. USA. 2019;116:148–157. doi: 10.1073/pnas.1815345116. [DOI] [PMC free article] [PubMed] [Google Scholar]
- 48.Jolly M.K., Jia D., Boareto M., Mani S.A., Pienta K.J., Ben-Jacob E., Levine H. Coupling the modules of EMT and stemness: a tunable ‘stemness window’ model. Oncotarget. 2015;6:25161–25174. doi: 10.18632/oncotarget.4629. [DOI] [PMC free article] [PubMed] [Google Scholar]
- 49.Bocci F., Jolly M.K., George J.T., Levine H., Onuchic J.N. A mechanism-based computational model to capture the interconnections among epithelial-mesenchymal transition, cancer stem cells and Notch-Jagged signaling. Oncotarget. 2018;9:29906–29920. doi: 10.18632/oncotarget.25692. [DOI] [PMC free article] [PubMed] [Google Scholar]
- 50.He F., Ru X., Wen T. NRF2, a transcription factor for stress response and beyond. Int. J. Mol. Sci. 2020;21:4777. doi: 10.3390/ijms21134777. [DOI] [PMC free article] [PubMed] [Google Scholar]
- 51.Li N., Muthusamy S., Liang R., Sarojini H., Wang E. Increased expression of miR-34a and miR-93 in rat liver during aging, and their impact on the expression of Mgst1 and Sirt1. Mech. Ageing Dev. 2011;132:75–85. doi: 10.1016/j.mad.2010.12.004. [DOI] [PubMed] [Google Scholar]
- 52.Bai X.-Y., Ma Y., Ding R., Fu B., Shi S., Chen X.-M. miR-335 and miR-34a promote renal senescence by suppressing mitochondrial antioxidative enzymes. J. Am. Soc. Nephrol. 2011;22:1252–1261. doi: 10.1681/asn.2010040367. [DOI] [PMC free article] [PubMed] [Google Scholar]
- 53.Navarro F., Lieberman J. miR-34 and p53: new insights into a complex functional relationship. PLoS One. 2015;10:e0132767. doi: 10.1371/journal.pone.0132767. [DOI] [PMC free article] [PubMed] [Google Scholar]
- 54.Italiano D., Lena A.M., Melino G., Candi E. Identification of NCF2/p67phox as a novel p53 target gene. Cell Cycle. 2012;11:4589–4596. doi: 10.4161/cc.22853. [DOI] [PMC free article] [PubMed] [Google Scholar]
- 55.Serocki M., Bartoszewska S., Janaszak-Jasiecka A., Ochocka R.J., Collawn J.F., Bartoszewski R. miRNAs regulate the HIF switch during hypoxia: a novel therapeutic target. Angiogenesis. 2018;21:183–202. doi: 10.1007/s10456-018-9600-2. [DOI] [PMC free article] [PubMed] [Google Scholar]
- 56.Shang Y., Chen H., Ye J., Wei X., Liu S., Wang R. HIF-1α/Ascl2/miR-200b regulatory feedback circuit modulated the epithelial-mesenchymal transition (EMT) in colorectal cancer cells. Exp. Cell Res. 2017;360:243–256. doi: 10.1016/j.yexcr.2017.09.014. [DOI] [PubMed] [Google Scholar]
- 57.Byun Y., Choi Y.-C., Jeong Y., Lee G., Yoon S., Jeong Y., Yoon J., Baek K. MiR-200c downregulates HIF-1α and inhibits migration of lung cancer cells. Cell. Mol. Biol. Lett. 2019;24:28. doi: 10.1186/s11658-019-0152-2. [DOI] [PMC free article] [PubMed] [Google Scholar]
- 58.Bartoszewska S., Kochan K., Piotrowski A., Kamysz W., Ochocka R.J., Collawn J.F., Bartoszewski R. The hypoxia-inducible miR-429 regulates hypoxia-inducible factor-1α expression in human endothelial cells through a negative feedback loop. FASEB J. 2015;29:1467–1479. doi: 10.1096/fj.14-267054. [DOI] [PMC free article] [PubMed] [Google Scholar]
- 59.Xu X., Tan X., Tampe B., Sanchez E., Zeisberg M., Zeisberg E.M. Snail is a direct target of hypoxia-inducible factor 1α (HIF1α) in hypoxia-induced endothelial to mesenchymal transition of human coronary endothelial cells. J. Biol. Chem. 2015;290:16653–16664. doi: 10.1074/jbc.m115.636944. [DOI] [PMC free article] [PubMed] [Google Scholar]
- 60.Chou C.-C., Lee K.-H., Lai I.-L., Wang D., Mo X., Kulp S.K., Shapiro C.L., Chen C.-S. AMPK reverses the mesenchymal phenotype of cancer cells by targeting the akt–MDM2–Foxo3a signaling Axis. Cancer Res. 2014;74:4783–4795. doi: 10.1158/0008-5472.can-14-0135. [DOI] [PMC free article] [PubMed] [Google Scholar]
- 61.Ohshima J., Wang Q., Fitzsimonds Z.R., Miller D.P., Sztukowska M.N., Jung Y.-J., Hayashi M., Whiteley M., Lamont R.J. Streptococcus gordonii programs epithelial cells to resist ZEB2 induction by Porphyromonas gingivalis. Proc. Natl. Acad. Sci. USA. 2019;116:8544–8553. doi: 10.1073/pnas.1900101116. [DOI] [PMC free article] [PubMed] [Google Scholar]
- 62.Dong T., Zhang Y., Chen Y., Liu P., An T., Zhang J., Yang H., Zhu W., Yang X. FOXO1 inhibits the invasion and metastasis of hepatocellular carcinoma by reversing ZEB2-induced epithelial-mesenchymal transition. Oncotarget. 2017;8:1703–1713. doi: 10.18632/oncotarget.13786. [DOI] [PMC free article] [PubMed] [Google Scholar]
- 63.Huang W., Cao J., Liu X., Meng F., Li M., Chen B., Zhang J. AMPK plays a dual role in regulation of CREB/BDNF pathway in mouse primary hippocampal cells. J. Mol. Neurosci. 2015;56:782–788. doi: 10.1007/s12031-015-0500-2. [DOI] [PubMed] [Google Scholar]
- 64.Jin H., Xue L., Mo L., Zhang D., Guo X., Xu J., Li J., Peng M., Zhao X., Zhong M., et al. Downregulation of miR-200c stabilizes XIAP mRNA and contributes to invasion and lung metastasis of bladder cancer. Cell Adh. Migr. 2019;13:236–248. doi: 10.1080/19336918.2019.1633851. [DOI] [PMC free article] [PubMed] [Google Scholar]
- 65.Janin M., Esteller M. Oncometabolite accumulation and epithelial-to-mesenchymal transition: the turn of fumarate. Cell Metab. 2016;24:529–530. doi: 10.1016/j.cmet.2016.09.020. [DOI] [PubMed] [Google Scholar]
- 66.Zhang Q., Zheng S., Wang S., Wang W., Xing H., Xu S. Chlorpyrifos induced oxidative stress to promote apoptosis and autophagy through the regulation of miR-19a-AMPK axis in common carp. Fish Shellfish Immunol. 2019;93:1093–1099. doi: 10.1016/j.fsi.2019.07.022. [DOI] [PubMed] [Google Scholar]
- 67.Thomson D.M., Herway S.T., Fillmore N., Kim H., Brown J.D., Barrow J.R., Winder W.W. AMP-activated protein kinase phosphorylates transcription factors of the CREB family. J. Appl. Physiol. 2008;104:429–438. doi: 10.1152/japplphysiol.00900.2007. [DOI] [PubMed] [Google Scholar]
- 68.Clewley R.H., Sherwood W.E., LaMar M.D., Guckenheimer J.M. 2007. PyDSTool, a software environment for dynamical systems modeling.http://pydstool.sourceforge.net [Google Scholar]
Associated Data
This section collects any data citations, data availability statements, or supplementary materials included in this article.
Supplementary Materials
Data Availability Statement
-
•
All data here was generated using code and parameters available in the supplemental information and at https://github.com/madgal/EMT_MR.
-
•
All code used to generate and analyze data is available at https://github.com/madgal/EMT_MR.
-
•
Any additional information required to reanalyze the data reported in this paper is available from the lead contactupon request.