Abstract
Combination therapy with PD-1 blockade and IL-2 is highly effective during chronic lymphocytic choriomeningitis virus infection1. Here we examine the underlying basis for this synergy. We show that PD-1 + IL-2 combination therapy, unlike PD-1 monotherapy, dramatically changes the differentiation program of the PD-1+TCF-1+ stem-like CD8+ T cells and results in the generation of transcriptionally and epigenetically distinct effector CD8+ T cells that resemble highly functional effector CD8+ T cells seen after an acute viral infection. The generation of these qualitatively superior CD8+ T cells that mediate viral control underlies the synergy between PD-1 and IL-2. Our results show that the PD-1+TCF-1+ stem-like CD8+ T cells, also referred to as precursors of exhausted CD8+ T cells, are not fate-locked into the exhaustion program and their differentiation trajectory can be changed by IL-2 signals. These virus-specific effector CD8+ T cells emerging from the stem-like CD8+ T cells after combination therapy expressed increased levels of the high affinity IL-2 trimeric (CD25, CD122, CD132) receptor. This was not seen after PD-1 blockade alone. Finally, we show that CD25 engagement with IL-2 plays an important role in the observed synergy between IL-2 cytokine and PD-1 blockade. Either blocking CD25 with an antibody or using a mutated version of IL-2 that does not bind CD25 but still binds CD122/CD132 almost completely abrogated the synergistic effects seen after PD-1 + IL-2 combination therapy. There is currently considerable interest in PD-1 + IL-2 combination therapy for patients with cancer2,3 and our fundamental studies defining the underlying mechanisms of how IL-2 synergizes with PD-1 blockade should inform these human translational studies.
The PD-1 inhibitory pathway plays a central role in regulating T-cell exhaustion during chronic viral infection and cancer and PD-1-directed immunotherapy is approved for the treatment of several different cancers4,5. However, not all patients respond to PD-1 monotherapy and there is considerable interest in developing PD-1 combination therapies to improve the overall response rate and also get more complete and durable responses in the cancer patients. Many different combination therapy approaches are currently being tested in animal models and also in clinical trials. One potentially promising candidate for combination therapy with PD-1 blockade is the common gamma-chain cytokine interleukin-2 (IL-2)2,3,6. The rationale here is to remove the PD-1 inhibitory brake and at the same time provide a positive signal for T cells with IL-2 – a cytokine that was originally defined as a growth factor for T cells7. There are currently several clinical trials of PD-1 + IL-2 combination therapy that are ongoing for cancer2,3. Thus, it is important to better understand how this combination therapy works and to define the cellular and molecular bases for the observed synergy between PD-1 blockade and IL-2.
Viral control by CD8+ T cells after PD-1 + IL-2 therapy
The mouse model of chronic LCMV infection was used to examine the synergy between PD-1 blockade and IL-2 cytokine therapy. Groups of chronically infected mice were either left untreated, treated with anti-PD-L1 antibody alone, given IL-2 alone, or given combination therapy with anti-PD-L1 antibody and IL-2. Combination therapy resulted in highly synergistic increases in the number of functional LCMV-specific CD8+ T cells and significantly better viral control in both lymphoid and non-lymphoid tissues (Extended Data Fig. 1a–e). These results are consistent with our earlier observations1. We next determined whether this enhanced viral control after PD-1 + IL-2 combination therapy was mediated by CD8+ T cells by treating mice with anti-CD8 depleting antibody during the period of combination therapy. Depletion of CD8+ T cells almost completely abrogated the antiviral effect seen after PD-1 + IL-2 combination treatment. There was a strong correlation between the number of CD8+ T cells (total and LCMV-specific) and reduction of viral titre in the spleen, liver, and lung of these mice (Extended Data Fig. 1f–i). Thus, viral control after PD-1 + IL-2 combination therapy is mediated by LCMV-specific CD8+ T cells.
PD-1+TCF-1+ stem-like CD8+ T cells respond to PD-1 + IL-2 therapy
Recent studies have identified a population of PD-1+TCF-1+ stem-like CD8+ T cells that serve as a resource cell for maintaining the CD8+ T-cell response during chronic viral infection and cancer and also provide the proliferative burst after PD-1 blockade8–14. A key question to ask was whether these PD-1+ stem-like CD8+ T cells also respond to PD-1 + IL-2 combination therapy. To address this question, we sorted the PD-1+ stem-like CD8+ T cells or the more differentiated/exhausted cell population from LCMV chronically infected mice using appropriate cell surface markers and transferred these cells into infection matched mice. Groups of these mice were then treated with PD-1 blockade alone, IL-2 alone, or both PD-1 blockade and IL-2 (Fig. 1a, Extended Data Fig. 2a). These T-cell adoptive transfer experiments were done using congenically distinct mice so that donor and recipient CD8+ T cells could be easily distinguished. We found that the response to PD-1 blockade came exclusively from the stem-like CD8+ T cells confirming our earlier studies8,10,13. Interestingly, the response to IL-2 therapy alone and to PD-1 + IL-2 combination therapy also came from the PD-1+ stem-like CD8+ T cells. In contrast, there was minimal to no response from the more differentiated CD8+ T-cell population after any of these three treatments. It is noteworthy that the magnitude of the response from the stem-like CD8+ T cells was about 10-fold greater after combination therapy compared to PD-1 monotherapy. This was seen in multiple tissues including spleen, liver, lung, and blood (Fig. 1b, c, Extended Data Fig. 2b–d). Taken together, these results show that the same population of PD-1+TCF-1+ CD8+ T cells responds to PD-1 blockade, IL-2 treatment, and to PD-1 + IL-2 combination therapy highlighting the importance of these CD8+ T cells in different immunotherapy regimens.
Fig. 1. PD-1+ TCF-1+ stem-like CD8+ T cells provide the proliferative burst after PD-1 blockade, IL-2 therapy, and PD-1 + IL-2 combination therapy during chronic LCMV infection.

a, The stem-like (PD-1+CXCR5+TIM3−) and terminally differentiated exhausted (PD-1+CXCR5−TIM3+) CD8+ T-cell subsets were sorted from the spleens of LCMV chronically infected CD45.2+ mice and each subset was transferred into infection-matched CD45.1+ recipient mice. Groups of these mice were then either left untreated, or given anti-PD-L1 antibodies, IL-2 therapy or the combination therapy for 2 weeks. b, Representative FACS plots showing the frequency of donor CD45.2+ CD8+ T cells in the recipient mice two weeks after the various treatments. c, The numbers of donor CD45.2+ CD8+ T cells after 2 weeks of the indicated treatments. Results were pooled from 3–4 experiments with n = 7–9 (PD-1 therapy), n = 8–13 (IL-2 therapy), and n = 5–11 (combination therapy) per group. Data are geometric mean ± 95% confidence interval (CI). Dotted line indicates the limit of detection of donor CD45.2+ CD8+ T cells. P values are shown; statistical comparisons were performed using two-tailed unpaired Mann-Whitney test. AF, Alexa Fluor; Tx, treated; Untx, untreated.
Transcriptional signature of LCMV-specific CD8+ T cells
The studies above have shown that the same precursor stem-like CD8+ T cells responded by proliferation and differentiation to all treatments. Thus, it was of interest to determine whether the transcriptional signatures of the expanded CD8+ T cells were similar or different after PD-1 monotherapy versus combination therapy or IL-2 treatment alone. RNA-seq analysis was done of sorted LCMV-specific CD8+ T cells (DbGP33+) from the four groups of chronically infected mice. The RNA-seq results showed that the gene expression profile of virus-specific CD8+ T cells was similar in untreated mice compared to mice treated with PD-1 blockade alone. However, PD-1 + IL-2 combination therapy resulted in LCMV-specific CD8+ T cells with a transcriptional signature that was strikingly different from what was seen after PD-1 monotherapy. Interestingly, IL-2 treatment alone also gave LCMV-specific CD8+ T cells with a gene expression profile similar to the combination therapy (Fig. 2a, b, Extended Data Fig. 3a). Expression of several inhibitory receptors (Havcr2, Pdcd1, Lag3, Tigit, Cd101, Cd160, Cd244, and Btla) and transcription factors associated with T-cell exhaustion (Batf, Egr2, Ikzf2, Irf4, Nfatc1, Nr4a2, and Tox2)4,5,9,15,16 were downregulated in LCMV-specific CD8+ T cells from mice that received PD-1 + IL-2 combination therapy or IL-2 treatment alone compared to virus-specific CD8+ T cells isolated from untreated chronically infected mice or after PD-1 monotherapy. Interestingly, in contrast to the downregulation of genes associated with exhaustion, there was upregulation of genes encoding effector molecules and inflammatory cytokine receptors (Gzmb, Il18r1, Il18rap, and Il1rl1 (also known as ST2, a receptor for IL-33)) in mice receiving combination therapy or IL-2 treatment. There was also increased RNA levels for some memory associated genes (Il7r and Lef1)16. One of the most striking changes in LCMV-specific CD8+ T cells after combination or IL-2 therapy was the upregulation of genes involved in migration and adhesion (Cxcr3, S1pr1, Klf2, Itgb1, Cd44, and Ly6c2). These transcriptional changes are consistent with PD-1 + IL-2 combination therapy resulting in the generation of LCMV-specific CD8+ T cells that resemble CD8+ effector (Teff) and memory (Tmem) T cells generated during acute infection rather than exhausted CD8+ T cells present during chronic infection9,16, 17. To further confirm these observations, Gene Set Enrichment Analysis (GSEA) was done using signatures of CD8+ T-cell exhaustion from LCMV clone 13 chronic infection and CD8+ T-cell effector and memory signatures from LCMV Armstrong acute infection16,17. The GSEA results show that LCMV-specific CD8+ T cells from the combination therapy or IL-2 treatment showed a decrease in the exhaustion signature and an enrichment for the acute effector and memory signatures. The opposite pattern was seen with virus-specific CD8+ T cells from untreated chronically infected mice or after PD-1 monotherapy (Fig. 2c, Extended Data Fig. 3b–d).
Fig. 2. Distinct transcriptional signature of virus-specific CD8+ T cells after PD-1 + IL-2 combination therapy compared to PD-1 monotherapy during chronic LCMV infection.
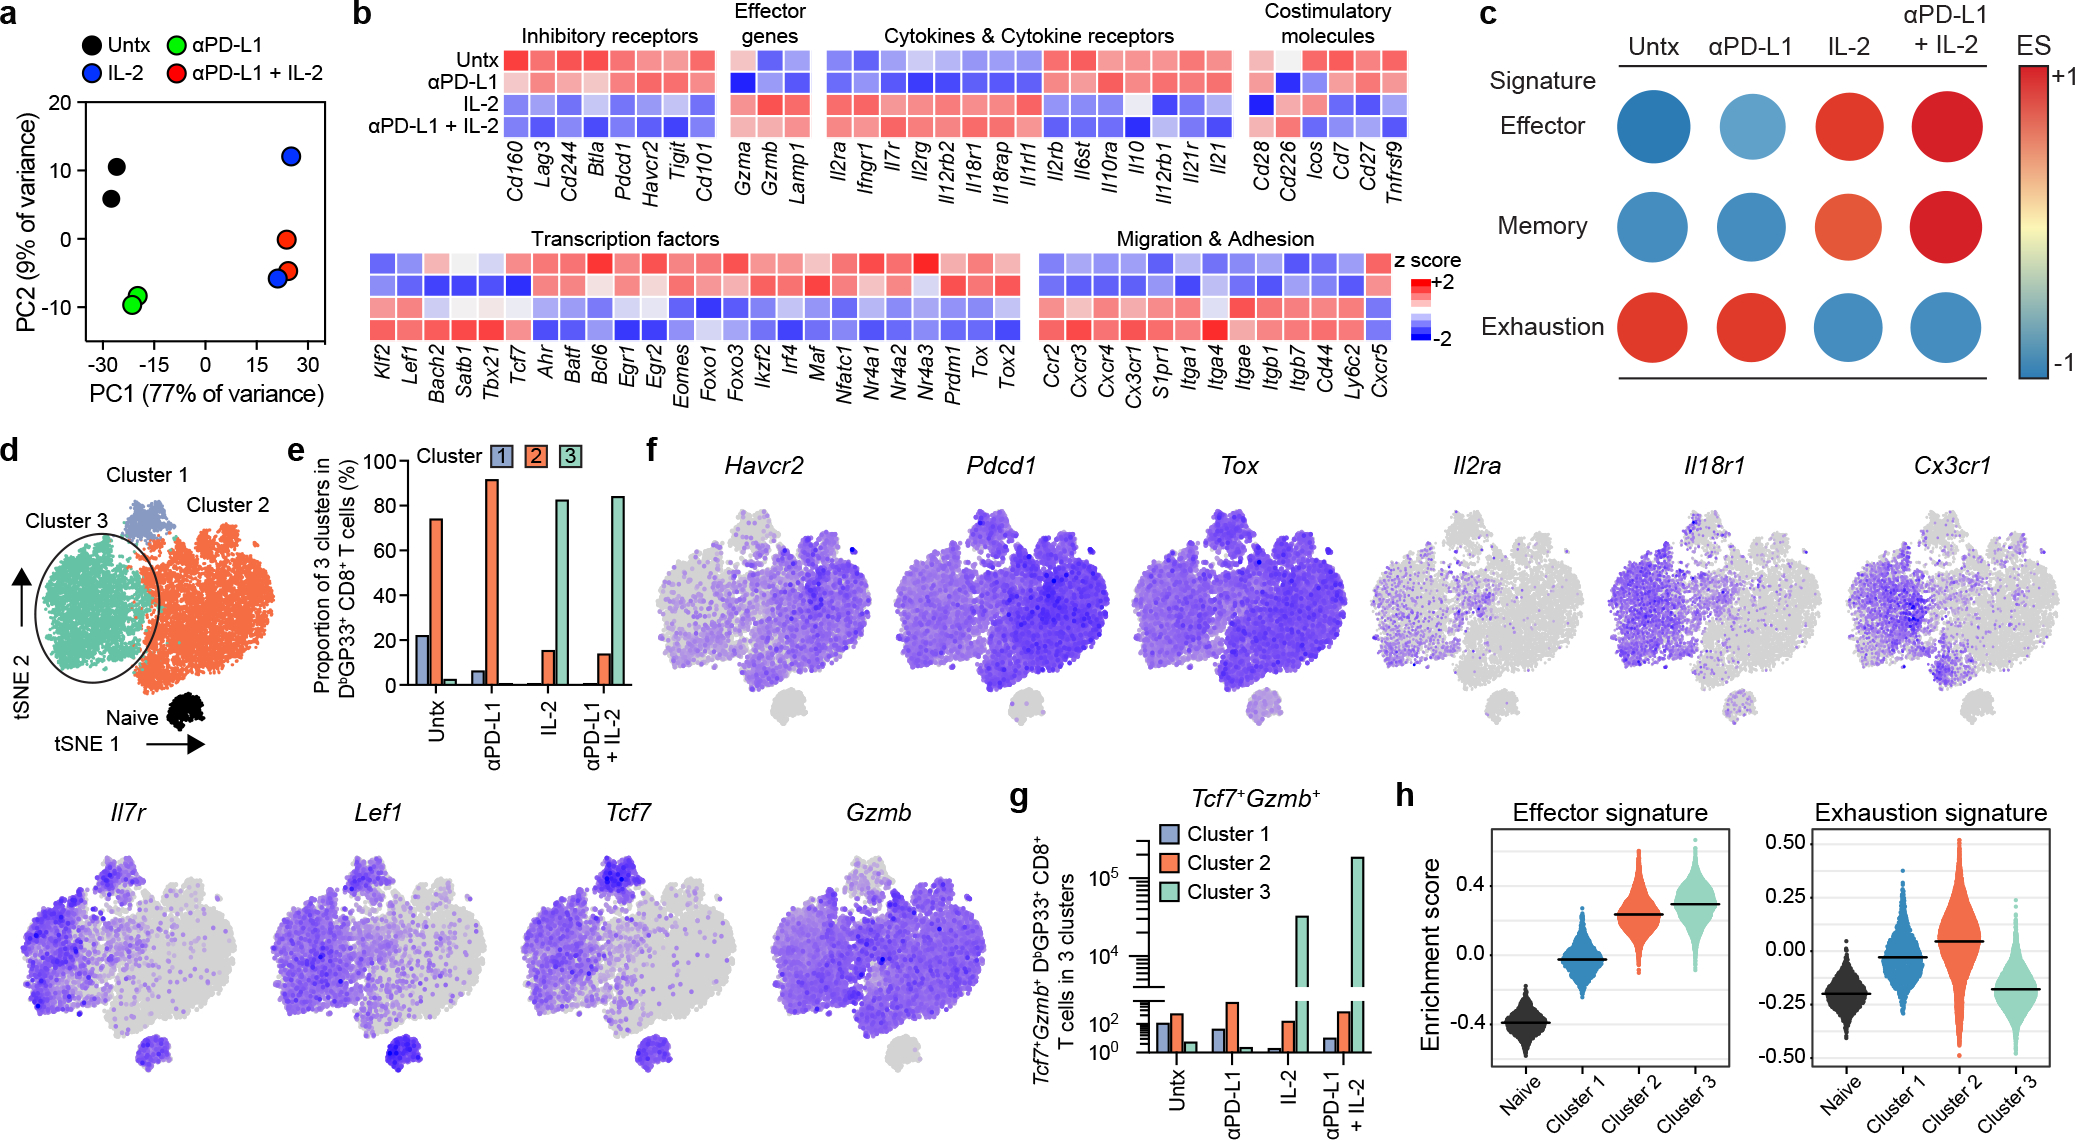
a–h, Mice chronically infected with LCMV were treated with PD-1 monotherapy, IL-2 alone, or combination therapy for 2 weeks. LCMV-specific DbGP33+ CD8+ T cells from spleens of each treatment group were sorted for RNA-seq (a-c) and scRNA-seq (d-h) analysis. As a control, naive CD44low CD8+ T cells were also sorted for scRNA-seq (d-h). a, PCA plot of DbGP33+ CD8+ T cells after the indicated treatments. b, The mean relative expressions of specific genes. c, GSEA of DbGP33+ CD8+ T cells generated by the indicated treatments for effector and memory signatures (acute infection), and exhaustion signature (chronic infection). The colour and size of the circles represent the enrichment score (ES) for each signature. d, t-SNE projections of naive CD44low CD8+ T cells and DbGP33+ CD8+ T cells generated by the various treatments. Four clusters (one for naive and three for treatment samples) were defined and are indicated by different colours. The new cluster (cluster 3) generated after combination therapy or IL-2 treatment is highlighted by the black circle. e, The proportions of three clusters in DbGP33+ CD8+ T cells in each treatment group. f, Normalized expression of several representative genes is shown within the four clusters. g, Numbers of Tcf7+Gzmb+ DbGP33+ CD8+ T cells that are present in clusters 1, 2, and 3 after the various treatments. h, GSEA of DbGP33+ CD8+ T cells in each of three clusters for effector signature (acute infection) and exhaustion signature (chronic infection). Enrichment score for the signature in each cluster is shown as violin plots; the horizontal bars show the mean. Results were pooled from 2 (a–c) and 1–2 (d–h) experiments with n =2–18 mice per group in each experiment.
To gain further insights into how the differentiation program of virus-specific CD8+ T cells was altered by PD-1 + IL-2 combination therapy versus PD-1 monotherapy we performed single-cell RNA sequencing (scRNA-seq) analysis of LCMV-specific CD8+ T cells after the various in vivo treatments. We compared these different tetramer sorted cells along with naive CD8+ T cells by t-distributed stochastic neighbor embedding (t-SNE) projection analysis. This analysis displayed four clusters, one for naive CD8+ T cells (naive cluster) and the other three for the LCMV-specific CD8+ T-cell samples (clusters 1–3) (Fig. 2d). We found that DbGP33-specific CD8+ T cells from untreated and PD-1 treated mice were mostly composed of cluster 1 and 2, which represented clusters for PD-1+TCF-1+ stem-like cells (cluster 1) and the more differentiated CD8+ T cells (cluster 2). In contrast, LCMV-specific CD8+ T cells from mice treated with IL-2 alone or given the combination therapy consisted predominantly (> 80%) of the unique cluster 3. It should be noted that PD-1 + IL-2 combination therapy reduces the percentage of cells in cluster 1 but there is no decrease in the total numbers of the stem-like CD8+ T cells (Fig. 2e, Extended Data Fig. 3e–g). The dominance of cluster 3 is quite striking and it is this cluster that defines the new LCMV-specific CD8+ T cell population that is generated from the PD-1+TCF-1+ stem-like CD8+ T cells after treatment of chronically infected mice with IL-2 or combination therapy. This cluster is characterized by lower expression of multiple inhibitory receptors and transcription factors associated with T-cell exhaustion and upregulation of genes related to effector function, migration, and adhesion. Cluster 3 cells also expressed some genes associated with memory T cells (Tcf7, Lef1, and Il7r) (Fig. 2f, Extended Data Fig. 3h). Of particular interest was the question whether there were any virus-specific CD8+ T cells that co-express Tcf7 and Gzmb. Cluster 1 that represents the PD-1+ stem-like CD8+ T cells consisted mostly (90%) of Tcf7+ cells that did not express Gzmb and cluster 2 which represents the more differentiated population comprised mostly (96%) of Gzmb positive cells that did not express Tcf7. In contrast, > 20% of CD8+ T cells in the unique cluster 3 co-expressed Tcf7 and Gzmb resulting in > 105 LCMV-specific CD8+ T cells in the spleen co-expressing Tcf7 and Gzmb after combination therapy and 3 × 10⁴ cells after IL-2 therapy compared to < 500–4,000 such cells in mice that were untreated or given PD-1 monotherapy (Fig. 2g, Extended Data Fig. 3i). These CD8+ T cells are of biological importance because memory precursor effector CD8+ T cells (MP) that are generated during acute infections and give rise to the pool of long-lived memory CD8+ T cells also co-express Gzmb and Tcf718–20. GSEA of the three clusters showed that cluster 3 cells were enriched for effector signature and highly decreased for exhaustion signature in contrast to cluster 2 cells generated after PD-1 monotherapy that were enriched for effector signature but also highly enriched for exhaustion signature (Fig. 2h). A similar pattern was seen when GSEA was performed using the different treatment groups as opposed to the different clusters (Extended Data Fig. 3j).
Phenotype and function of LCMV-specific CD8+ T cells
To determine if the key changes in the transcriptional signatures were also reflected by protein expression we did extensive FACS analysis of LCMV-specific CD8+ T cells isolated from chronically infected mice that were untreated, given PD-1 therapy, IL-2 treatment or combination therapy. These phenotypic analyses are shown in Extended Data Fig. 4a and they confirm the RNA-seq data. The phenotypic markers expressed by LCMV-specific CD8+ T cells after combination therapy or IL-2 treatment are consistent with these CD8+ T cells being less exhausted and more effector-like plus expressing some memory T-cell markers. We also performed multi-parameter flow cytometry and this confirmed the scRNA-seq data showing that the expanded CD8+ T cells after IL-2 treatment or PD-1 + IL-2 combination therapy were dominated by a unique cluster 3 that comprised around 90% of the cell population. The virus-specific CD8+ T cells in cluster 3 express effector molecules such as granzyme B, CX3CR1, and CD218a but at the same time also express markers associated with stem-like CD8+ T cells such as TCF-1, SLAMF6, and CD73. These CD8+ T cells also express lower levels of exhaustion markers such as TIM3 and CD101 (Fig. 3a–c, Extended Data Fig. 5a).
Fig. 3. Phenotypic and functional characterization of LCMV-specific CD8+ T cells generated by PD-1 and IL-2 monotherapy and the combination therapy during chronic infection.
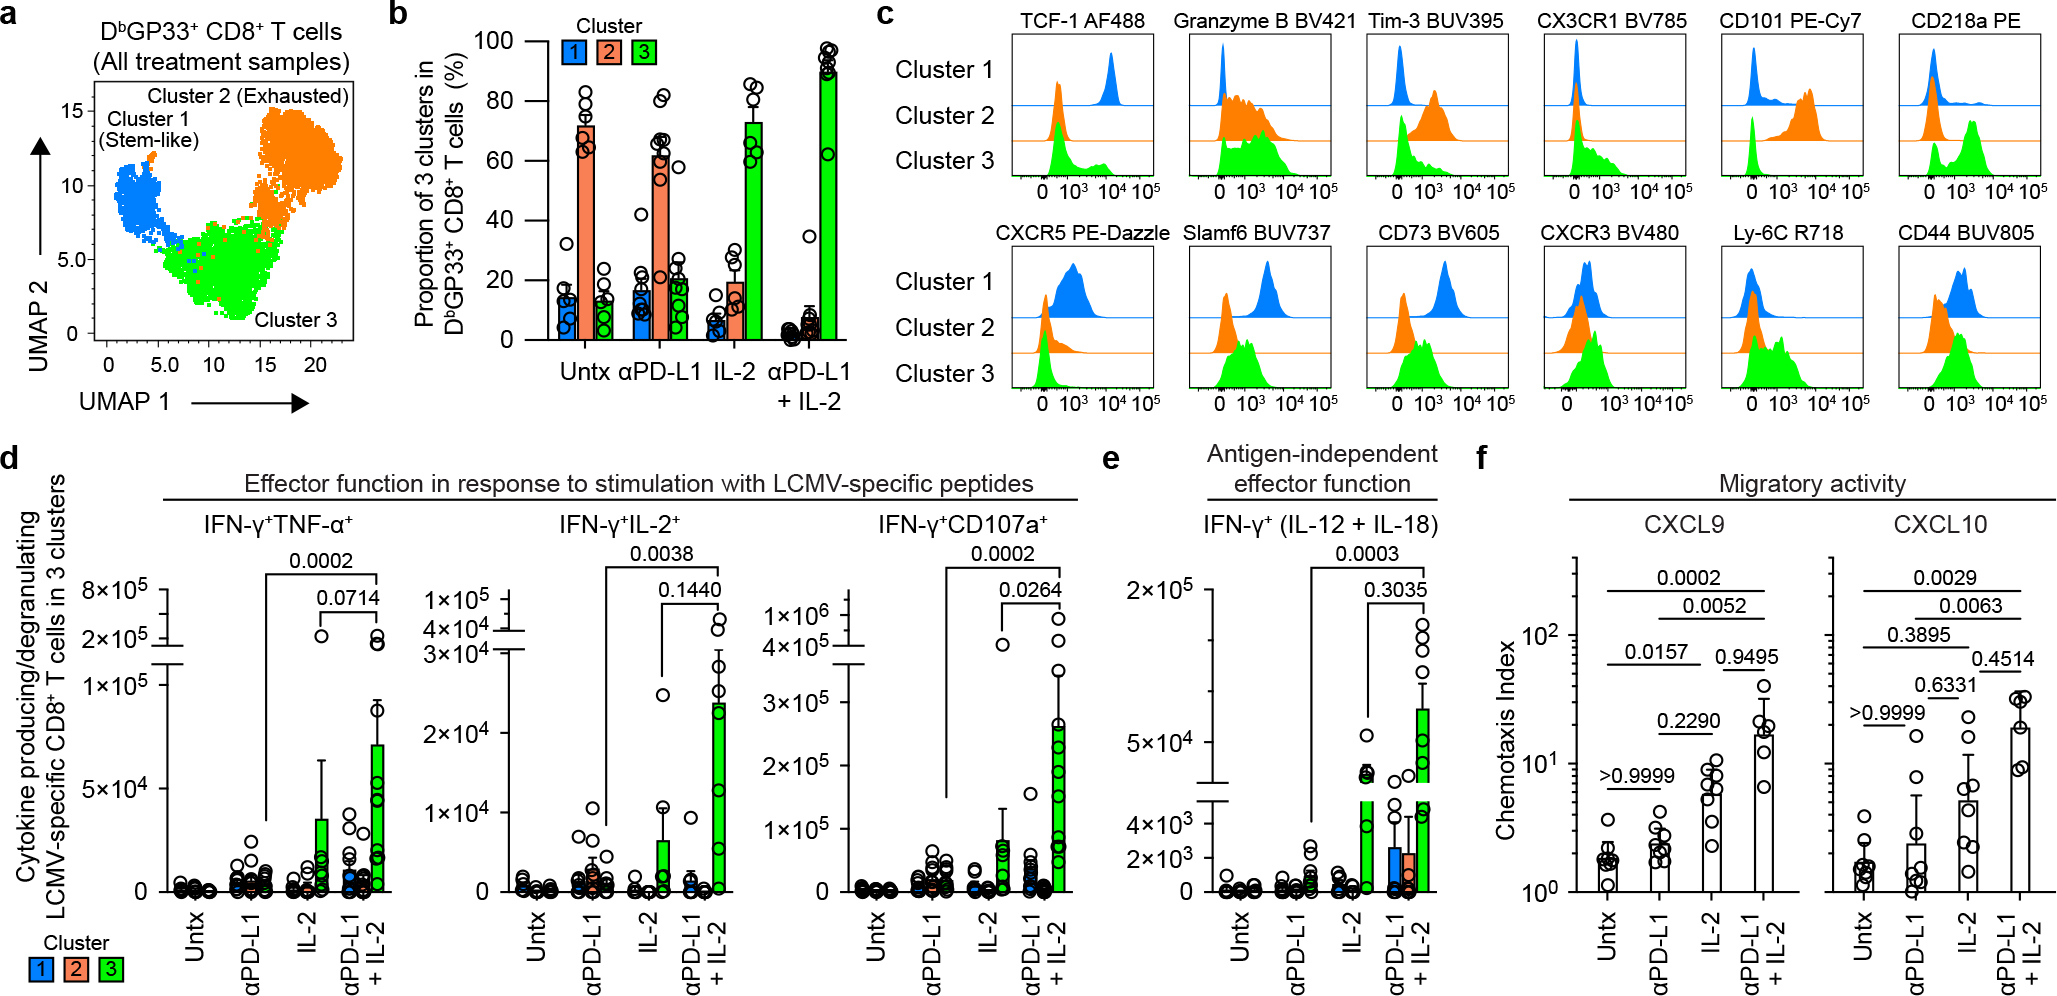
LCMV chronically infected mice were either untreated or treated with PD-1 therapy, IL-2 treatment or the combination therapy for 2 weeks. a, Representative UMAP with FlowSOM overlay showing three clusters of concatenated DbGP33+ CD8+ T cells isolated from spleens after the four treatments. b, The proportions of three clusters of DbGP33+ CD8+ T cells in the different groups of mice. c, Representative histograms of various phenotypic markers expressed by DbGP33+ CD8+ T cells in the three clusters. d, Effector function in response to stimulation with LCMV-specific peptides. Spleen cells were stimulated with pools of LCMV-specific peptides for 5 h and analyzed by intracellular staining for cytokine production and degranulation. Summary data for numbers of PD-1+ LCMV-specific CD8+ T cells producing IFNγ and TNFα, IFNγ and IL-2, and IFNγ plus degranulation (CD107a+) are shown as a function of the three clusters in the different treatment groups. e, Antigen-independent effector function. Spleen cells were stimulated with IL-12 and IL-18 (20 ng ml−1 each) for 6h without any viral peptides. Cells were then stained with surface markers including DbGP33-specific tetramer, fixed, and followed by intracellular staining of IFNγ. Summary data for numbers of LCMV-specific CD8+ T cells producing IFNγ+ in an antigen-independent manner as a function of the three clusters in the various treatment groups. f, Chemotaxis index for CXCL9 and CXCL10. Sorted PD-1+ CD8+ T cells obtained from pooled spleens of chronically infected mice treated for 2 weeks by each treatment were tested for chemotaxis to CXCL9 and CXCL10. For a–e, the results were pooled from 2–4 experiments with 1–8 mice per group in each experiment. Data are mean ± s.d. (b), mean ± s.e.m (d and e), or geometric mean ± 95% CI (f). P values are shown; statistical comparisons were performed using Kruskal-Wallis test with Dunn’s multiple comparison test (d–f).
The virus-specific CD8+ T cells generated after PD-1 + IL-2 combination therapy were also functionally superior to CD8+ T cells generated after PD-1 monotherapy. As shown in Extended Data Fig. 1c, d, these CD8+ T cells produced multiple cytokines and degranulated after peptide stimulation and this cytokine production comes predominantly from the unique cluster 3 CD8+ T cells generated after the combination therapy (Fig. 3d, Extended Data Fig. 5b). In addition to efficient cytokine production after stimulation with virus-specific peptides, the LCMV-specific CD8+ T cells generated after PD-1 + IL-2 combination therapy or IL-2 treatment were also capable of producing IFNγ after stimulation by IL-12 and IL-18 in the absence of peptide stimulation. This is due to the high expression of IL-18Rα (CD218a) by these CD8+ T cells. An interesting biological consequence of CD218a expression is that these CD8+ T cells can respond to inflammatory cytokines (IL-12 and IL-18) and produce IFNγ even in the absence of cognate antigen (Extended Data Fig. 4b, c). Similar to the cytokine production seen after stimulation with LCMV-specific peptides, the IL-12- and IL-18-mediated release of IFNγ in the absence of antigen stimulation also comes from cluster 3 CD8+ T cells generated after PD-1 + IL-2 combination therapy (Fig. 3e). Another interesting biological property of the LCMV-specific CD8+ T cells generated after combination therapy or IL-2 treatment is their ability to migrate to CXCL9 and CXCL10 due to the high expression of the chemokine receptor CXCR3 (Fig. 3c, f, Extended Data Fig. 4a). CXCR3 plays an important role in CD8+ T-cell mediated viral control and a role for CXCL9 and CXCL10 has been implicated in cancer immunotherapy21,22.
Epigenetic signature of LCMV-specific CD8+ T cells
Virus-specific CD8+ T cells acquire an epigenetic landscape during chronic infection that is distinct from that of CD8+ Teff and Tmem cells during acute infection, and the epigenetic stability of this exhaustion program has been proposed to limit the effectiveness of PD-1 therapy23,24. We next examined if PD-1 + IL-2 combination therapy changed the epigenetic signatures of LCMV-specific CD8+ T cells using the assay for transposase-accessible chromatin with sequencing (ATAC-seq)25. PD-1 + IL-2 combination therapy dramatically changed chromatin accessibility of LCMV-specific CD8+ T cells compared to virus-specific CD8+ T cells from untreated mice or mice treated with PD-1 monotherapy (Fig. 4a). IL-2 treatment alone also induced changes in the epigenetic signature of LCMV-specific CD8+ T cells compared to untreated mice (Fig. 4a). The differentially open and closed regions after PD-1 + IL-2 combination therapy versus PD-1 monotherapy were identified using the Genomic Regions Enrichment of Annotations Tool (GREAT)26 and gene ontology (GO) analysis. Pathways related to cytokine and chemokine receptor activity, S1P signaling and lymphocyte trafficking were highly enriched after combination therapy (Supplementary Data 1, 2). Examples of several immunologically relevant genes that are more open in virus-specific CD8+ T cells after PD-1 + IL-2 combination therapy compared to PD-1 therapy are shown in Fig. 4b and Extended Data Fig. 6a. Genes involved in chemokine and cytokine responses, effector functions, and transcription factors like Tcf7, Lef1, Klf2, Tbx21 were more accessible after combination therapy whereas genes for inhibitory receptors and Tox, an important regulator of T-cell exhaustion15,27–29, were more open after PD-1 monotherapy (Fig. 4b, Extended Data Fig. 6a, b).
Fig. 4. Epigenetic signatures of LCMV-specific CD8+ T cells generated by IL-2 or PD-1 + IL-2 combination therapy are distinct from that by PD-1 monotherapy during chronic infection.

a, MA plots for differentially accessible regions (DARs) in LCMV-specific DbGP33+ CD8+ T cells examined by ATAC-seq after PD-1, IL-2 and PD-1 + IL-2 combination therapy. Down, downregulated (closed); up, upregulated (open). b, Gene annotations of differentially accessible distal regulatory regions in DbGP33+ CD8+ T cells of mice treated with anti-PD-L1 and PD-1 + IL-2 combination therapy. The number of differentially open gene regulatory regions for genes of functional importance in DbGP33+ CD8+ T cells after PD-1 monotherapy vs. PD-1 + IL-2 combination therapy is shown. c, PCA plot of ATAC-seq analysis for naive CD8+ T cells and the various LCMV-specific CD8+ T-cell subsets generated during acute and chronic infection, and the DbGP33+ CD8+ T cells generated after PD-1 monotherapy, IL-2 treatment or the combination therapy. The results were pooled from three experiments of ATAC-seq experiments with n = 12–18 for untreated mice or n = 1–3 for treatment samples per group in each experiment. The ATAC-seq data for naive, acute (memory precursor (MP), terminal effector (TE), and memory), and chronic (stem-like and exhausted) was from our previous study30.
We next compared the epigenetic signatures of the virus-specific CD8+ T cells from these various treated samples with the epigenetic signatures of the CD8+ Teff cell subsets, MP and terminal effector (TE), and Tmem cells from acute infection30. PCA analysis of the 5,000 most variable sites showed that the epigenetic signatures of LCMV-specific CD8+ T cells after PD-1 + IL-2 combination therapy or IL-2 were more similar to CD8+ Teff and Tmem cells after acute infection compared to virus-specific CD8+ T cells after PD-1 monotherapy or from untreated chronically infected mice (Fig. 4c). K-means clustering of the sites that changed with treatment revealed that ten clusters were formed, as shown in the heat plot for all of the different CD8+ T-cell subsets (Extended Data Fig. 6c). Clusters showing patterns resembling acute infection by sites opening in IL-2 or the combination treatment groups (clusters 2–4) had increased accessibility to transcription factors of zinc-finger, runt and T-box families, whereas sites closing (clusters 5–7) after IL-2 or combination therapy showed enrichment for transcription factors of bZIP, RHD (NFAT) and NR (Nur77) families (Extended Data Fig. 6c, Supplementary Data 3). Of particular interest is the closing of RHD sites after IL-2 treatment or PD-1 + IL-2 combination therapy because NFAT has been implicated in inducing exhaustion and the upregulation of Tox expression15,27–29. Accordingly, multiple regulatory regions of the Tox gene were highly accessible in untreated cells or cells treated with PD-1, but no longer accessible in IL-2 or the combination therapy samples. Taken together, these results demonstrate that the epigenetic program of virus-specific CD8+ T cells during chronic infection can be modified by PD-1 + IL-2 combination therapy resulting in cells that resemble more functional CD8+ Teff and Tmem cells generated after acute viral infection. This epigenetic modification most likely represents the generation of new CD8+ Teff cells from the TCF-1+ stem-like CD8+ T cells after combination therapy as opposed to re-programming of exhausted CD8+ T cells.
PD-1 blockade at target site is crucial for viral reduction
One critical question is why does IL-2 monotherapy have minimal effect in reducing the viral load during chronic LCMV infection despite expanding the virus-specific CD8+ T cells and bringing about qualitative changes in the CD8+ T cells similar to what was seen after PD-1 + IL-2 combination therapy. Our previous studies had shown that expression of PD-L1 on LCMV- infected cells may inhibit the CD8+ Teff cells from eliminating the infected cell31. Other studies using tumor models have also made similar observations32,33. Thus, we hypothesized that, after IL-2 monotherapy, viral control was compromised despite the increased numbers of CD8+ T cells because of PD-L1 expression at the target site. To test this hypothesis, we designed a treatment regimen in which LCMV chronically infected mice were treated with IL-2 first for 10 days to expand the LCMV-specific CD8+ T cells and then PD-1 blockade was done for just three days starting at day 10. The control group of chronically infected mice received IL-2 only from day 0–13 (Extended Data Fig. 7a). These two groups of mice were then analyzed on day 14 for LCMV-specific CD8+ T cell responses and viral control. There were no differences in the numbers of LCMV-specific CD8+ T cells in the spleen, liver and lung of the two groups of mice (Extended Data Fig. 7b). This was the expected result since most of the expansion of CD8+ T cells would have already occurred during the first 10 days and this would have been driven by IL-2 therapy alone. The key question now was whether PD-1 blockade at the tail-end of IL-2 therapy would result in any viral control. This was indeed the case. Chronically infected mice treated with anti-PD-L1 antibody from day 10–13 had significantly lower levels of virus in all three tissues (spleen, liver and lung) examined compared to mice that received IL-2 only (Extended Data Fig. 7c). This is clearly consistent with PD-1 blockade at the target site enhancing viral control. To further expand upon this we examined if there were any pathological changes in the liver after anti-PD-L1 treatment. We found that chronically infected mice that received the late PD-1 blockade had significantly increased levels of liver enzyme in the serum and showed higher pathology score and increased number of TUNEL positive cells in the liver compared to the IL-2 only group (Extended Data Fig. 7d–f). Taken together, these results highlight the importance of blocking the PD-1/PD-L1 inhibitory pathway at the target site for effective viral control.
PD-1 + IL-2 improves the CD8+ Teff /CD4+ Treg cell ratio
Treatment of LCMV chronically infected mice with IL-2 alone or PD-1 + IL-2 combination therapy increases the number of Foxp3+ CD4+ regulatory T (Treg) cells. However, the increase in LCMV-specific CD8+ T cells is tenfold higher after PD-1 + IL-2 combination therapy resulting in strikingly different ratios of LCMV-specific CD8+ T cells to CD4+ Treg cells after IL-2 monotherapy versus PD-1 + IL-2 combination therapy. This favorable CD8+ Teff cell/CD4+ Treg ratio after PD-1 + IL-2 combination therapy could also contribute to better viral control (Extended Data Fig. 8a–d) and has implications for cancer immunotherapy where CD4+ Treg cells are known to play an important role34.
CD25 is important for synergy between IL-2 and PD-1
The striking synergy between PD-1 blockade and IL-2 during chronic LCMV infection was achieved using the natural IL-2 cytokine (IL-2(WT)). Many of the ongoing human clinical trials combining PD-1 blockade with IL-2 to treat cancer patients are using genetically engineered or modified forms of IL-2 that do not bind CD252,3. So, it was of interest to determine whether CD25 engagement plays a role in the synergistic effects we have seen in the LCMV model.
We first examined how CD25 expression changes after the various treatments and which chronic CD8+ T-cell subsets express CD25. To address this, we sorted the PD-1+ stem-like CD8+ T cells and the more differentiated CD8+ T cells from chronically infected mice, and transferred them into infection matched congenically distinct mice so we could track the donor CD8+ T cells. Groups of these chronically infected mice were either left untreated, or given PD-1 blockade alone, or IL-2 alone, or the combination therapy. Note that neither the stem-like CD8+ T-cell population nor the terminally differentiated CD8+ T cells expressed any detectable levels of CD25 at the time of transfer. However, after the adoptive transfer the stem-like CD8+ T cells that received IL-2 alone or PD-1 + IL-2 combination therapy underwent expansion and also expressed CD25. Interestingly, PD-1 blockade alone resulted in increased proliferation and differentiation of the stem-like CD8+ T cells but there was minimal to no CD25 detectable on this expanded population. The more terminally differentiated (exhausted) CD8+ T cells did not expand in response to any of the treatments and did not upregulate CD25 expression (Extended Data Fig. 9a–d). These results show that the expanded population of CD25+ CD8+ T cells is derived from the PD-1+TCF-1+ stem-like CD8+ T cells and that CD25 upregulation is selectively seen only after IL-2 treatment or PD-1 + IL-2 combination therapy.
Having established the origin of the CD25+ CD8+ T cells in the above experiment, we then examined in more detail the kinetics of CD25 expression on LCMV-specific CD8+ T cells in chronically infected mice after PD-1 blockade, IL-2 treatment, or combination therapy. A small percentage (mean, 15%) of LCMV-specific CD8+ T cells started expressing CD25 at day 3 after combination therapy and by day 6 post-treatment the majority (mean, 64%) of tetramer-positive CD8+ T cells were proliferating and expressing CD25. A similar trend but with slightly lower numbers (mean, 35 %) was seen in mice that received IL-2 treatment only. In contrast, PD-1 blockade alone increased the number of proliferating virus-specific CD8+ T cells at day 6 but these cells did not express detectable levels of CD25 (Extended Data Fig. 9e–i). We also examined expression of CD122 and CD132, the beta and gamma chains of the IL-2 receptor. Minimal changes were seen in expression of CD122 or CD132 after PD-1 monotherapy but there were significant increases in the expression of both CD122 and CD132 after IL-2 alone and especially after the combination therapy (Extended Data Fig. 9j–o). Thus, PD-1 + IL-2 combination therapy resulted in the upregulation of all three chains (CD25, CD122, CD132) to form the high affinity trimeric IL-2 receptor on the proliferating and differentiating LCMV-specific CD8+ T cells35.
The key question was to determine if CD25 engagement by IL-2 was essential for the observed synergy between PD-1 blockade and IL-2 during chronic LCMV infection. To address this question a blocking and non-depleting anti-CD25 antibody36 was administered during the combination therapy to block the interaction between IL-2 and CD25 (Fig. 5a). Treatment with this anti-CD25 antibody almost completely abrogated the synergy between IL-2 and PD-1 therapy. The increased expansion of LCMV DbGP33-specific CD8+ T cells was not observed, the increased poly-functionality of the virus-specific CD8+ T cells was reduced, and the phenotypic changes associated with the generation of acute infection–like effector CD8+ T cells were no longer seen. Consequently, the superior viral control by PD-1 + IL-2 combination therapy over PD-1 monotherapy was lost when the interaction between CD25 and IL-2 was prevented (Fig. 5b–e). These findings show that CD25 engagement is critical for optimal synergistic effect of PD-1 + IL-2 combination therapy.
Fig. 5. CD25 blockade abrogates the synergy between IL-2 and PD-1 blockade.
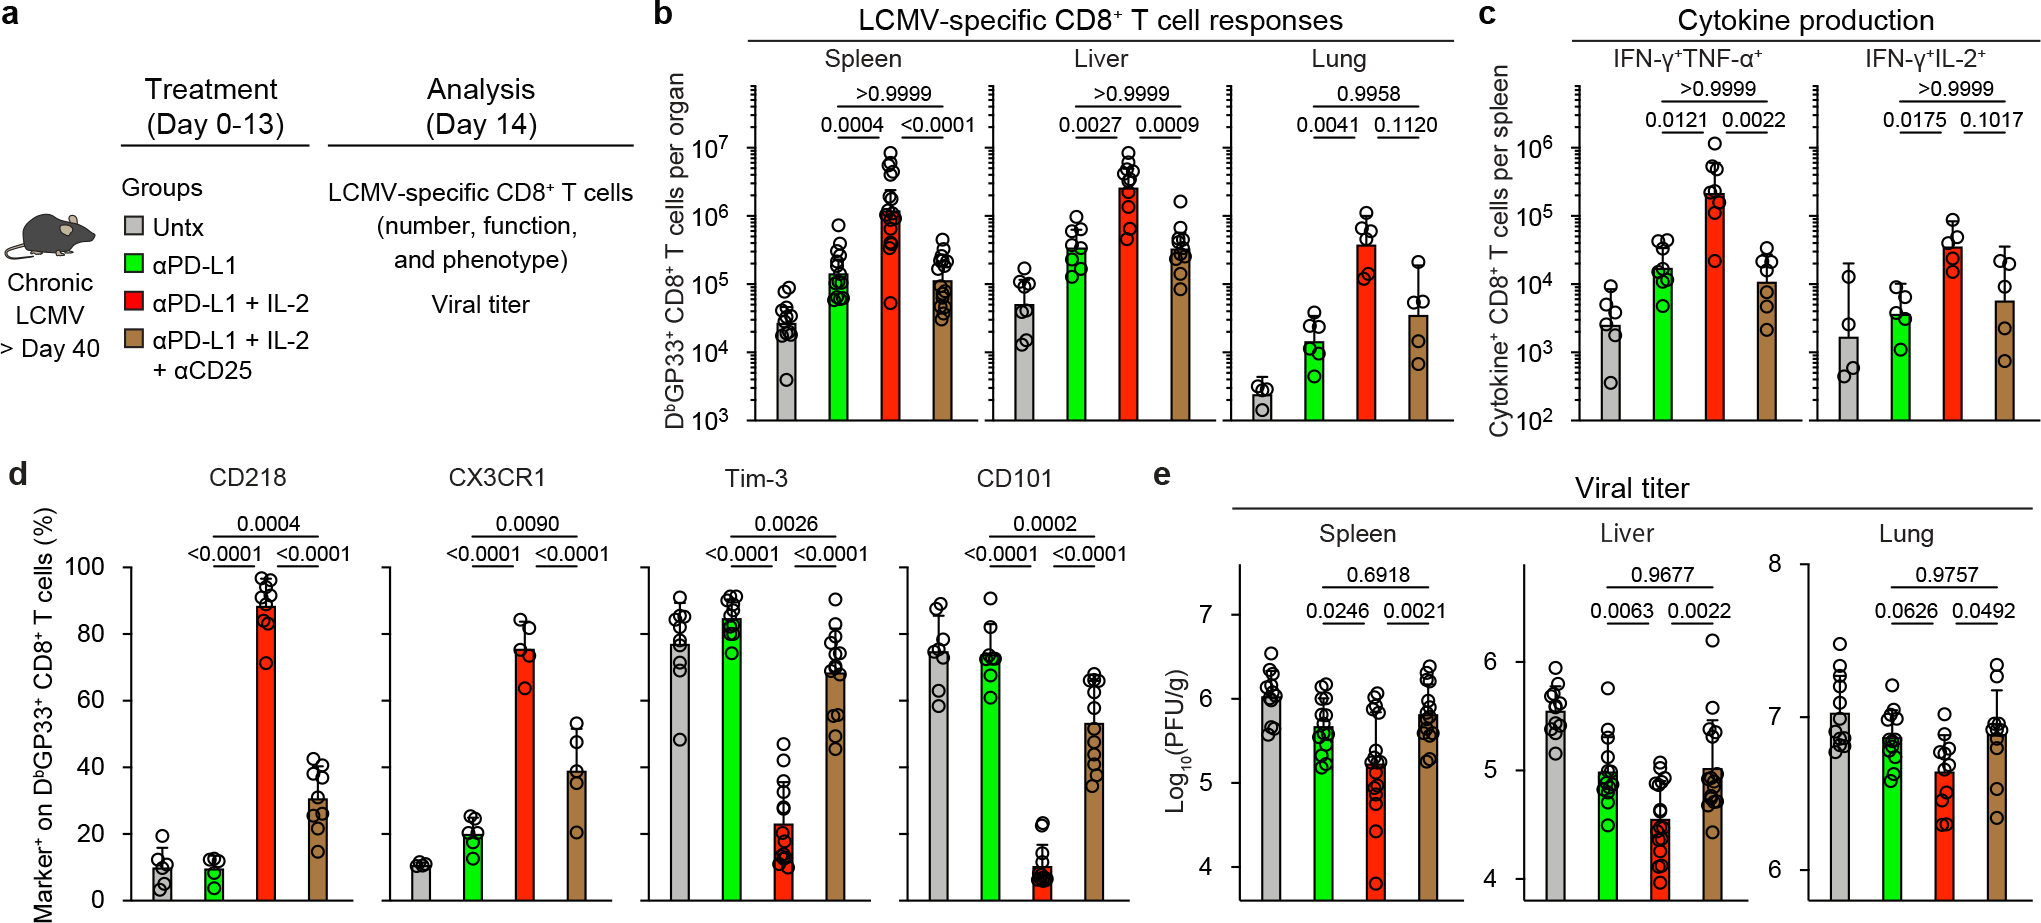
a, Chronically infected mice were left untreated, or were treated with anti-PD-L1 antibodies, or combination therapy with anti-PD-L1 plus IL-2 for two weeks. One additional group was given the combination therapy plus a blocking anti-CD25 (PC61-N297Q) antibody for 2 weeks. The LCMV-specific CD8+ T-cell response and viral titre were analyzed on day 14. The colour key in a applies to b–e. b, LCMV-specific CD8+ T cell responses. The numbers of DbGP33+ CD8+ T cells in the indicated tissues for all four groups of mice are shown. c, The numbers of IFNγ+, IFNγ+TNFα+, and IFNγ+IL-2+ CD8+ T cells in the different groups of mice. Spleen cells were stimulated with pools of LCMV-specific peptides for 5 h and analyzed by intracellular cytokine staining. d, The phenotype of DbGP33+ CD8+ T cells from the indicated treatment group. e, Viral titre in the indicated tissues in the four groups of mice. The results were pooled from 2–6 experiments with at least 4 mice per group. Data are geometric mean ± 95% CI (b and c) or mean ± s.d. (d and e). P values are shown; statistical comparisons were performed using Kruskal-Wallis test with Dunn’s multiple comparison test (b and c) or one-way ANOVA with Tukey’s multiple comparison test (d and e).
PD-1 combination therapy with IL-2(WT) versus IL-2(V)
Another approach to the above question is to use a mutated version of IL-2 (IL-2(V)) that does not bind to CD25 and examine how this IL-2(V) compares with the natural IL-2 cytokine (IL-2(WT)) in combination therapy with PD-1 blockade in LCMV chronically infected mice. The IL-2(V) that we used in these studies was genetically modified to prevent binding to CD25 without affecting IL-2 structure or the interaction with IL-2Rβγ37. The experimental set-up comparing PD-1 combination therapy with IL-2(WT) or IL-2(V) is shown in Fig. 6a. Similar to our results with the CD25 blockade experiments, we found that IL-2(V) combination therapy did not result in significantly increasing the numbers of LCMV-specific CD8+ T cells compared to PD-1 monotherapy in multiple tissues. This was in contrast to the highly significant increases seen in virus-specific CD8+ T cells after PD-1 combination therapy with IL-2(WT) (Fig. 6b, Extended Data Fig. 10a, b). We also compared the transcriptional profile of LCMV-specific CD8+ T cells isolated from mice given combination therapy with IL-2(V) versus IL-2(WT). The results were quite striking; the distinct gene signature seen after combination therapy with IL-2(WT) was lost with IL-2(V). IL-2(V) combination therapy also did not induce the key qualitative changes in LCMV-specific CD8+ T cells based on expression of phenotypic markers and their ability to make various cytokines compared to PD-1 combination therapy with IL-2(WT). Most importantly, no improved viral control over PD-1 therapy was seen after IL-2(V) combination therapy (Fig. 6c–f, Extended Data Fig. 10c, d). Thus, taken together the experiments with CD25 blockade and comparing IL-2(V) versus IL-2(WT) clearly show that CD25 engagement plays a major and essential role in the synergistic effects of IL-2 in combination therapy with PD-1 blockade.
Fig. 6. CD25 engagement by therapeutic IL-2 is crucial for the efficacy of PD-1 + IL-2 combination therapy.
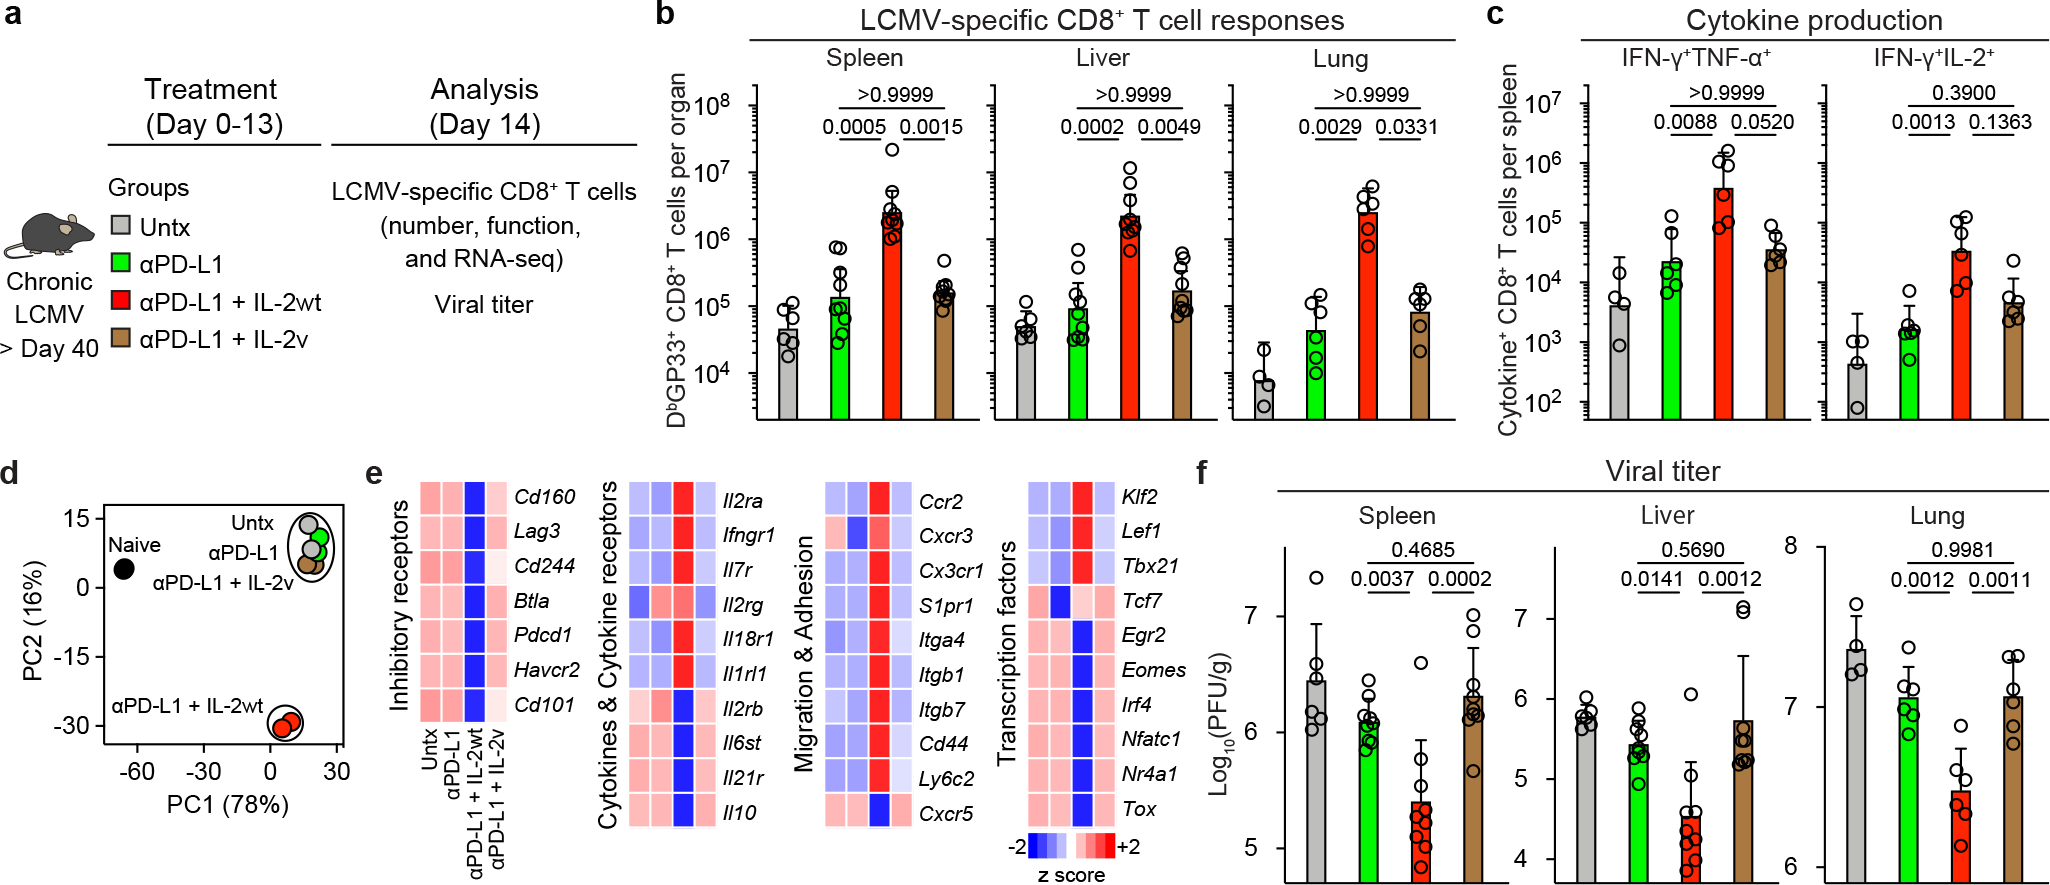
a, LCMV chronically infected mice (> 40 days after infection) were left untreated, or were treated with anti-PD-L1 antibodies, anti-PD-L1 plus IL-2 (WT), or anti-PD-L1 plus IL-2(V) (modified IL-2 with abolished CD25 binding) for 2 weeks. The colour key in a applies to b–d and f. b, LCMV-specific CD8+ T cell responses. The numbers of LCMV-specific DbGP33+ CD8+ T cells in the indicated tissues after the various treatments are shown. c, The numbers of IFNγ+TNFα+ and IFNγ+IL-2+ LCMV-specific CD8+ T cells in the four groups. Spleen cells were stimulated with pools of LCMV-specific peptides for 5 h and analyzed by intracellular cytokine staining. d, e, LCMV-specific DbGP33+ CD8+ T cells were sorted from spleens of LCMV chronically infected mice after various treatments and analyzed using RNA-seq. Naive CD44low CD8+ T cells from uninfected mice are also included in the analysis. d, PCA plot for naive (CD44low) and DbGP33+ CD8+ T cells generated by the different treatments. e, The mean relative expression of key specific genes in DbGP33+ CD8+ T cells generated after the various treatments. f, The viral titre in the indicated tissues in the four groups of mice. The results were pooled from 2–3 experiments with 2–3 mice per group in each experiment. Data are geometric mean ± 95% CI (b and c) or mean ± s.d. (f). P values are shown; statistical comparisons were performed using Kruskal-Wallis test with Dunn’s multiple comparison test (b and c) or one-way ANOVA with Tukey’s multiple comparison test (f).
Note that IL-2(V) was biologically active in vivo in expanding CD8+ T cells but did not target the right CD8+ T-cell population. There were significant increases in the number of CD8+ T cells after PD-1 combination therapy with IL-2(V) but this was predominantly due to the expansion of PD-1 negative CD8+ T cells and there was no increase in the number of PD-1+ CD8+ T cells above what was seen with PD-1 blockade alone. In contrast, PD-1 combination therapy with IL-2(WT) resulted in the selective expansion of PD-1 positive CD8+ T cells – this is where all the LCMV-specific CD8+ T cells are found (Extended Data Fig. 11a–g). The most likely explanation for these results is that since the vast majority of CD8+ T cells in these mice are not virus-specific and all of these CD8+ T cells express the beta (CD122) and gamma (CD132) chains of the IL-2 receptor the IL-2(V) cytokine is being soaked up by this large population of non-virus-specific CD8+ T cells whereas the high affinity trimeric IL-2 receptor (CD25/CD122/CD132) that is expressed on the virus-specific CD8+ T cells would selectively capture the IL-2(WT) cytokine35,38. The major upregulation of CD25 in particular and also CD122 and CD132 on LCMV specific CD8+ T cells is seen only after IL-2(WT) therapy. IL-2(V) treatment results in a slight increase of CD122 expression but does not change CD25 and CD132 expression (Extended Data Fig. 12a–f). Thus, the IL-2(V) is being diluted out while the IL-2(WT) is being selectively captured by the PD-1+ virus-specific CD8+ T cells. If appropriate targeting strategies are used with IL-2(V) then this could be an effective and safe approach for immunotherapy. The accompanying paper by Codarri-Deak et al. addresses this issue39.
All the results we have shown so far have used the stringent LCMV clone 13 model of life-long chronic infection in the absence of LCMV-specific CD4+ T cells. So, we next compared the effects of PD-1 + IL-2(WT) versus PD-1 + IL-2(V) combination therapy in LCMV chronically infected mice containing virus-specific CD4+ T cells. The results of these experiments are shown in Extended Data Fig. 13. We found that the synergistic increase of LCMV-specific CD8+ T cells was only seen in mice that received PD-1 combination therapy with IL-2(WT) cytokine. There was minimal to no synergy between IL-2(V) cytokine and PD-1 blockade. In addition, the phenotypic and functional changes in LCMV-specific CD8+ T cells that reflect better effector function and decreased exhaustion were seen in mice treated with anti-PD-L1 and IL-2(WT) and not in combination with IL-2(V). Consistent with these quantitative and qualitative changes in LCMV-specific CD8+ T cells the most effective viral control was seen in mice that received PD-1 + IL-2(WT) combination therapy (Extended Data Fig. 13b–e). This model of LCMV chronic infection with CD4+ T-cell help also allowed us to examine the effect of PD-1 + IL-2 combination therapy on LCMV-specific CD4+ T cells. A significant increase in LCMV-specific CD4+ T cells with T helper type 1 (Th1) phenotype was only seen in mice receiving PD-1 blockade plus IL-2(WT) cytokine (Extended Data Fig. 13f). Thus, in both CD4+ T-cell helped and unhelped models of LCMV chronic infection, combination therapy with PD-1 + IL-2(WT) is superior to PD-1 + IL-2(V).
Discussion
Here we examined how IL-2 synergizes with PD-1 directed immunotherapy during chronic LCMV infection. Our paper makes the following points: first, we showed that the more effective viral control seen after PD-1 + IL-2 combination therapy compared to PD-1 monotherapy is mediated by the CD8+ T-cell response. We then identified the virus-specific CD8+ T cells that proliferate and respond to the combination therapy and show that these are the same lymphoid resident PD-1+TCF-1+ resource CD8+ T cells that also respond to PD-1 blockade. However, the combination therapy dramatically changes the differentiation program of these stem-like CD8+ T cells and results in the generation of transcriptionally and epigenetically distinct CD8+ Teff cells that resemble highly functional CD8+ Teff cells seen after an acute viral infection. It is important to note that this striking modification of the CD8+ T-cell exhaustion program after PD-1 + IL-2 combination therapy is primarily due to IL-2 signals changing the CD8+ Teff cell differentiation program from the PD-1+TCF-1+ stem-like CD8+ T cells as opposed to re-programming of terminally differentiated exhausted CD8+ T cells. This is also consistent with our finding that the terminally differentiated CD8+ T cells did not expand after IL-2 alone or PD-1 + IL-2 combination therapy (Fig. 1, Extended Data Fig. 2). This ability to modify the differentiation program and generate better CD8+ Teff cells could be the underlying mechanism for the striking synergy seen between IL-2 therapy and PD-1 blockade. We also highlight the importance of blocking the PD-1/PD-L1 inhibitory pathway at the target site for effective viral control31. Expanding the CD8+ T cell population and generating better effector cells is important but it is also critical to block PD-1 inhibitory signals at the target site for optimal immunotherapy. Finally, we show that CD25 engagement with IL-2 plays an important and essential role in the observed synergy between IL-2 cytokine and PD-1 blockade. Either blocking CD25 with an antibody or using a mutated version of IL-2 that does not bind to CD25 (but still binds to CD122/CD132) almost completely abrogated the synergistic effects seen after PD-1 + IL-2 combination therapy. There is currently considerable interest in using PD-1 + IL-2 combination therapy in cancer patients. Several clinical trials are ongoing and many of these trials are using modified or genetically engineered forms of IL-2 that do not bind CD252,3. The recent clinical trial using anti-PD-1 antibody in combination with pegylated IL-2 with decreased CD25 binding has shown disappointing results40. Our studies in the chronic LCMV model have allowed us to dissect the underlying mechanisms of how IL-2 therapy synergizes with PD-1 blockade. This information will be of value in providing guidelines for optimizing PD-1 + IL-2 therapy in human clinical trials for chronic viral infections and cancer.
Methods
Mice, virus, and infection
Six- to 8-week-old female C57BL/6J and CD45.1 congenic mice were purchased from the Jackson Laboratory. LCMV chronically infected mice were generated as follows; Mice were transiently depleted of CD4+ T cells by injecting 300 μg of rat anti-mouse CD4 antibody (GK1.5, BioXCell) intraperitoneally (i.p.) 2 days prior to infection and again on the day of infection, followed by infecting mice with 2 × 10⁶ plaque forming units (PFU) of LCMV clone 13 intravenously via tail vein. For examining therapeutic effects of PD-1 + IL-2 therapy on CD8+ T cells in the presence of LCMV-specific CD4+ T cells, mice were infected with LCMV clone 13 without transient CD4+ T-cell depletion. Titres of virus were determined by plaque assay on Vero E6 cells. Vero E6 cells were neither authenticated nor tested for mycoplasma contamination. No statistical methods were used to predetermine sample size. LCMV chronically infected mice were randomly assigned to experimental groups and investigators were not blinded to group allocation during experimental setup, data collection or analysis. All animal experiments were performed in accordance with National Institutes of Health and the Emory University Institutional Animal Care and Use Committee guidelines. Mice were housed under the following conditions: light cycle, 7:00 am ON and 7:00 pm OFF; temperature, between 68–72 degrees Fahrenheit; humidity, between 30–70 g m−3.
Lymphocyte isolation
Lymphocytes were isolated from the blood, spleen, liver, and lung as described previously41. Briefly, spleens were dissociated by passing them through a 70 μm cell strainer (Corning). Livers were perfused with pre-cold PBS and homogenized via mechanical disruption. Lungs were treated with 1.3 mM EDTA in HBSS for 30 min at 37 °C, shaking at 200 rpm, followed by treatment with 150 U ml−1 collagenase (Thermo Fisher Scientific) in RPMI 1640 medium containing 5 % FBS, 1 mM MgCl2, and 1mM CaCl2 for 60 min at 37 °C shaking at 200 rpm. Collagenase treated lung tissues were homogenized and filtered through a 70 μm cell strainer. Lymphocytes from livers and lungs were purified by a 44–67% Percoll gradient (800 g at 20 °C for 20 min).
Reagents, flow cytometry, and in vitro stimulations
All antibodies for flow cytometry were purchased from BD Biosciences, Biolegend, Thermo Fisher Scientific, Cell Signaling Technology, and R&D Systems, and used with the following dilution: anti-Bcl-6 PE, 1:20; anti-CD4 BUV496, 1:500; anti-CD4 BUV563, 1:500; anti-CD4 FITC, 1:500; anti-CD4 V500, 1:500; anti-CD4 BV605, 1:500; anti-CD4 PE-Cy7, 1:500; anti-CD4 APC-eFluor 780, 1:500; anti-CD8a BUV496, 1:100; anti-CD8a BUV563, 1:100; anti-CD8a BV421, 1:150; anti-CD8a BV605, 1:100; anti-CD8a PerCP, 1:100; anti-CD8a APC, 1:100; anti-CD8b.2 BV421, 1:200; anti-CD19 BUV563, 1:150; anti-CD19 BV510, 1:150; anti-CD19 BV605, 1:150; anti-CD19 PE-Cy7, 1:150; anti-CD19 APC-eFluor 780, 1:150; anti-CD25 BV421, 1:100; anti-CD25 PE, 1:100; anti-CD25 BB700, 1:100; anti-CD25 PE-Cy7, 1:100; anti-CD28 PE, 1:100; anti-CD29 eFluor 450, 1:100; anti-CD44 BUV805, 1:500; anti-CD44 FITC, 1:500; anti-CD44 Alexa Fluor 700, 1:100; anti-CD45.2 BV421, 1:100; anti-CD45.2 APC, 1:100; anti-CD49d PE, 1:100; anti-CD62L BV650, 1:100; anti-CD69 PE-Cy7, 1:100; anti-CD73 BV605, 1:100; anti-CD101 PE-Cy7, 1:100; anti-CD101 APC, 1:100; anti-CD107a Alexa Fluor 488, 1:200; anti-CD119 BV421, 1:100; anti-CD122 PE, 1:100; anti-CD127 PE, 1:100; anti-CD132 BV421, 1:100; anti-CD132 PE, 1:100; anti-CD160 BV421, 1:100; anti-CD218a PE, 1:100; anti-CD218a PerCP-eFluor 710, 1:100; anti-CD218a PE-Cy7, 1:100; anti-CD223 BV421, 1:100; anti-CD226 PE-Cy7, 1:100; anti-CXCR3 BV480, 1:100; anti-CXCR3 PE-Cy7, 1:100; anti-CXCR5 BV421, 1:50; anti-CXCR5 PE-Dazzle, 1:50; anti-CX3CR1 BV785, 1:500; anti-CX3CR1 PE, 1:500; anti-BTLA PE, 1:100; anti-Eomes PE-Cy7, 1:100; anti-Foxp3 PE-Cy7, 1:250; anti-granzyme A PE, 1:100; anti-granzyme B BV421, 1:20; anti-granzyme B PE, 1:20; anti-ICOS PE, 1:100; anti-IL-2 PE, 1:100; anti-IFNγ BV421, 1:100; anti-IFNγ BV480, 1:100; anti-IFNγ BV711, 1:100; anti-IFNγ APC, 1:100; anti-Ki-67 FITC, 1:20; anti-Ly-6C BV421, 1:500; anti-Ly-6C R718, 1:500; anti-PD-1 BV421, 1:100; anti-PD-1 BV605, 1:100; anti-PD-1 BV711, 1:100; anti-PD-1 PE, 1:100; anti-PD-1 APC, 1:100; anti-SLAMF6 BUV737, 1:100; anti-TCF-1 Alexa Fluor 488, 1:50; anti-TCF-1 PE, 1:100; anti-TIM3 BUV395, 1:100; anti-TIM3 Alexa Fluor 488, 1:20; anti-TIM3 PE, 1:20; anti-T-bet PE, 1:100; anti-TNF FITC, 1:100; anti-TNF PE, 1:100; anti-Tox PE, 1:100. DbGP33–41 and DbGP276–286 tetramers were prepared in house and were used to detect LCMV-specific CD8+ T cells (dilution, 1:100). Streptavidin-PE or streptavidin-APC was purchased from Thermo Fisher Scientific. Dead cells were excluded by using Live/Dead Fixable Near-IR (dilution, 1:250) or Yellow Dead Cell Stain Kit (dilution, 1:250) (Thermo Fisher Scientific). For cell surface staining, antibodies were added to cells at dilutions of 1:20–1:500 in PBS supplemented with 2% FBS and 0.1% sodium azide for 30 min on ice. Cells were washed 3 times, fixed with Fixation/Permeabilization solution (BD Biosciences). For detecting cytokine production, 1 × 10⁶ spleen cells were stimulated with pool of 9 LCMV-specific peptides (GP33-41, GP70-77, GP92-101, GP118-125, GP276-286, NP166-175, NP205-212, NP235-249, and NP396-404; 200 ng ml−1 each) in a 96-well round bottom plate for 5 h at 37 °C in a CO2 incubator in the presence of GolgiPlug (BD Biosciences). To detect degranulation, splenocytes were stimulated with pool of 9 LCMV-specific peptides for 5 h in the presence of GolgiPlug, GolgiStop (BD Biosciences), and anti-CD107a Alexa Fluor 488 (dilution, 1:200) (Thermo Fisher Scientific). For examining the responsiveness of LCMV-specific CD8+ T cells to inflammatory cytokines, 1 × 10⁶ splenocytes were cultured with recombinant mouse IL-12 and IL-18 (Both were from R&D systems, 20 ng ml−1 each) for 5 h, and GolgiPlug was added, followed by culturing for 1 hour. Intracellular staining was performed by using BD Cytofix/Cytoperm protocol. For detecting intranuclear proteins, Foxp3 staining buffer set (Thermo Fisher Scientific) was used according to manufacturer’s instructions. To detect LCMV-specific CD4+ T cells, splenocytes were stained with I-AbGP66-77 tetramer (DIYKGVYQFKSV; NIH Tetramer Core Facility, Emory University) at 37°C for 2 h (dilution, 1:200), followed by cell surface staining as described. Samples were acquired on Canto II, LSR II, or FACSymphony A3 (BD Biosciences), and data were analyzed by using FlowJo (ver. 9.9.6 or 10.8.1, BD Biosciences).
Chemotaxis assay
Chemokine dilutions of PBS with CXCL9 or CXCL10 (Both were from R&D Systems, 0.5 μg ml−1) were added to the bottom well of a 96-well transwell plate with a 5-μm pore (Corning). Sorted PD-1+ CD8+ T cells (2–3 ×10⁴ cells in 100 μl) from LCMV chronically infected mice treated for 2 weeks were added on the top of the membrane with duplicates and allowed to migrate at 37 °C for 3 h. Numbers of migrated cells to the bottom wells were counted by Canto II (BD Biosciences). Chemotactic index was calculated as the ratio of cell numbers in the bottom well in the presence versus in the absence of chemokines.
Cell sorting
Cell sorting was performed by FACS Aria II (BD Biosciences). For RNA-seq, scRNA-seq (10X Genomics), and ATAC-seq analysis, LCMV chronically infected mice (> day 40 post-infection) were untreated or treated with various therapeutic modalities for 2 weeks, and DbGP33+ CD8+ T cells in spleens were sorted from pooled spleens (n = 1–18). Before the sort, DbGP33+ CD8+ T cells were enriched by staining DbGP33-APC tetramer, labeling them with anti-APC MicroBeads (Miltenyi Biotec), followed by magnetic separation with LS column (Miltenyi Biotec). Naive (CD44low) CD8+ T cells were sorted from pooled spleens from uninfected mice (n = 2). For chemotaxis assay, mice chronically infected with LCMV were treated with PD-1 monotherapy, IL-2 alone, or combination therapy for 2 weeks. Cells were isolated from spleens of each treatment group (n = 1–8). CD8+ T cells were enriched by using CD8+ T cell isolation kit (Miltenyi Biotec), followed by magnetic separation with LS column (Miltenyi Biotec), and PD-1+ CD8+ T cells were sorted. For experiments of adoptive transfer of two CD8+ T-cell subsets, splenocytes were isolated from LCMV chronically infected mice (n = 20–53), and 5 × 10⁴ to 1 × 10⁵ of two (PD-1+CXCR5+TIM3− and PD-1+CXCR5−TIM3+) CD8+ T-cell subsets were sorted. The purities of the sorted cells were more than 95%.
PD-1 therapy, IL-2, and the combination therapy in vivo
PD-1 therapy, IL-2, and PD-1 + IL-2 combination therapy were performed as described previously1. For PD-1 monotherapy, 200 μg of rat anti-mouse PD-L1 antibody (10F.9G2, prepared in house) or rat IgG2b isotype control (LTF-2, BioXCell) was administered i.p. into LCMV chronically infected mice every 3 days for 2 weeks. For IL-2 therapy, 15,000 IU of recombinant human IL-2 (Amgen) diluted in PBS with 0.1% normal mouse serum was given i.p. twice daily for 2 weeks. For examining a requirement of PD-1 blockade for improving viral control during IL-2 therapy, 500 μg of rat anti-mouse PD-L1 antibody was administered at day 10 and 12 after starting IL-2 treatment.
PD-1 + IL-2(WT) or PD-1 + IL-2(V) combination therapy in vivo
For comparing IL-2(WT) and IL-2(V) combination therapies, recombinant human IL-2(WT) or IL-2(V), and anti-mouse PD-L1 antibody with DAPG mutation were produced and provided by Roche as previously described37. For PD-1 monotherapy, 200 μg of anti-mouse PD-L1 antibody (Roche) or mouse IgG1 isotype control (MOPC-21, BioXCell) was administered into LCMV chronically infected mice every 3 days for 2 weeks. For the combination therapy, IL-2(WT) or IL-2(V) therapy was combined with PD-1 therapy, where 1 μg of IL-2(WT) (Roche) or 10 μg of IL-2(V) (Roche) diluted in PBS with 0.1% normal mouse serum was given i.p. twice daily for 2 weeks. In chronic infection model with LCMV-specific CD4+ T cells, IL-2(WT) and IL-2(V) was given i.p. once daily from day 25 to day 33 after mice were infected with LCMV clone 13.
CD8+ T-cell depletion
For depleting CD8+ T cells during PD-1 + IL-2 combination therapy, 200 μg of rat anti-mouse CD8 antibody (2.43, BioXCell) or rat IgG2b isotype control (LTF-2, BioXCell) was administered i.p. into LCMV chronically infected mice every 3 days for 2 weeks.
CD25 blockade
For examining if CD25 engagement by IL-2 was essential for therapeutic efficacy of PD-1 + IL-2 combination therapy, 200 μg of rat-mouse chimeric antibody PC61-mIgG1 (N297Q) (Biogen)36 or mouse IgG1 isotype control (MOPC-21, BioXCell) was administered i.p. into LCMV chronically infected mice every 3 days for 2 weeks of PD-1 + IL-2 combination therapy.
Adoptive transfer of two CD8+ T-cell subsets
5 × 10⁴ to 1 × 10⁵ of two (PD-1+CXCR5+TIM3− and PD-1+CXCR5−TIM3+) CD8+ T-cell subsets isolated from LCMV chronically infected mice (CD45.2) were transferred into infection matched recipient mice (CD45.1). Groups of these mice were then either left untreated, given anti-PD-L1 antibody, IL-2 therapy, or the combination therapy for 2 weeks.
Histological assessment
Four to five-micron sections of formalin-fixed paraffin-embedded (FFPE) liver samples were stained with hematoxylin and eosin (H&E) or subjected to TUNEL analysis. The slides were scanned using the Leica Aperio GT 450 slide scanner and reviewed by a Gastrointestinal and Liver Pathologist. Portal inflammation was scored on a 4-point scale (0–3) as minimal to no inflammation (0), mild (1), moderate (2), and severe (3). Lobular inflammation was scored on a 4-point scale in two subcategories: immune cell clusters (0: none, 1: up to one per a one mm2 field, 2: up to 2, and 3: 3 or more clusters per a one mm2 field) and overall degree of lobular inflammation including sinusoidal infiltration of lymphocytes and degree of hepatocyte injury (0: no or rare lobular inflammation, 1: mild inflammation, 2: moderate, and 3: severe). The overall lobular inflammation was scored on a 7-point scale (0–6). The maximal number of acidophil bodies in a one mm2 area was quantified and scored on a 4-point scale (0–3) as follows: 0: no acidophil bodies, 1: one to two acidophil bodies, 2: three to four bodies, and 3: five or more acidophil bodies. For the TUNEL assay, 5 one mm2 (5 200x fields) hotspots of positive sinusoidal cell or hepatocyte staining per tissue were counted. The images were processed using QuPath42.
Measurement of serum ALT levels
Serum samples pooled from 2–3 mice were sent to Comparative Pathology Laboratory at University of Georgia and ALT levels were measured with a Roche Cobas c501 biochemical analyzer.
RNA-seq
For the comparison of untreated, PD-1 therapy, IL-2 treatment, and combination therapy, total RNA was isolated using the Direct-zol RNA Miniprep kit (Zymo Research), with on-column DNase digestion. RNA-seq libraries were prepared using 150 ng of total RNA and KAPA Stranded mRNA-seq Kit (Kapa Biosystems). Each library was indexed using barcoded primers (BIOO Scientific, Austin, TX) and was amplified for 10 cycles. Then, 200- to 350-bp fragments of barcoded PCR products were separated by 2% E-Gels (Thermo Fisher Scientific) and purified by Gel DNA Purification Kit (Zymo Research). Final PCR products were sequenced on an Illumina HiSeq 2500 platform. For comparing IL-2(WT) combination versus IL-2(V) combination therapy, total RNA from samples was isolated using Trizol (Thermo Fisher Scientific) and RNeasy Micro kit (Qiagen) according to the manufacture’s protocols at Emory Integrated Genomics Core. Preparation of a standard RNAseq library was performed at Hudson Alpha. Briefly, RNA amplification was performed using the Nugen Ovation RNAseq v2 kit. Amplified cDNA was normalized and sonicated on the Covaris LE200 using a protocol designed to achieve a target insert size of 350 bp. The samples were prepared using the KAPA Hyper Prep kit and GSL v5.8 indexes. Pooled libraries were sequenced on the Ilumina NovaSeq 6000 system with 100 bp paired-end reads.
Reads were mapped to the GRCm38/mm10 genome43 with HISAT2 version 2.1.044. Gene expression was quantified by featureCounts45. DESeq246 was used to normalized for library size and calculate differential expression across groups. A gene was considered differentially expressed across the treatment groups with an adjusted p value of < 0.05 with an average expression of > 20 normalized counts across all samples. Principal component analysis was performed on all detected genes using the regularized log transformation from DESeq2. GSEA47 was performed against canonical CD8+ T-cell gene sets, generated by using a previously published data (GSE9650 and PRJNA412602)16,17. The exhaustion signature was defined as genes that were at least 2-fold upregulated in DbGP33+ CD8+ T cells isolated from chronically mice infected with LCMV clone 13 compared to DbGP33+ CD8+ T cells isolated from mice 8 days after acute LCMV Armstrong infection. The effector signature was generated by taking the top 400 most upregulated genes between naive CD8+ T cells and DbGP33+ CD8+ T cells isolated from mice 8 days after acute LCMV Armstrong infection16. The memory signature was generated by upregulated genes between naive CD8+ T cells and LCMV-specific CD8+ T cells isolated from mice 48 days after acute LCMV Armstrong infection17. GSEA was performed using log2 fold change difference between classes. To determine the relative enrichment of these signatures in each treatment group, GSEA comparing the designated treatment regimen to the other 3 datasets was performed. RNA-seq data was visualized by using Microsoft Excel (version 14.4.3), Prism software (version 9.3.1, GraphPad), and ggplot2 R package48.
Single cell RNA-seq
Single cell RNAseq libraries were generated using the Chromium Single Cell 5’ Library & Gel Bead Kit (10x Genomics) according to the manufacturer’s protocol. In brief, DbGP33+ CD8+ T cells or naive CD44low CD8+ T cells were sorted and captured into the Gel Beads-in-emulsion (GEMs). After reverse transcription, the GEMs were disrupted and the barcoded cDNA was isolated, pooled, and amplified by PCR (13 cycles). The amplified cDNA was fragmented, and subjected to end repair and A-tailing followed by a sample index PCR (16 cycles). The purified libraries were sequenced to a depth of 50,000 reads per cell on a HiSeq3000 (Illumina) with 26 cycles for read 1, 8 cycles for index 1 (i7), and 91 cycles for read 2.
Alignment, filtering, barcode counting, and unique molecular identifier counting were performed using Cell Ranger v3.1. Data were further analyzed using Seurat v.3.049. Briefly, cells with a percentage of mitochondrial genes below 0.05% were included. Cells with more than 4,000 or less than 1,000 detected genes were considered as outliers and excluded from the downstream analyses. Raw unique molecular identifier counts were normalized to unique molecular identifier count per million total counts and log-transformed. Variable genes were selected based on average expression and dispersion. PCA was performed using variable genes. Clusters were identified using the shared nearest neighbor algorithm in Seurat and t-SNE plots were generated based on selected principal component analysis dimensions. Marker genes were identified by the Seurat function FindAllMarkers. Log normalized data are shown in the form of feature plots with the scale in a range of 0 (grey) to 2.5~5 (purple). Gene set scoring was performed using the VISION R package v.1.1.0. The scoring algorithm is described here50. Briefly, expression of signature genes is weighted based on predicted dropout probability calculated from nearest neighbors, and the normalized expression summed for all genes in the gene set. Gene sets used were same as in RNA-seq.
Analysis of multiparameter conventional flow cytometry
For examining phenotypes of LCMV-specific CD8+ T cells, conventional 19-colour flow cytometry data of DbGP33+ CD8+ T cells after different treatments were concatenated, and subjected to UMAP plugins (nearest neighbors = 15, minimum distance = −0.5, and number of components = 2)51 and FlowSOM clustering algorithm (number of meta clusters = 3)52 using parameters of TCF-1 Alexa Fluor 488, granzyme B BV421, TIM3 BUV395, CX3CR1 BV785, CD101 PE-Cy7, CD218a PE, CXCR5 PE-Dazzle, SLAMF6 BUV737, CD73 BV605, CXCR3 BV480, Ly-6C R700, and CD44 BUV805 in FlowJo ver. 10.8.1 (BD Biosciences).
To determine which CD8+ T cells in 3 clusters produced effector cytokines or degranulated after stimulation with LCMV-specific peptides, 14-colour flow cytometry data of PD-1+ CD8+ T cells were concatenated and used for the subsequent analysis as described above using parameters of TCF-1 Alexa Fluor 488 (or PE), granzyme B BV421, CX3CR1 BV785, CD101 APC, CD218a PerCP-eFluor710 (or PE), TIM3 BUV395, SLAMF6 BUV737, and CD44 BUV805. Distribution of IFNγ+, IFNγ+TNFα+. IFNγ+IL-2+, and IFNγ+CD107a+ cells were checked in the defined 3 clusters. TCF-1 was excluded from the staining panel when intracellular IL-2 staining was performed by BD Cytofix/Cytoperm protocol due to the incompatibility of PE anti-IL-2 (clone JES6-SH4, BD Biosciences) for Foxp3 staining buffer protocol.
For testing which CD8+ T cells in 3 clusters produced IFNγ in response to IL-12 + IL-18 stimulation, DbGP33+ CD8+ T cells from mice treated with various regimens were concatenated and subjected to the subsequent analysis as described above by using parameters of TCF-1 Alexa Fluor 488, granzyme B BV421, CX3CR1 BV785, CD101 PE-Cy7, CD218a PE, TIM3 BUV395, SLAMF6 BUV737, and CD44 BUV805. IFNγ+ cells were identified in the defined 3 clusters.
ATAC-seq
ATAC-seq analysis was performed as described elsewhere53. Briefly, 3–5 × 10⁴ sorted cells were washed with cold PBS, then with RSB buffer (10 mM Tris-HCL pH 7.4, 10 mM NaCl, 3 mM MgCl2), and lysed with lysis buffer (RSB buffer + 0.1% IGEPAL CA-630 + 0.1% Tween 20). Lysed nuclei were resuspended in the transposase reaction mix (25 μl 2 x TD buffer, 1 μl Illumina transposase, and 24 μl nuclease-free water) and incubated at 37 °C for 30 min. DNA from the transposase reaction was purified using MinElute PCR purification Kit (Qiagen). PCR amplification was performed by using Nextera PCR primers. The final libraries were quantified using a KAPA Library Quantification Kit and sequenced on an Illumina HiSeq 2500 by ELIM Biopharm. Reads were aligned to mm10 using bowtie2, discarding read pairs with mapping quality less than 20. Peaks were called separately for each sample using MACS2. A consensus peak set was derived by combining peaks from all samples and subsequently merging peaks that overlapped > 50%. Peaks that overlapped with regions identified in ENCODE blacklist54 were removed from the analysis. Peaks were visualized using IGV, with the y-axis set at the scale of reads per base pair normalized to the total number of reads assigned in consensus peaks for each sample. Gene and TSS annotations were based on the RefSeq database. The ability of the peaks to discriminate between subpopulations was assessed by selecting 5,000 peaks with the greatest overall variance following a variance stabilizing transformation. PCA was performed on the same data and a previously published data (PRJNA546023)30. To assess differential openness, we used conditional quantile normalization (CQN)55 followed by limma voom with quality weights56 on the matrix of insertions in peaks by sample. A linear model was fit to the data, and then contrasts for binary comparisons among the sample groups were sest up. Peaks were considered to be differentially open if the robust empirical Bayes p-value for a contrast from the fitted linear model was less than 0.05, after multiple hypothesis correction with the Benjamini-Hochberg procedure. To determine which regulatory elements contributed mostly towards alterations, each k-means cluster was examined for enrichment of transcription factor binding motifs using Homer57.
Statistical analysis
Prism software (version 9.3.1, GraphPad) was used for statistical analysis. The difference among the experimental groups was assessed by two-tailed unpaired t-test or two-tailed unpaired Mann-Whitney test for comparing 2 groups. One-way ANOVA with Tukey’s multiple comparison test or Kruskal-Wallis test with Dunn’s multiple comparison test was used for comparing more than 2 groups.
Extended Data
Extended Data Fig. 1. PD-1 + IL-2 combination therapy synergistically expands functional LCMV-specific CD8+ T cells that mediate viral control during chronic infection.
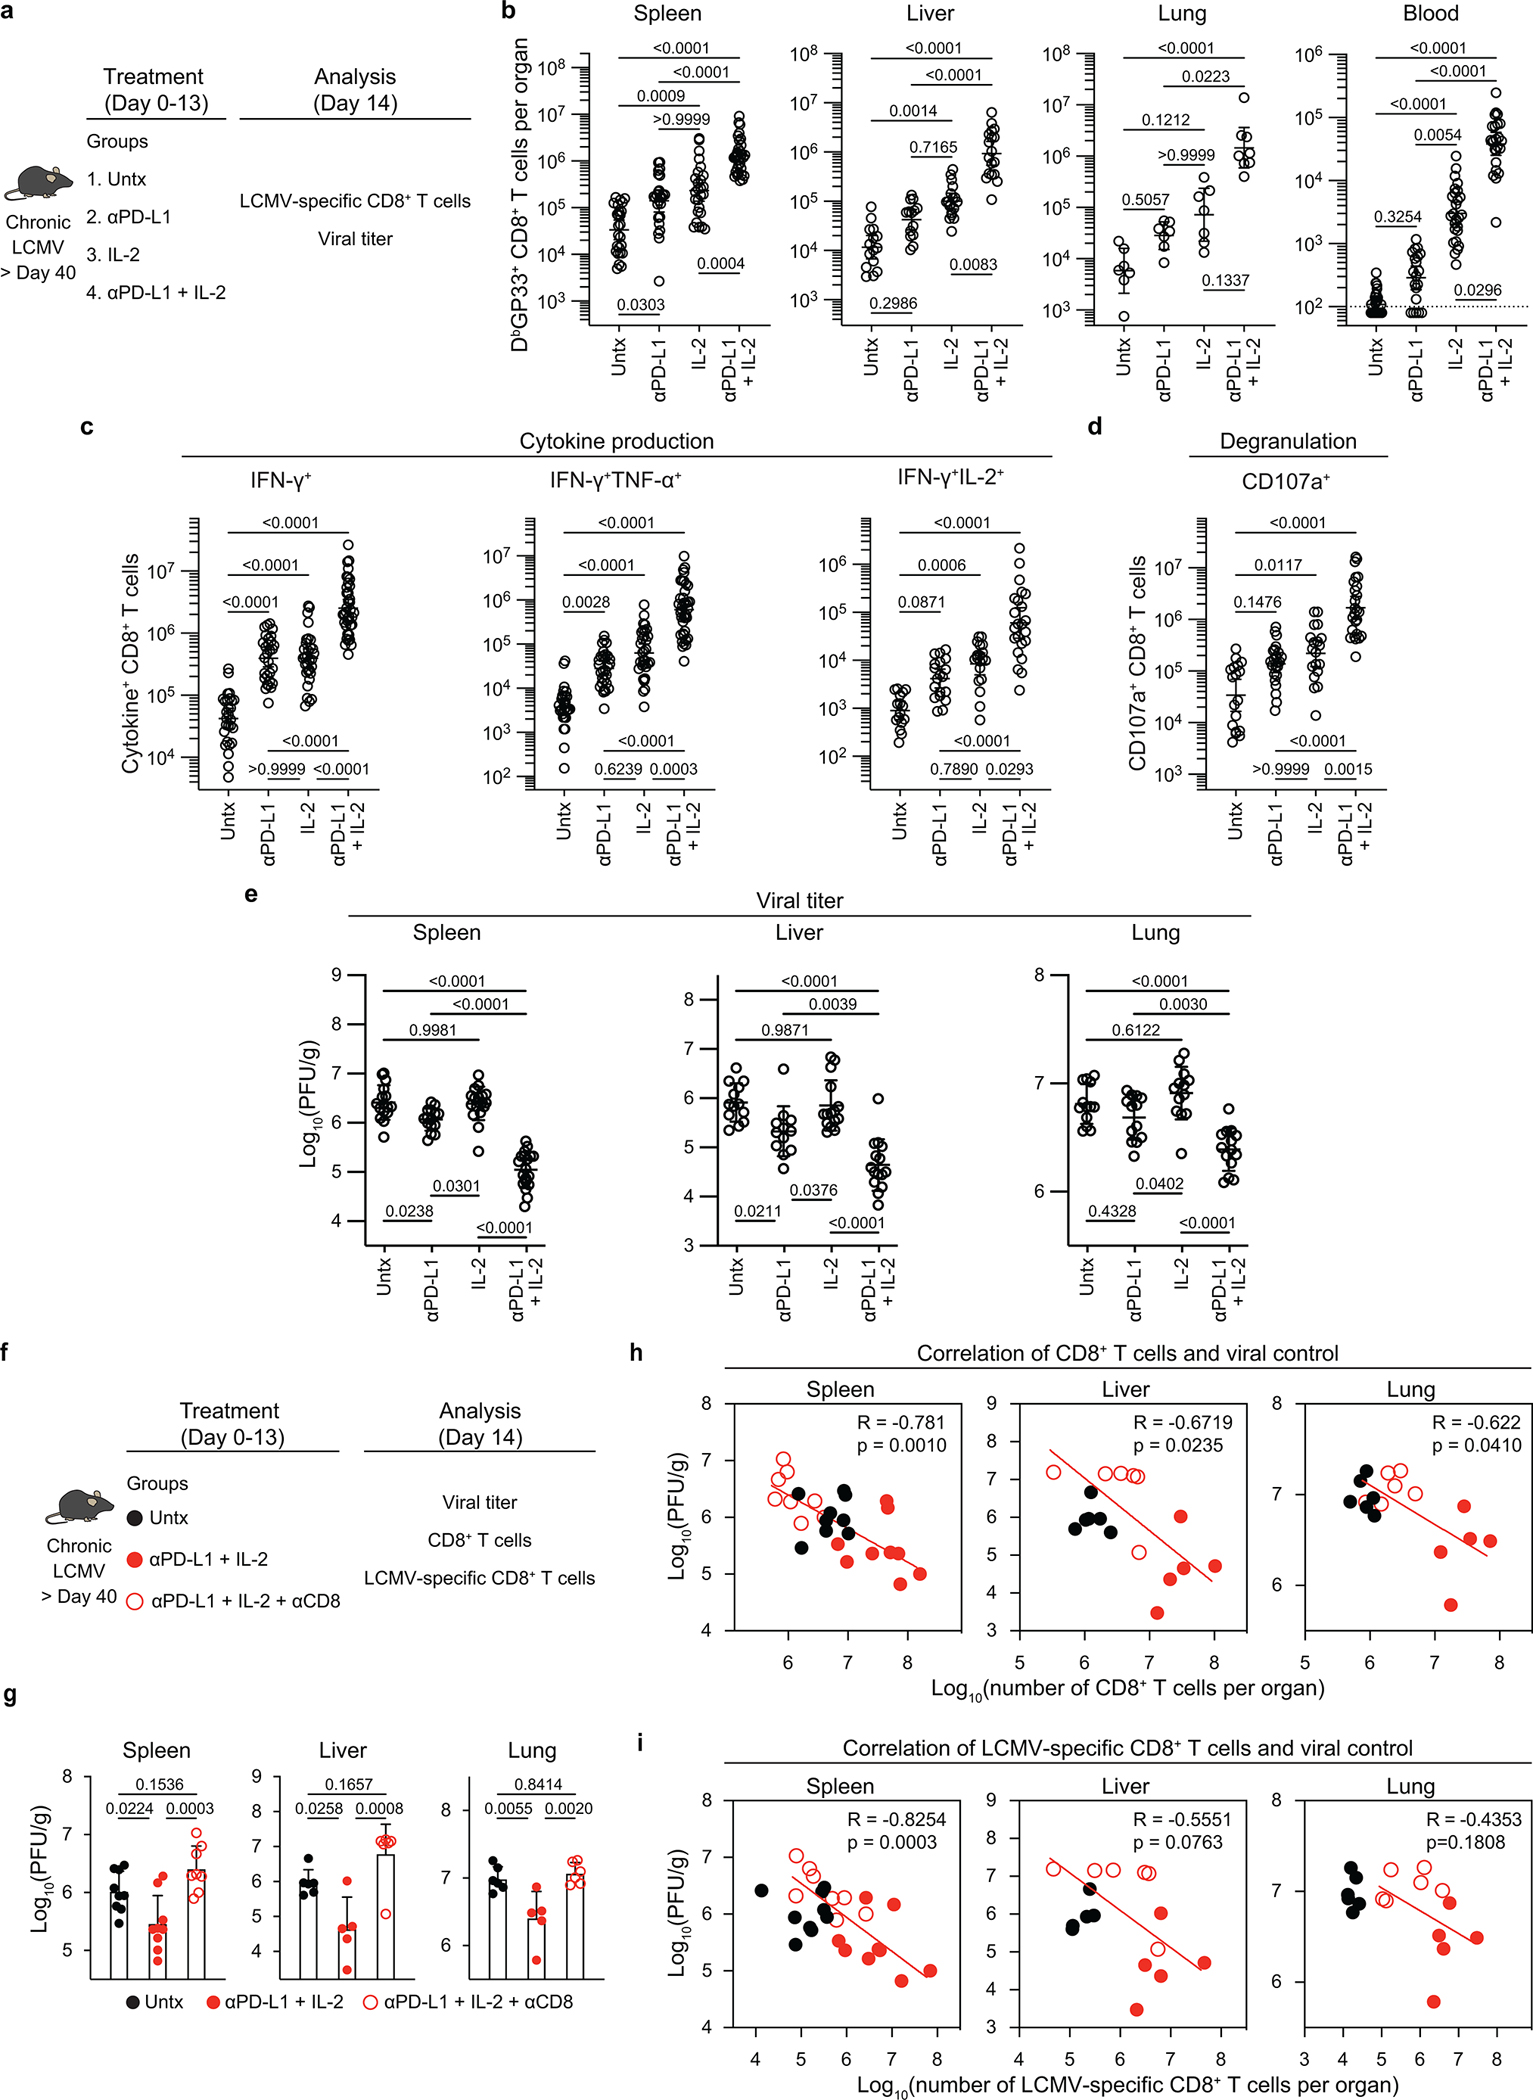
a, Experimental setup for panels b-e. Mice chronically infected with LCMV were either left untreated, or treated with anti-PD-L1 antibody alone (200 μg i.p., every 3 days), IL-2 therapy alone (15,000 IU i.p., twice daily), or the combination therapy for 2 weeks. b, Numbers of DbGP33+ CD8+ T cells in the indicated tissues and blood (per 1 × 10⁶ PBMCs). c, d, Spleen cells were stimulated with pools of LCMV-specific peptides for 5 h and analyzed by intracellular staining of cytokines (c) and degranulation (d). e, Viral titre in the indicated tissues. f, Experimental setup for panels g–i. LCMV chronically infected mice were either left untreated, or treated with combination therapy, or combination therapy plus anti-CD8 depleting antibody (200 μg i.p., every 3 days) for 2 weeks. g, Viral titre in the indicated tissues of the three groups of mice. h, i, Correlation between viral titre in the various tissues and the number of CD8+ T cells (h), or LCMV-specific (DbGP33+ and DbGP276+) CD8+ T cells (i). Results were pooled from 3–13 experiments (b–e) with n = 25–32 (spleen), n = 14–18 (liver), n = 7–8 (lung), and n = 20–33 (blood) (b), with n = 28–38 (IFNγ+), n = 28–38 (IFNγ+TNFα+), n = 16–23 (IFNγ+IL-2+), and n = 18–25 (CD107a+) (c), and with n = 16–19 (spleen), n = 12–15 (liver), and n = 13–14 (lung) (e) per group or pooled from 2–3 experiments with 2–4 mice per group in each experiment (g-i). Data are presented as geometric mean and 95% CI (b–d), mean and SD (e, g), or linear regression line and Pearson correlation coefficient (two-tailed) (h, i) with p values. Statistical comparisons were performed using Kruskal-Wallis test with Dunn’s multiple comparison test (b–d) or one-way ANOVA with Tukey’s multiple comparison test (e). Untx, untreated.
Extended Data Fig. 2. The proliferative response after PD-1 blockade, IL-2 therapy, and PD-1 + IL-2 combination therapy comes from the same population of PD-1+ TCF-1+ stem-like CD8+ T cells.
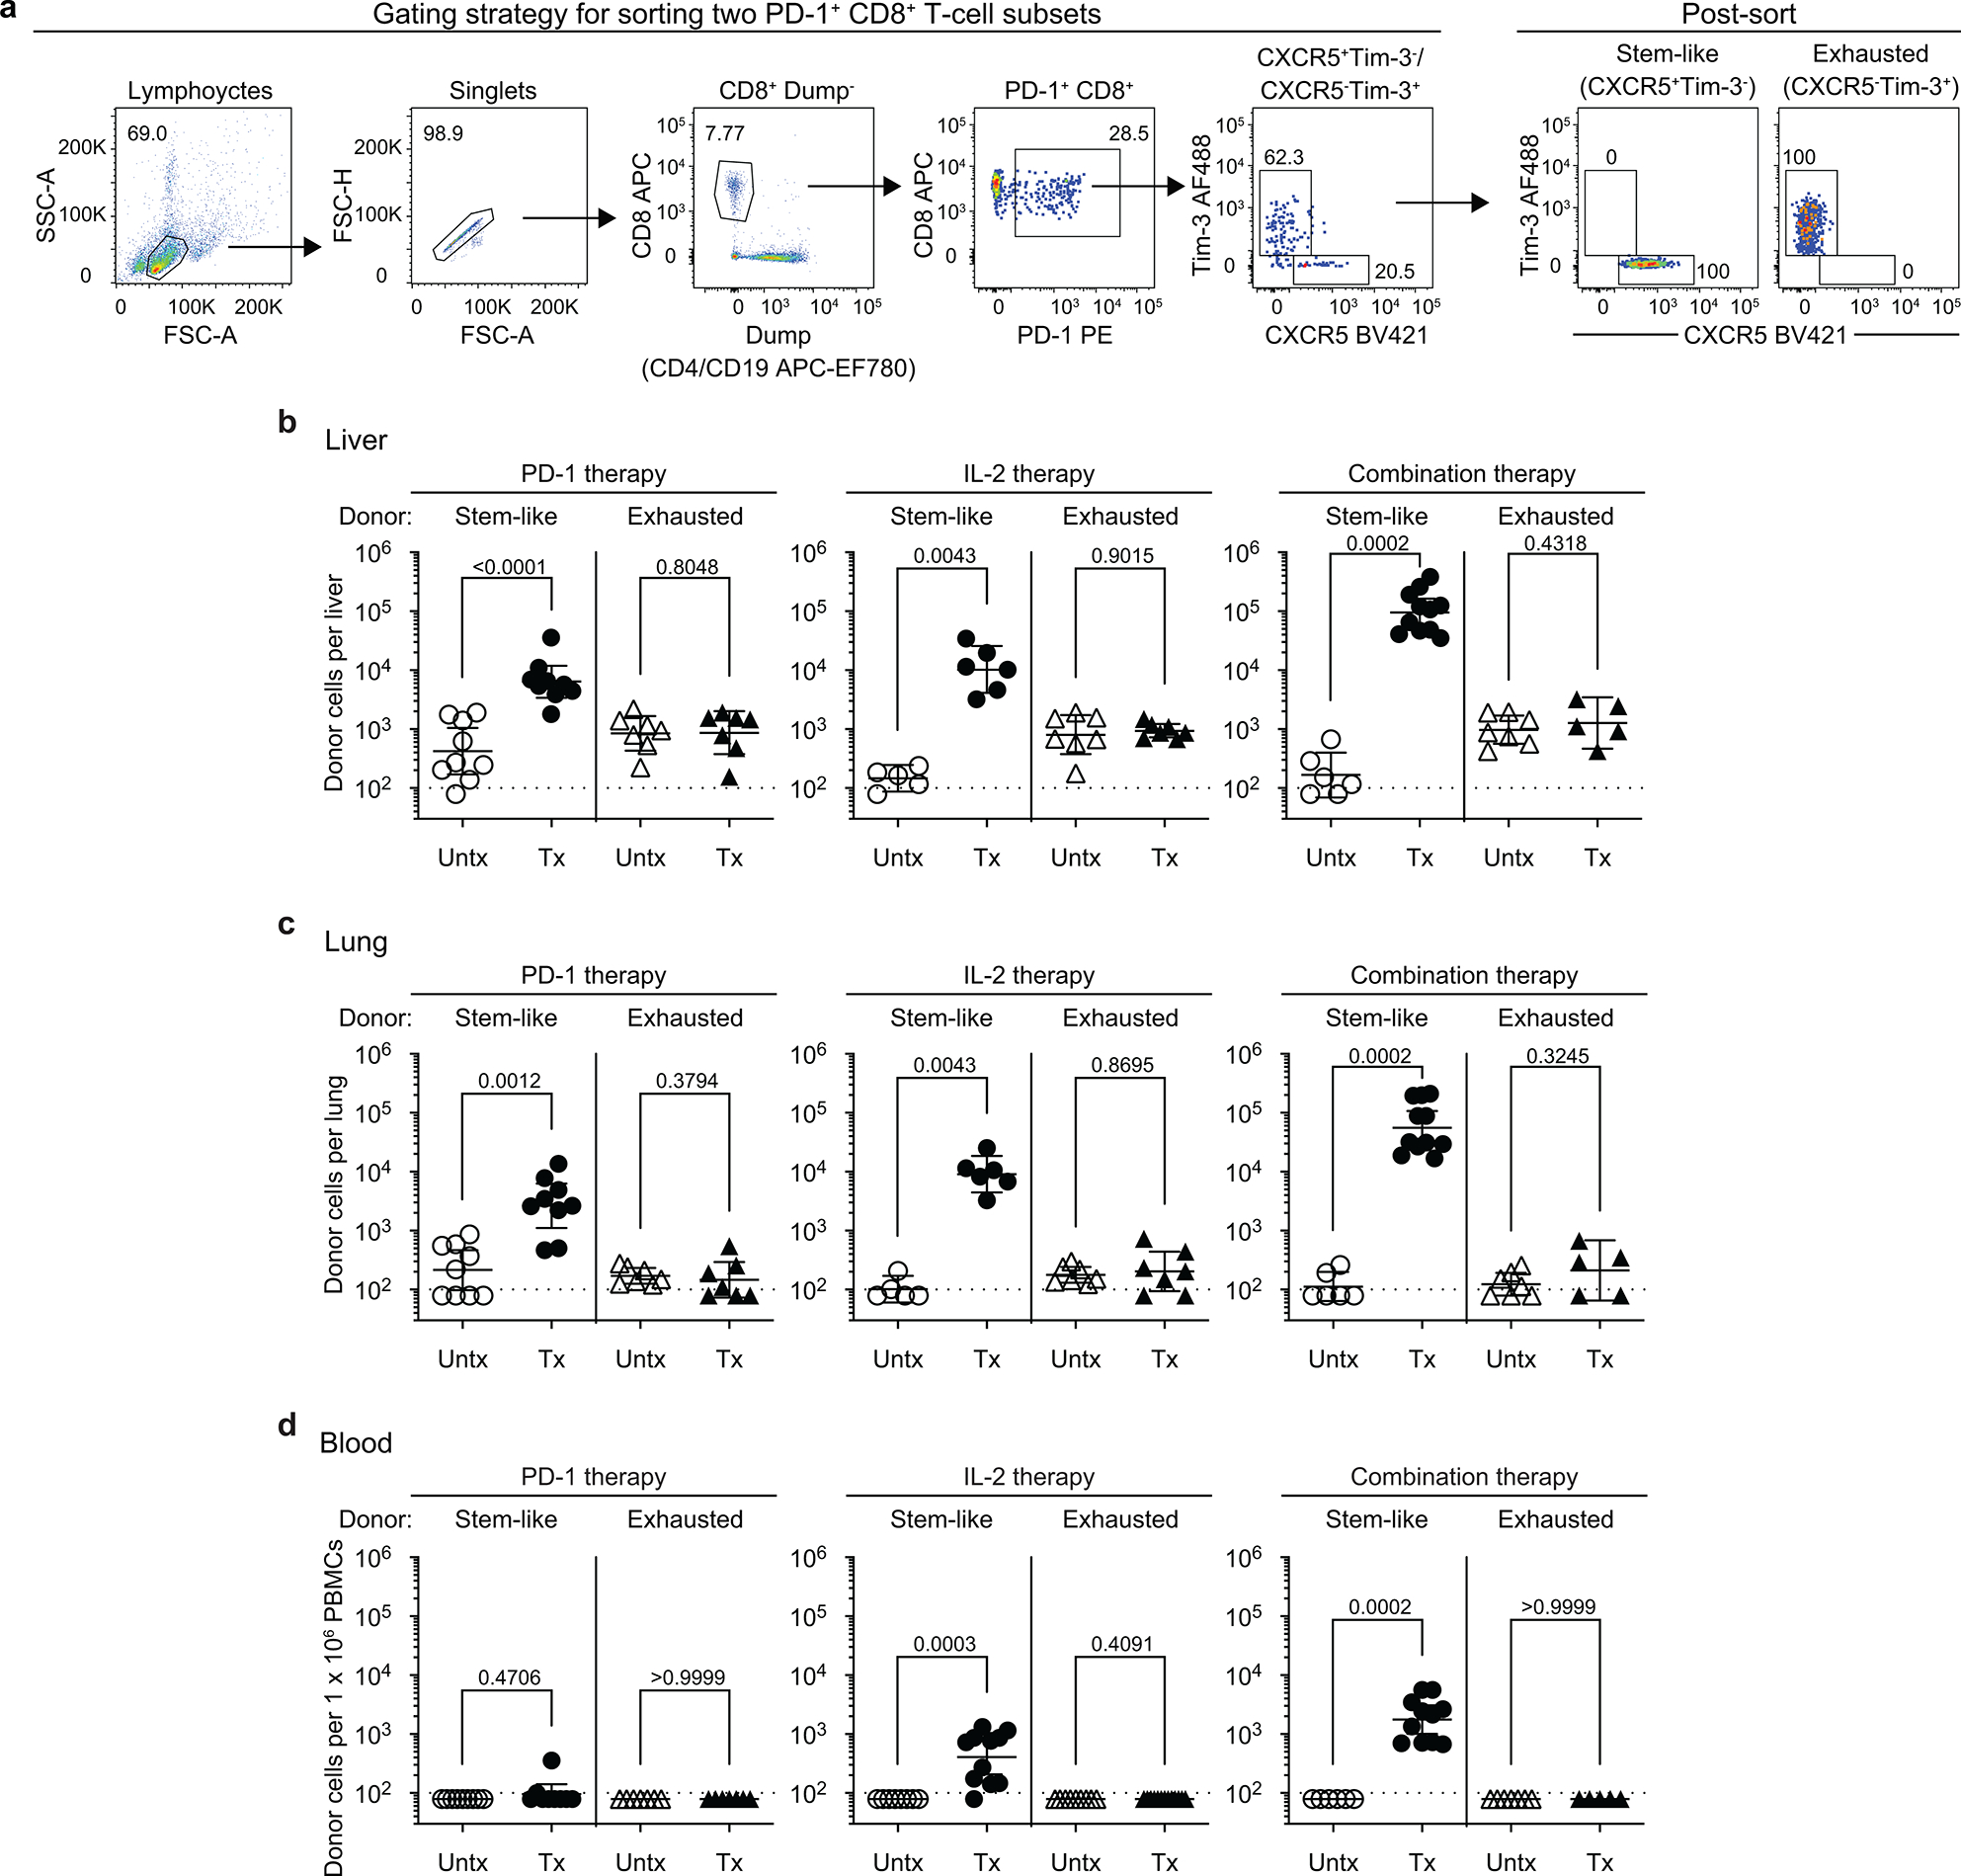
a, Gating strategy for sorting stem-like (PD-1+CXCR5+TIM3−) and exhausted (PD-1+CXCR5−TIM3+) CD8+ T-cell subsets isolated from spleens of CD45.2+ LCMV chronically infected mice. b-d, Summary data for the numbers of donor CD45.2+ CD8+ T cells after 2 weeks of PD-1 therapy, IL-2 therapy, and the combination therapy in liver (b), lungs (c), and blood (per 1 × 10⁶ PBMCs) (d) of the recipient mice. Results were pooled from 3–4 experiments with n = 7–9 (PD-1 therapy), n = 5–13 (IL-2 therapy), and n = 5–11 (PD-1 + IL-2 combination therapy) per group. Data are presented as geometric mean and 95% CI (b–d) with p values. Dotted line indicates the limit of detection. Statistical comparisons were performed by using two-tailed unpaired Mann-Whitney test. AF, Alexa Fluor; EF, eFluor; Tx, treated; Untx, untreated.
Extended Data Fig. 3. Transcriptional profiling of LCMV-specific CD8+ T cells generated by PD-1 monotherapy, IL-2 treatment, and PD-1 + IL-2 combination therapy during chronic infection.
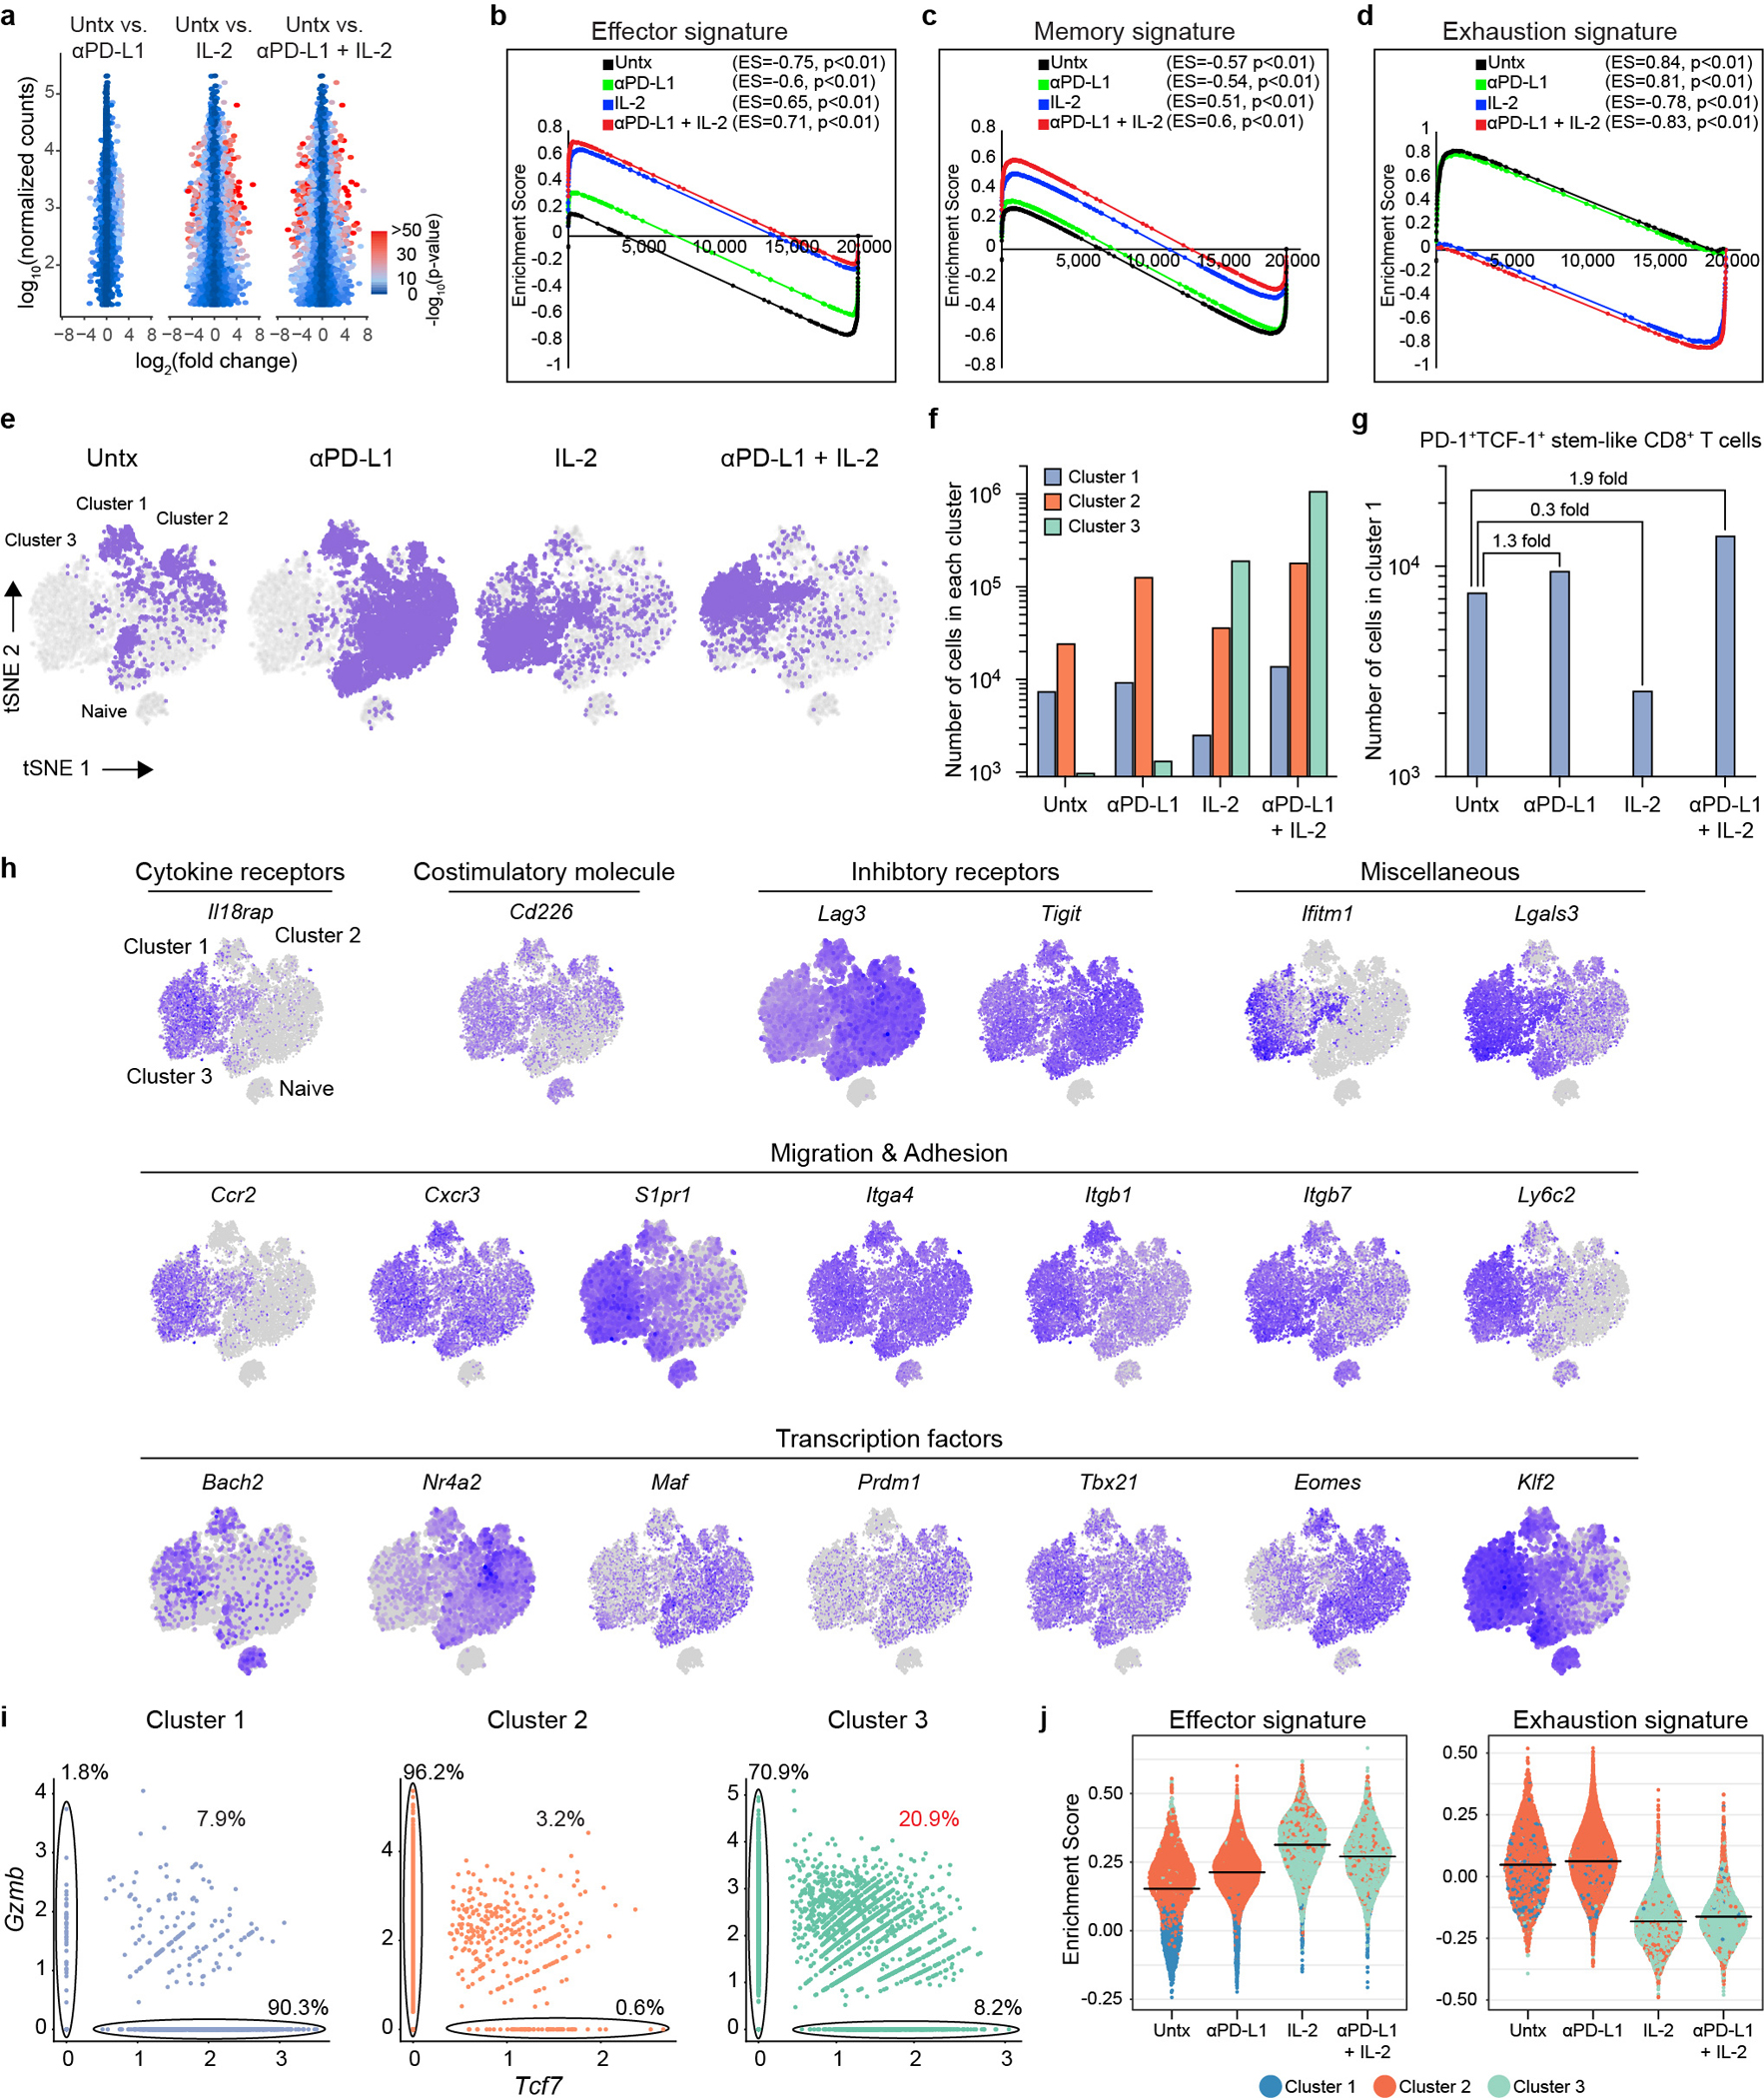
Mice chronically infected with LCMV were treated with PD-1 monotherapy, IL-2 alone, or combination therapy for 2 weeks. LCMV-specific DbGP33+ CD8+ T cells from spleens of each treatment group were sorted for RNA-seq (a–d) and scRNA-seq (e-j). As a control, naive (CD44lo) CD8+ T cells were also sorted for scRNA-seq (e-j). a, MA plots for gene expression of DbGP33+ CD8+ T cells after the indicated treatments. b–d, GSEA of DbGP33+ CD8+ T cells generated by the indicated treatments for effector signature (acute infection) (b), memory signature (acute infection) (c), and exhaustion signature (chronic infection) (d). e, The t-SNE projection of naive CD44lo CD8+ T cells and DbGP33+ CD8+ T cells in 4 treatment groups during chronic infection. Naive and four treatment samples were distributed and overlaid onto the four clusters. f, Numbers of cells in clusters 1, 2, and 3. g, Numbers of cells in cluster 1. Numbers of total DbGP33+ CD8+ T cells per spleen were estimated from geometric mean of Extended Data Fig. 1b (f, g). h, Normalized expression of several representative genes is shown within the 4 clusters i, Co-expression patterns of Tcf7 and Gzmb in cells of each cluster are shown. j, GSEA of DbGP33+ CD8+ T cells generated by the different treatments for effector signature (acute infection) and exhaustion signature (chronic infection). Enrichment score for the signature in four treatment samples are shown as violin plots with horizontal bars of mean. Results were pooled from 2 (a–c) and 1–2 (e–j) experiments with n = 2–18 mice per group in each experiment. ES, enrichment score; Untx, untreated.
Extended Data Fig. 4. Phenotypic and functional analysis of LCMV-specific CD8+ T cells generated by PD-1, IL-2, and combination therapy during chronic infection.
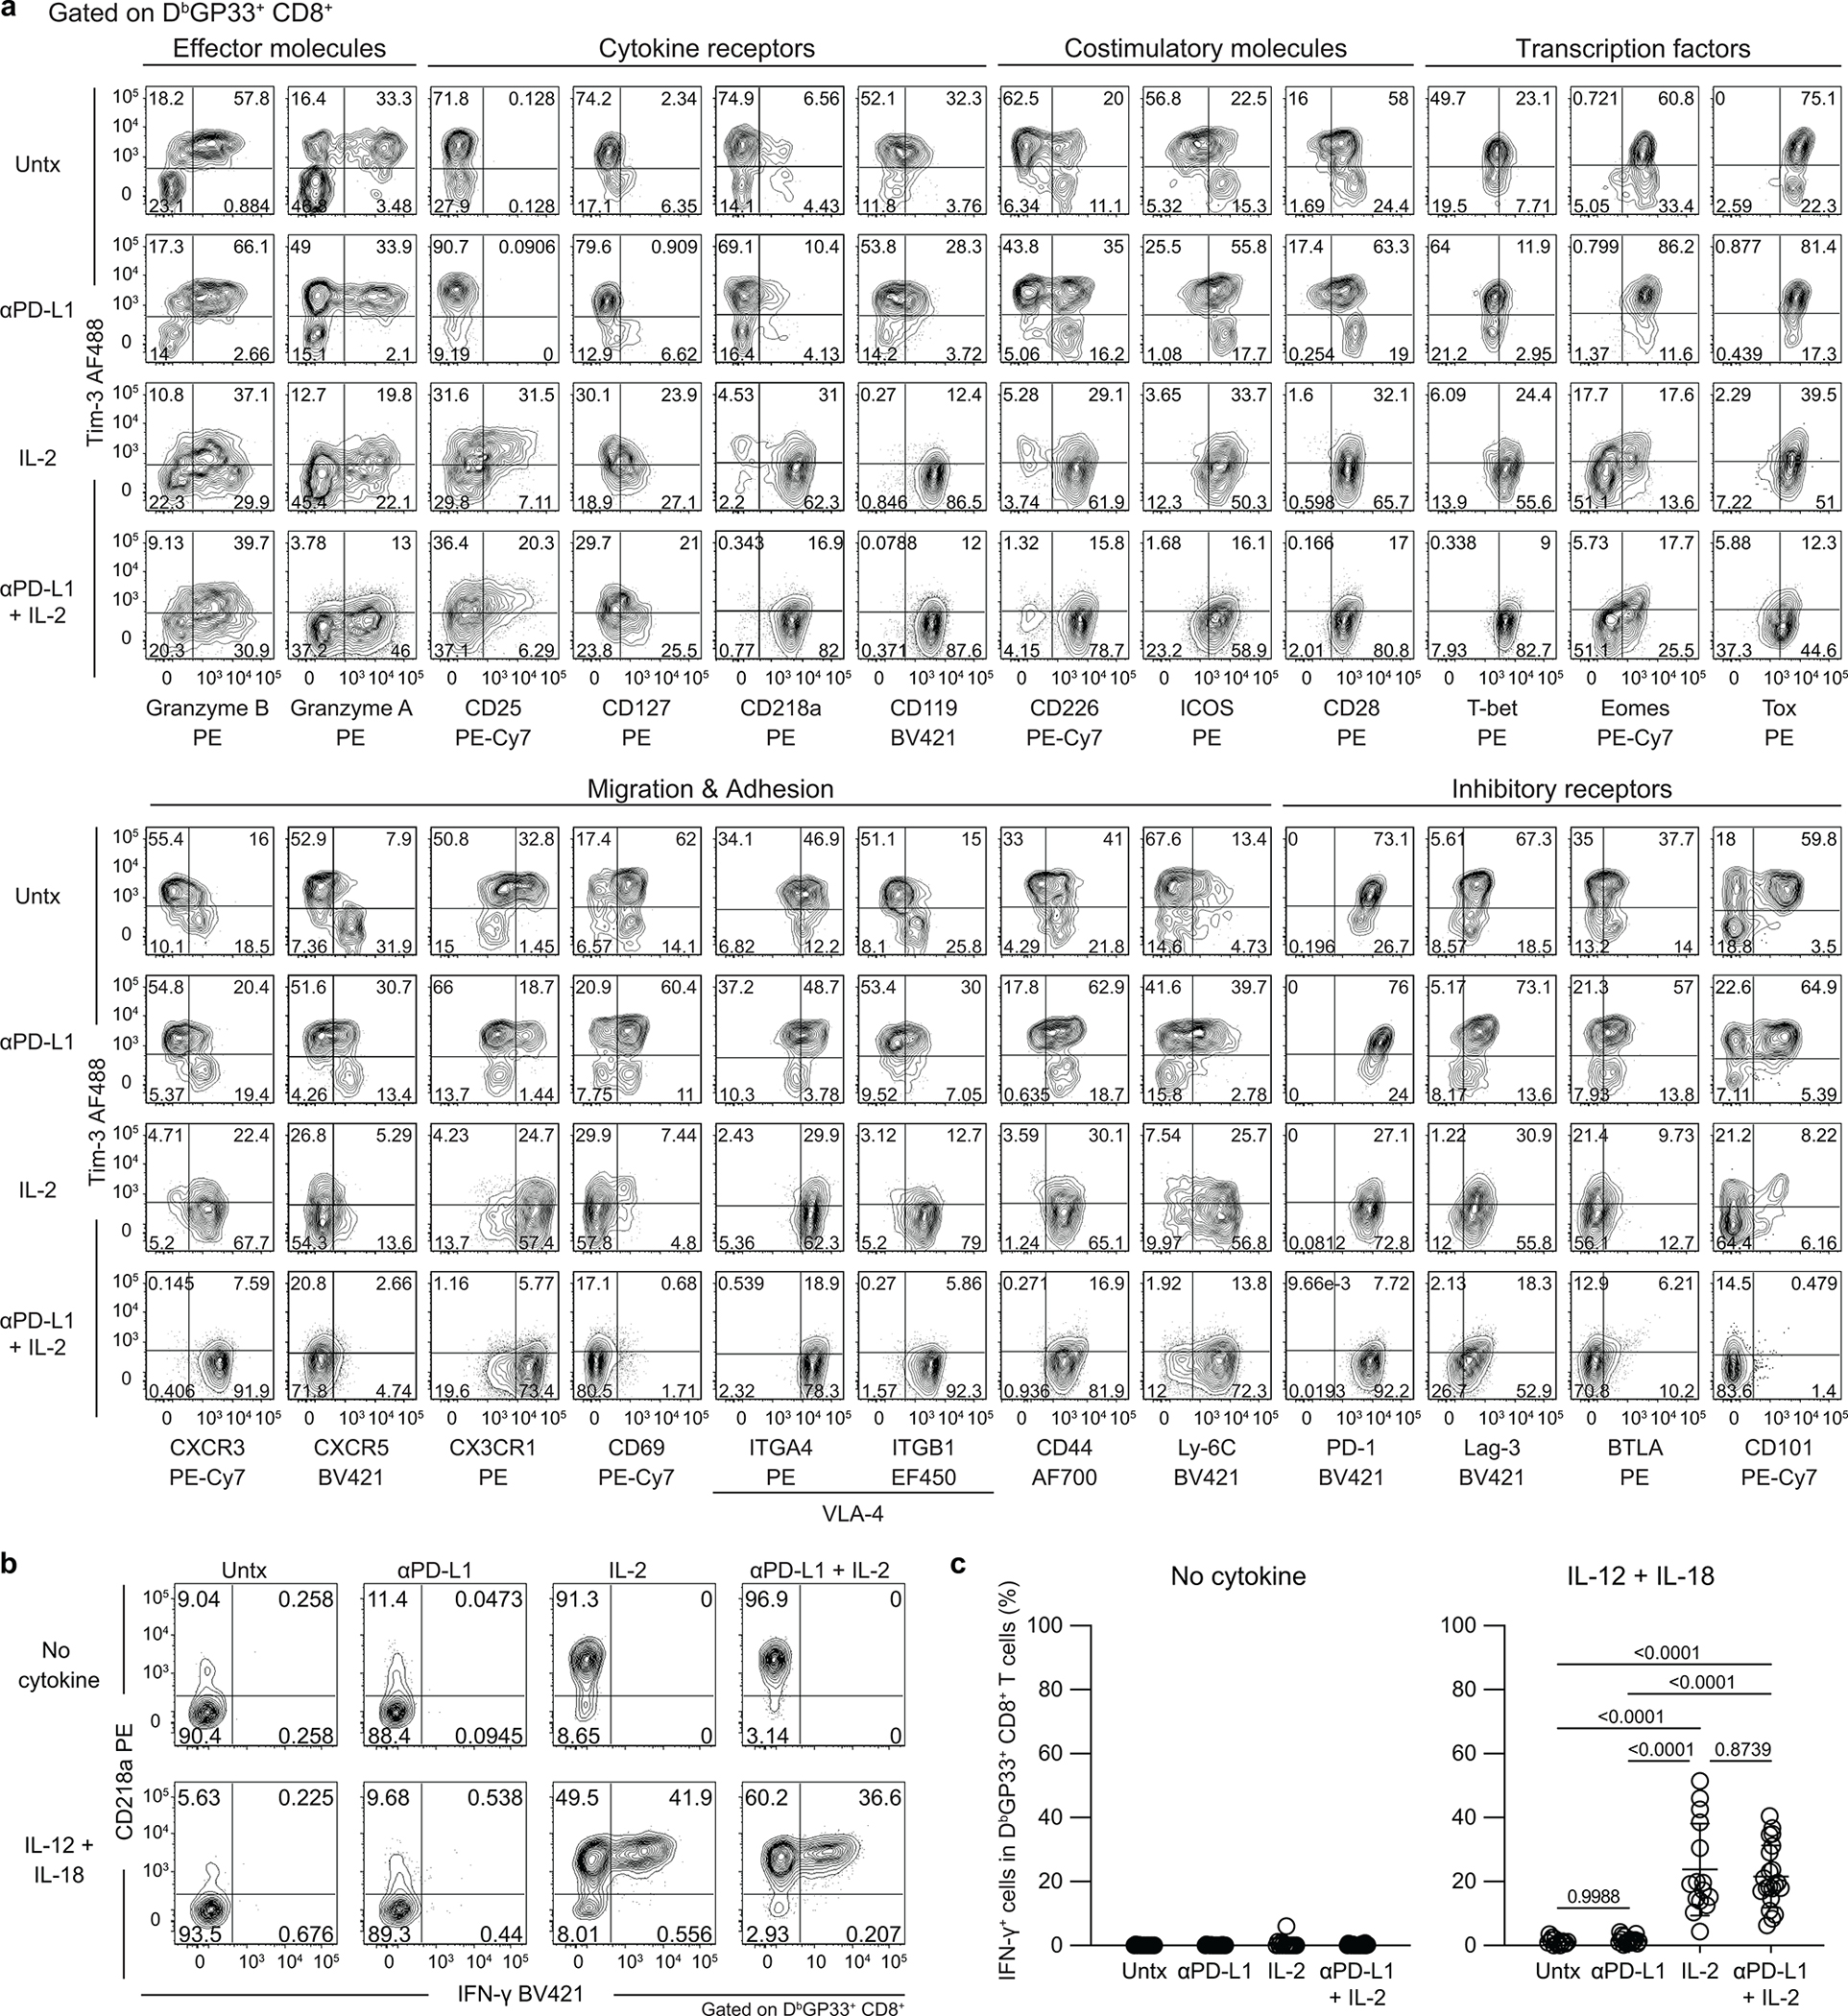
LCMV chronically infected mice were either left untreated, or treated with anti-PD-L1 antibody alone, IL-2 therapy alone, or the combination therapy for 2 weeks. a, Representative FACS plots for co-expression of TIM3 and various phenotypic markers on DbGP33+ CD8+ T cells in spleens. b, c, One million splenocytes were cultured with recombinant mouse IL-12 and IL-18 (20 ng ml−1 each) for 5 h, then GolgiPlug was added, followed by culturing for 1 hour. Note that no viral peptides were added to the culture. Cells were stained with surface markers including DbGP33-specific tetramer, fixed, and followed by intracellular staining of IFNγ. b, Representative FACS plots for co-staining of CD218a and IFNγ gated on DbGP33+ CD8+ T cells after the indicated treatments. c, Summary plots for the frequency of IFNγ+ cells in DbGP33+ CD8+ T cells. Results shown are representative flow plots from 2–7 experiments (a, b) or pooled from 7 experiments (c) with n = 2–5 per group in each experiment. Data are presented as mean and SD with p values (c). Statistical comparisons were performed using one-way ANOVA with Tukey’s multiple comparison test (c). AF, Alexa Fluor; EF, eFluor; Untx, untreated.
Extended Data Fig. 5. Identification of LCMV-specific CD8+ T cells generated after PD-1, IL-2, and combination therapy that produce cytokine after peptide stimulation.
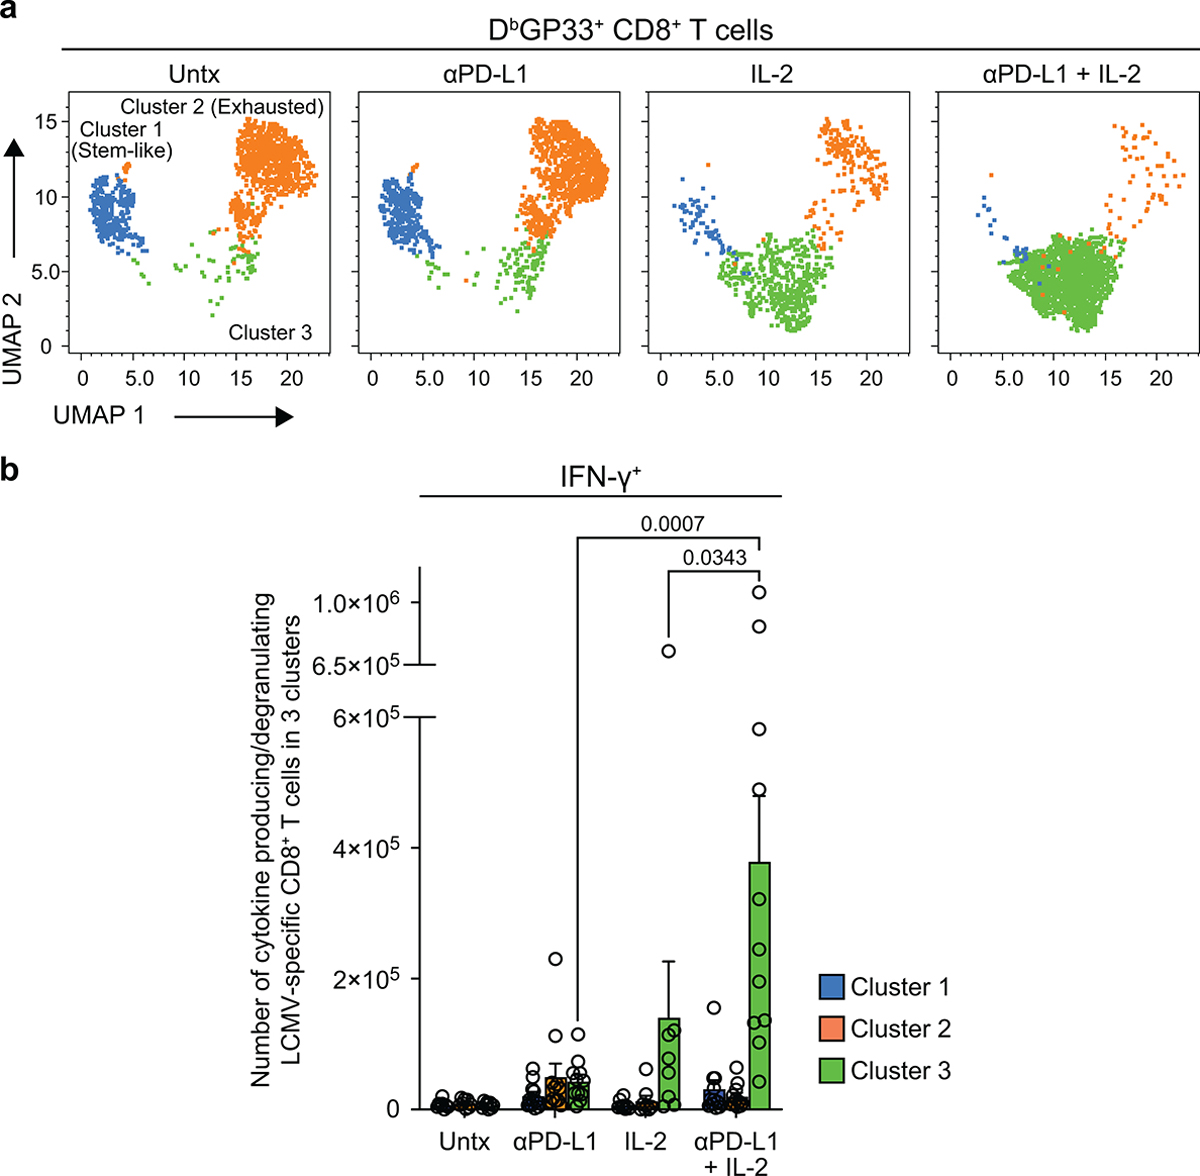
LCMV chronically infected mice were either left untreated, or treated with anti-PD-L1 antibody alone, IL-2 therapy alone, or the combination therapy for 2 weeks. Spleen cells were stimulated with pools of LCMV-specific peptides for 5 h and analyzed by intracellular staining for cytokine production. a, Representative UMAP with FlowSOM overlay of DbGP33+ CD8+ T cells isolated from spleens after the indicated treatments shows the distribution of cells in three clusters. b, Summary data for numbers of IFNγ+ LCMV-specific CD8+ T cells in the defined 3 clusters in the different treatment groups is shown. Results were pooled from 4 experiments with 2–3 mice per group in each experiment. Data are presented as mean and SEM (b) with p values. Statistical comparisons were performed using Kruskal-Wallis test with Dunn’s multiple comparison test (d, e). Untx, untreated.
Extended Data Fig. 6. Chromatin accessibility profiling of LCMV-specific CD8+ T cells in acute and chronic infection and after PD-1 treatment, IL-2 or PD-1 + IL-2 combination therapy.
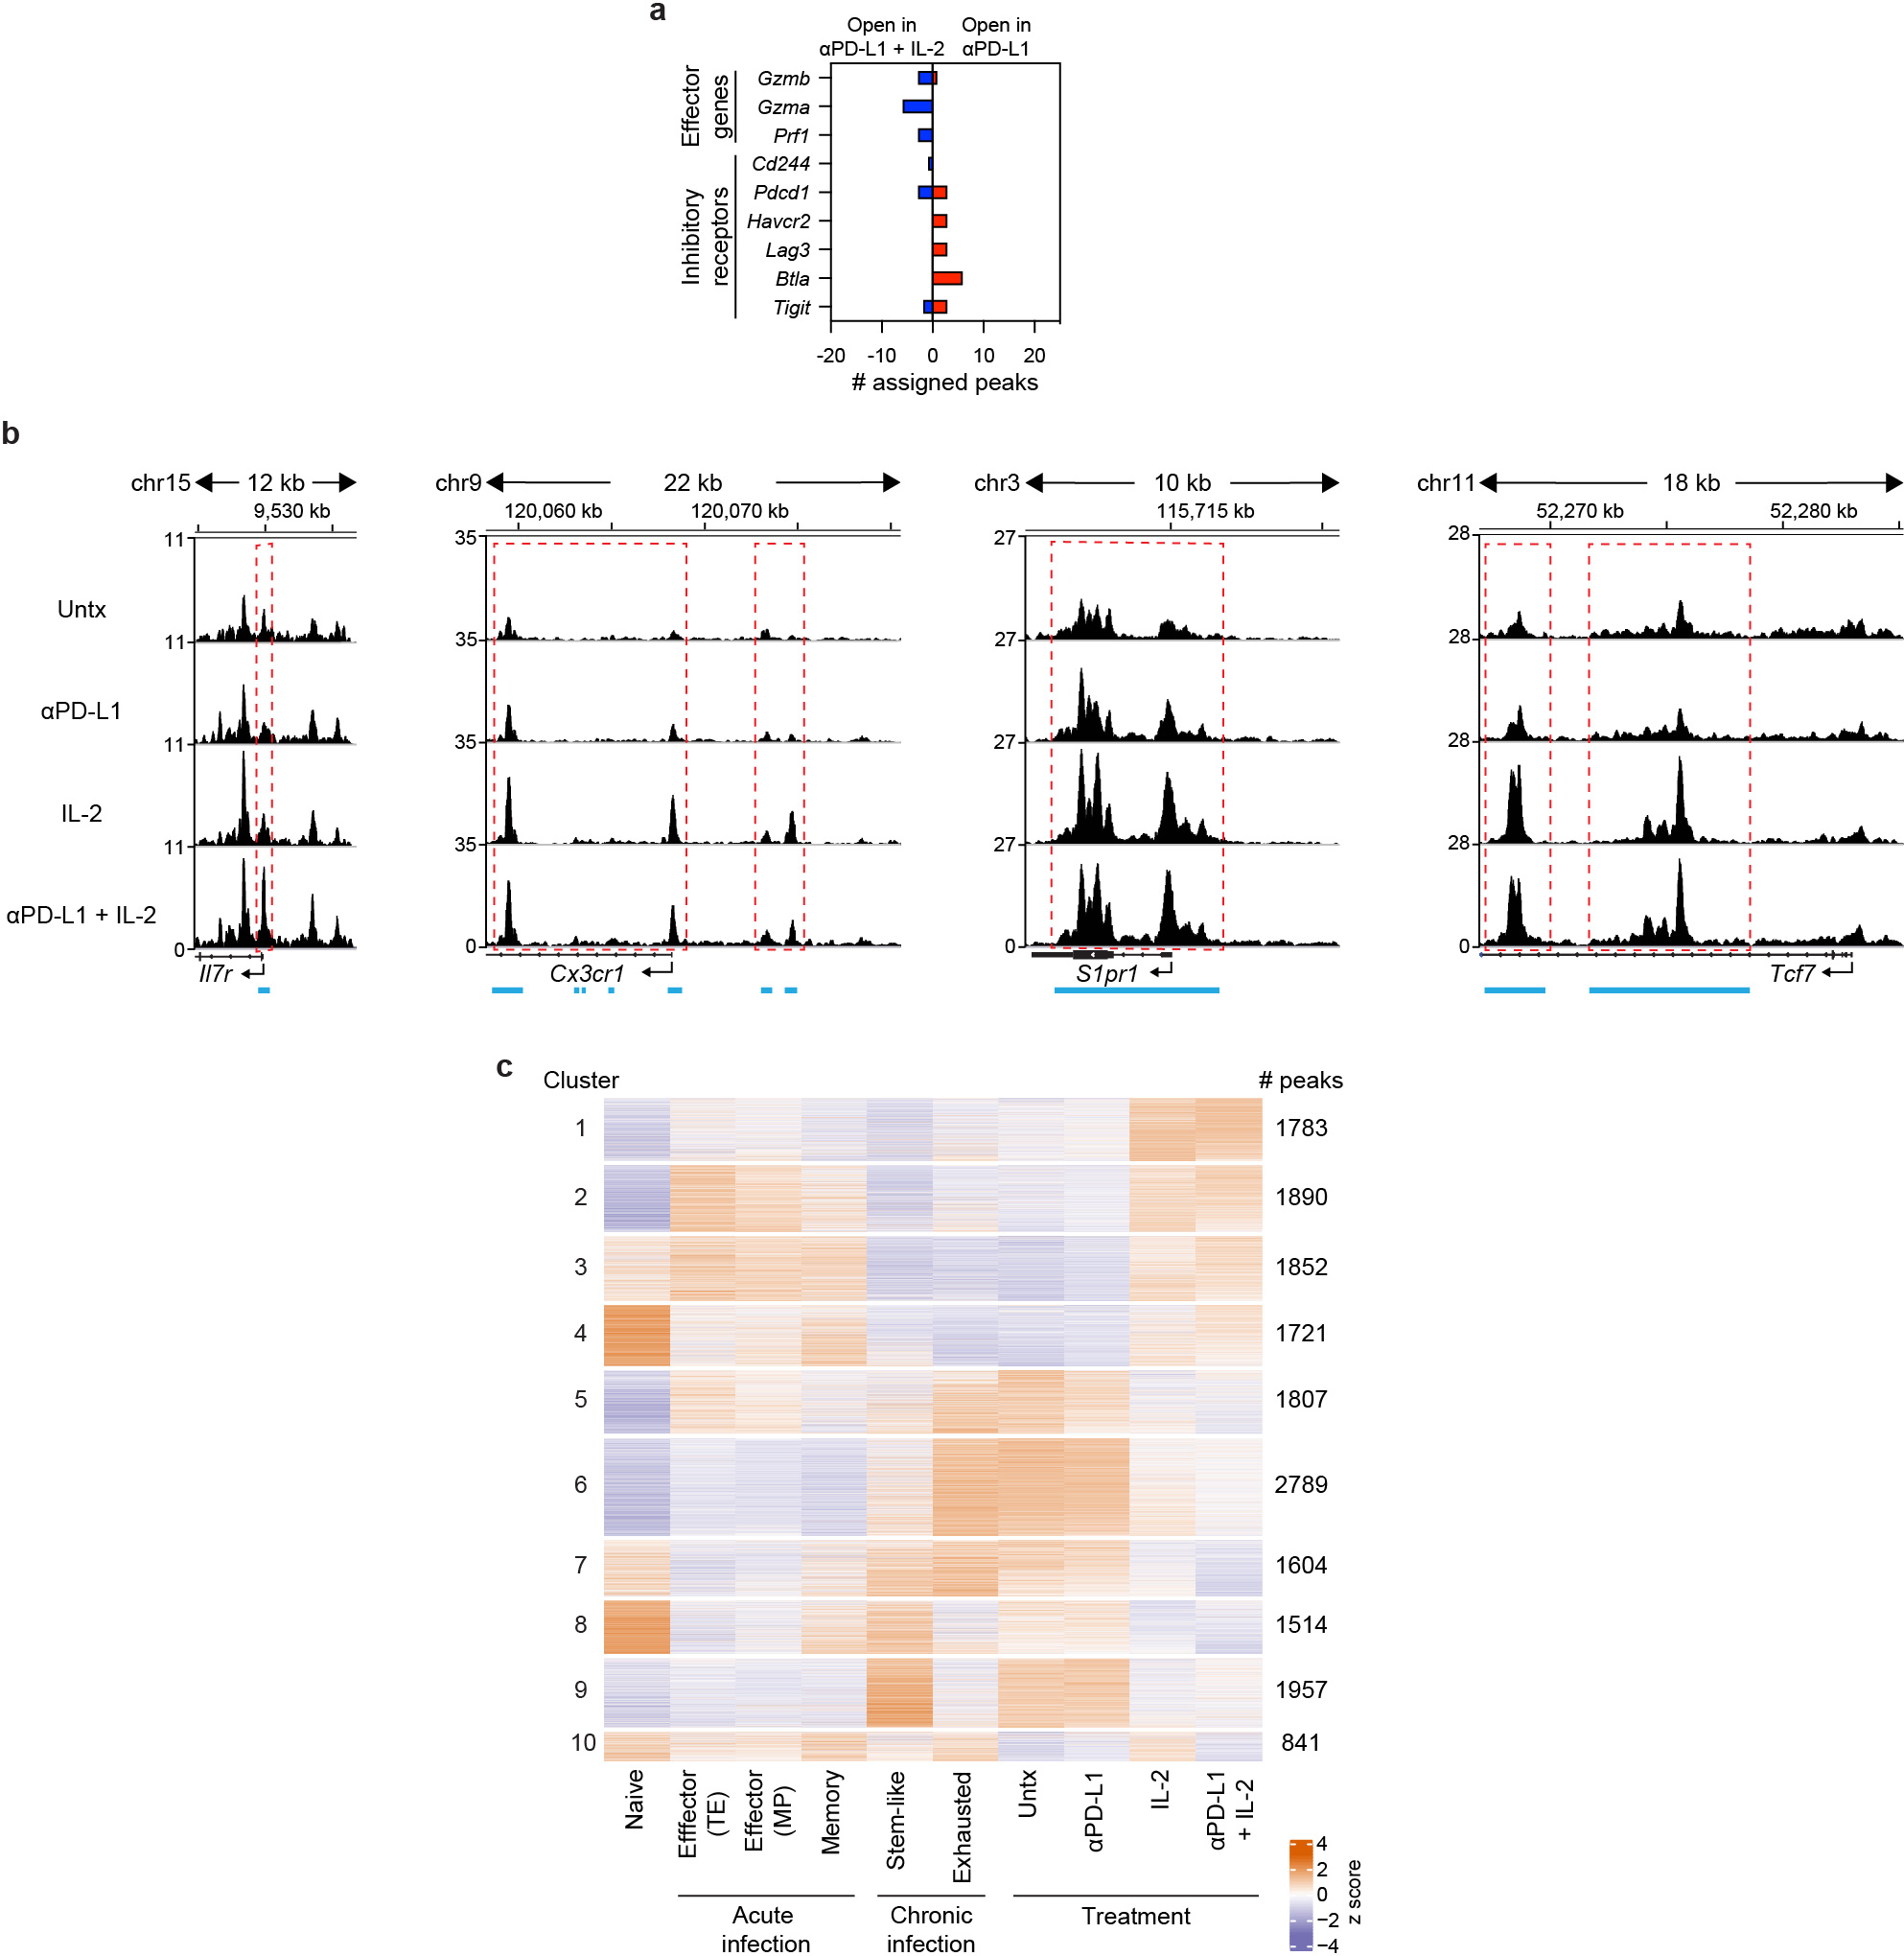
a, Gene annotations of differentially accessible distal regulatory regions in DbGP33+ CD8+ T cells of mice treated with anti-PD-L1 and PD-1 + IL-2 combination therapy. The number of differentially open gene regulatory regions for genes of functional importance in DbGP33+ CD8+ T cells after PD-1 monotherapy vs. PD-1 + IL-2 combination therapy is shown. b, Accessibility tracks for representative genes in LCMV-specific DbGP33+ CD8+ T cells generated by various treatments during chronic infection. Light blue lines beneath each panel indicate differentially accessible regions in DbGP33+ CD8+ T cells generated by PD-1 therapy versus PD-1 + IL-2 combination therapy. Red dotted lines highlight the regions indicated by the light blue lines. c, Heat map with 10 clusters generated by using k-means clustering of 16,758 DARs among DbGP33+ CD8+ T cells generated by the combination therapy. Then, naive CD8+ T cells and various LCMV-specific CD8+ T-cell subsets during acute and chronic infections were incorporated into the heat map. Results were pooled from 3 experiments of ATAC-seq with n = 12–18 for untreated mice or n = 1–3 for treatment samples per group in each experiment. ATAC-seq data for naive, acute (memory precursor (MP), terminal effector (TE), and memory), and chronic (stem-like and exhausted) was from our previous study30. Untx, untreated.
Extended Data Fig. 7. Importance of PD-1/PD-L1 blockade at the target site in reducing viral load during chronic LCMV infection.
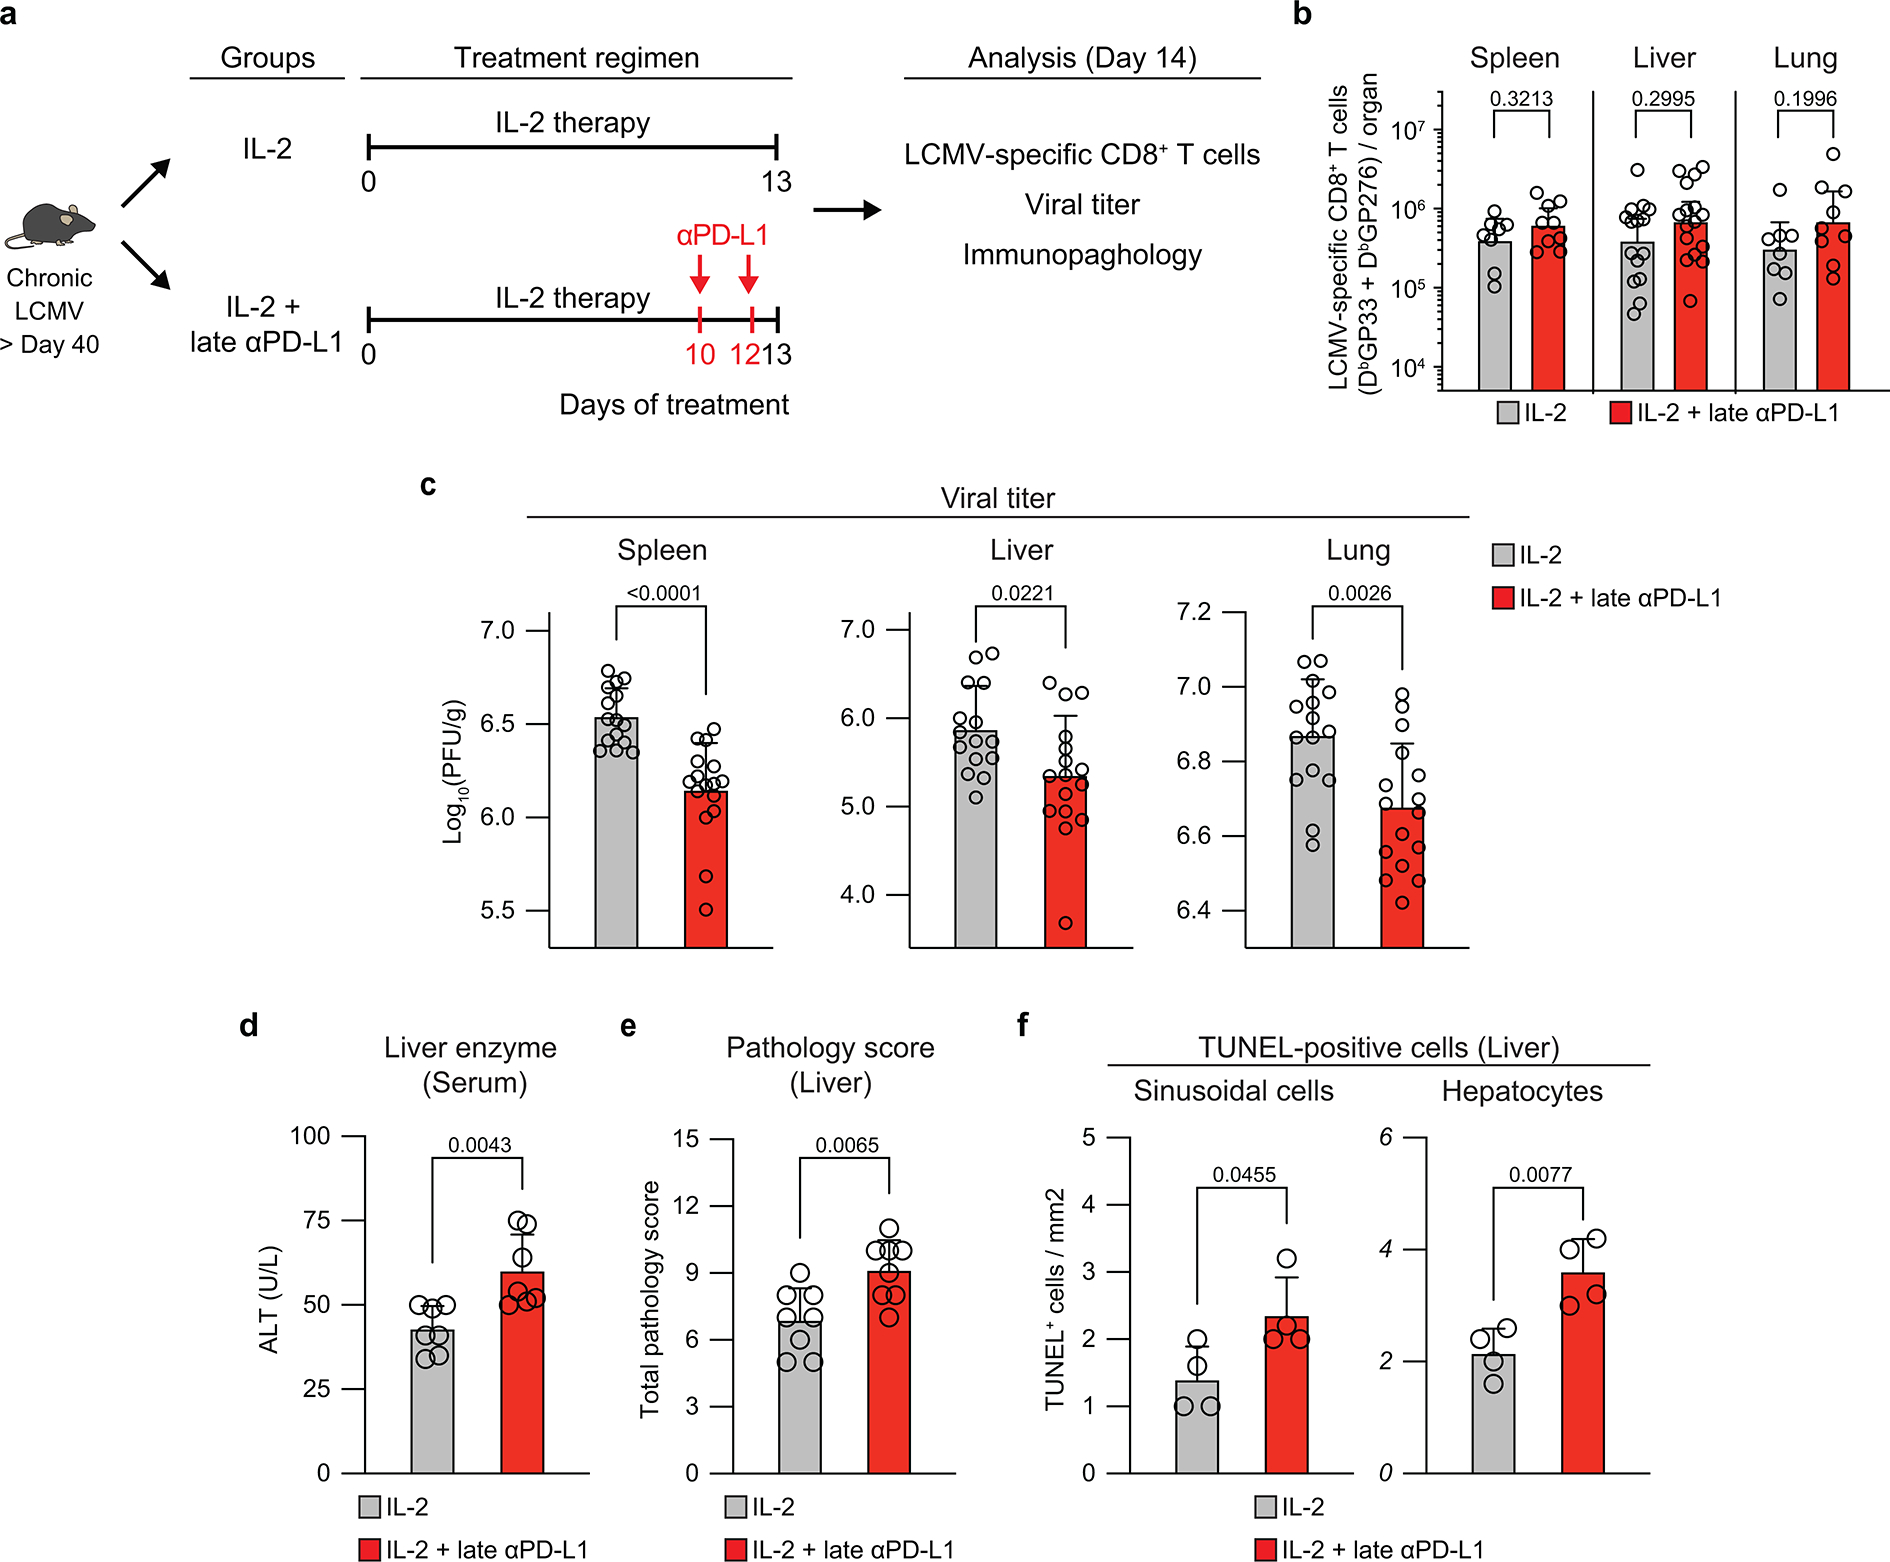
a, Experimental design. Mice chronically infected with LCMV were divided into two groups; one group was treated with IL-2 only for 13 days (IL-2 group), and the second group was given IL-2 for 10 days followed by 2 doses of anti-PD-L1 antibody on days 10 and 12 (IL-2 + late anti-PD-L1 group). Mice were then analyzed at day 14 for LCMV-specific CD8+ T-cell responses, viral titre, and liver immunopathlogy. b, Numbers of LCMV-specific (DbGP33+ and DbGP276+) CD8+ T cells. c, Viral titre in the indicated tissues. d-f, Immunopathological assessment. Serum levels of alanine aminotransferase (ALT) (d), liver pathology score (e), and number of TUNEL+ sinusoidal cells and hepatocytes (f). Results were pooled from 2–4 experiments with n = 2–5 per group in each experiment (b–f). For serum ALT levels, serum samples were pooled from 2–3 mice. TUNEL staining was done on one of the representative experiments with n = 4 per group. Data are presented as geometric mean and 95% CI (b) or mean and SD (c-f) with p values. Statistical comparisons were performed using two-tailed unpaired Mann-Whitney test (b), or two-tailed unpaired t-test (c–f). ALT, alanine aminotransferase. TUNEL, terminal deoxynucleotidyl transferase dUTP nick end labeling.
Extended Data Fig. 8. PD-1 + IL-2 combination therapy results in a more favorable CD8+ effector/CD4+ Treg ratio compared to IL-2 monotherapy.
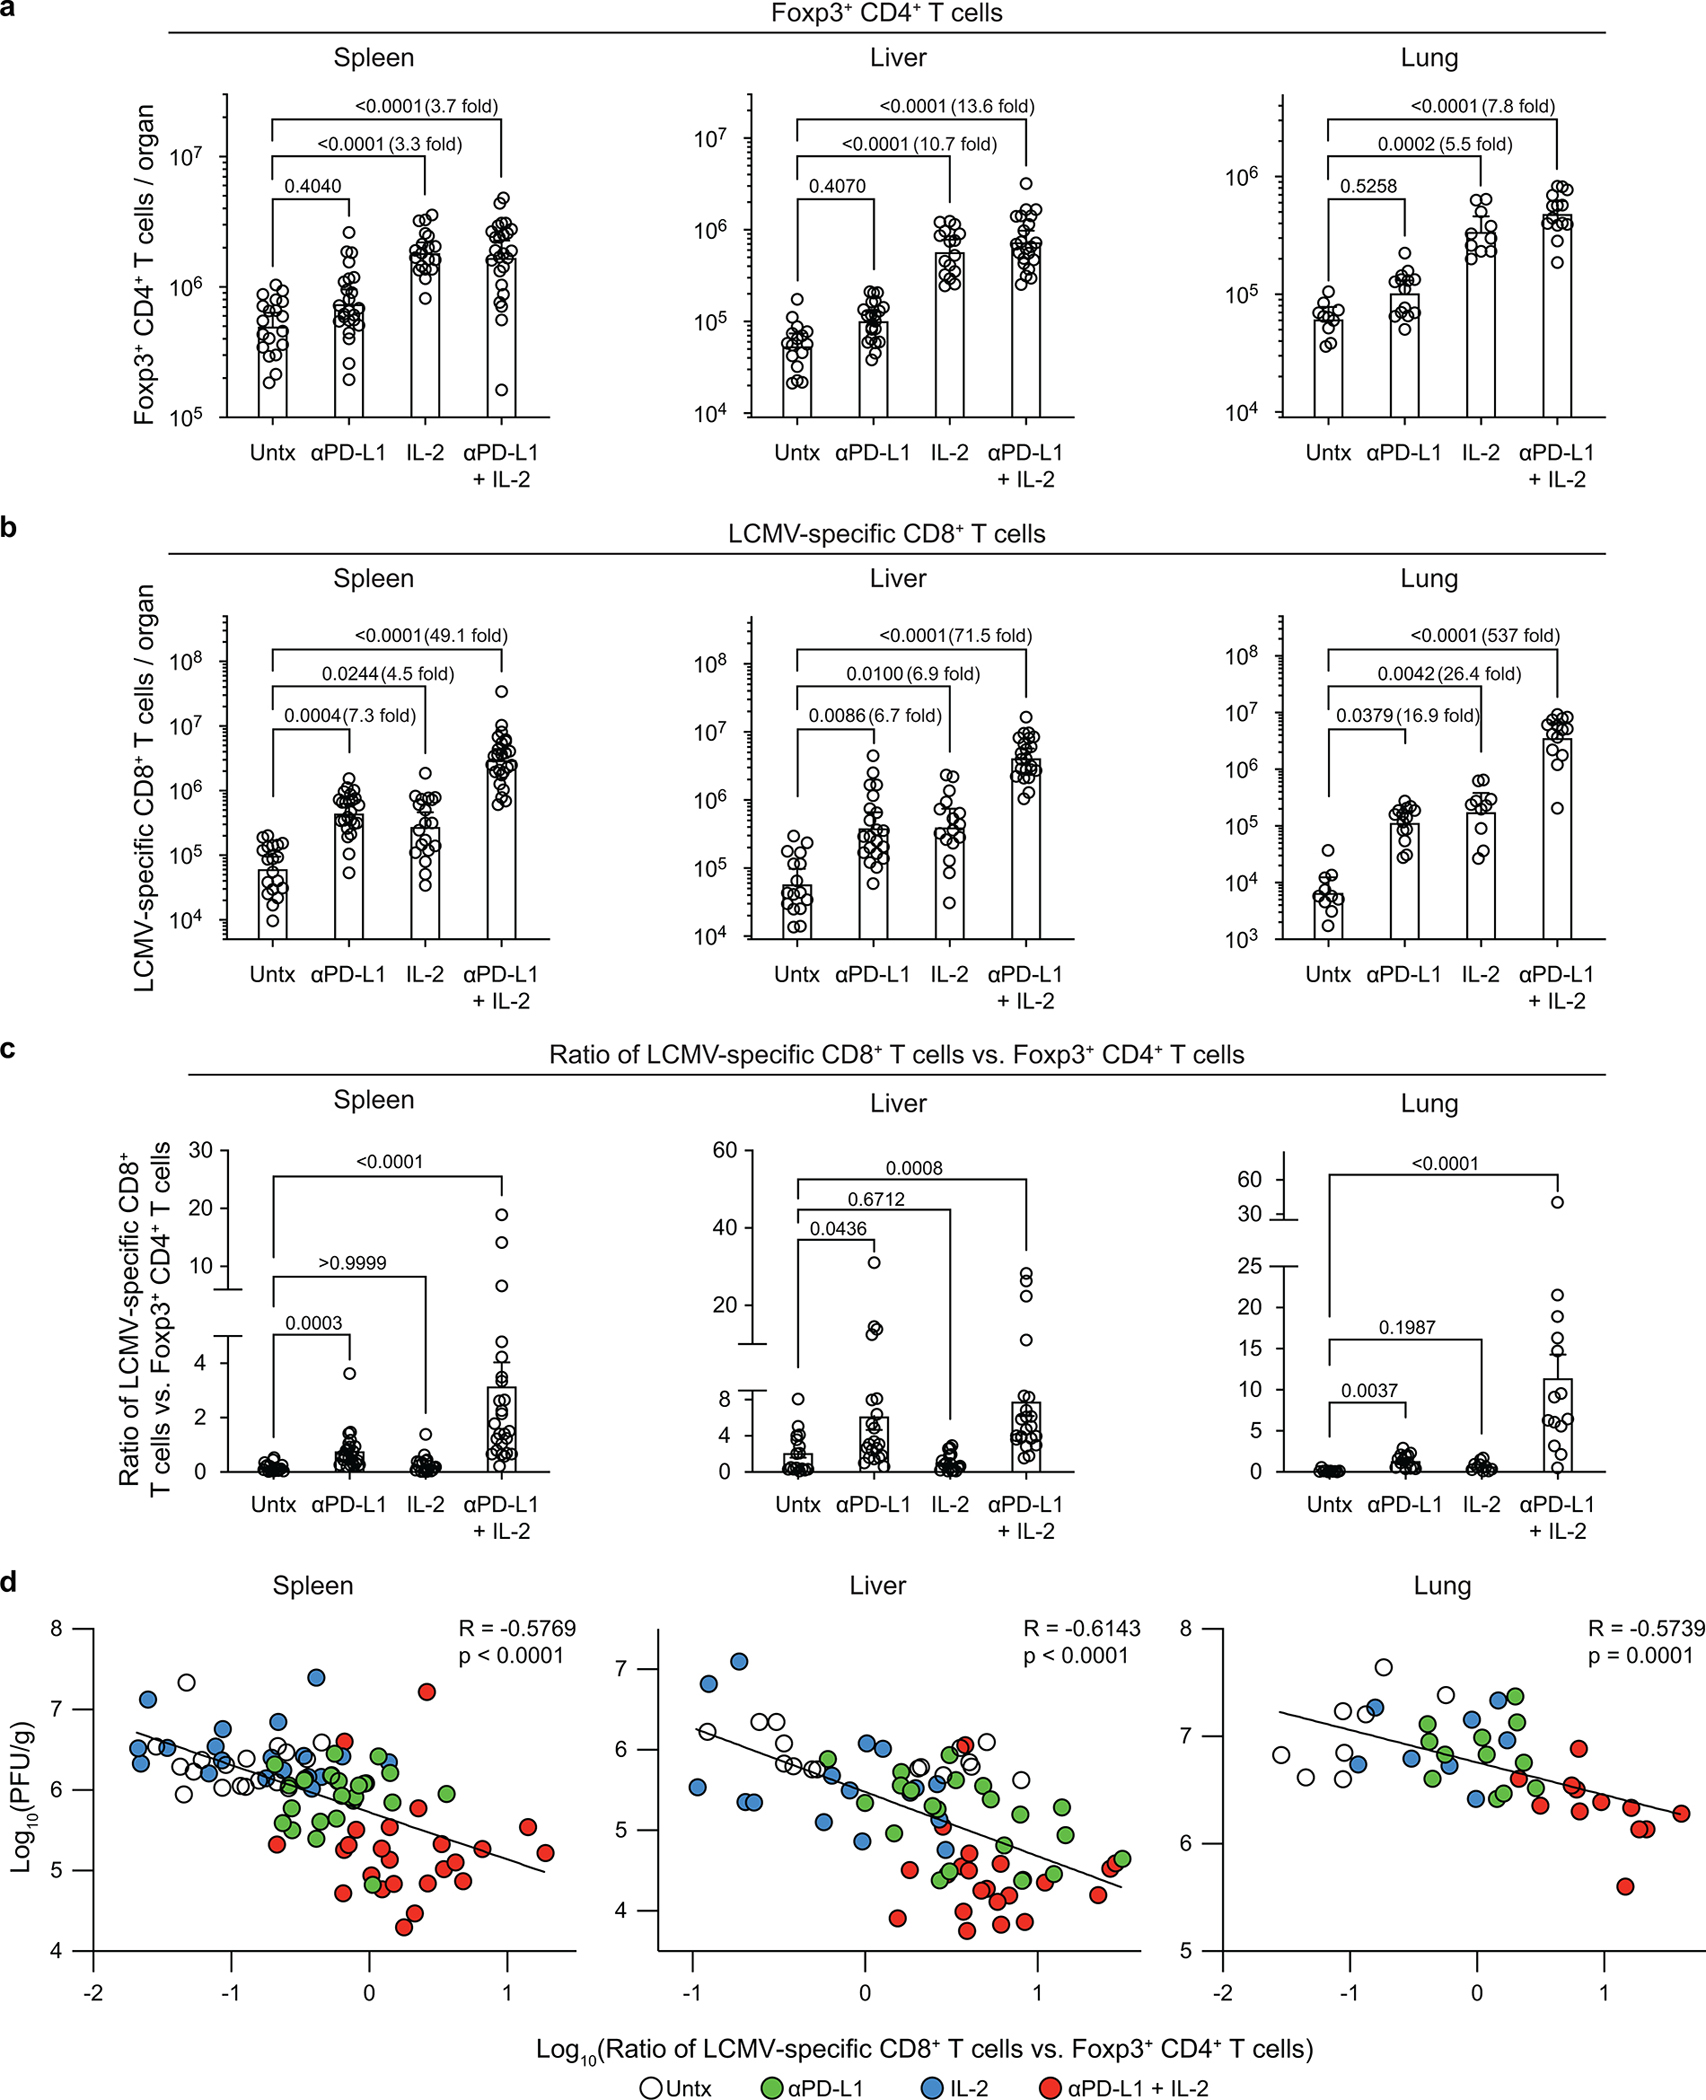
Mice chronically infected with were either left untreated, or treated with anti-PD-L1 antibody alone, IL-2 therapy alone, or combination therapy. a, Numbers of Foxp3+ CD4+ regulatory T cells (Tregs) in the indicated tissues. b, Numbers of LCMV-specific (DbGP33+ and DbGP276+) CD8+ T cells. c, Ratio of LCMV-specific (DbGP33+ and DbGP276+) CD8+ T cells vs. Foxp3+ CD4+ T cells (CD8+ effector/CD4+ Treg ratio). d, Correlation between viral titre and CD8+ effector/CD4+ Treg ratio in the various tissues. Results were pooled from 5–8 experiments with n = 2–4 per group in each experiment. Data are presented as geometric mean and 95% CI (a, b), mean and SEM (c), or linear regression line and Pearson correlation coefficient (two-tailed) (d) with p values. Statistical comparisons were performed using Kruskal-Wallis test with Dunn’s multiple comparison test (a–c). Untx, untreated.
Extended Data Fig. 9. PD-1+TCF-1+ stem-like CD8+ T cells proliferate and differentiate into effector CD8+ T cells expressing the high affinity trimeric (CD25, CD122, CD132) IL-2 receptor after PD-1 + IL-2 combination therapy.
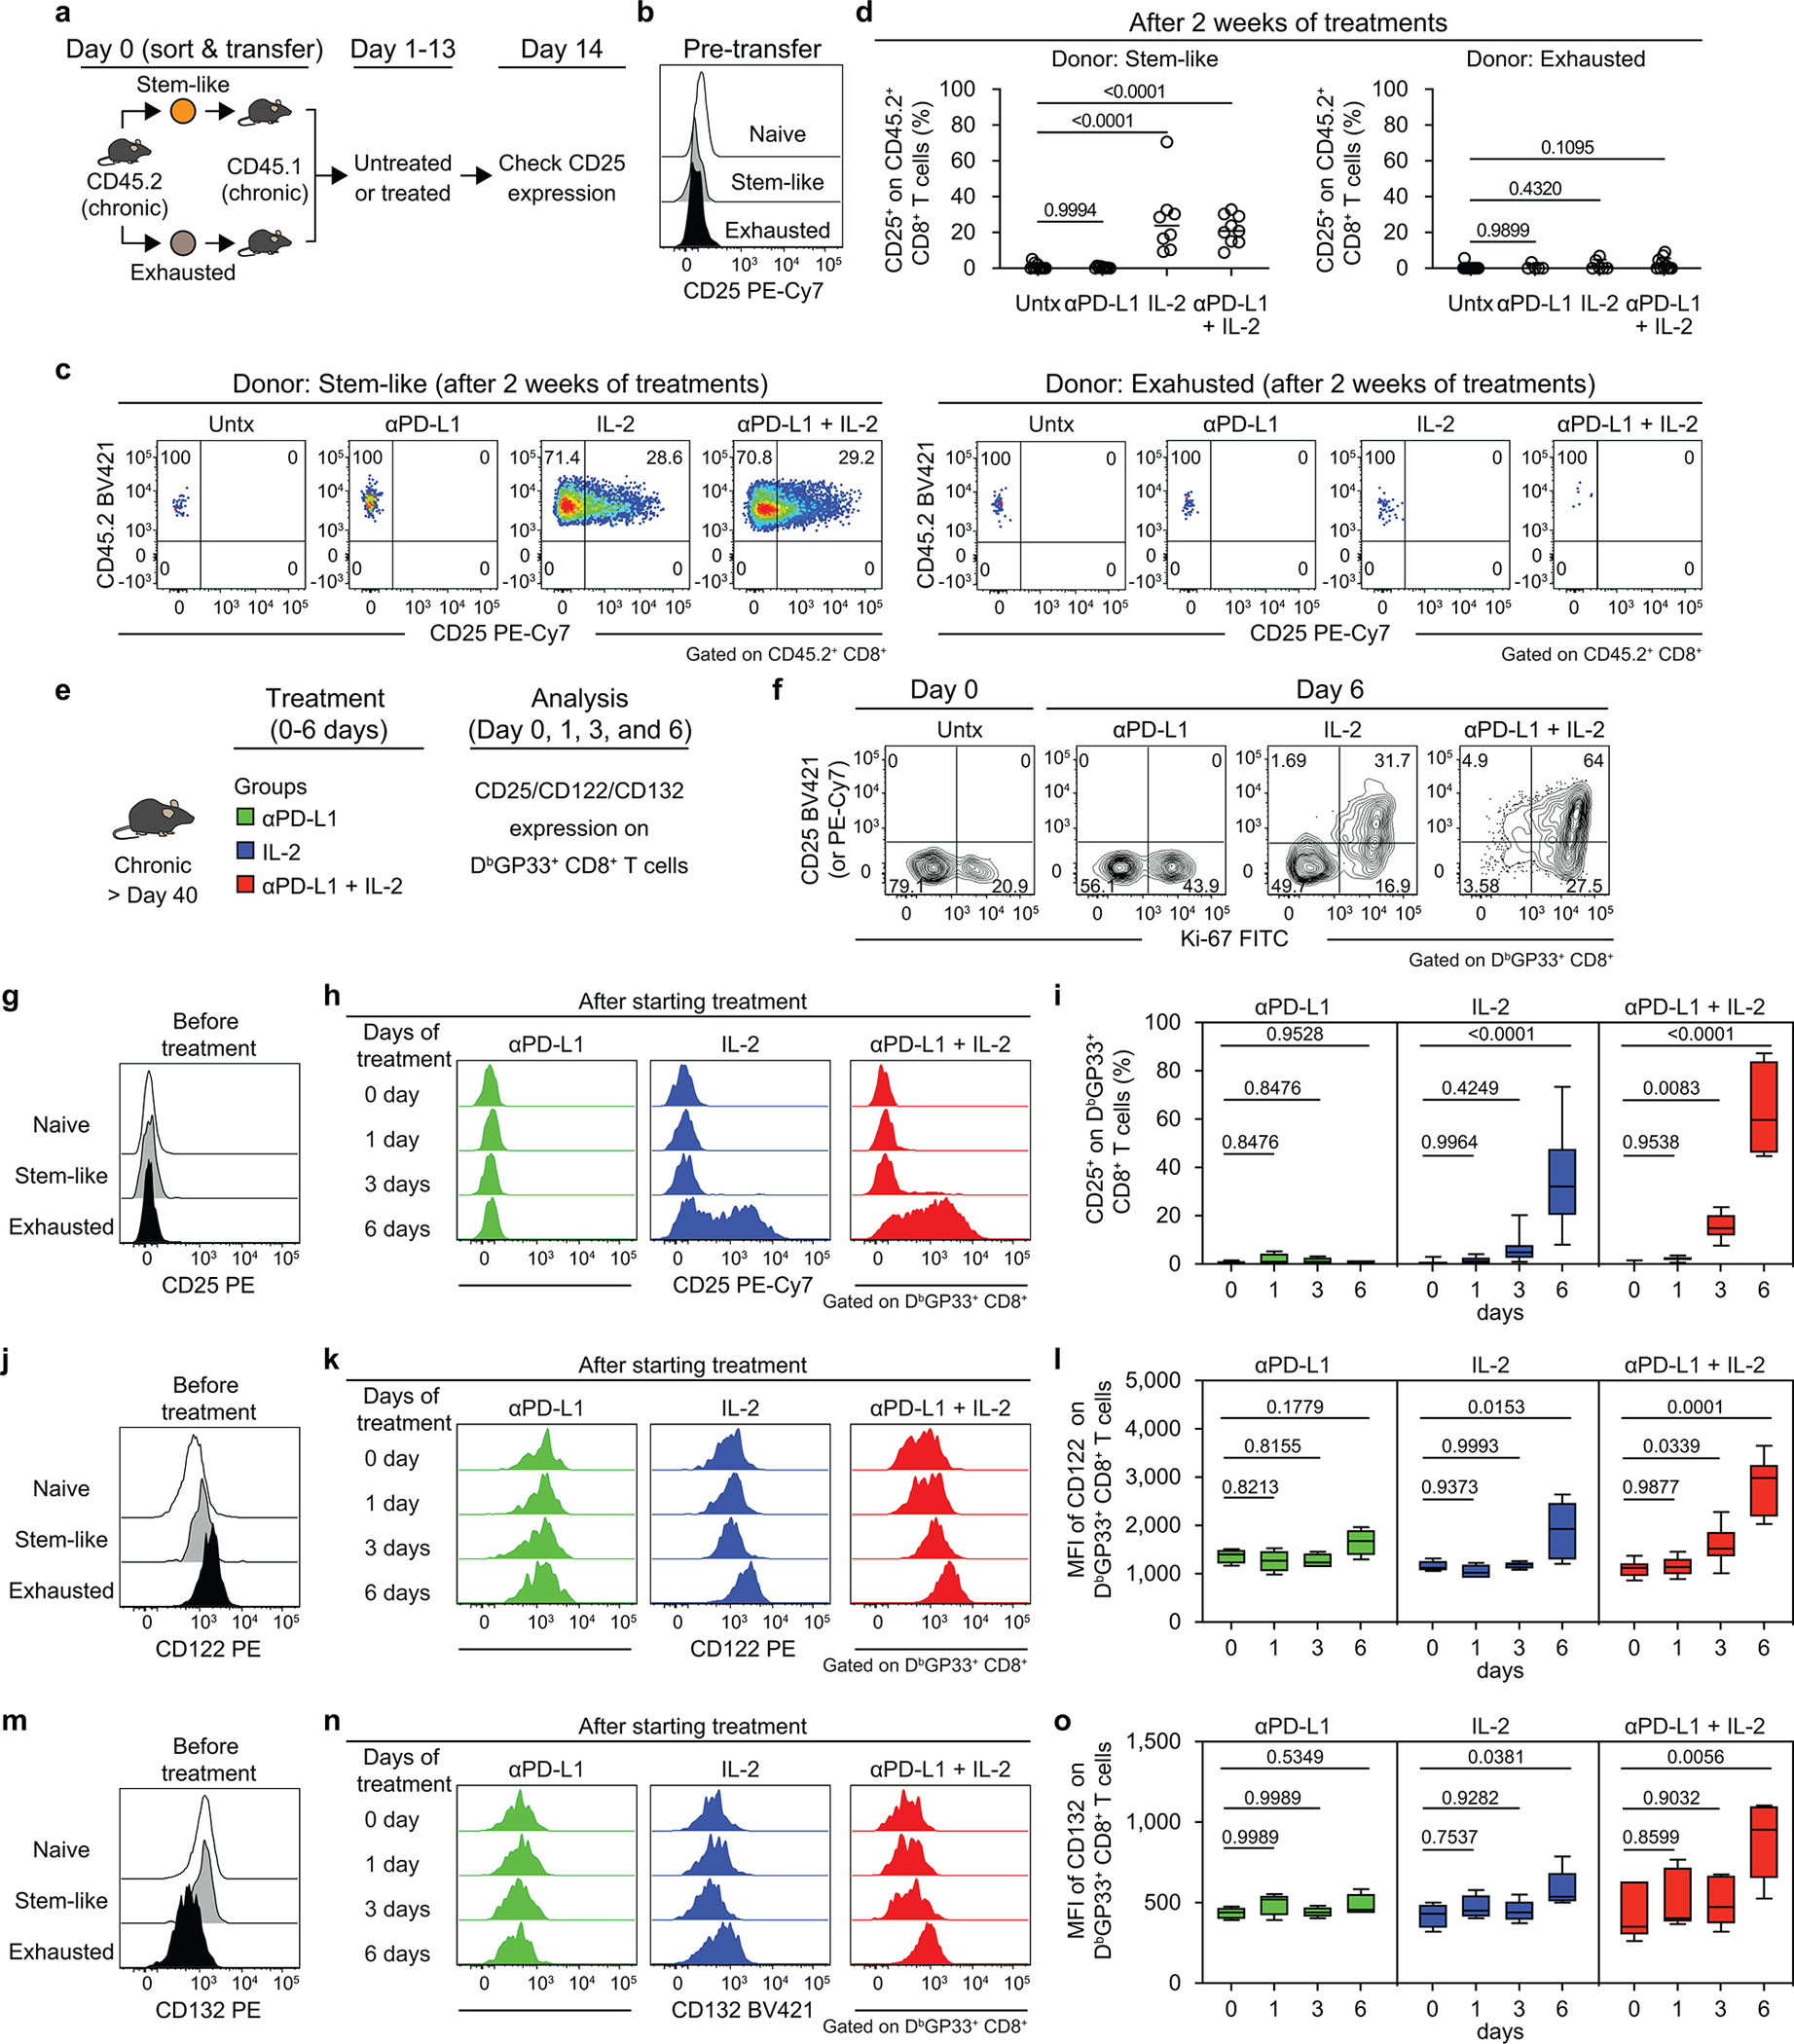
a, Experimental setup for panels b-d. Stem-like (PD-1+CXCR5+TIM3−) and exhausted (PD-1+CXCR5−TIM3+) CD8+ T-cell subsets were sorted from the spleens of LCMV chronically infected CD45.2+ mice and each subset was transferred into infection-matched CD45.1+ recipient mice. Groups of these mice were then either left untreated, given anti-PD-L1 antibody, IL-2 therapy, or combination therapy for 2 weeks. CD25 expression on donor CD45.2+ CD8+ T cells was checked before and after the treatments. b, Representative histogram of CD25 expression on the chronic CD8+ T-cell subsets pre-transfer. Naive (CD44lo) CD8+ T cells are also shown as a negative control. c, d, Representative FACS plots of CD25 expression and summary data of frequency of CD25+ cells in donor CD45.2+ CD8+ T cells originating from stem-like or exhausted CD8+ T cells after the indicated treatments. e, Experimental setup for panels f–o. LCMV chronically infected mice were treated with anti-PD-L1 antibody, IL-2 alone, or combination therapy. Mice were sacrificed on the indicated days and expression of CD25, CD122 and CD132 was examined on LCMV-specific CD8+ T cells in the spleen. f, Representative flow plots for the co-expression of CD25 and Ki-67 on DbGP33+ CD8+ T cells at day 0 or day 6 after treatment. g, j, m, Representative histograms showing the expression of CD25 (g), CD122 (j), and CD132 (m) on stem-like and exhausted LCMV-specific DbGP33+ subsets CD8+ T cells before starting the treatment of LCMV chronically infected mice. Naive cells are CD44lo CD8+ T cells present in the same host. h, k, n, Representative histograms showing the expression of CD25 (h), CD122 (k), and CD132 (n) on DbGP33+ CD8+ T cells at days 0–6 after starting the indicated treatment. i, l, o, Summary box plots for the frequency of CD25+ cells (i), MFI of CD122 (l) and MFI of CD132 (o) on DbGP33+ CD8+ T cells after the indicated treatments. Results were pooled from 2–5 experiments with at least 4 mice per group (a–o). Data are presented as mean and SD (d) or the box (25th to 75th percentiles), the whiskers (min to max), and the line (the median) (i, l, o) with p values. Statistical comparisons were performed using one-way ANOVA with Tukey’s multiple comparison test. Untx, untreated.
Extended Data Fig. 10. IL-2(V) does not synergize with PD-1 blockade during chronic LCMV infection.
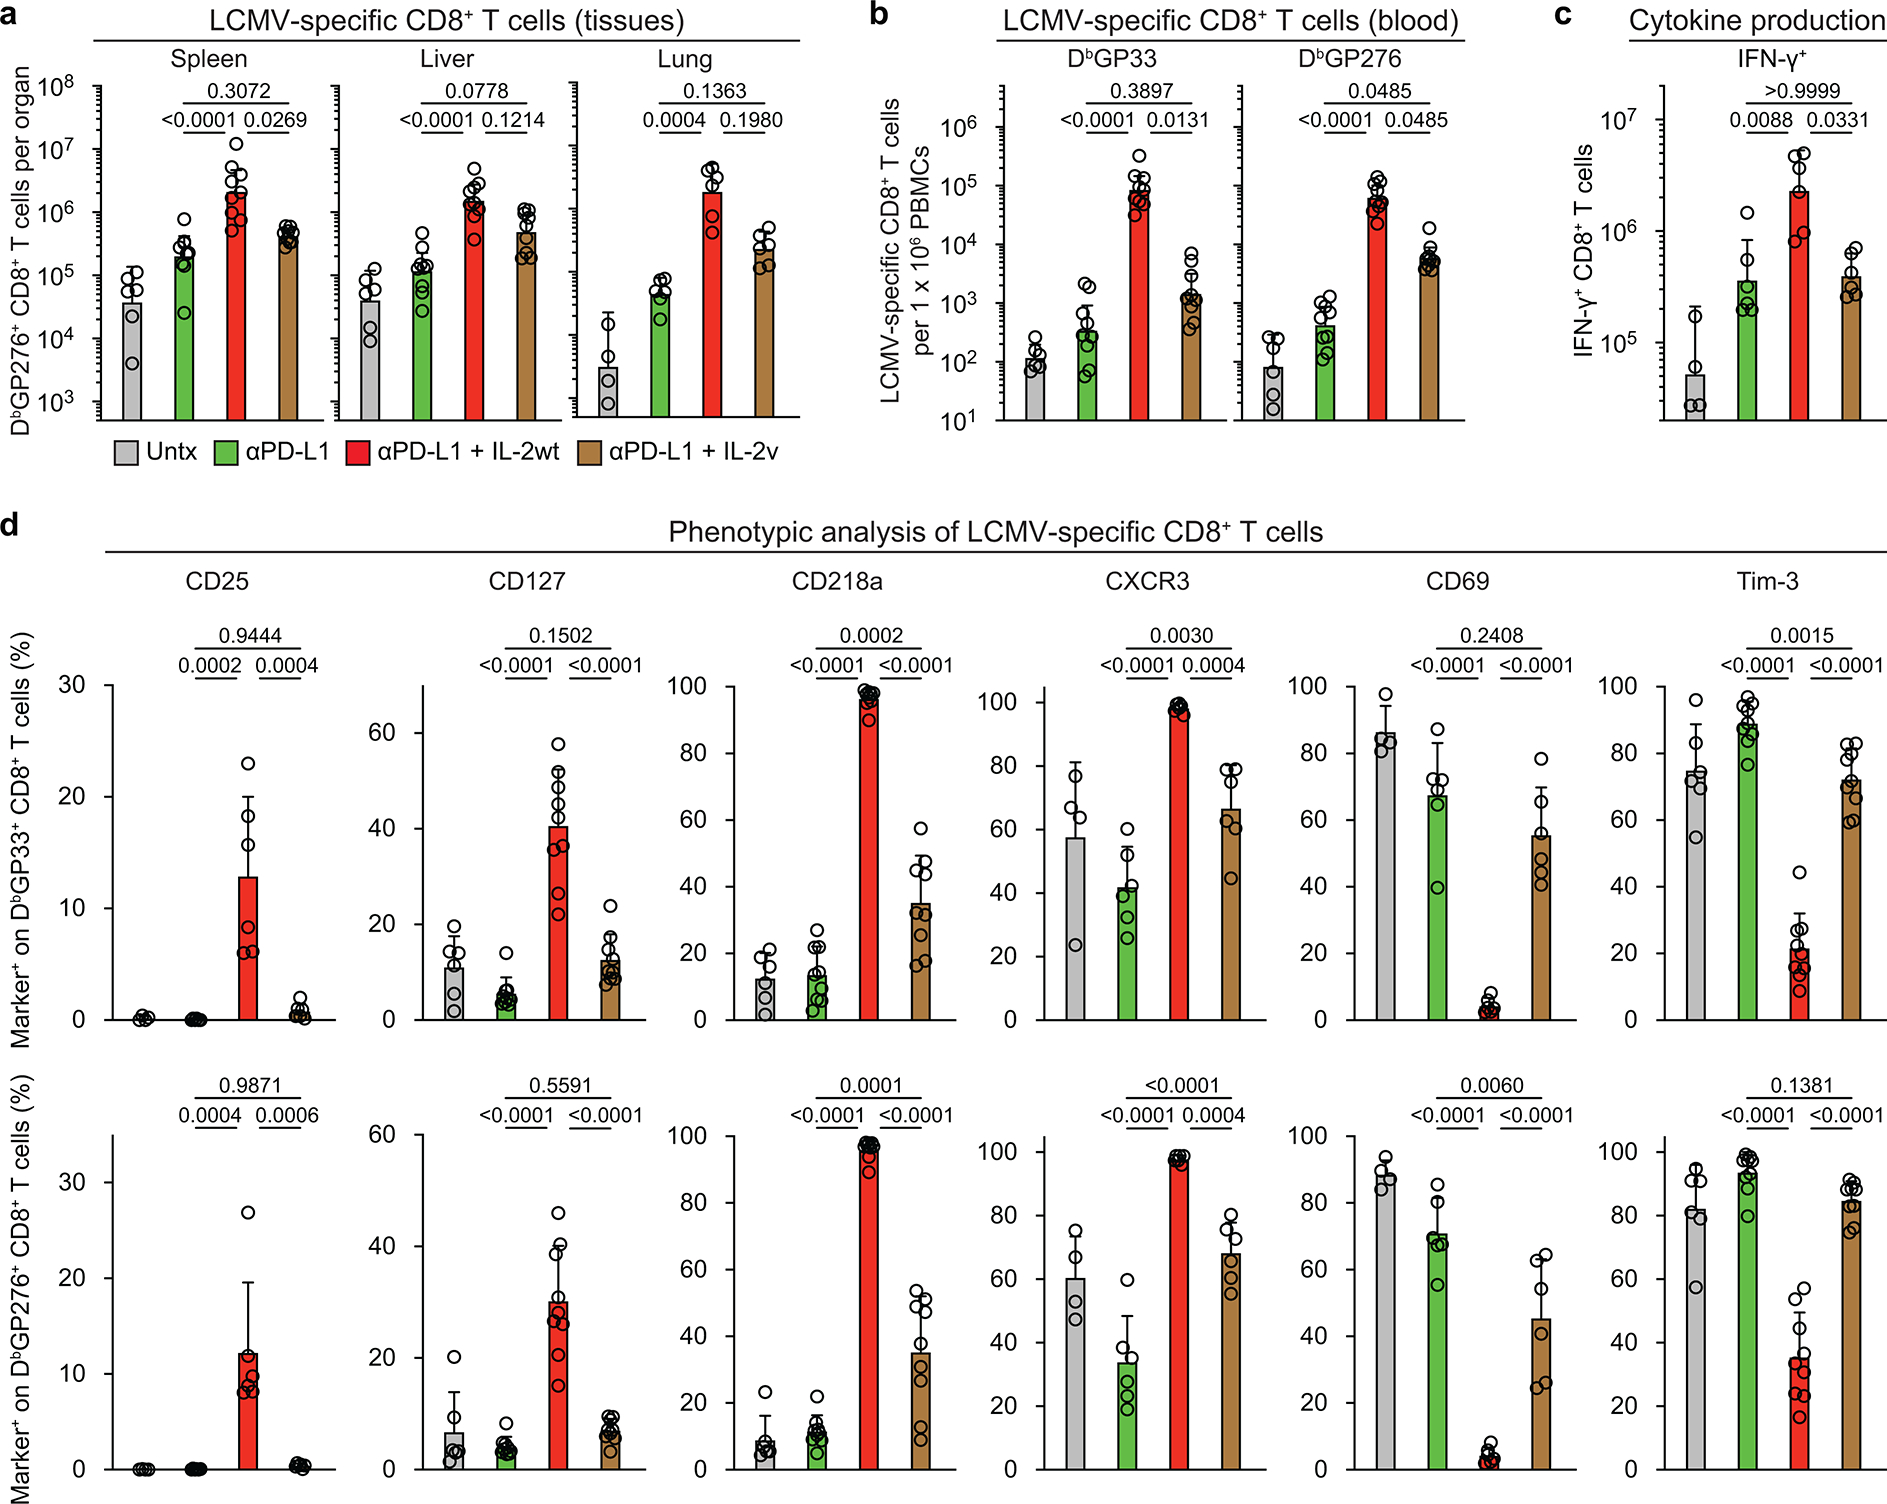
LCMV chronically infected mice were left untreated, or treated with anti-PD-L1 antibody, anti-PD-L1 plus IL-2 wild-type (IL-2(WT)), or anti-PD-L1 plus IL-2(V) (modified IL-2 with abolished CD25 binding) for 2 weeks. a, Numbers of DbGP276+ CD8+ T cells in the indicated tissues of the four groups of mice. b, Numbers of DbGP33+ and DbGP276+ CD8+ T cells in blood (per 1× 10⁶ PBMCs) in the four groups. c, Numbers of IFNγ+ CD8+ T cells in the different groups. Spleen cells were stimulated with pools of LCMV-specific peptides for 5 h and analyzed by intracellular cytokine staining. d, Summary data for the expression of various phenotypic markers on DbGP33+ and DbGP276+ CD8+ T cells after the different treatments. Results were pooled from 2–3 experiments with 2–3 mice per group in each experiment. Data are presented as geometric mean and 95% CI (a–c) or mean and SD (d) with p values. Statistical comparisons were performed using Kruskal-Wallis test with Dunn’s multiple comparison test (a-c) or one-way ANOVA with Tukey’s multiple comparison test (d). Untx, untreated.
Extended Data Fig. 11. IL-2(V) is biologically active in vivo but PD-1 + IL-2(V) combination therapy preferentially expands non-LCMV-specific PD-1 negative CD8+ T cells.
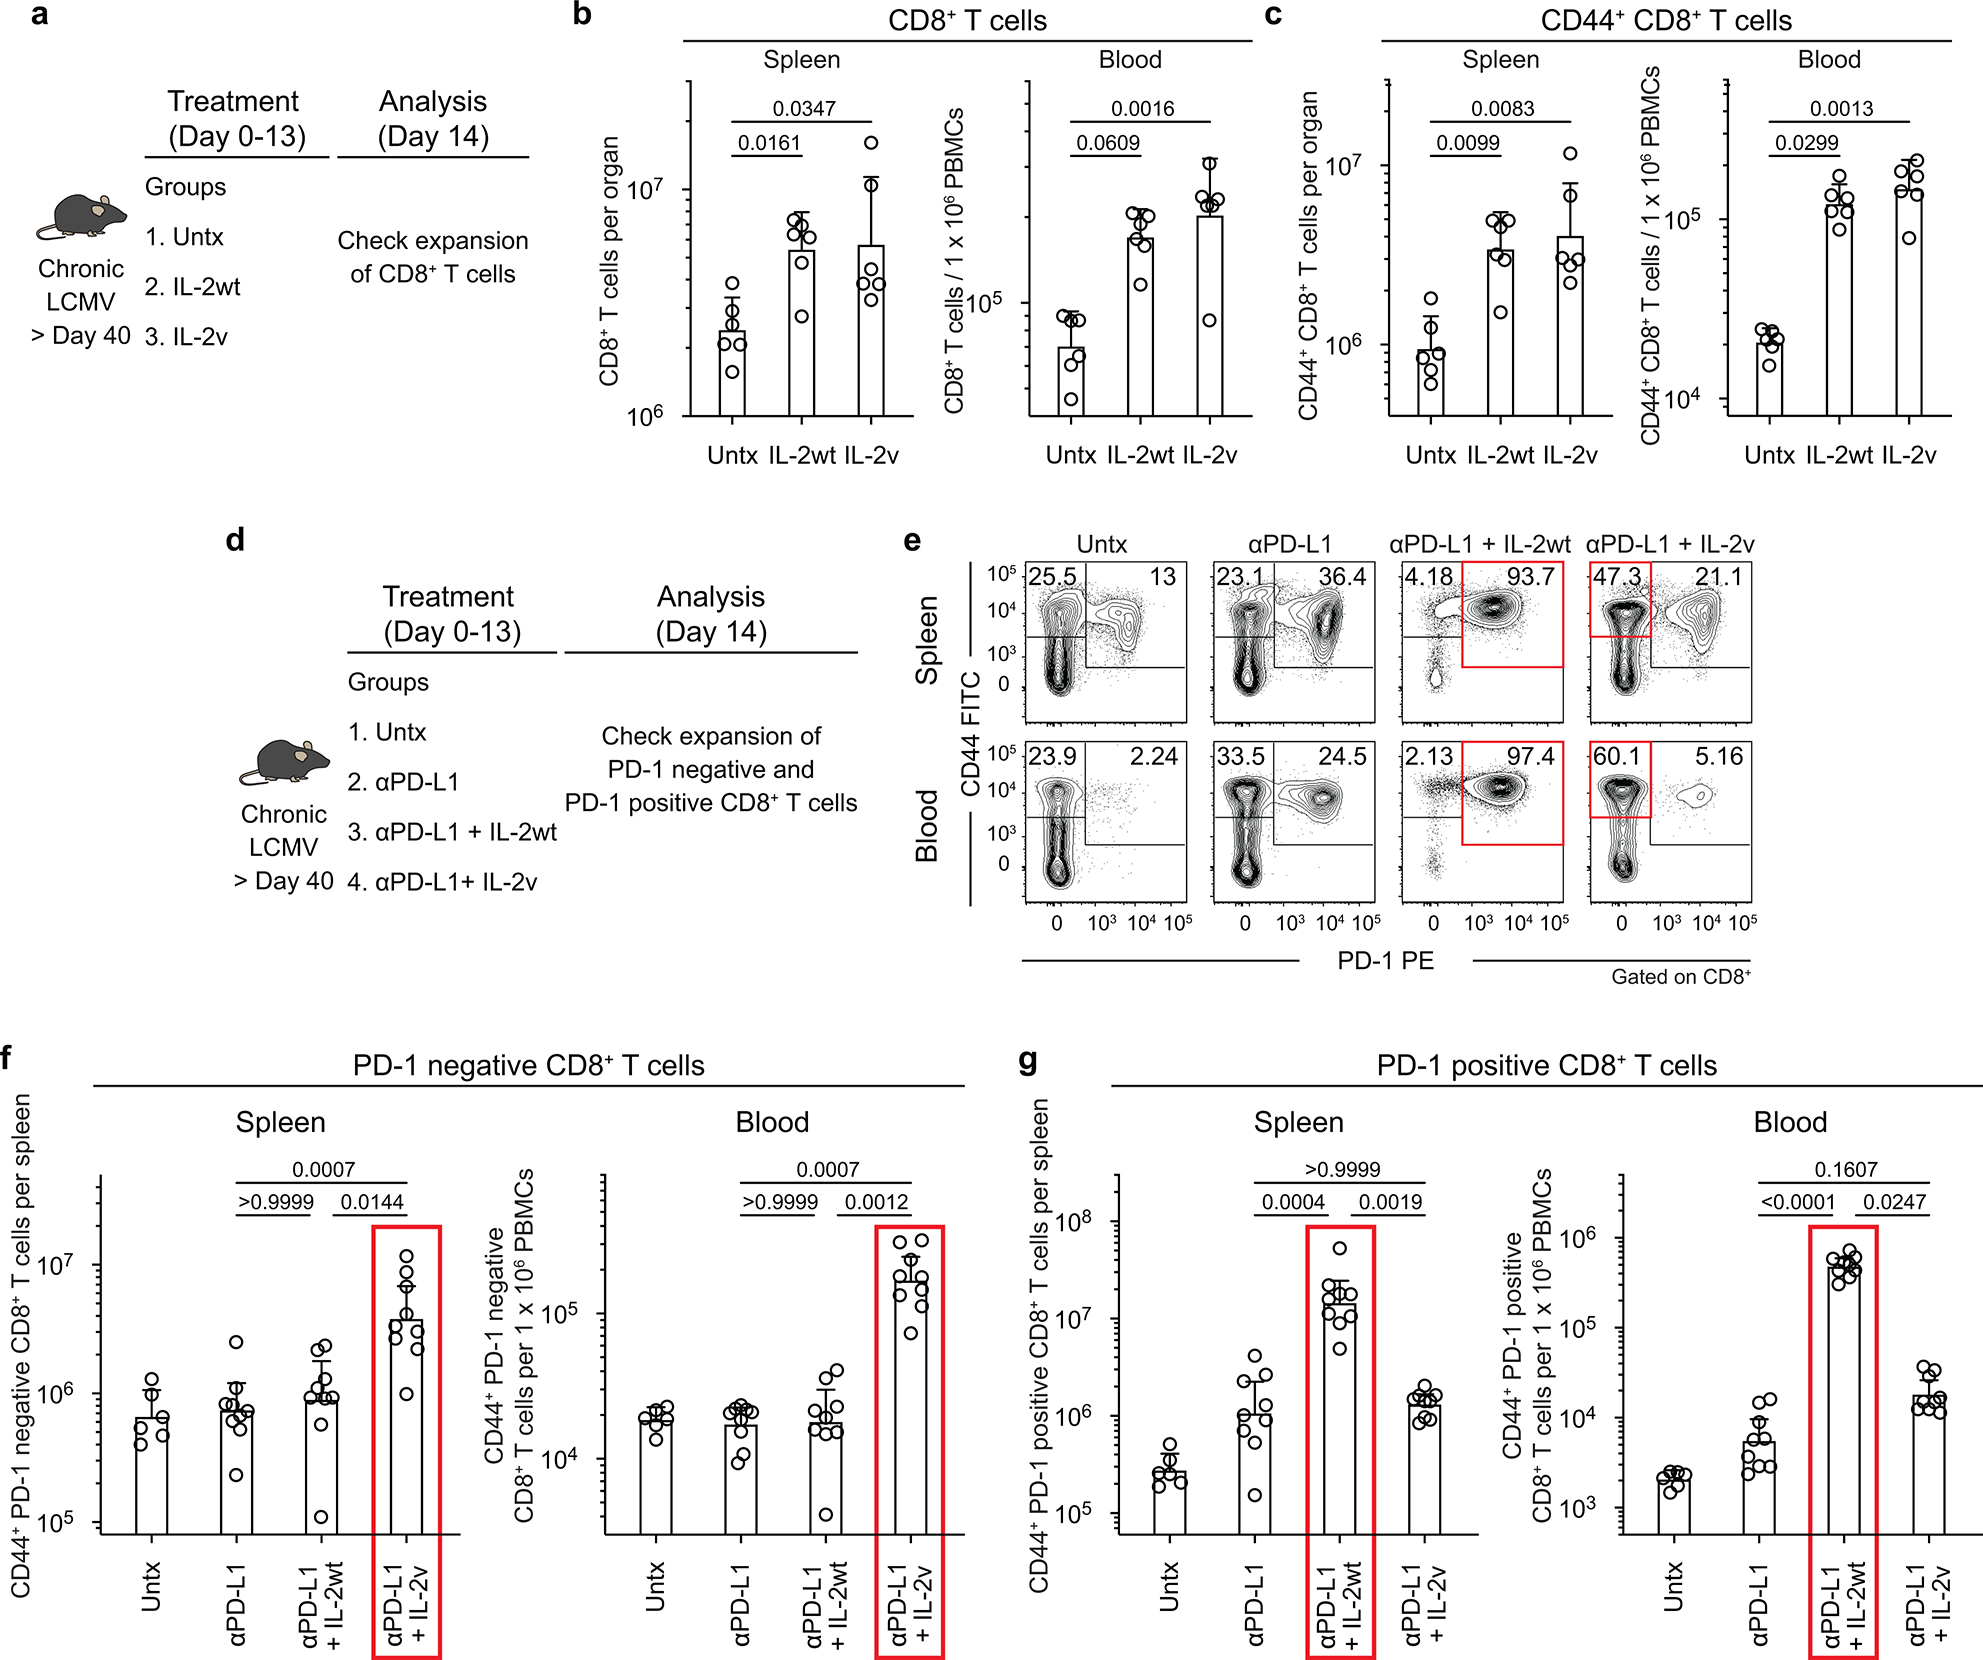
a, Experimental setup for b-c. Mice chronically infected with LCMV were left untreated, or treated with IL-2 wild-type (IL-2(WT)) or IL-2 variant (IL-2(V), modified IL-2 with abolished CD25 binding) for 2 weeks. Expansion of CD8+ T cells was examined in the spleen and blood in the three groups of mice. b, Numbers of CD8+ T cells. c, Numbers of CD44+ CD8+ T cells. d, Experimental setup for panels e–g. Chronically infected mice were untreated, or treated with anti-PD-L1 antibody, anti-PD-L1 plus IL-2(WT), or anti-PD-L1 plus IL-2(V) for 2 weeks. Expansion of PD-1 negative and PD-1 positive CD8+ T cells was examined in the spleen and blood in the four groups of mice. e, Representative FACS plots for CD44 and PD-1 expression on CD8+ T cells in the spleen and blood after the various treatments. f, Numbers of CD44+ PD-1 negative CD8+ T cells in the spleen and blood. g, Numbers of CD44+ PD-1 positive CD8+ T cells in the spleen and blood (per 1×10⁶ PBMCs) of the four groups. Results were pooled from 3 experiments with at least 6 mice per group. Data are presented as geometric mean and 95% CI (b, c, f, g) with p values. Red box highlights preferential expansion of PD-1 negative CD8+ T cells by combination therapy with anti-PD-L1 and IL-2(V) whereas combination therapy with anti-PD-L1 and IL-2(WT) expands PD-1 positive CD8+ T cells. Statistical comparisons were performed using Kruskal-Wallis test with Dunn’s multiple comparison test. Untx, untreated.
Extended Data Fig. 12. Effect of IL-2(WT) versus IL-2(V) on LCMV-specific CD8+ T cells during chronic infection.
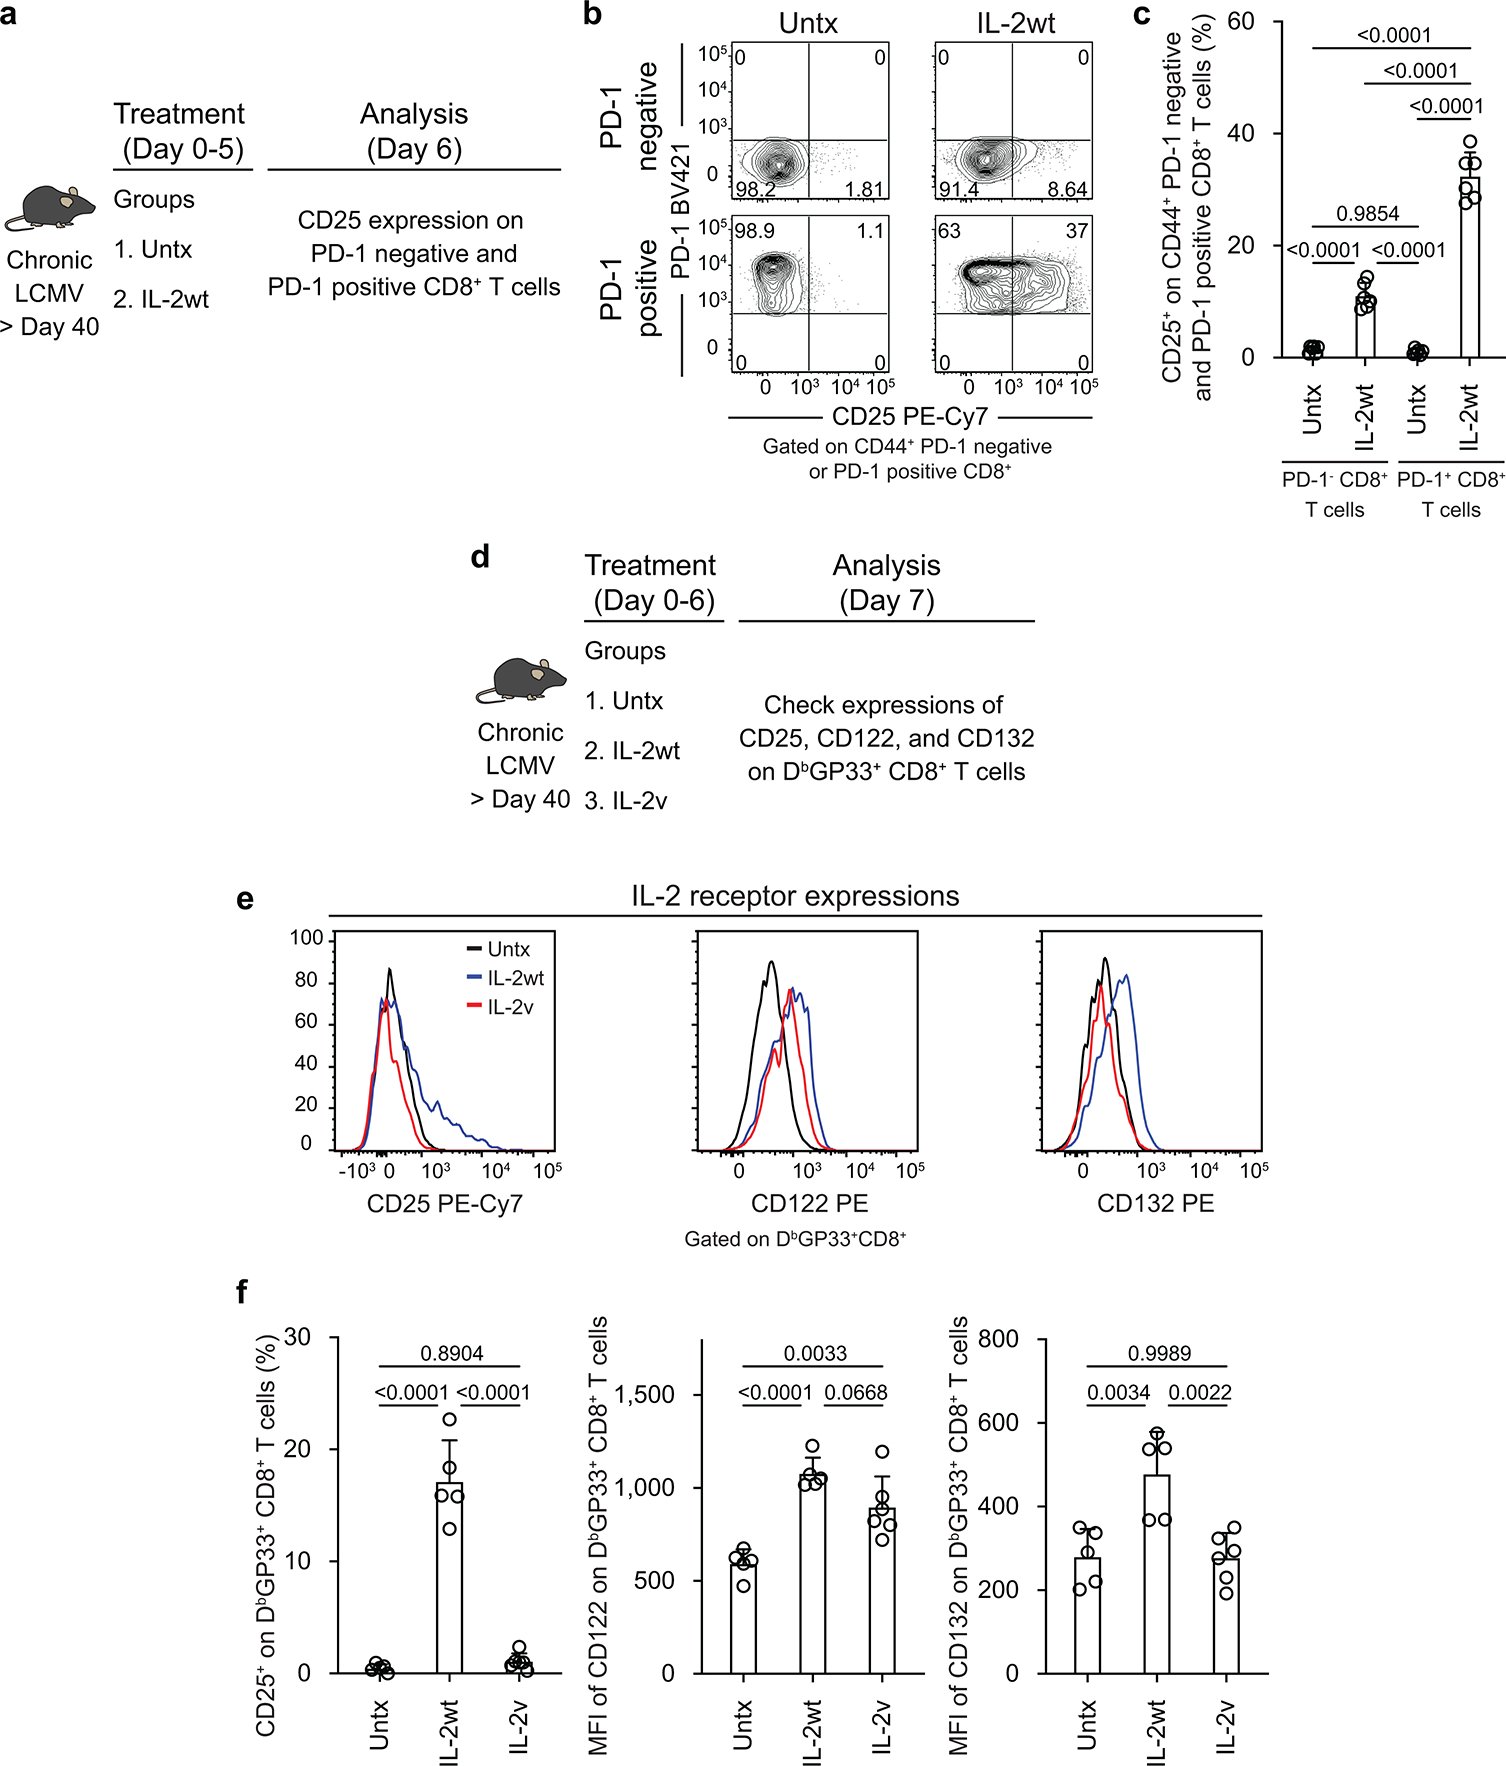
a, Experimental design for data in panels b and c. Mice chronically infected with LCMV (> 40 days post infection) were untreated or treated with IL-2 wild-type (IL-2(WT)) for 5 days, and CD25 expression was checked on PD-1negative and PD-1+ CD8+ T cells in the spleen. b, Representative FACS plots of CD25 expression. c, Summary plots of CD25 expression after IL-2(WT) and IL-2(V) treatments. d, Experimental design for data in panels e and f. Mice chronically infected with LCMV were untreated, treated with IL-2(WT) or treated with IL-2 variant (IL-2(V)) for 6 days. Expression of IL-2 receptors (CD25, CD122, and CD132) on LCMV-specific CD8+ T cells in the spleen were examined. e, f, Representative histograms (e) and summary plots (f) of expression of IL-2 receptors on DbGP33+ CD8+ T cells after indicated treatments. Results were pooled from 2 experiments with 2–3 mice per group in each experiment. Data are presented as mean and SD (c, f) with p values. Statistical comparisons were performed using one-way ANOVA with Tukey’s multiple comparison test. Untx, untreated.
Extended Data Fig. 13. Comparing the effects of IL-2 wt cytokine versus IL-2 variant cytokine in PD-1 combination therapy in the LCMV chronic infection model with CD4+ T-cell help.
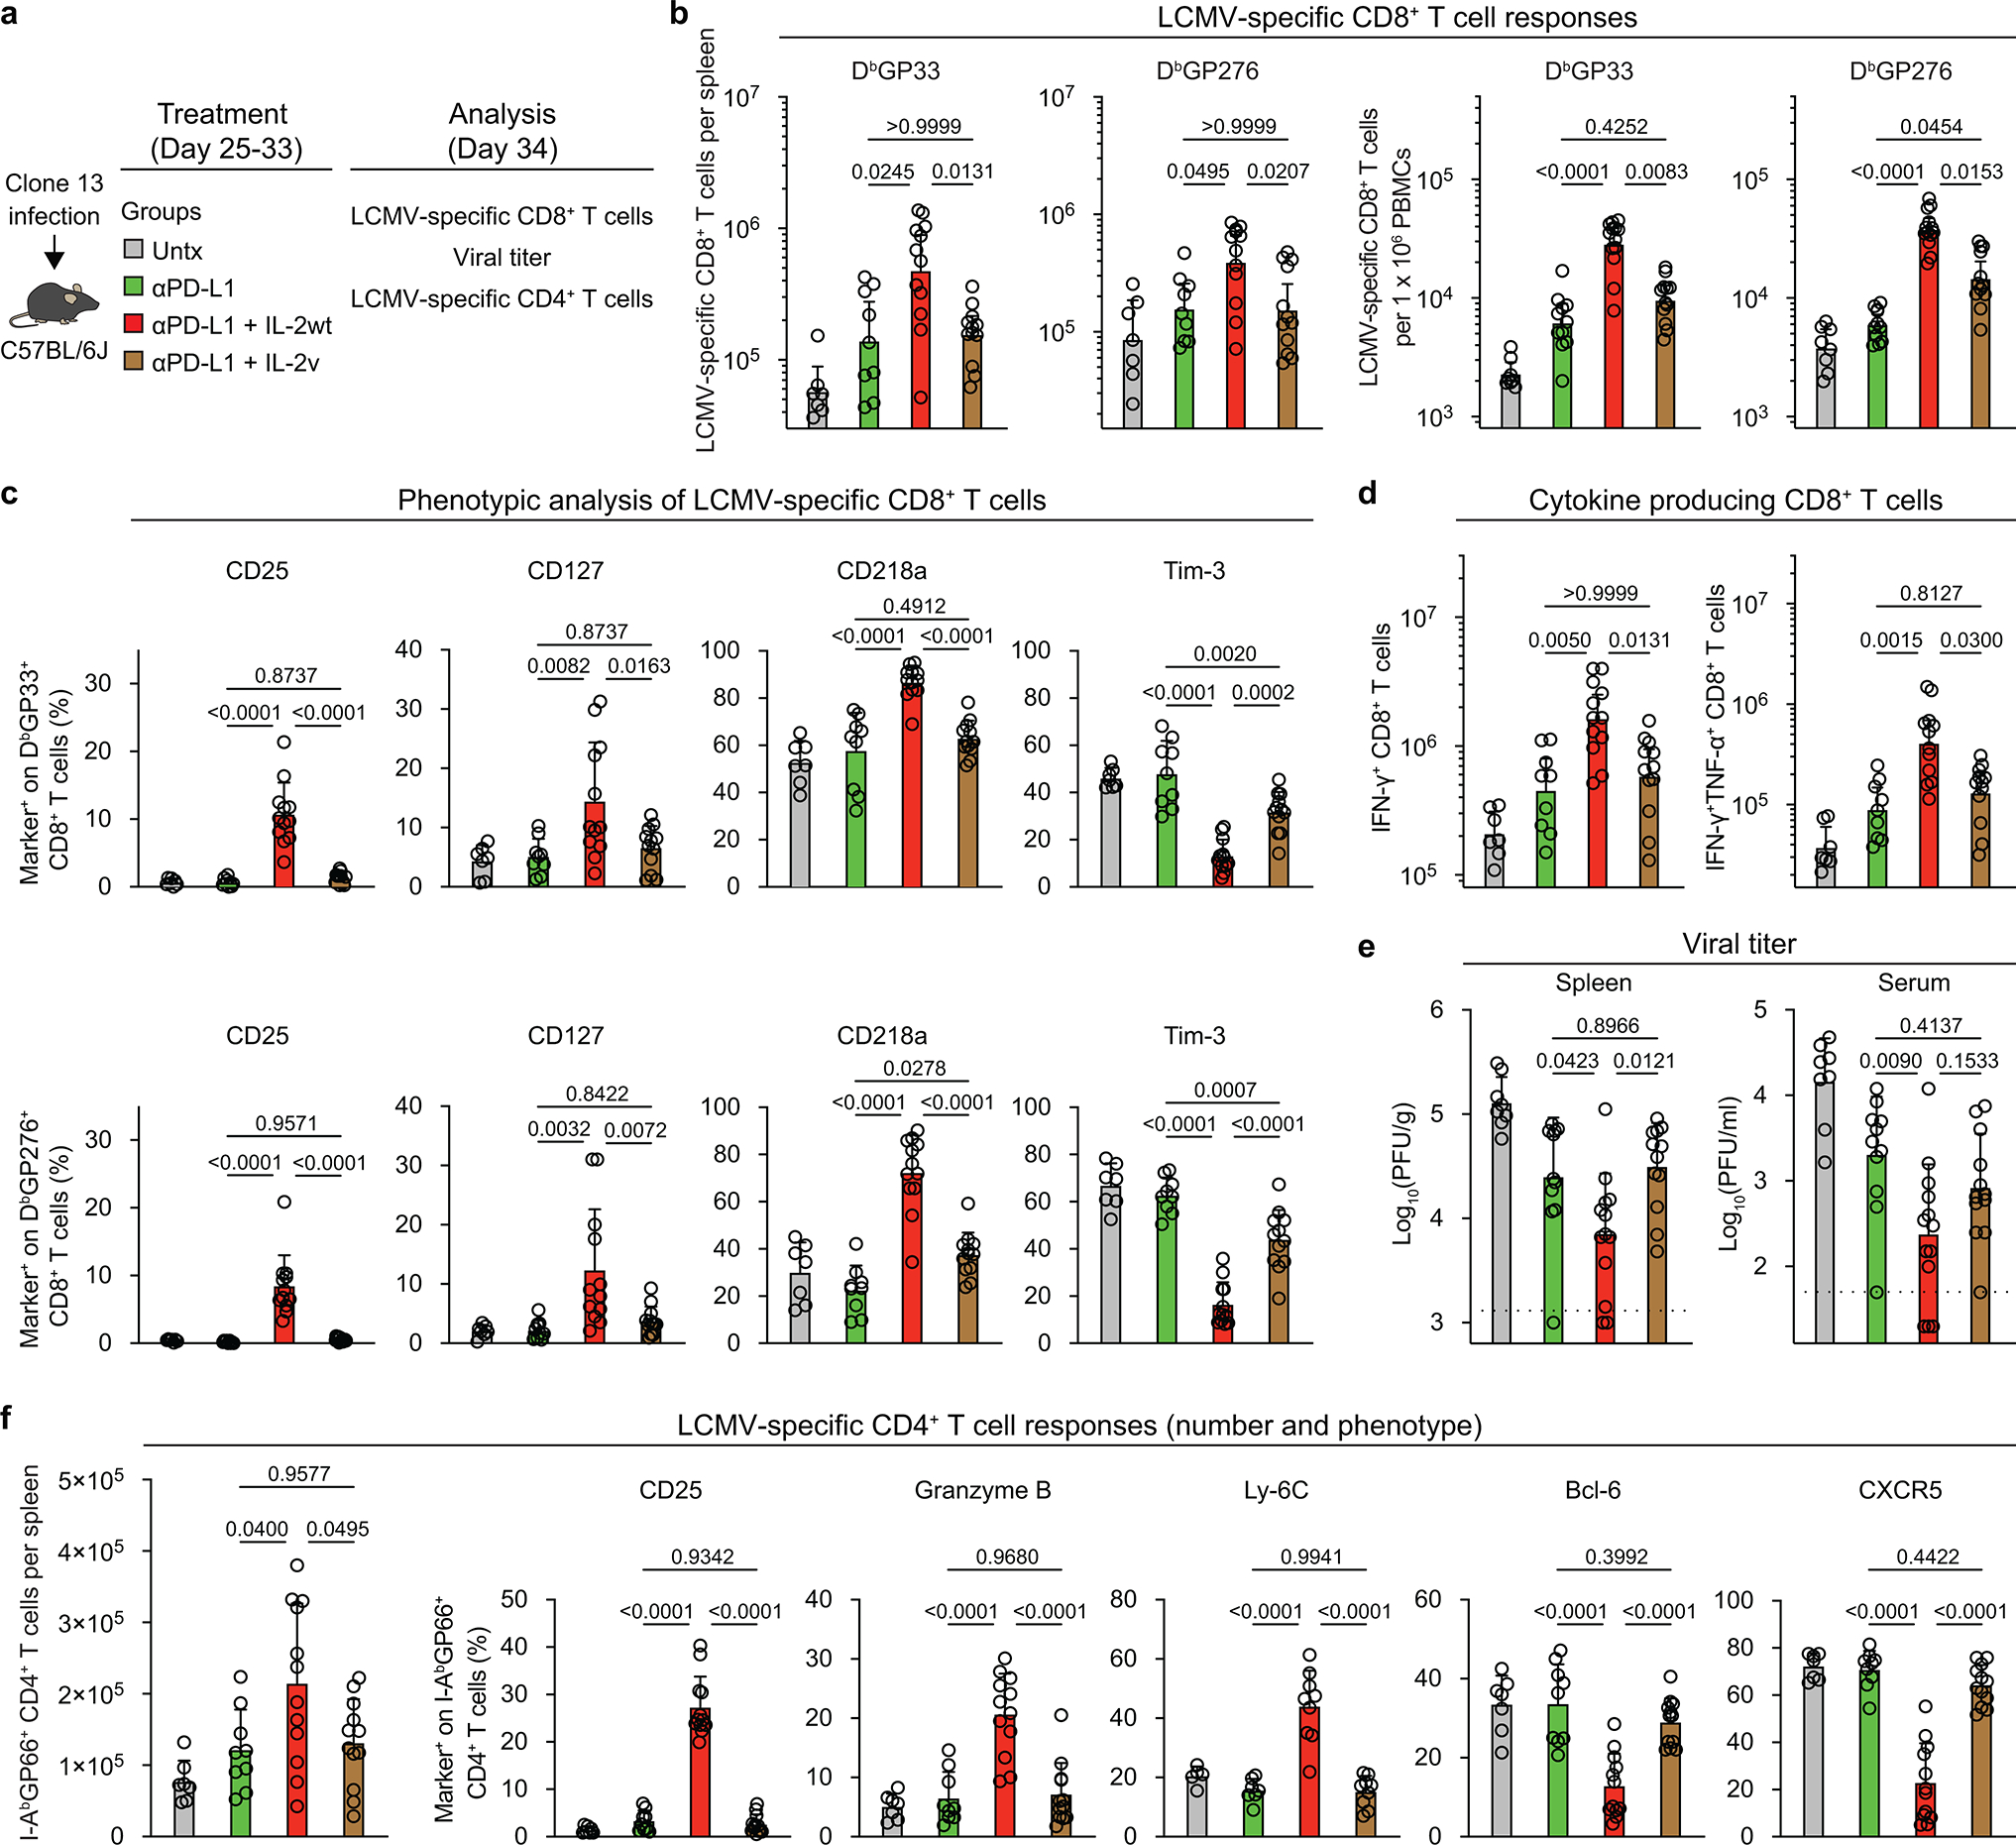
a, Experimental design. Mice infected with LCMV clone 13 (day 25 post-infection) were left untreated, or treated with anti-PD-L1 antibody, anti-PD-L1 plus IL-2 wild-type (IL-2(WT)), or anti-PD-L1 plus IL-2(V). b, Numbers of LCMV-specific DbGP33+ CD8+ T cells in the indicated tissues after the various treatments. c, Summary data for the expression of phenotypic markers on DbGP33+ or DbGP276+ CD8+ T cells in the spleen after the different treatments. d, Numbers of IFNγ+, and IFNγ+TNFα+ LCMV-specific CD8+ T cells in the four groups. Spleen cells were stimulated with pools of LCMV-specific peptides for 5 h and analyzed by intracellular staining of cytokines e, Viral titre in spleen and serum in the four groups of mice. Dotted line indicates the limit of detection. Results were pooled from 3–4 experiments with 2–5 mice per group in each experiment. Data are presented as geometric mean and 95% CI (b, d) or mean and SD (c, e, f) with p values. Statistical comparisons were performed using Kruskal-Wallis test with Dunn’s multiple comparison test (b, d, f (number of LCMV-specific CD4+ T cells)) or one-way ANOVA with Tukey’s multiple comparison test (c, e, f (phenotype of LCMV-specific CD4+ T cells)). Untx, untreated.
Supplementary Material
Acknowledgements
This work was supported by National Institutes of Health (NIH) grants R01AI030048 (to R.A.), P01AI056299 (to R.A., G.J.F., and A.H.S.), P50CA101942 (to G.J.F. and A.H.S.), P01CA236749 (to G.J.F. and A.H.S.), R01AI129191 (to J.J.G.), P50CA217691 (to S.S.R, and R.A.), and the Roche pRED ROADS program (ROADS grant 55440 funded by Roche, ID ROADS-034; to R.A.). We thank Emory University School of Medicine Flow Cytometry Core (K. Fife and R. Karaffa), Yerkes Nonhuman Primate Genomics Core (K. Pellegrini and S. Bosinger; NIH P51OD011132), Emory Integrated Genomics Core (EIGC) Shared Resource of Winship Cancer Institute of Emory University and NIH/NCI (L. Griffiths; 2P30CA138292-04), Cancer Tissue and Pathology Shared Resource Facility of the Winship Cancer Institute of Emory University and NIH/NCI (P30CA138292), and the Mouse Histology and Phenotyping Lab at the Northwestern University Robert H. Lurie Comprehensive Cancer Center and NIH/NCI (P30CA060553). W.H.H. is supported by NIH grant K99AI153736 and a Cancer Research Institute Irvington Postdoctoral Fellowship. S.J.I. is supported by National Research Foundation of Korea (NRF) grant 2020R1F1A1075668 funded by the Korean government (MSIT). The content is solely the responsibility of the authors and does not necessarily represent the official views of the National Institutes of Health.
Footnotes
Competing interests
R.A. has patents related to PD-1 pathway (8,652,465 and 9,457,080) licensed to Roche. A.H.S has patents and pending royalties from Roche and Novartis on intellectual property on the PD-1 pathway (patent 7,432,059 with royalties paid from Roche, Merck, Bristol Myers Squibb, EMD-Serono, Boehringer-Ingelheim, AstraZeneca, Leica, Mayo Clinic, Dako and Novartis; patent 7,722,868 with royalties paid from Roche, Merck, Bristol Myers Squibb, EMD-Serono, Boehringer-Ingelheim, AstraZeneca, Leica, Mayo Clinic, Dako and Novartis; patents 8,652,465 and 9,457,080 licensed to Roche; patents 9,683,048, 9,815,898, 9,845,356, 10,202,454 and 10,457,733 licensed to Novartis; and patents 9,580,684, 9,988,452 and 10,370,446 issued to none). G.J.F. has patents and pending royalties on the PD-1-PD-L1 pathway from Roche, Merck MSD, Bristol Myers Squibb, Merck KGaA, Boehringer-Ingelheim, AstraZeneca, Dako, Leica, Mayo Clinic and Novartis (see Supplementary Data 4). G.J.F. has served on advisory boards for Roche, Bristol Myers Squibb, Xios, Origimed, Triursus, iTeos, NextPoint, IgM, Jubilant, Trillium, GV20 and Geode. G.J.F. has equity in Nextpoint, Triursus, Xios, iTeos, IgM, GV20 and Geode. V.T., C.K. and P.U. are employed by Roche with stock options. C.K. and P.U have a patent application with Roche: WO2012107417. The other authors declare no competing interests.
Supplementary information
Supplementary Information is available for this paper.
Reporting summary
Further information on research design is available in the Nature Research Reporting Summary linked to this paper.
Code availability
Custom code for RNA-seq, scRNA-seq, and ATAC-seq data analysis are available from the corresponding author upon reasonable request.
Data availability
All processed RNA-seq, scRNA-seq, and ATAC-seq data that support the findings of this study have been deposited in the Gene Expression Omnibus under accession code GSE206739. Previously published Affymetrix microarrays (GSE9650)16, RNA-seq (PRJNA412602)17, and ATAC-seq data (PRJNA546023)30 are included for the analysis in this study.
References
- 1.West EE et al. PD-L1 blockade synergizes with IL-2 therapy in reinvigorating exhausted T cells. J Clin Invest 123, 2604–2615, doi: 10.1172/JCI67008 (2013). [DOI] [PMC free article] [PubMed] [Google Scholar]
- 2.Pol JG, Caudana P, Paillet J, Piaggio E & Kroemer G Effects of interleukin-2 in immunostimulation and immunosuppression. J Exp Med 217, e20191247, doi: 10.1084/jem.20191247 (2019). [DOI] [PMC free article] [PubMed] [Google Scholar]
- 3.Overwijk WW, Tagliaferri MA & Zalevsky J Engineering IL-2 to Give New Life to T Cell Immunotherapy. Annu Rev Med 72, 281–311, doi: 10.1146/annurev-med-073118-011031 (2021). [DOI] [PubMed] [Google Scholar]
- 4.Hashimoto M et al. CD8 T Cell Exhaustion in Chronic Infection and Cancer: Opportunities for Interventions. Annu Rev Med 69, 301–318, doi: 10.1146/annurev-med-012017-043208 (2018). [DOI] [PubMed] [Google Scholar]
- 5.McLane LM, Abdel-Hakeem MS & Wherry EJ CD8 T Cell Exhaustion During Chronic Viral Infection and Cancer. Annu Rev Immunol 37, 457–495, doi: 10.1146/annurev-immunol-041015-055318 (2019). [DOI] [PubMed] [Google Scholar]
- 6.Leonard WJ, Lin JX & O’Shea JJ The γc Family of Cytokines: Basic Biology to Therapeutic Ramifications. Immunity 50, 832–850, doi: 10.1016/j.immuni.2019.03.028 (2019). [DOI] [PubMed] [Google Scholar]
- 7.Gillis S, Ferm MM, Ou W & Smith KA T Cell Growth Factor: Parameters of Production and a Quantitative Microassay for Activity. J Immunol 120, 2027 (1978). [PubMed] [Google Scholar]
- 8.He R et al. Follicular CXCR5-expressing CD8+ T cells curtail chronic viral infection. Nature 537, 412–428, doi: 10.1038/nature19317 (2016). [DOI] [PubMed] [Google Scholar]
- 9.Hudson WH et al. Proliferating Transitory T Cells with an Effector-like Transcriptional Signature Emerge from PD-1+ Stem-like CD8+ T Cells during Chronic Infection. Immunity 51, 1043–1058.e1044, doi: 10.1016/j.immuni.2019.11.002 (2019). [DOI] [PMC free article] [PubMed] [Google Scholar]
- 10.Im SJ et al. Defining CD8+ T cells that provide the proliferative burst after PD-1 therapy. Nature 537, 417–421, doi: 10.1038/nature19330 (2016). [DOI] [PMC free article] [PubMed] [Google Scholar]
- 11.Im SJ, Konieczny BT, Hudson WH, Masopust D & Ahmed R PD-1+ stemlike CD8 T cells are resident in lymphoid tissues during persistent LCMV infection. Proc Natl Acad Sci U S A 117, 4292–4299, doi: 10.1073/pnas.1917298117 (2020). [DOI] [PMC free article] [PubMed] [Google Scholar]
- 12.Leong YA et al. CXCR5(+) follicular cytotoxic T cells control viral infection in B cell follicles. Nat Immunol 17, 1187–1196, doi: 10.1038/ni.3543 (2016). [DOI] [PubMed] [Google Scholar]
- 13.Utzschneider DT et al. T Cell Factor 1-Expressing Memory-like CD8(+) T Cells Sustain the Immune Response to Chronic Viral Infections. Immunity 45, 415–427, doi: 10.1016/j.immuni.2016.07.021 (2016). [DOI] [PubMed] [Google Scholar]
- 14.Zander R et al. CD4+ T Cell Help Is Required for the Formation of a Cytolytic CD8+ T Cell Subset that Protects against Chronic Infection and Cancer. Immunity 51, 1028–1042.e1024, doi: 10.1016/j.immuni.2019.10.009 (2019). [DOI] [PMC free article] [PubMed] [Google Scholar]
- 15.Seo H et al. TOX and TOX2 transcription factors cooperate with NR4A transcription factors to impose CD8(+) T cell exhaustion. Proc Natl Acad Sci U S A 116, 12410–12415, doi: 10.1073/pnas.1905675116 (2019). [DOI] [PMC free article] [PubMed] [Google Scholar]
- 16.Wherry EJ et al. Molecular signature of CD8+ T cell exhaustion during chronic viral infection. Immunity 27, 670–684, doi: 10.1016/j.immuni.2007.09.006 (2007). [DOI] [PubMed] [Google Scholar]
- 17.Hudson WH et al. Expression of novel long noncoding RNAs defines virus-specific effector and memory CD8+ T cells. Nat Commun 10, 196, doi: 10.1038/s41467-018-07956-7 (2019). [DOI] [PMC free article] [PubMed] [Google Scholar]
- 18.Joshi NS et al. Inflammation directs memory precursor and short-lived effector CD8(+) T cell fates via the graded expression of T-bet transcription factor. Immunity 27, 281–295, doi: 10.1016/j.immuni.2007.07.010 (2007). [DOI] [PMC free article] [PubMed] [Google Scholar]
- 19.Kaech SM et al. Selective expression of the interleukin 7 receptor identifies effector CD8 T cells that give rise to long-lived memory cells. Nat Immunol 4, 1191–1198, doi: 10.1038/ni1009 (2003). [DOI] [PubMed] [Google Scholar]
- 20.Sarkar S et al. Functional and genomic profiling of effector CD8 T cell subsets with distinct memory fates. J Exp Med 205, 625–640, doi: 10.1084/jem.20071641 (2008). [DOI] [PMC free article] [PubMed] [Google Scholar]
- 21.Chow MT et al. Intratumoral Activity of the CXCR3 Chemokine System Is Required for the Efficacy of Anti-PD-1 Therapy. Immunity, doi: 10.1016/j.immuni.2019.04.010 (2019). [DOI] [PMC free article] [PubMed] [Google Scholar]
- 22.Hickman HD et al. CXCR3 chemokine receptor enables local CD8(+) T cell migration for the destruction of virus-infected cells. Immunity 42, 524–537, doi: 10.1016/j.immuni.2015.02.009 (2015). [DOI] [PMC free article] [PubMed] [Google Scholar]
- 23.Pauken KE et al. Epigenetic stability of exhausted T cells limits durability of reinvigoration by PD-1 blockade. Science 354, 1160–1165, doi: 10.1126/science.aaf2807 (2016). [DOI] [PMC free article] [PubMed] [Google Scholar]
- 24.Sen DR et al. The epigenetic landscape of T cell exhaustion. Science 354, 1165–1169, doi: 10.1126/science.aae0491 (2016). [DOI] [PMC free article] [PubMed] [Google Scholar]
- 25.Buenrostro JD, Giresi PG, Zaba LC, Chang HY & Greenleaf WJ Transposition of native chromatin for fast and sensitive epigenomic profiling of open chromatin, DNA-binding proteins and nucleosome position. Nat Methods 10, 1213–1218, doi: 10.1038/nmeth.2688 (2013). [DOI] [PMC free article] [PubMed] [Google Scholar]
- 26.McLean CY et al. GREAT improves functional interpretation of cis-regulatory regions. Nat Biotechnol 28, 495–501, doi: 10.1038/nbt.1630 (2010). [DOI] [PMC free article] [PubMed] [Google Scholar]
- 27.Alfei F et al. TOX reinforces the phenotype and longevity of exhausted T cells in chronic viral infection. Nature 571, 265–269, doi: 10.1038/s41586-019-1326-9 (2019). [DOI] [PubMed] [Google Scholar]
- 28.Khan O et al. TOX transcriptionally and epigenetically programs CD8(+) T cell exhaustion. Nature 571, 211–218, doi: 10.1038/s41586-019-1325-x (2019). [DOI] [PMC free article] [PubMed] [Google Scholar]
- 29.Scott AC et al. TOX is a critical regulator of tumour-specific T cell differentiation. Nature 571, 270–274, doi: 10.1038/s41586-019-1324-y (2019). [DOI] [PMC free article] [PubMed] [Google Scholar]
- 30.Jadhav RR et al. Epigenetic signature of PD-1+ TCF1+ CD8 T cells that act as resource cells during chronic viral infection and respond to PD-1 blockade. Proc Natl Acad Sci U S A 116, 14113–14118, doi: 10.1073/pnas.1903520116 (2019). [DOI] [PMC free article] [PubMed] [Google Scholar]
- 31.Mueller SN et al. PD-L1 has distinct functions in hematopoietic and nonhematopoietic cells in regulating T cell responses during chronic infection in mice. J Clin Invest 120, 2508–2515, doi: 10.1172/jci40040 (2010). [DOI] [PMC free article] [PubMed] [Google Scholar]
- 32.Juneja VR et al. PD-L1 on tumor cells is sufficient for immune evasion in immunogenic tumors and inhibits CD8 T cell cytotoxicity. J Exp Med 214, 895–904, doi: 10.1084/jem.20160801 (2017). [DOI] [PMC free article] [PubMed] [Google Scholar]
- 33.Lau J et al. Tumour and host cell PD-L1 is required to mediate suppression of anti-tumour immunity in mice. Nat Commun 8, 14572, doi: 10.1038/ncomms14572 (2017). [DOI] [PMC free article] [PubMed] [Google Scholar]
- 34.Plitas G & Rudensky AY Regulatory T Cells in Cancer. Annu Rev Cancer Biol 4, 459–477, doi: 10.1146/annurev-cancerbio-030419-033428 (2020). [DOI] [Google Scholar]
- 35.Malek TR & Castro I Interleukin-2 Receptor Signaling: At the Interface between Tolerance and Immunity. Immunity 33, 153–165, doi: 10.1016/j.immuni.2010.08.004 (2010). [DOI] [PMC free article] [PubMed] [Google Scholar]
- 36.Huss DJ et al. Anti-CD25 monoclonal antibody Fc variants differentially impact regulatory T cells and immune homeostasis. Immunology 148, 276–286, doi: 10.1111/imm.12609 (2016). [DOI] [PMC free article] [PubMed] [Google Scholar]
- 37.Klein C et al. Cergutuzumab amunaleukin (CEA-IL2v), a CEA-targeted IL-2 variant-based immunocytokine for combination cancer immunotherapy: Overcoming limitations of aldesleukin and conventional IL-2-based immunocytokines. Oncoimmunology 6, e1277306, doi: 10.1080/2162402X.2016.1277306 (2017). [DOI] [PMC free article] [PubMed] [Google Scholar]
- 38.Su EW et al. IL-2Rα mediates temporal regulation of IL-2 signaling and enhances immunotherapy. Sci Transl Med 7, doi: 10.1126/scitranslmed.aac8155 (2015). [DOI] [PMC free article] [PubMed] [Google Scholar]
- 39.Codarri Deak L et al. PD-1-cis-IL-2R agonism yields better effectors from stem-like CD8 T cells. Nature 10.1038/s41586-022-05192-0 (2022). [DOI] [PMC free article] [PubMed] [Google Scholar]
- 40.Bristol Myers Squibb and Nektar Announce Update on Phase 3 PIVOT IO-001 Trial Evaluating Bempegaldesleukin (BEMPEG) in Combination with Opdivo (nivolumab) in Previously Untreated Unresectable or Metastatic Melanoma, <https://www.businesswire.com/news/home/20220313005021/en/Bristol-Myers-Squibb-and-Nektar-Announce-Update-on-Phase-3-PIVOT-IO-001-Trial-Evaluating-Bempegaldesleukin-BEMPEG-in-Combination-with-Opdivo-nivolumab-in-Previously-Untreated-Unresectable-or-Metastatic-Melanoma> (2022).
- 41.Wherry EJ, Blattman JN, Murali-Krishna K, van der Most R & Ahmed R Viral Persistence Alters CD8 T-Cell Immunodominance and Tissue Distribution and Results in Distinct Stages of Functional Impairment. J Virol 77, 4911–4927, doi: 10.1128/jvi.77.8.4911-4927.2003 (2003). [DOI] [PMC free article] [PubMed] [Google Scholar]
- 42.Bankhead P et al. QuPath: Open source software for digital pathology image analysis. Sci Rep 7, 16878, doi: 10.1038/s41598-017-17204-5 (2017). [DOI] [PMC free article] [PubMed] [Google Scholar]
- 43.Zerbino DR et al. Ensembl 2018. Nucleic Acids Res 46, D754–D761, doi: 10.1093/nar/gkx1098 (2018). [DOI] [PMC free article] [PubMed] [Google Scholar]
- 44.Kim D, Langmead B & Salzberg SL HISAT: a fast spliced aligner with low memory requirements. Nat Methods 12, 357–360, doi: 10.1038/nmeth.3317 (2015). [DOI] [PMC free article] [PubMed] [Google Scholar]
- 45.Liao Y, Smyth GK & Shi W featureCounts: an efficient general purpose program for assigning sequence reads to genomic features. Bioinformatics 30, 923–930, doi: 10.1093/bioinformatics/btt656 (2014). [DOI] [PubMed] [Google Scholar]
- 46.Love MI, Huber W & Anders S Moderated estimation of fold change and dispersion for RNA-seq data with DESeq2. Genome Biology 15, doi: 10.1186/s13059-014-0550-8 (2014). [DOI] [PMC free article] [PubMed] [Google Scholar]
- 47.Subramanian A et al. Gene set enrichment analysis: A knowledge-based approach for interpreting genome-wide expression profiles. Proc Natl Acad Sci U S A 102, 15545–15550, doi: 10.1073/pnas.0506580102 (2005). [DOI] [PMC free article] [PubMed] [Google Scholar]
- 48.Hadley W ggplot2: Elegant Graphics for Data Analysis. (Springer-Verlag; New York, 2016). [Google Scholar]
- 49.Satija R, Farrell JA, Gennert D, Schier AF & Regev A Spatial reconstruction of single-cell gene expression data. Nat Biotechnol 33, 495–502, doi: 10.1038/nbt.3192 (2015). [DOI] [PMC free article] [PubMed] [Google Scholar]
- 50.DeTomaso D & Yosef N FastProject: a tool for low-dimensional analysis of single-cell RNA-Seq data. BMC Bioinformatics 17, doi: 10.1186/s12859-016-1176-5 (2016). [DOI] [PMC free article] [PubMed] [Google Scholar]
- 51.McInnes L, Healy J, Saul N & Großberger L UMAP: Uniform Manifold Approximation and Projection. J Open Source Softw 3, 861, doi: 10.21105/joss.00861 (2018). [DOI] [Google Scholar]
- 52.Van Gassen S et al. FlowSOM: Using self-organizing maps for visualization and interpretation of cytometry data. Cytometry A 87, 636–645, doi: 10.1002/cyto.a.22625 (2015). [DOI] [PubMed] [Google Scholar]
- 53.Buenrostro JD, Wu B, Chang HY & Greenleaf WJ ATAC-seq: A Method for Assaying Chromatin Accessibility Genome-Wide. Curr Protoc Mol Biol 109, 21 29–21 29, doi: 10.1002/0471142727.mb2129s109 (2015). [DOI] [PMC free article] [PubMed] [Google Scholar]
- 54.Amemiya HM, Kundaje A & Boyle AP The ENCODE Blacklist: Identification of Problematic Regions of the Genome. Sci Rep 9, doi: 10.1038/s41598-019-45839-z (2019). [DOI] [PMC free article] [PubMed] [Google Scholar]
- 55.Hansen KD, Irizarry RA & Wu Z Removing technical variability in RNA-seq data using conditional quantile normalization. Biostatistics 13, 204–216, doi: 10.1093/biostatistics/kxr054 (2012). [DOI] [PMC free article] [PubMed] [Google Scholar]
- 56.Liu R et al. Why weight? Modelling sample and observational level variability improves power in RNA-seq analyses. Nucleic Acids Res 43, e97–e97, doi: 10.1093/nar/gkv412 (2015). [DOI] [PMC free article] [PubMed] [Google Scholar]
- 57.Heinz S et al. Simple combinations of lineage-determining transcription factors prime cis-regulatory elements required for macrophage and B cell identities. Mol Cell 38, 576–589, doi: 10.1016/j.molcel.2010.05.004 (2010). [DOI] [PMC free article] [PubMed] [Google Scholar]
Associated Data
This section collects any data citations, data availability statements, or supplementary materials included in this article.
Supplementary Materials
Data Availability Statement
All processed RNA-seq, scRNA-seq, and ATAC-seq data that support the findings of this study have been deposited in the Gene Expression Omnibus under accession code GSE206739. Previously published Affymetrix microarrays (GSE9650)16, RNA-seq (PRJNA412602)17, and ATAC-seq data (PRJNA546023)30 are included for the analysis in this study.


