

Abstract
Autism spectrum disorder (ASD) is a neurodevelopmental condition in which the mechanisms underlying its core symptomatology are largely unknown. Studying animal models of monogenic syndromes associated with ASD, such as neurofibromatosis type 1 (NF1), can offer insights into its etiology. Here, we show that loss of function of the Drosophila NF1 ortholog results in tactile hypersensitivity following brief mechanical stimulation in the larva (mixed sexes), paralleling the sensory abnormalities observed in individuals with ASD. Mutant larvae also exhibit synaptic transmission deficits at the glutamatergic neuromuscular junction (NMJ), with increased spontaneous but reduced evoked release. While the latter is homeostatically compensated for by a postsynaptic increase in input resistance, the former is consistent with neuronal hyperexcitability. Indeed, diminished expression of NF1 specifically within central cholinergic neurons induces both excessive neuronal firing and tactile hypersensitivity, suggesting the two may be linked. Furthermore, both impaired synaptic transmission and behavioral deficits are fully rescued via knock-down of Ras proteins. These findings validate NF1−/− Drosophila as a tractable model of ASD with the potential to elucidate important pathophysiological mechanisms.
SIGNIFICANCE STATEMENT Autism spectrum disorder (ASD) affects 1–2% of the overall population and can considerably impact an individual's quality of life. However, there are currently no treatments available for its core symptoms, largely because of a poor understanding of the underlying mechanisms involved. Examining how loss of function of the ASD-associated NF1 gene affects behavior and physiology in Drosophila may shed light on this. In this study, we identify a novel, ASD-relevant behavioral phenotype in NF1−/− larvae, namely an enhanced response to mechanical stimulation, which is associated with Ras-dependent synaptic transmission deficits indicative of neuronal hyperexcitability. Such insights support the use of Drosophila neurofibromatosis type 1 (NF1) models in ASD research and may provide outputs for genetic or pharmacological screens in future studies.
Keywords: autism spectrum disorder, Drosophila, neuromuscular junction, NF1, Ras, synaptic transmission
Introduction
Neurofibromatosis type 1 (NF1) is one of the most common monogenic developmental disorders, with an estimated prevalence of 1:3000 (Korf, 2013). While typically considered a tumor predisposition syndrome, it is also associated with a number of psychiatric symptoms including specific learning difficulties, attention deficit/hyperactivity disorder, and autism spectrum disorder (ASD; Hyman et al., 2005; Garg et al., 2013a,b; Eijk et al., 2018). It arises from heterozygous loss of function of the NF1 gene on chromosome 17, which encodes for neurofibromin, a large multi-domain cytoplasmic protein best characterized as a Ras-GTPase activating protein (Ras-GAP) and as an activator of cAMP/PKA signaling (Ratner and Miller, 2015; Gutmann et al., 2017; Bergoug et al., 2020). NF1 is most strongly expressed in oligodendrocytes, Schwann cells, and neurons (Daston et al., 1992), and at the cellular level is required for neural connectivity (Shofty et al., 2019), dendritic spine formation (Shih et al., 2020), cell migration (Sanchez-Ortiz et al., 2014), and synaptic transmission (Costa et al., 2002; Cui et al., 2008; Shilyansky et al., 2010; Molosh et al., 2014; Omrani et al., 2015); all processes whose dysfunction may contribute to the aforementioned associated behavioral issues (Yenkoyan et al., 2017; Dark et al., 2018).
While the precise mechanisms by which altered brain development and function gives rise to behavioral and cognitive changes in NF1 ultimately remain poorly understood, several studies in mouse models of NF1 have examined the contribution of altered neurotransmission in the CNS. Typically, these postulate an increase in GABAergic transmission and a consequent deficit in long-term potentiation (Costa et al., 2002; Cui et al., 2008; Molosh et al., 2014; Omrani et al., 2015). Such changes involve both increased ERK-mediated phosphorylation of synapsin (Cui et al., 2008) and a reduction in neuronal Ih current (Omrani et al., 2015). Conversely, how NF1 regulates excitatory transmission, and the impact of this on behavior, is less clear.
A highly conserved ortholog of NF1 is present in the genome of the fruit fly, Drosophila melanogaster (The et al., 1997), and adult flies lacking NF1 expression exhibit several behavioral phenotypes mirroring the clinical condition, including impairments in cognition (Guo et al., 2000), sleep (Bai and Sehgal, 2015), and social communication (Moscato et al., 2020). However, whether NF1 is also required to regulate behavior at the larval stage, and the mechanisms by which it may do so, is unknown. Drosophila larvae have been widely used in the study of how organisms perceive and respond to sensory stimuli, leading to the identification of a number of genes required for mechanoreception and nociception whose roles may also be conserved in humans (Kernan et al., 1994; Im and Galko, 2012; Walcott et al., 2018; He et al., 2022). Many of these are ion channels, and ion channel dysfunction is considered a major contributor to the behavioral symptoms of NF1 (Moutal et al., 2017).
Here, we investigated whether NF1 may be involved in regulating sensory sensitivity and demonstrate that NF1−/− larvae exhibit an increased likelihood of exhibiting a nocifensive response when exposed to a typically innocuous mechanical stimulus (tactile hypersensitivity). Furthermore, we show that, at the glutamatergic larval neuromuscular junction (NMJ), spontaneous transmitter release is increased while evoked release is reduced. While the latter is homeostatically compensated for by a postsynaptic increase in muscle input resistance (Rin), the former may reflect neuronal hyperexcitability. Indeed, in semi-intact larval preparations, in which the CNS is intact, we observe excessive endogenous activity at the NMJ. Both neuronal hyperexcitability and tactile hypersensitivity arise because of loss of NF1 in the CNS, rather than in peripheral or sensory neurons. Lastly, we show that knock-down of either Ras85D or Ras64B in NF1P1 larvae is sufficient to fully rescue these phenotypes, indicating that they arise from excessive Ras/MAPK pathway signaling.
Materials and Methods
Fly lines and maintenance
NF1P1 and K33 fly lines were obtained from Seth Tomchik (Scripps Research Institute, FL). The NF1P1 mutation was generated by mobilization of a P-element, resulting in total deletion of the NF1 gene except for exon 1 and complete ablation of NF1 expression (The et al., 1997). The K33 line is the parental line containing the P-element used to generate the deletion (The et al., 1997) and is frequently used as a control against NF1P1 (Guo et al., 2000; Buchanan and Davis, 2010; Moscato et al., 2020). Both lines have been back-crossed into the wCS10 background such that K33 functions as an isogenic control. The NF1E2 line, which contains an EMS-induced nonsense mutation within the NF1 gene (Walker et al., 2006), and its isogenic w1118 control line (Tsai et al., 2012) were obtained from Cheng-Ting Chien (Institute of Molecular Biology, Academia Sinica, Taiwan). NF1P1/E2 transheterozygotes were generated by crossing NF1P1 virgins to NF1E2 males, with progeny of K33 virgins crossed to w1118 males functioning as controls. The UAS-NF1 line used here (King et al., 2020) was obtained from James Walker (Center for Genomic Medicine, Harvard Medical School). For NF1 knock-downs via RNA interference (RNAi), a UAS-NF1RNAi transgene was combined with UAS-Dicer2 (Dietzl et al., 2007) to augment knock-down efficacy, and GAL4 driver lines were crossed to either UAS-NF1RNAi;UAS-Dicer2 (experiment) or UAS-GFPRNAi;UAS-Dicer2 (control). Such controls were used because they encompass the expression of the transcription activator GAL4, the endonuclease Dicer2, and a dsRNA transcript, thereby allowing us to rule out any confounding influence of these transcripts on the phenotype studied. Where deemed appropriate, we also compared the K33 line to progeny of the UAS-NF1RNAi parental line crossed to K33 (UAS-NF1RNAi/+). GAL4 driver lines and their sources are as follows: elavc155-GAL4 (Bloomington, #458; Giachello and Baines, 2015), MHC-GAL4 (Baines Lab; Schuster et al., 1996), ChAT:BAC-GAL4 (gift from Steven Stowers, Montana State University; Vernon et al., 2018), TH-GAL4 (Bloomington, #8848; Friggi-Grelin et al., 2003), Gad1-GAL4 (gift from Dr. Matthias Landgraf, University of Cambridge, UK; Diao et al., 2015), vGlutOK371-GAL4 (Bloomington, #26160; Mahr and Aberle, 2006), P0163-GAL4 (Kyoto, #103168; Giachello and Baines, 2015), ppk-GAL4 (Bloomington, #32079; Kim et al., 2012). All lines recorded from, in which a GAL4 driver and/or UAS transgene is present, are heterozygous for each construct(s). VDRC UAS-NF1RNAi line #109637 (King et al., 2016) was used for all NF1 knock-down experiments except those in Figure 4, for which construct #35877 (Fenckova et al., 2019) was used. The UAS-GFPRNAi (combined with UAS-Dicer2 for experiments) was obtained from Bloomington (#9331; Roignant et al., 2003). For rescue experiments involving the pan-neuronal expression of UAS-NF1, UAS-Ras64BRNAi (VDRC #110574), UAS-Ras85DRNAi (VDRC #106642; Noyes et al., 2020), or UAS-DATRNAi (VDRC #106961; van der Voet et al., 2016), these transgenes were combined into the NF1P1 mutant background and crossed to elavc155-GAL4;;NF1P1. Control lines for rescue experiments comprised each parental line crossed to either NF1P1 (producing homozygous mutant controls) or K33 (producing heterozygous controls that do not display any phenotype relative to K33, as indicated by a preliminary experiment; data not shown). For the knock-down of Ras64B or Ras85D in a wild-type line (i.e., in the absence of the NF1P1 mutation), the UAS-RNAi line for each gene was crossed to elavc155-GAL4, and each transgenic parental line was crossed to K33 to provide controls. All lines and crosses were maintained on standard cornmeal medium in a 12/12 h light/dark cycle at 25°C.
Figure 4.

Pan-neuronal knock-down of NF1 via an alternative UAS-NF1RNAi construct (VDRC #35877) mimics the mutant phenotype. A, EJP amplitude is unaffected by pan-neuronal (elav-driven) knock-down of NF1 (elav>Dicer2/+;NF1RNAi/+, red dots), compared with expression of GFPRNAi instead (elav> GFPRNAi/+;Dicer2/+, blue dots). B, Knock-down of NF1 increases mEJP frequency and (C) mEJP amplitude, with a significant reduction in (D) quantal content. E, F, Representative traces of EJPs and mEJPs, respectively. All data are presented as mean ± SEM. All statistical comparisons were made via unpaired, two-tailed Student's t test.
Larval mechanoreception
Water (2 ml) was added to a 35 mm Petri dish containing Silgard into which wall-climbing third instar larvae were placed. An Austerlitz Minutiens stainless steel insect pin (diameter = 0.1 mm; Fine Science Tools, item #26002-10), cut to ∼2 mm in length and held horizontally between a pair of forceps, was pressed down firmly on the posterior end of the larva (Fig. 1A; Movie 1, and Movie 2). Care was taken to ensure that the pin was applied with the same pressure to each larva. Whether or not the larva exhibited a stereotypic rolling motion, characteristic of the nocifensive response within 10 s of stimulation, was noted. Only a full 360° roll was classified as a nocifensive response.
Figure 1.

NF1−/− larvae display hypersensitivity to mechanical stimulation. A, Schematic of the mechanoreception assay used to characterize tactile hypersensitivity. An insect pin is pressed down firmly across the posterior end of a larva, an action that may or may not induce a nocifensive rolling motion. B, The mean percentage of larvae (n = 4 trials, 20 larvae per trial, thus n = 80 larvae in total) responding to mechanical stimulation is significantly greater in NF1P1 than in the K33 control. A similar effect is seen when comparing (C) NF1E2 to w1118 controls, and (D) NF1P1/E2 to K33/+ controls. E, Pan-neuronal overexpression of UAS-NF1 in the NF1P1 background fully rescues the phenotype. All data are presented as mean ± SEM. Each data point represents the percentage of larvae responding in a single trial. Statistical comparisons were made via either an unpaired, two-tailed Student's t test (panels B–D) or a one-way ANOVA followed by Tukey's post hoc test (panel E).
Typical K33 response to mechanical stimulation. Upon brief mechanical stimulation, K33 larvae typically do not display the stereotypic larval nocifensive response.
Typical NF1P1 response to mechanical stimulation. Upon brief mechanical stimulation, NF1P1 larvae typically display the stereotypic larval nocifensive response.
Electrophysiology
Saline and recording criteria
Unless otherwise stated, to examine synaptic transmission at the larval NMJ, wall-climbing third instar larvae were dissected in HL3 saline without CaCl2 (NaCl, 70 mm; KCl, 5 mm; MgCl2 hexahydrate, 20 mm; NaHCO3, 10 mm; sucrose, 115 mm; trehalose, 5 mm; HEPES, 5 mm; pH 7.25, adjusted with NaOH) to expose ventral body wall muscles, before the CNS was removed to permit access to the peripheral nerves (except when recording endogenous excitatory activity; see below, Semi-intact recordings). Larval preparations were then washed five times in HL3 saline containing the Ca2+ concentration in which the experiment was to be conducted. This was 1.5 mm (Stewart et al., 1994) for all experiments except those characterizing excitatory junction potential (EJP) failure rate, for which 0.4 mm was used, and those attempting to replicate the findings of a previous study (Tsai et al., 2012), for which 0.2 mm was used in HL3.1 saline, which is similar to HL3 saline except for a reduced (4 mm) Mg2+ concentration (Feng et al., 2004). All recordings were performed at room temperature and taken from muscle 6 in segments A2–A4. Recording and suction pipettes were pulled from thick-wall borosilicate capillaries with filament (GC100F-10, Harvard Apparatus) using a Flaming/Brown Micropipette Puller, model P-97 (Sutter Instrument). Recording pipettes were pulled to a resistance of 20–35 MΩ when filled with 3 m KCl, while current-passing pipettes (for two-electrode voltage clamp; TEVC) were pulled to a resistance of 15–25 MΩ when filled with 3 m KCl. Suction pipettes (for nerve stimulation) were broken and heat-polished to the final desired size then filled with HL3 saline + CaCl2. Immediately before insertion of the recording electrode into the muscle, pipette offset was corrected to 0 mV. Recordings were taken if Rin, measured as the voltage response to injection of −1 nA hyperpolarizing current, following electrode insertion into the muscle exceeded 5 MΩ (with exception; see below, Semi-intact recordings) and resting membrane potential (Vm) was at or below −60 mV. Recordings were also only accepted for data analysis if the voltage drift after the recording electrode was removed from muscle did not exceed ±5 mV. Voltage responses were recorded in current-clamp mode using an Axopatch 200B microelectrode amplifier, Digidata 1322A, and Clampex 10.3 data acquisition software (Molecular Devices).
Current-clamp recording of (miniature) EJPs [(m)EJPs]
EJPs were evoked via 0.2-ms stimulation of the nerve using a DS2A Isolated Voltage Stimulator (Digitimer Ltd.). Each stimulation used the minimum voltage necessary to stimulate both Ib and Is motor neuron inputs to generate EJPs of consistent amplitude. Ten EJPs were recorded per muscle at a stimulation frequency of 0.5 Hz. From the same muscle, the membrane potential (Vm) of the muscle was then recorded for 2 min in the absence of stimulation to obtain mEJPs. Mean EJP amplitude and resting Vm were calculated on Clampfit 10.3 analysis software (Molecular Devices). Mean mEJP amplitude and mEJP frequency were calculated using Mini Analysis (Synaptosoft Inc.). All data were then exported to Microsoft Excel, and amplitudes corrected for differences in resting Vm by applying the equation:
where v′ is the corrected amplitude, v is the recorded amplitude, and E is the driving force which, assuming a reversal potential of 0 mV, is equal to resting Vm (Feeney et al., 1998). Quantal content was calculated by dividing the corrected mean EJP amplitude by the corrected mean mEJP amplitude.
TEVC recordings of (miniature) excitatory junction currents [(m)EJCs]
In addition to the criteria specified for current-clamp experiments, recordings in TEVC were conducted if, following insertion of the current-passing electrode into the muscle after the recording electrode, resting Vm was depolarized no more than –50 mV and voltage readings from each electrode were within 5 mV of each other. To record EJCs and mEJCs, Vm was held at −70 mV, and a 1-kHz filter was applied to facilitate the identification of mEJCs from baseline during analysis. Clampfit 10.3 analysis software (Molecular Devices) was used to calculate mean EJC amplitude, mean mEJC amplitude, and mEJC frequency. Quantal content was calculated by dividing the mean EJC amplitude by the mean mEJC amplitude. The 'Template Search' function was used to detect mEJCs, and any events that appeared to be noise were manually excluded. Baseline noise was reduced with a low-pass boxcar filter.
Paired-pulse recordings
Paired-pulse experiments were conducted under TEVC. Two stimuli (0.2 ms, 20 Hz) were applied to the nerve five times, with 10 s between each sweep. The mean amplitude of each EJC was measured from its peak to the baseline Vm before the first stimulus. The paired-pulse ratio (PPR) was calculated by dividing the amplitude of the second EJC by that of the first EJC.
Failure rate
To calculate EJP failure rate, 100 stimuli (0.2 ms, 0.2 Hz) were applied in HL3 saline containing 0.4 mm CaCl2, such that some stimuli failed to evoke an EJP. A failure was defined when no clear depolarization of the muscle occurred following stimulation, regardless of amplitude. To remove the possibility that any variation in failure rate may be because of improper nerve stimulation, all nerves were stimulated with 4 V, which, based on the stimulation amplitudes required for initial EJP recordings, was sufficient to activate both Ib and Is inputs.
Leak current recording
Leak currents were recorded using a protocol similar to that used previously to characterize the Drosophila K+ leak channel ORK1 expressed in Xenopus oocytes (Goldstein et al., 1996). Vm was held at –80 mV before application of a step protocol (range: −150 to −60 mV; increment: +15 mV; step duration: 75 ms; interpulse interval: 1 s). The step range was selected to avoid membrane depolarization and subsequent muscle contraction, which could disturb the recording electrode. Following each step, Vm was hyperpolarized to −150 mV for 15 ms before being returned to −80 mV. All currents were normalized to capacitance to account for possible differences in muscle size.
Semi-intact recordings
To examine spontaneous EJP generation, muscle Vm was recorded passively for 5 min in preparations in which the CNS remained in situ. Before recording, preparations were bathed in saline containing nifedipine (75 μm, 0.3% DMSO) for 10 min to suppress muscle contractions (Kratschmer et al., 2021). Recordings were taken only if contractions were observed at the start of the 10 min incubation to ensure that the CNS was indeed intact, and therefore that lack of endogenous activity did not reflect damage to the CNS incurred during dissection. The frequency of synaptic activity in these experiments meant that measurement of Rin as described was not necessarily feasible; therefore, we did not take this into account when deciding whether to proceed with recording (Kratschmer et al., 2021). We defined a burst as starting when more than or equal to five EJPs occurred within 1 s (i.e., mean frequency of 0.2 Hz) and as ending when 1 s or more passed in which more than or equal to five EJPs were not present, criteria similar but not identical to those previously used (Kratschmer et al., 2021). Traces were analyzed using Clampfit 10.3, in which the time spent burst firing at each NMJ, over a 5-min period, was calculated. We also calculated the number of bursts per recording, and the mean burst duration (total time burst firing/number of bursts).
Larval measurements
Muscle fiber measurements
Third instar larvae were fillet-dissected to expose muscle 6. Images were captured using a Leica DM6000B microscope. Length and width of segment A3 were obtained with MetaMorph software (version 7.8.13.0, Molecular Devices) via the 'Region Measurements' function, from which surface area was then calculated.
Pupal length measurements
40 pupae of each sex were collected per genotype. Males and females were identified by the presence or absence of sex combs, respectively, which are clearly visible beneath the pupal casing. Images were acquired using a Leica MZ10F stereo microscope together with Leica Application Suite software (version 4.0.0, Leica Microsystems). Anterior to posterior measurements were then calculated on ImageJ 1.53e (NIH). As wild-type females are typically larger than males, each sex was analyzed separately.
Reverse transcription-quantitative PCR (RT-qPCR)
RNA extraction, cDNA conversion and qPCR were conducted as described previously (Lin et al., 2015). Per biological replicate, RNA was extracted from 10 adult fly heads, since these are easier to isolate than the larval CNS and the elavc155-GAL4 driver is still expressed within the adult brain (Sage et al., 2008). For each gene, n = 3 biological replicates, comprising two to three technical replicates. Rp49 was used as the normalizing gene, and CT values were normalized via the 2-ΔΔCT method (Livak and Schmittgen, 2001). Primer pairs used are as follows (all as 5′−3′): Rp49, CTAAGCTGTCGCACAAATGG and GGAACTTCTTGAATCCGGTG (Lin et al., 2015); Ras64B, GATCCCACCATTGAAGACTCG and AGCTGGAATGATCGTTGAGCG (primer pair PP20045 from https://www.flyrnai.org/cgi-bin/DRSC_primerbank.pl); Ras85D, GGAGCTAGCTGAAGAGGCAG and TACTCTCTTGTGAAGCGCCC (primer pair PD70105 from https://www.flyrnai.org/cgi-bin/DRSC_primerbank.pl).
Experimental design and statistical analysis
Experimental design
All experiments and subsequent analyses were conducted by an experimenter blinded to genotype. Mixed sex populations were used for all experiments aside from the measurement of pupal length. For larval mechanoreception experiments, four trials of 20 larvae were conducted per genotype (thus, n = 80 per genotype overall), from which mean percentage responding larvae was calculated. Each data point depicted on graphs represents the percentage of responding larvae from one such trial. For experiments using progeny derived from transgenic parental lines (e.g., RNAi experiments), each individual trial comprised larvae taken from separate, independent genetic crosses. All repeats of the assay were conducted by the same experimenter. For the measurement of (m)EJPs, (m)EJCs, paired-pulse ratio, failure rate, leak current and Rin, n = 13 for all experiments, and no more than two sets of recordings satisfying all acceptance criteria listed above were taken from any one larval preparation. For electrophysiological recordings in which the CNS was left in situ (see above, Semi-intact recordings), n = 12–13 per genotype because traces in which we could not clearly identify when both Ib and Is motor neurons were active were excluded from analysis.
Statistical analysis
All statistical analysis was conducted in GraphPad Prism (version 8.4.3). Statistical tests used to analyze each data set are indicated in the accompanying figure legend. Experiments comprising only two datasets were analyzed via an unpaired, two-tailed Student's t test, while those with three or more ungrouped sets were analyzed using a one-way ANOVA followed by Tukey's post hoc test. For experiments involving grouped datasets in which data were only compared within groups (i.e., GAL4 lines each crossed to two RNAi lines), comparisons were made via a two-way ANOVA followed by Sidak's post hoc test. Linear regressions were compared via ANCOVA to detect differences in slope. For clarity, only relevant, statistically significant comparisons (p < 0.05) are displayed within the figures. For data presented in figures, the results of all statistical comparisons, including the test used, t or F value, degrees of freedom (df) and, where appropriate, the p value of the post hoc test, are presented in accompanying tables. For data corresponding to control experiments that are not presented in figures, details of statistical comparisons are included within the main text.
Results
NF1P1 larvae exhibit hypersensitivity to mechanical stimulation
Following exposure to noxious stimuli such as heat or mechanical touch, wild-type third instar larvae display a stereotypic, “corkscrew-like” rolling behavior that is suggested to be a nocifensive response evolved to protect the animal from parasitic wasp attack (Fig. 1A; Tracey et al., 2003; Hwang et al., 2007). Assaying this behavior has led to the identification of several genes required for appropriate sensory transduction and processing (Tracey et al., 2003; Mauthner et al., 2014; Walcott et al., 2018). When a brief mechanical stimulation (see Materials and Methods; Fig. 1A) is applied to the posterior end of a K33 larva, this generally does not elicit a response. In contrast, the number of NF1P1 larvae exhibiting a nocifensive response is significantly greater (Fig. 1B; Table 1). Typical responses for K33 and NF1P1 larvae are shown in Movie 1, and Movie 2, respectively. A similar phenotype was seen when comparing the NF1E2 line to its w1118 isogenic control (Fig. 1C), and when comparing NF1P1/E2 transheterozygotes to K33/+ larvae (Fig. 1D). Pan-neuronal overexpression of NF1 fully rescues this phenotype (Fig. 1E). Thus, loss of NF1 induces tactile hypersensitivity to a mechanical stimulus.
Table 1.
Statistical comparisons from Figure 1
| Control line | Experimental line | Test | t or F(df), p (if ANOVA) | p | |
|---|---|---|---|---|---|
| B | K33 | NF1P1 | Unpaired, two- tailed, Student's t test | t(6) = 12.12 | <0.0001 |
| C | w1118 | NF1E2 | t(6) = 14.10 | <0.0001 | |
| D | K33/+ | NF1P1/E2 | t(6) = 25.64 | <0.0001 | |
| E | elav/+;;NF1P1/+ | elav>UAS-NF1/+;NF1P1 | One-way ANOVA, Tukey's |
F(4,15) = 240.7 p < 0.0001 |
0.86 (ns) |
| UAS-NF1/+;NF1P1/+ | 0.99 (ns) | ||||
| elav/+;;NF1P1 | <0.0001 | ||||
| UAS-NF1/+;NF1P1 | <0.0001 |
The p value in the rightmost column refers to that of the t test (B–D) or the post hoc test following the ANOVA (E). df = degrees of freedom. ns = not significant.
NF1P1 larvae exhibit increased spontaneous but reduced evoked transmission at the NMJ
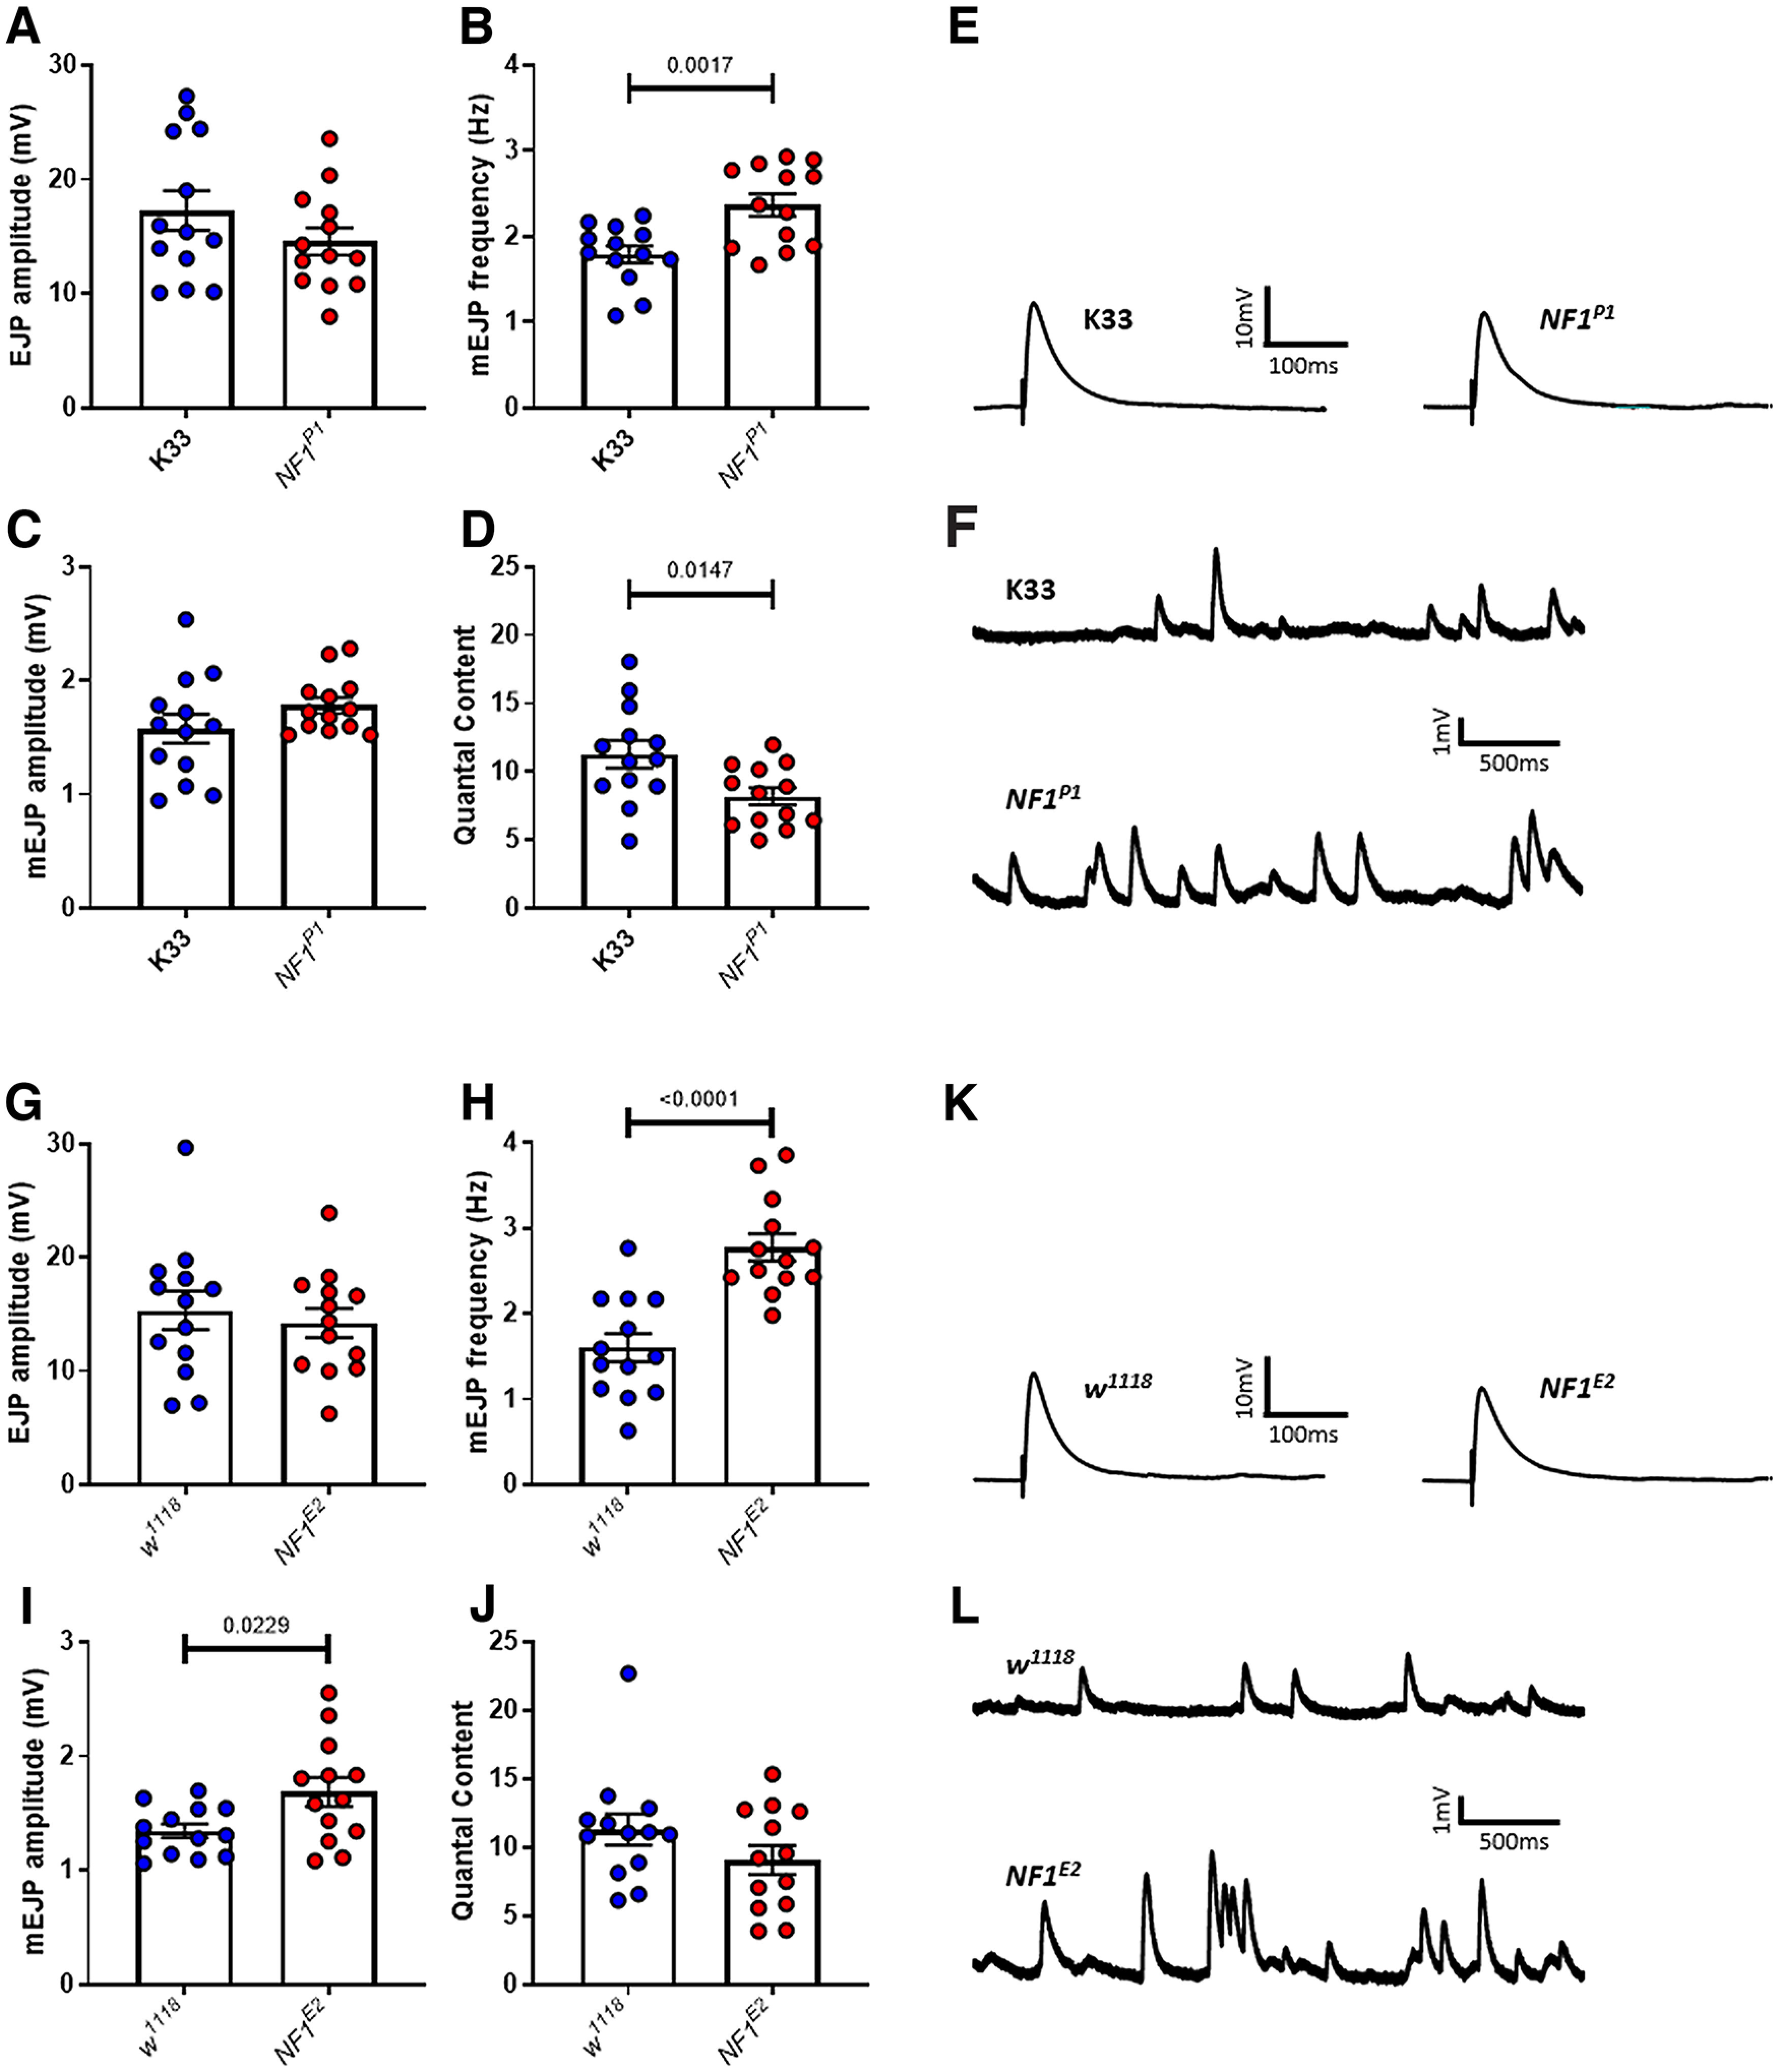
To gain insight into the physiological changes underlying tactile hypersensitivity in NF1−/− larvae, we investigated whether synaptic transmission was altered. To this end, we made use of the Drosophila larval NMJ. This is an easily-accessible and well-characterized model glutamatergic synapse at which the proteins governing synaptic transmission exhibit a very high degree of conservation with their mammalian counterparts and function in a manner highly similar to those at mammalian central synapses (Keshishian et al., 1996). Previous work (Tsai et al., 2012) characterized altered synaptic transmission at the NMJ of NF1-null larvae in a reduced CaCl2 concentration. To more accurately reflect the physiological environment, we first conducted current-clamp recordings in HL3 saline containing 1.5 mm CaCl2 (Stewart et al., 1994). Under such conditions, no significant difference in evoked EJP amplitude was observed between NF1P1 and K33 lines. However, in NF1P1 larvae, both the frequency and amplitude of mEJPs (i.e., membrane depolarizations in response to the spontaneous release of transmitter) were significantly increased, while quantal content (the number of vesicles of transmitter released by an action potential) was significantly reduced (Fig. 2A–F; Table 2). The same phenotypes were also observed in NF1E2 larvae when compared with their isogenic control line w1118 (Fig. 2G–L). While NF1P1/E2 transheterozygotes (Fig. 2M–R) exhibit similar changes to mEJP frequency, mEJP amplitude, and quantal content, they also display a small but significant reduction in EJP amplitude, unlike the two homozygous mutant lines.
Figure 2.

NF1−/− mutants display reduced evoked but increased spontaneous excitatory synaptic transmission. A, Under current clamp, EJP amplitude is not significantly altered (p = 0.82) in NF1P1 mutants compared with that of K33 controls. However, both (B) mEJP frequency and (C) mEJP amplitude are significantly increased, while (D) quantal content is significantly decreased. E, F, Representative traces of EJPs and mEJPs, respectively, for K33 and NF1P1 lines. G–J, A similar phenotype is seen in NF1E2 mutants compared with w1118 controls, with no change in EJP amplitude (p = 0.18), a significant increase in mEJP frequency and mEJP amplitude, and a significant decrease in quantal content. K, L, Representative traces of EJPs and mEJPs, respectively, analyzed in G–J. M–P, The NF1P1/E2 transheterozygote displays a small but significant reduction in EJP amplitude relative to K33/+ controls (i.e., progeny of K33 crossed to w1118), as well as a significant increase in mEJP frequency and mEJP amplitude, and a significant decrease in quantal content. Q, R, Representative traces of EJPs and mEJPs, respectively, analyzed in M–P. All data are presented as mean ± SEM. All statistical comparisons were made via unpaired, two-tailed Student's t test.
Table 2.
Statistical comparisons from Figure 2
| Control line | Experimental line | Test | t (df) | p | |
|---|---|---|---|---|---|
| A | K33 | NF1P1 | Unpaired, two-tailed, Student's t test | t(24) = 0.23 | 0.82 (ns) |
| B | t(24) = 6.12 | <0.0001 | |||
| C | t(24) = 6.52 | <0.0001 | |||
| D | t(24) = 6.98 | <0.0001 | |||
| G | w1118 | NF1E2 | t(24) = 1.37 | 0.18 (ns) | |
| H | t(24) = 9.58 | <0.0001 | |||
| I | t(24) = 4.17 | 0.0003 | |||
| J | t(24) = 3.60 | 0.001 | |||
| M | K33/+ | NF1P1/E2 | t(24) = 2.53 | 0.02 | |
| N | t(24) = 7.68 | <0.0001 | |||
| O | t(24) = 5.29 | <0.0001 | |||
| P | t(24) = 6.04 | <0.0001 |
The p value in the rightmost column refers to that of the t test. df = degrees of freedom. ns = not significant.
Increased mEJP frequency and amplitude were recapitulated by pan-neuronal (elav>NF1RNAi/+;Dicer2/+), but not muscular (MHC>NF1RNAi/+;Dicer2/+), knock-down of NF1 (Fig. 3A–F; Table 3). Similar to NF1P1/E2 transheterozygotes, we did observe a slight but significant decrease in EJP amplitude in elav>NF1RNAi/+;Dicer2/+ larvae that was not present in MHC>NF1RNAi/+;Dicer2/+ larvae, as well as a significant decrease in quantal content in MHC>NF1RNAi/+;Dicer2/+ larvae, though this was much smaller in magnitude than that seen following either presynaptic NF1 knock-down or in homozygous NF1 deletion mutants (i.e., NF1P1 or NF1E2 mutants, compare Fig. 2). In addition, synaptic dysfunction was fully rescued via pan-neuronal overexpression of a UAS-NF1 transgene in the NF1P1 background (Fig. 3G–L; Table 3). Lastly, pan-neuronal knock-down of a second, independent, UAS-NF1RNAi transgene showed a similar phenotype (Fig. 4; Table 4). Together, these data suggest that the observed transmission defects result from presynaptic loss of NF1 activity, although a postsynaptic role for NF1 in synaptic transmission cannot be ruled out.
Figure 3.

Synaptic transmission deficits are presynaptic in origin and specific to loss of NF1 expression. In panels A–D, presynaptic knock-down (left-hand side) is achieved via elav>NF1RNAi/+;Dicer2/+, and postsynaptic knock-down (right-hand side) by MHC>NF1RNAi/+;Dicer2/+. Controls (blue dots) are elav>GFPRNAi/+;Dicer2/+ and MHC>GFPRNAi/+;Dicer2/+, respectively. A, EJP amplitude is significantly reduced following presynaptic knock-down of NF1, whereas postsynaptic knock-down has no effect. B, Similar to NF1P1 and NF1E2, mEJP frequency is significantly reduced following presynaptic but not postsynaptic knock-down. C, Presynaptic NF1 knock-down increases mEJP amplitude, whereas postsynaptic knock-down does not. D, Quantal content is significantly reduced following NF1 knock-down both presynaptically and postsynaptically, although to a lesser extent in the latter. E, F, Representative traces of EJPs and mEJPs, respectively, analyzed in A–D. G–L, Pan-neuronal overexpression of UAS-NF1 via elav-GAL4 in the NF1P1 background rescues synaptic transmission deficits, with no significant differences between the rescue line (purple circles; elav>UAS-NF1/+;NFIP1) and either heterozygous control (blue circles) for any parameter examined. Furthermore, in panels H–J, both homozygous mutant controls (red circles) were significantly different to both heterozygous controls, and there were no significant differences between either of the heterozygous controls or either of the homozygous mutant controls, respectively. All data are presented as mean ± SEM. All statistical comparisons in A–D were made via two-way ANOVA followed by Sidak's multiple comparisons test, in order to compare elav>NF1RNAi/+;Dicer2/+ to elav>GFPRNAi/+;Dicer2/+ larvae, and MHC>NF1RNAi/+;Dicer2/+ to MHC>GFPRNAi/+;Dicer2/+ larvae. All comparisons in G–J were made via one-way ANOVA followed by Tukey's multiple comparisons test.
Table 3.
Statistical comparisons from Figure 3
| Control line | Experimental line | Test | F(df), p | p | |
|---|---|---|---|---|---|
| A | elav>GFPRNAi/+;Dicer2/+ | elav>NF1RNAi/+;Dicer2/+ | Two-way ANOVA, Sidak's |
F(1,48) = 5.33 p = 0.03 |
0.05 |
| MHC>GFPRNAi/+;Dicer2/+ | MHC>NF1RNAi/+;Dicer2/+ | 0.57 (ns) | |||
| B | elav>GFPRNAi/+;Dicer2/+ | elav>NF1RNAi/+;Dicer2/+ |
F(1,48) = 7.38 p = 0.009 |
<0.0001 | |
| MHC>GFPRNAi/+;Dicer2/+ | MHC>NF1RNAi/+;Dicer2/+ | 0.37 (ns) | |||
| C | elav>GFPRNAi/+;Dicer2/+ | elav>NF1RNAi/+;Dicer2/+ |
F(1,48) = 9.67 p = 0.003 |
<0.0001 | |
| MHC>GFPRNAi/+;Dicer2/+ | MHC>NF1RNAi/+;Dicer2/+ | 0.06 (ns) | |||
| D | elav>GFPRNAi/+;Dicer2/+ | elav>NF1RNAi/+;Dicer2/+ |
F(1,48) = 22.01 p < 0.0001 |
<0.0001 | |
| MHC>GFPRNAi/+;Dicer2/+ | MHC>NF1RNAi/+;Dicer2/+ | 0.02 | |||
| G | elav/+;;NF1P1/+ | elav>UAS-NF1/+;NF1P1 | One-way ANOVA, Tukey's |
F(4,60) = 1.79 p = 0.14 |
n/a |
| UAS-NF1/+;NF1P1/+ | |||||
| elav/+;;NF1P1 | |||||
| UAS-NF1/+;NF1P1 | |||||
| H | elav/+;;NF1P1/+ | elav>UAS-NF1/+;NF1P1 |
F(4,60) = 20.95 p < 0.0001 |
>0.99 (ns) | |
| UAS-NF1/+;NF1P1/+ | 0.94 (ns) | ||||
| elav/+;;NF1P1 | <0.0001 | ||||
| UAS-NF1/+;NF1P1 | <0.0001 | ||||
| I | elav/+;;NF1P1/+ | elav>UAS-NF1/+;NF1P1 |
F(4,60) = 15.01 p < 0.0001 |
0.99 (ns) | |
| UAS-NF1/+;NF1P1/+ | 0.92 (ns) | ||||
| elav/+;;NF1P1 | 0.0004 | ||||
| UAS-NF1/+;NF1P1 | <0.0001 | ||||
| J | elav/+;;NF1P1/+ | elav>UAS-NF1/+;NF1P1 |
F(4,60) = 16.65 p < 0.0001 |
>0.99 (ns) | |
| UAS-NF1/+;NF1P1/+ | 0.99 (ns) | ||||
| elav/+;;NF1P1 | 0.002 | ||||
| UAS-NF1/+;NF1P1 | <0.0001 |
The p value in the rightmost column refers to that of the post hoc test following the (one-way or two-way) ANOVA. Where the p value of the ANOVA was not significant (G), no post hoc p value is given. df = degrees of freedom. ns = not significant.
Table 4.
Statistical comparisons from Figure 4
| Control line | Experimental line | Test | t (df) | p | |
|---|---|---|---|---|---|
| A | elav>GFPRNAi/+;Dicer2/+ | elav>Dicer2/+;NF1RNAi/+ | Unpaired, two-tailed, Student's t test | t(24) = 0.45 | 0.66 (ns) |
| B | t(24) = 3.06 | 0.005 | |||
| C | t(24) = 6.47 | <0.0001 | |||
| D | t(24) = 6.89 | <0.0001 |
The p value in the rightmost column refers to that of the t test. df = degrees of freedom. ns = not significant.
In addition to recording in current-clamp mode, immediately following each recording in Figure 2A–F, we recorded EJCs and mEJCs from the same muscle by switching to voltage clamp (Fig. 5A–F; Table 5). While, under current clamp, EJP amplitude is unchanged (Fig. 2A), EJC amplitude was significantly reduced in NF1P1 larvae. By contrast, mEJC amplitude, increased under current clamp, was unchanged relative to K33 controls in voltage clamp. Consistently, however, mEJC frequency remained significantly increased and quantal content significantly decreased under both recording modes. Given that both sets of recordings were conducted from the same muscles, the discrepancy between (m)EJP and (m)EJC amplitudes in NF1P1 mutants cannot be because of poor replicability of the synaptic transmission phenotype. Regardless, both sets of data are consistent with increased spontaneous transmission and a reduction in evoked release.
Figure 5.
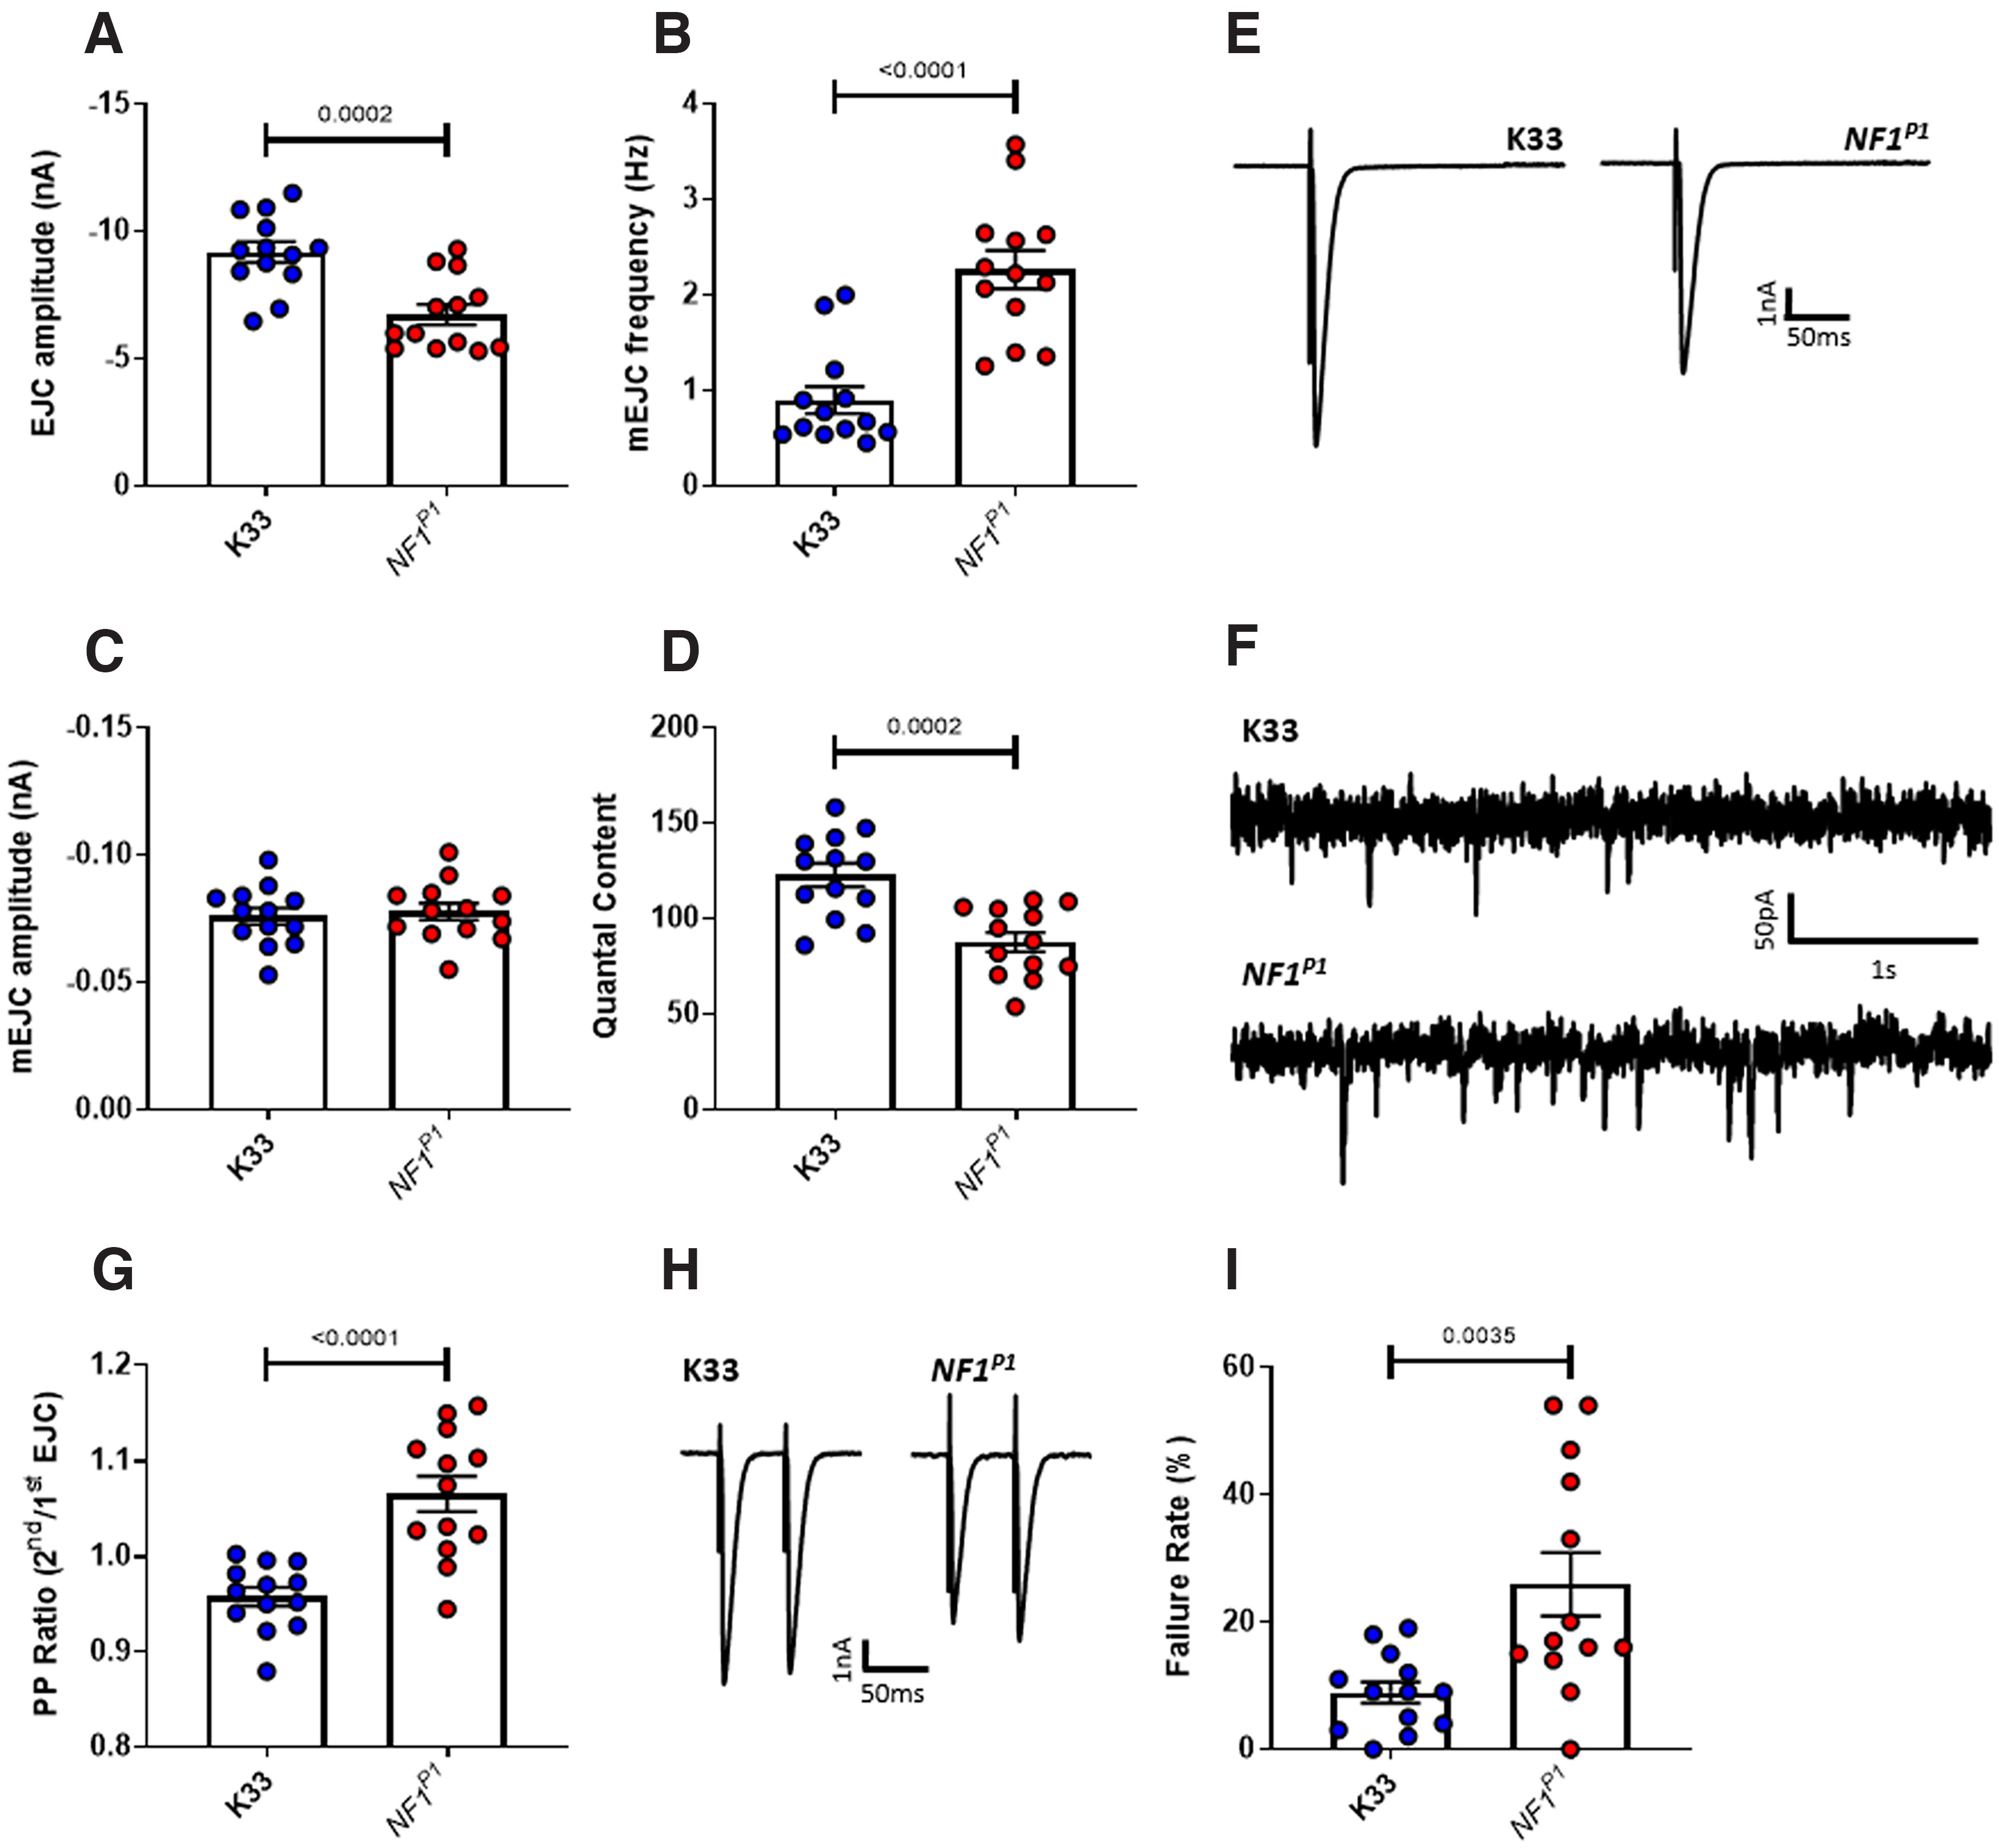
Synaptic current is reduced in NF1P1 mutants. A, Under voltage clamp, EJC amplitude is significantly reduced in NF1P1 mutants. B, mEJC frequency is significantly increased in NFIP1 larvae, while (C) there is no significant difference in mEJC amplitude. D, Quantal content is significantly reduced for NF1P1 larvae. E, F, Representative traces of EJCs and mEJCs, respectively. G, Under voltage clamp in HL3 saline (1.5 mm Ca2+), the paired-pulse ratio (PPR; 2nd EJC amplitude/1st EJC amplitude) is significantly increased in NF1P1 larvae. H, Representative traces of two EJCs evoked with a 50-ms interval. I, In HL3 saline with a reduced Ca2+ concentration (0.4 mm Ca2+), the rate at which a stimulus fails to evoke an EJP under current clamp is significantly greater in NF1P1 larvae. All data are presented as mean ± SEM. All statistical comparisons were made via an unpaired, two-tailed Student's t test.
Table 5.
Statistical comparisons from Figure 5
| Control line | Experimental line | Test | t (df) | p | |
|---|---|---|---|---|---|
| A | K33 | NF1P1 | Unpaired, two-tailed, Student's t test | t(24) = 4.30 | 0.0002 |
| B | t(24) = 5.59 | <0.0001 | |||
| C | t(24) = 0.40 | 0.69 (ns) | |||
| D | t(24) = 4.44 | 0.0002 | |||
| G | t(24) = 5.17 | <0.0001 | |||
| I | t(24) = 3.24 | 0.004 |
The p value in the rightmost column refers to that of the t test. df = degrees of freedom. ns = not significant.
To further investigate the possibility that evoked release is impaired, we conducted paired-pulse recordings in voltage clamp mode. If probability of transmitter release is reduced, fewer vesicles will fuse with the presynaptic membrane to release transmitter on the first stimulus. Therefore, a comparatively higher number of vesicles will be available to fuse with the membrane on the second stimulus. As a result, the PPR (see Materials and Methods) will be greater. In NF1P1 larvae, the PPR is indeed significantly increased compared with that of K33 controls (Fig. 5G,H; Table 5). Furthermore, PPR values in K33 controls indicate a prevalence of paired-pulse depression rather than facilitation, as the amplitude of the second EJC is lower than that of the first (demonstrated by a PPR of <1). This is to be expected in wild-type larvae at physiological calcium levels, because of the large number of vesicles releasing transmitter on the initial stimulus. In contrast, paired-pulse facilitation (an increase in EJC amplitude on the second stimulation) was more common among NF1P1 larvae.
We also examined release probability by recording EJPs in the presence of reduced (0.4 mm) Ca2+ and calculating the rate at which a stimulus fails to evoke a response (Fig. 5I; Table 5). A significantly greater percentage of stimuli failed to evoke an EJP at the NMJ of NF1P1 larvae compared with that of K33 controls, which is consistent with a reduced probability of transmitter release, and, consequently, a smaller synaptic current.
Increased postsynaptic Rin compensates for reduced evoked release
A reduction in EJC amplitude, despite no change in EJP amplitude, is indicative of increased muscle Rin in NF1P1 larvae. This would enable a smaller synaptic current to generate a larger voltage response. For example, mEJP amplitude (recorded under current clamp) is greater in muscle 7 than muscle 6 of wild-type 3rd instar Drosophila larvae, despite indistinguishable mEJC amplitudes, owing to the greater Rin of the former (Powers et al., 2016). In keeping with this possibility, we observed significantly greater Rin values for muscle 6 in NF1P1 larvae compared with K33 controls (Fig. 6A,B; Table 6). Moreover, this increase was also seen following presynaptic (elav>NF1RNAi/+;Dicer2/+), but not postsynaptic (MHC>NF1RNAi/+;Dicer2/+) knock-down of NF1 expression (Fig. 6C), consistent with it being a homeostatic response to altered presynaptic signaling, and not a direct result of cell-autonomous loss of NF1. In a separate control experiment, we observed no difference in Rin between K33 (6.55 ± 0.19 MΩ) and UAS-NF1RNAi/+ larvae (6.16 ± 1.14 MΩ; two-tailed, unpaired, Student's t test: t(24) = 1.05, p = 0.30).
Figure 6.

An increase in postsynaptic Rin compensates for reduced evoked transmission in NF1P1 larvae. A, Postsynaptic Rin is significantly increased at the NFIP1 NMJ. B, Representative traces of the voltage response to injection of −1-nA current into the muscle, which was used to estimate the amplitude of Rin, for each genotype. C, A significant increase in postsynaptic Rin is seen at the NMJ of larvae following presynaptic [left-hand side: elav>NF1RNAi/+;Dicer2/+ (red dots) vs elav>GFPRNAi/+;Dicer2/+ (blue dots)], but not postsynaptic [right-hand side: MHC>NF1RNAi/+;Dicer2/+ (red dots) vs MHC>GFPRNAi/+;Dicer2/+ (blue dots)], knock-down of NF1, consistent with it being a homeostatic response to reduced synaptic drive. D, Muscle surface area (SA) is not significantly different between genotypes. E, F, There is no significant difference in pupal length between females or males, respectively, of the two genotypes. G, IV plot of leak currents as measured under voltage clamp from a holding potential of −80 mV. Current has been normalized to capacitance (pA/pF) to account for possible differences in muscle size. The slope of the NF1P1 linear regression is significantly different (p < 0.0001) to that of K33, as are pA/pF values at –150, −135, and –120 mV. All data are presented as mean ± SEM. All datasets were statistically compared via an unpaired, two-tailed Student's t test except for panels C and G, in which data were analyzed via two-way ANOVA followed by Sidak's post hoc test, to compare (C) elav>NF1RNAi/+;Dicer2/+ to elav>GFPRNAi/+;Dicer2/+ larvae, and MHC>NF1RNAi/+;Dicer2/+ to MHC>GFPRNAi/+;Dicer2/+ larvae, or (G) NF1P1and K33 larvae at each voltage step.
Table 6.
Statistical comparisons from Figure 6
| Control line | Experimental line | Test | t or F(df), p (if ANOVA) | p | |
|---|---|---|---|---|---|
| A | K33 | NF1P1 | Unpaired, two-tailed, Student's t test | t(24) = 4.96 | <0.0001 |
| C | elav>GFPRNAi/+;Dicer2/+ | elav>NF1RNAi/+;Dicer2/+ | Two-way ANOVA, Sidak's |
F(1,48) = 3.99 p = 0.05 |
0.002 |
| MHC>GFPRNAi/+;Dicer2/+ | MHC>NF1RNAi/+;Dicer2/+ | 0.78 (ns) | |||
| D | K33 | NF1P1 | Unpaired, two-tailed, Student's t test | t(24) = 0.19 | 0.85 (ns) |
| E | t(78) = 1.34 | 0.18 (ns) | |||
| F | t(78) = 1.31 | 0.19 (ns) | |||
| G | K33 (slope) | NF1P1 (slope) | ANCOVA |
F(1,178) = 37.81 p < 0.0001 |
n/a |
| K33 (−150 mV) | NF1P1 (−150 mV) | Two-way ANOVA, Sidak's |
F(6,168) = 6.24 p < 0.0001 |
<0.0001 | |
| K33 (−135 mV) | NF1P1 (−135 mV) | 0.0004 | |||
| K33 (−120 mV) | NF1P1 (−120 mV) | 0.02 | |||
| K33 (−105 mV) | NF1P1 (−105 mV) | 0.09 (ns) | |||
| K33 (−90 mV) | NF1P1 (−90 mV) | 0.88 (ns) | |||
| K33 (−75 mV) | NF1P1 (−75 mV) | 0.99 (ns) | |||
| K33 (−60 mV) | NF1P1 (−60 mV) | 0.26 (ns) |
The p value in the rightmost column refers to that of the t test (A, D–F) or the post hoc test following the two-way ANOVA (C and G). For panel G, multiple parameters were analyzed between the two lines (i.e., slope of the linear regression, and pA/pF at each voltage step). Therefore, each parameter is given in brackets next to the genotype. df = degrees of freedom. ns = not significant.
An increase in Rin may come about by either a decrease in muscle size or a reduction in leak current, a voltage-independent current that is present at rest and important in regulating membrane excitability. While reduced muscle size would seem plausible, given that a pupal growth defect is one of the most frequently observed phenotypes in Drosophila lacking NF1 expression (The et al., 1997; Walker et al., 2006, 2013), we observed no significant change to muscle surface area (segment A3) in NF1P1 larvae (Fig. 6D). Moreover, we were unable to discern any significant difference in pupal length between NF1P1 and K33 larvae for either females (Fig. 6E) or males (Fig. 6F). However, there was a significant reduction in the amplitude of the leak current in muscle 6 of NF1P1 larvae at more hyperpolarized potentials, as well as a significant difference in the slope of the linear regression (Fig. 6G; Table 6), which would imply a reduction in leak current at more depolarized potentials as well.
Reduced NF1 expression in cholinergic neurons is sufficient to induce neuronal hyperexcitability and tactile hypersensitivity
Our consistent observations of an increase in spontaneous release is indicative of an enhancement of neuronal excitability. Should loss of NF1 induce hyperexcitability within the CNS, as well as at the NMJ, this could incur downstream consequences on larval behavior. Therefore, we passively recorded endogenous activity from muscle 6 in semi-intact larval preparations in which the CNS had not been removed.
Typically, neuronal activity occurred in firing “bursts” (defined in Materials and Methods). We observed a significant increase in time spent burst firing in NF1P1 larvae over a 5-min period (Fig. 7A–D; Table 7). This was because of a significant increase in the number of individual bursts, rather than a change in mean burst duration. Furthermore, some traces (n = 3) for NF1P1 larvae displayed almost continuous firing across the recording period (lower NF1P1 trace, Fig. 7D), with individual bursts not obviously distinguishable from each other. In contrast, several K33 traces (n = 4) showed a complete absence of activity (lower K33 trace, Fig. 7D). Thus, it appears that loss of NF1 does indeed lead to hyperexcitability of motor neurons of Drosophila larvae.
Figure 7.
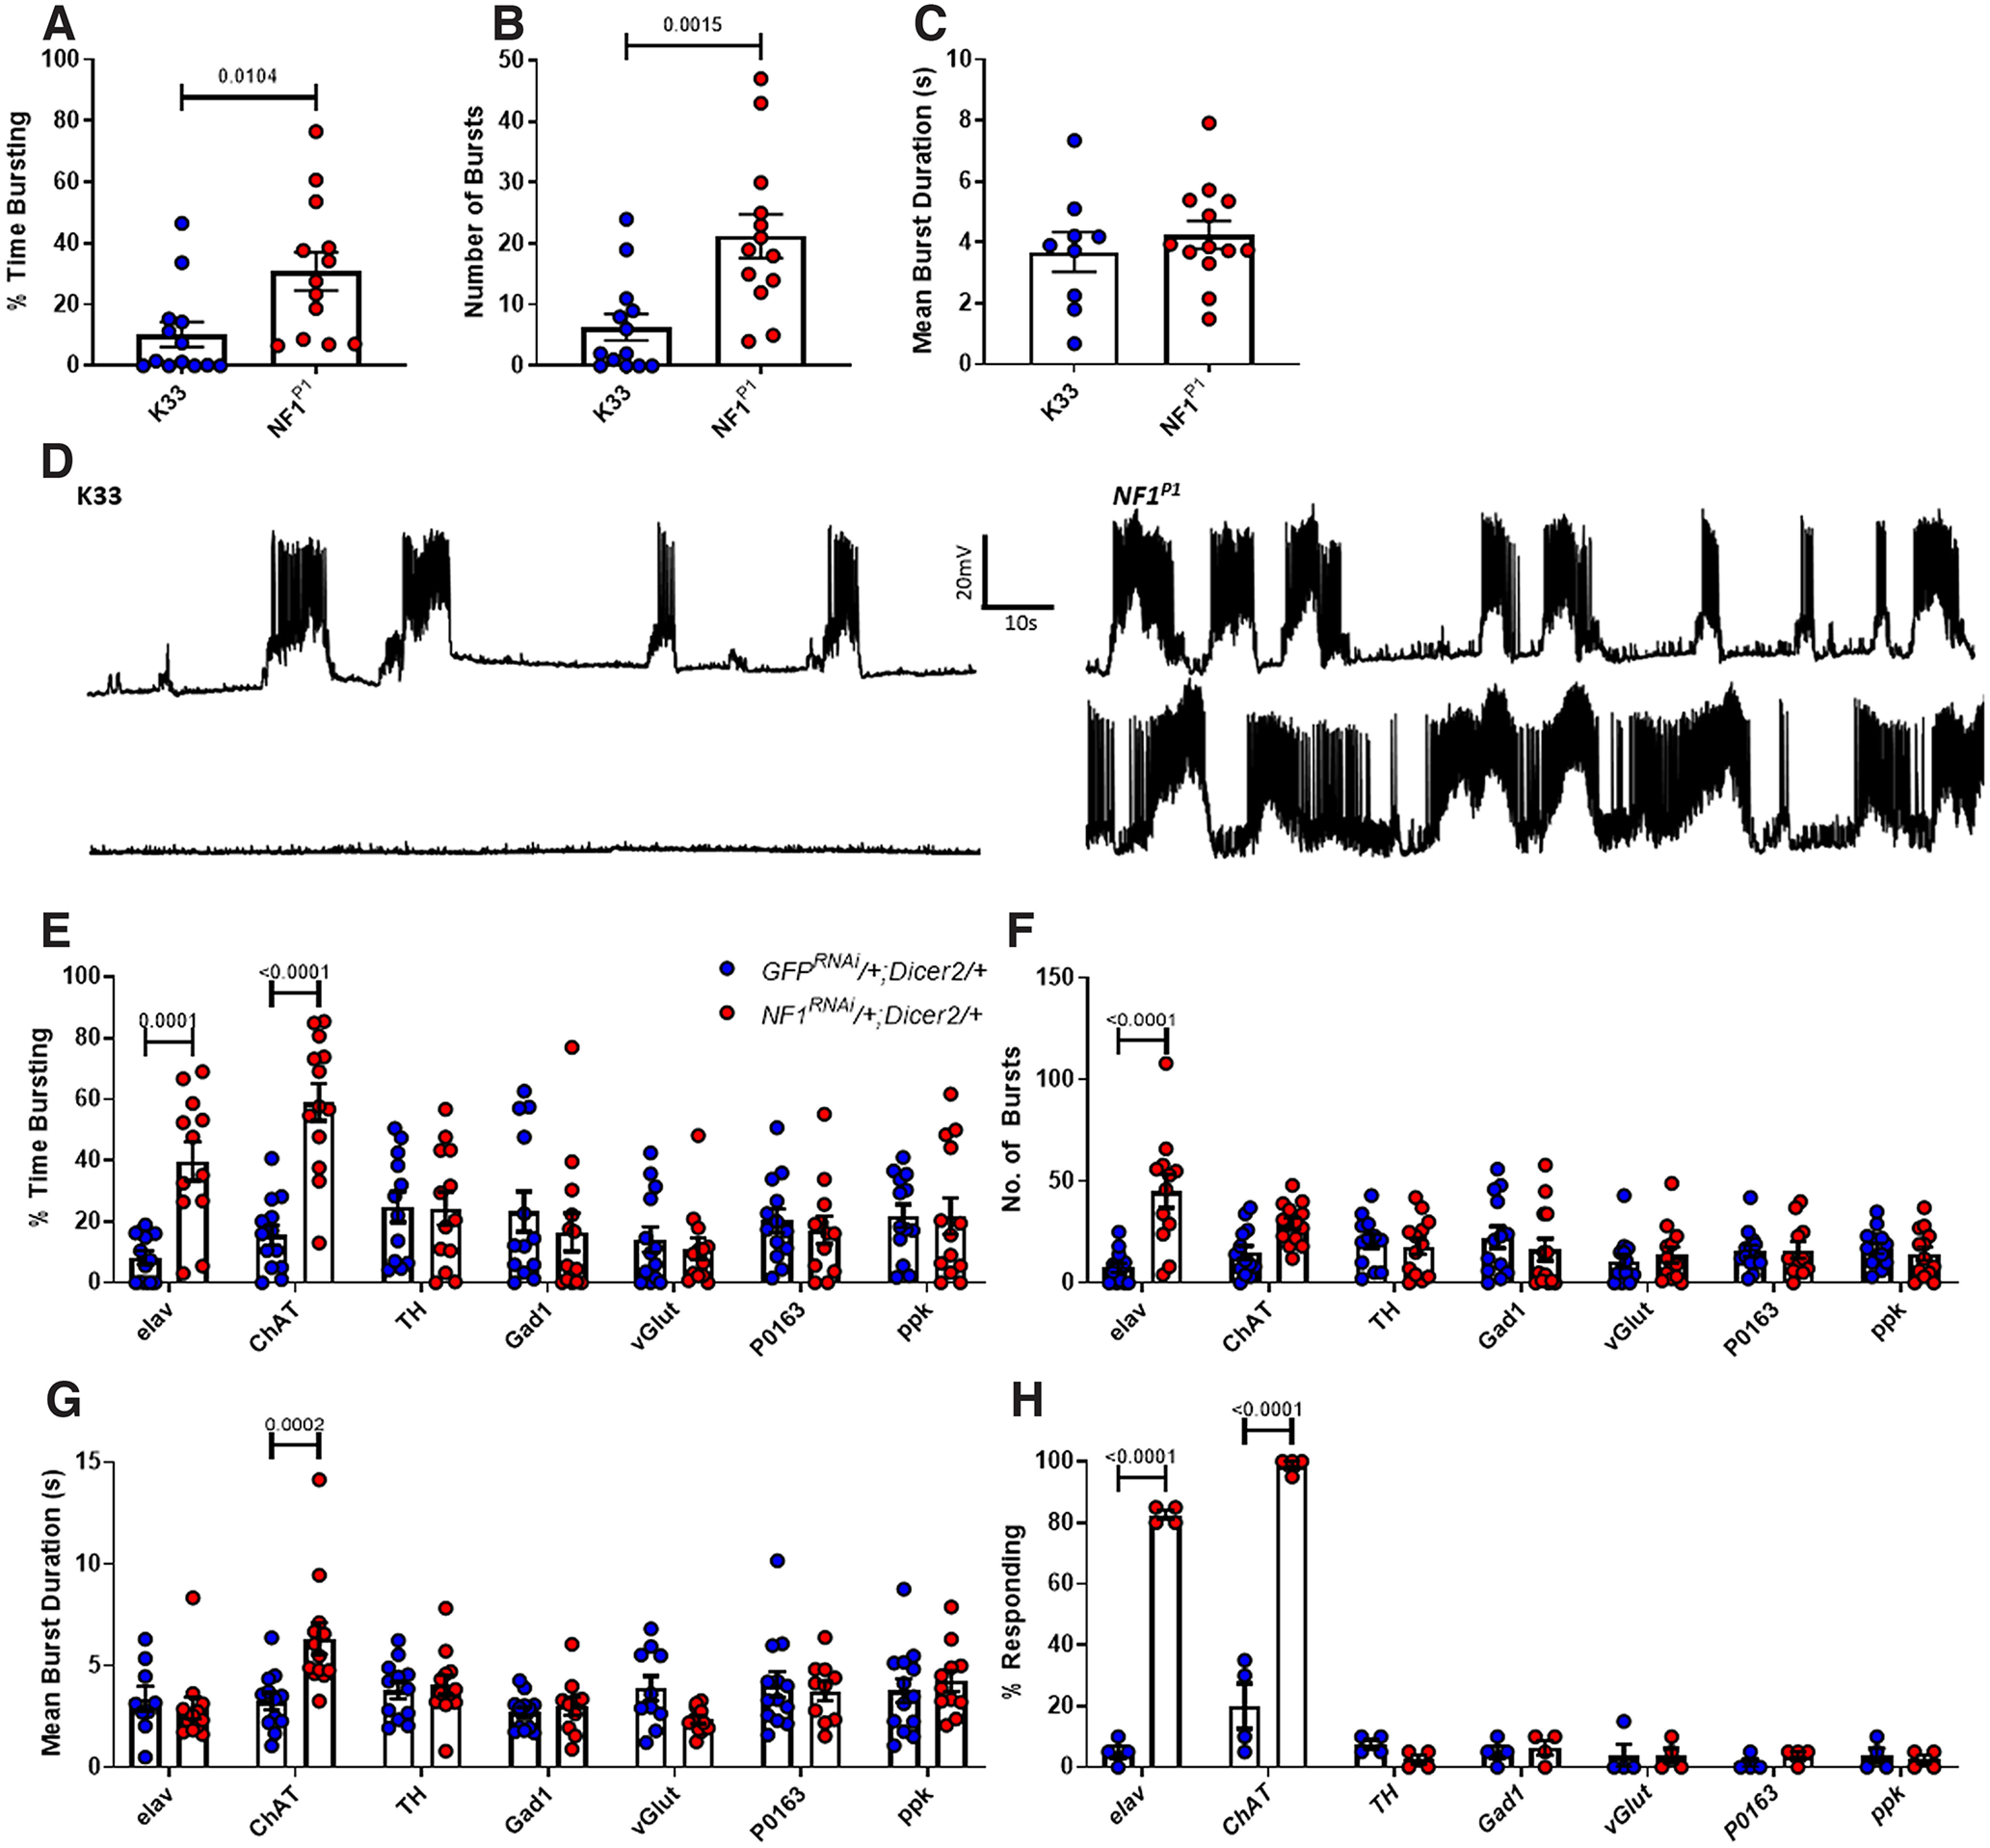
Loss of NF1 in cholinergic neurons results in neuronal hyperexcitability and tactile hypersensitivity. A–C, The percent time spent burst firing over a 5-min period was significantly greater for NF1P1 mutants compared with K33 controls, as was the number of individual bursts. In contrast, mean burst duration was unchanged between genotypes. D, Representative (top) and extreme (bottom) traces of burst firing for data in A–C. E, elav-driven knock-down of NF1 (elav>NF1RNAi/+;Dicer2/+) induces a significant increase in percent time bursting compared with elav>GFPRNAi/+;Dicer2/+ controls, as does that by ChAT-GAL4 (ChAT>NF1RNAi/+;Dicer2/+) compared with ChAT> GFPRNAi/+;Dicer2/+ controls. In contrast, TH-driven, Gad1-driven, vGlut-driven, P0136-driven, and ppk-driven knock-downs do not. F, As observed in NF1P1 larvae, excessive firing in elav>NF1RNAi/+;Dicer2/+ larvae arises from an increased number of bursts. While there is an increase in burst number for ChAT>NF1RNAi/+;Dicer2/+ larvae, this is nonsignificant. G, ChAT>NF1RNAi/+;Dicer2/+ larvae exhibit excessive activity via an augmented mean burst duration, which is not seen in any other line. H, Only elav-driven and ChAT-driven knock-downs of NF1 (elav>NF1RNAi/+;Dicer2/+ and ChAT>NF1RNAi/+;Dicer2/+, respectively) result in tactile hypersensitivity. All data are presented as mean ± SEM. All statistical analyses in A–C were conducted via unpaired Student's t test. Panels E–H were analyzed via two-way ANOVA followed by Sidak's post hoc test to compare GFPRNAi/+;Dicer2/+ (blue dots) and NF1RNAi/+;Dicer2/+ (red dots) lines within each GAL4 driver group.
Table 7.
Statistical comparisons from Figure 7
| Control line | Experimental line | Test | t or F(df), p (if ANOVA) | p | |
|---|---|---|---|---|---|
| A | K33 | NF1P1 | Unpaired, two-tailed, Student's t test | t(24) = 2.78 | 0.01 |
| B | t(24) = 3.58 | 0.002 | |||
| C | t(20) = 0.72 | 0.48 (ns) | |||
| E | elav>GFPRNAi/+;Dicer2/+ | elav>NF1RNAi/+;Dicer2/+ | Two-way ANOVA, Sidak's |
F(6,165) = 8.22 p < 0.0001 |
0.0001 |
| ChAT>GFPRNAi/+;Dicer2/+ | ChAT>NF1RNAi/+;Dicer2/+ | <0.0001 | |||
| TH>GFPRNAi/+;Dicer2/+ | TH>NF1RNAi/+;Dicer2/+ | >0.99 (ns) | |||
| Gad1>GFPRNAi/+;Dicer2/+ | Gad1>NF1RNAi/+;Dicer2/+ | 0.94 (ns) | |||
| vGlut>GFPRNAi/+;Dicer2/+ | vGlut>NF1RNAi/+;Dicer2/+ | 0.99 (ns) | |||
| P0163>GFPRNAi/+;Dicer2/+ | P0163>NF1RNAi/+;Dicer2/+ | 0.99 (ns) | |||
| ppk>GFPRNAi/+;Dicer2/+ | ppk>NF1RNAi/+;Dicer2/+ | >0.99 (ns) | |||
| F | elav>GFPRNAi/+;Dicer2/+ | elav>NF1RNAi/+;Dicer2/+ |
F(6,164) = 6.76 p < 0.0001 |
<0.0001 | |
| ChAT>GFPRNAi/+;Dicer2/+ | ChAT>NF1RNAi/+;Dicer2/+ | 0.11 (ns) | |||
| TH>GFPRNAi/+;Dicer2/+ | TH>NF1RNAi/+;Dicer2/+ | 0.99 (ns) | |||
| Gad1>GFPRNAi/+;Dicer2/+ | Gad1>NF1RNAi/+;Dicer2/+ | 0.91 (ns) | |||
| vGlut>GFPRNAi/+;Dicer2/+ | vGlut>NF1RNAi/+;Dicer2/+ | 0.99 (ns) | |||
| P0163>GFPRNAi/+;Dicer2/+ | P0163>NF1RNAi/+;Dicer2/+ | >0.99 (ns) | |||
| ppk>GFPRNAi/+;Dicer2/+ | ppk>NF1RNAi/+;Dicer2/+ | 0.99 (ns) | |||
| G | elav>GFPRNAi/+;Dicer2/+ | elav>NF1RNAi/+;Dicer2/+ |
F(6,146) = 3.77 p = 0.002 |
0.99 (ns) | |
| ChAT>GFPRNAi/+;Dicer2/+ | ChAT>NF1RNAi/+;Dicer2/+ | 0.0002 | |||
| TH>GFPRNAi/+;Dicer2/+ | TH>NF1RNAi/+;Dicer2/+ | 0.99 (ns) | |||
| Gad1>GFPRNAi/+;Dicer2/+ | Gad1>NF1RNAi/+;Dicer2/+ | 0.99 (ns) | |||
| vGlut>GFPRNAi/+;Dicer2/+ | vGlut>NF1RNAi/+;Dicer2/+ | 0.29 (ns) | |||
| P0163>GFPRNAi/+;Dicer2/+ | P0163>NF1RNAi/+;Dicer2/+ | 0.99 (ns) | |||
| ppk>GFPRNAi/+;Dicer2/+ | ppk>NF1RNAi/+;Dicer2/+ | 0.99 (ns) | |||
| H | elav>GFPRNAi/+;Dicer2/+ | elav>NF1RNAi/+;Dicer2/+ |
F(6,42) = 96.87 p < 0.0001 |
<0.0001 | |
| ChAT>GFPRNAi/+;Dicer2/+ | ChAT>NF1RNAi/+;Dicer2/+ | <0.0001 | |||
| TH>GFPRNAi/+;Dicer2/+ | TH>NF1RNAi/+;Dicer2/+ | 0.80 (ns) | |||
| Gad1>GFPRNAi/+;Dicer2/+ | Gad1>NF1RNAi/+;Dicer2/+ | >0.99 (ns) | |||
| vGlut>GFPRNAi/+;Dicer2/+ | vGlut>NF1RNAi/+;Dicer2/+ | >0.99 (ns) | |||
| P0163>GFPRNAi/+;Dicer2/+ | P0163>NF1RNAi/+;Dicer2/+ | 0.99 (ns) | |||
| ppk>GFPRNAi/+;Dicer2/+ | ppk>NF1RNAi/+;Dicer2/+ | >0.99 (ns) |
The p value in the rightmost column refers to that of the t test (A–C) or post hoc test following the two-way ANOVA (E–H). df = degrees of freedom. ns = not significant.
To determine whether loss of NF1 in the CNS is responsible for the excessive endogenous firing we observed, we conducted a series of NF1 knock-downs targeted to different neuronal subtypes. In accord with the data above, pan-neuronal (elav) knock-down of NF1 led to excessive burst firing because of an increase in burst number, but not burst duration (Fig. 7E–G; Table 7). In subsequent, neuron subtype-specific knock-down experiments, only cholinergic (ChAT) knock-down of NF1 caused a significant increase in overall burst firing (Fig. 7E), consistent with the deficit arising in excitatory interneurons of the CNS as ∼80% of CNS neurons in Drosophila are cholinergic (Lee and O'Dowd, 1999). Knock-down of NF1 in peripheral sensory neurons using several GAL4 drivers (ppk and P0163) was unable to induce excessive firing, further confirming that the deficit is central in origin. Moreover, dopaminergic (TH), GABAergic (Gad1) or glutamatergic (vGlut) knock-down failed to affect neuronal activity (Fig. 7E). We also found that the manner in which activity is altered in ChAT>NF1RNAi/+;Dicer2/+ larvae is different to that in NF1P1 and elav>NF1RNAi/+;Dicer2/+ larvae; following cholinergic knock-down of NF1, mean burst duration is significantly increased, but the increase in burst number is not statistically significant (Fig. 7F,G). Therefore, while loss of NF1 in excitatory cholinergic neurons of the CNS is sufficient to cause neuronal hyperexcitability, it remains possible that the exact nature of this phenotype may be shaped by loss of NF1 in other cell populations.
Next, we investigated whether neuronal hyperexcitability correlates with hypersensitivity to mechanical stimuli. Indeed, only elav-driven and ChAT-driven knock-down of NF1 recapitulated the tactile hypersensitivity phenotype (Fig. 7H; Table 7). While no conclusions on the causal nature of this relationship can be drawn from these data alone, given that, as mentioned above, the large majority of CNS neurons are cholinergic, it is still consistent with the possibility that neuronal hyperexcitability in the CNS underlies hypersensitivity to mechanical stimulation in NF1−/− mutant larvae. Note that, in two additional control experiments comparing UAS-NF1RNAi/+ and K33 larvae, we did not observe a significant difference in percentage time spent burst firing (K33: 6.61 ± 2.64%; UAS-NF1RNAi/+: 5.01 ± 1.88%; two-tailed, unpaired, Student's t test: t(24) = 0.50, p = 0.62) or the percentage of larvae responding to a mechanical stimulus (K33: 3.75 ± 2.39%; UAS-NF1RNAi/+: 5.00 ± 2.89%; two-tailed, unpaired, Student's t test: t(6) = 0.33, p = 0.75).
Increased Ras signaling underlies impaired synaptic transmission and tactile hypersensitivity
In both vertebrates and invertebrates, NF1 has been implicated in myriad molecular pathways, with its most prominent molecular role being a Ras-GAP that functions to inhibit Ras activity by catalyzing the hydrolysis of active Ras-GTP to inactive Ras-GDP. Consequently, loss of NF1 leads to excessive Ras signaling (Bergoug et al., 2020), and levels of phosphorylated MAPK have been shown to be augmented in the NF1P1 mutant, indicative of excessive Ras activity (Williams et al., 2001; Botero et al., 2021). Therefore, we investigated whether this might explain the role of NF1 in regulating synaptic transmission and larval mechanoreception. We hereafter use spontaneous miniature transmission (i.e., mEJP frequency) as a measure of neuronal excitability (Mosca et al., 2005).
Drosophila possess two Ras proteins against which NF1 has been shown to exert GAP activity: Ras85D (also termed Ras1), which is homologous to human H-Ras, K-Ras, N-Ras, and Ras64B (also termed Ras2), which is homologous to human R-Ras proteins (Walker et al., 2006). We used pan-neuronal (via elav-Gal4) RNAi to attenuate expression of these two proteins in the NF1P1 mutant background. Knock-down of either Ras64B (Fig. 8; Table 8) or Ras85D (Fig. 9; Table 9) restored mEJP frequency, mEJP amplitude, and quantal content to levels not significantly different from heterozygote controls, as well as fully rescuing the tactile hypersensitivity phenotype. Efficacy of the UAS-RNAi transgenes was confirmed via RT-qPCR: pan-neuronal expression of Ras64BRNAi (elav> Ras64BRNAi/+;NF1P1) and Ras85DRNAi (elav> Ras85DRNAi/+;NF1P1) reduced levels of each gene to 48.1 (±20.1)% and 28.1 (±10.5)% relative to those in the elav/+;;NF1P1 line, respectively.
Figure 8.
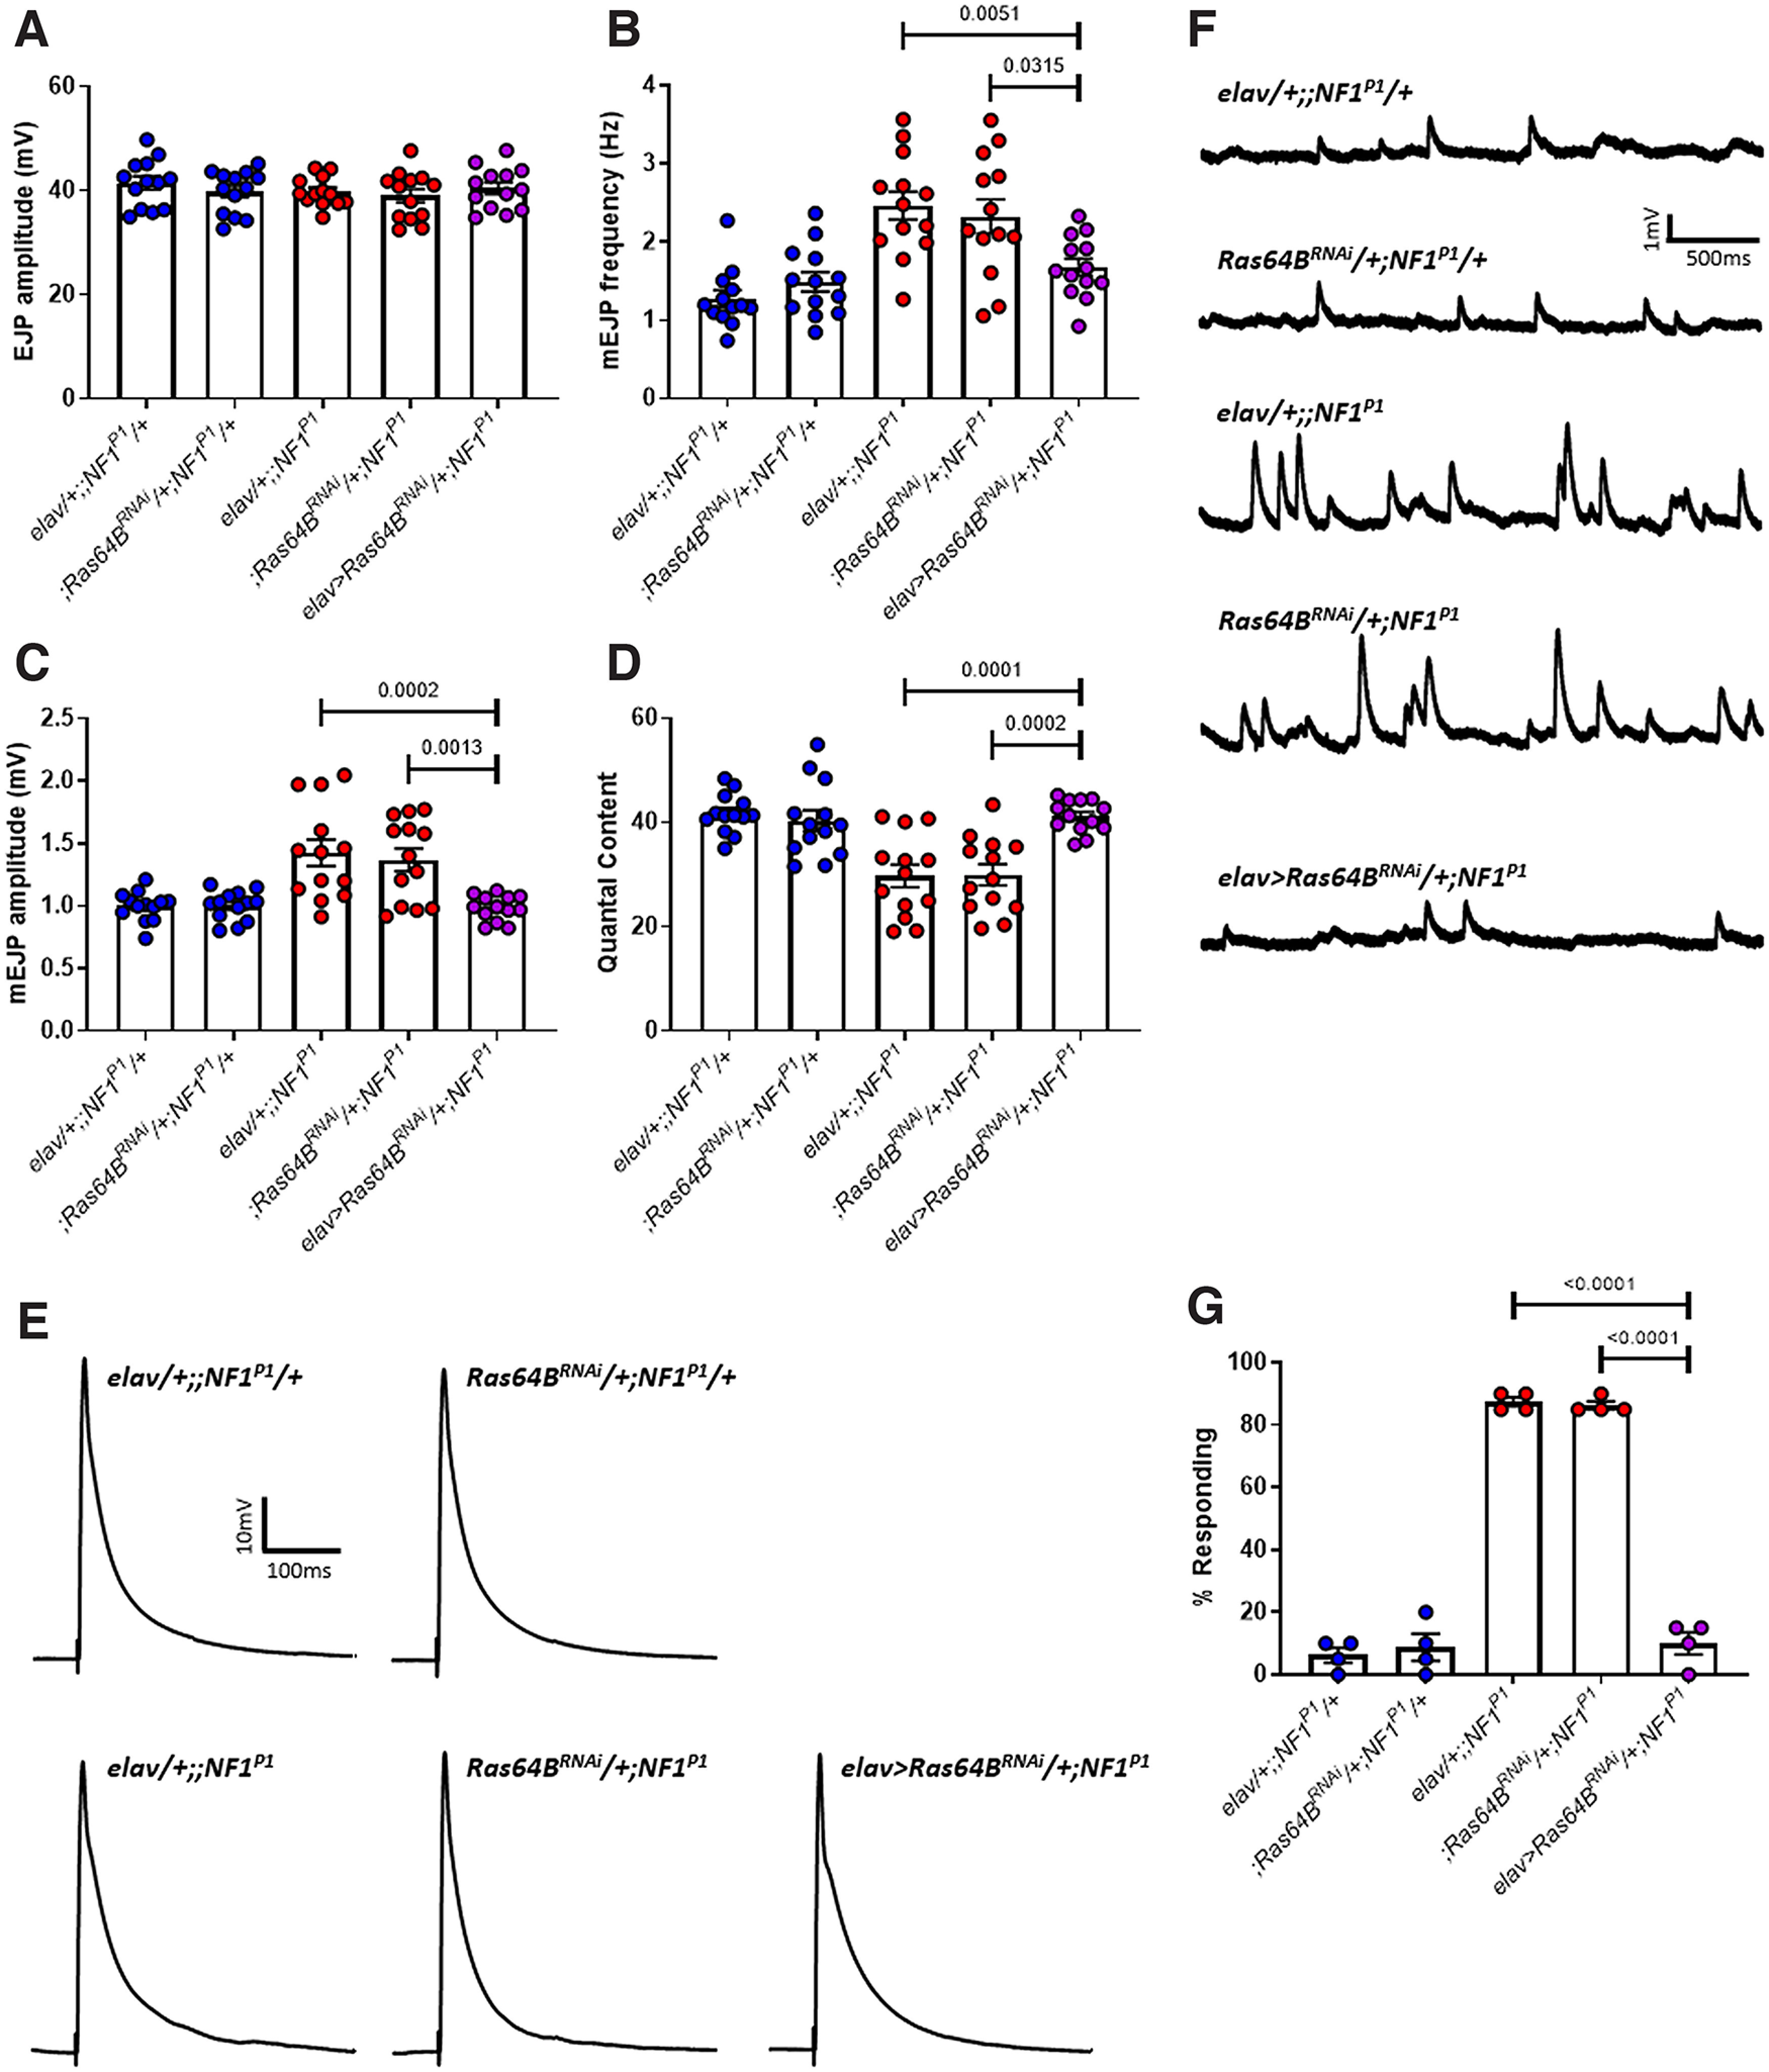
Knock-down of Ras64B rescues synaptic transmission deficits and tactile hypersensitivity in NF1P1 larvae. A, EJP amplitude was not significantly different between any of the lines tested. B, mEJP frequency in elav>Ras64BRNAi/+;NF1P1 larvae (rescue line; purple circles) is significantly reduced compared with both homozygous mutant lines (red circles). Expression of UAS-Ras64BRNAi also rescues (C) increased mEJP amplitude and (D) reduced quantal content. There were no significant differences between the rescue line and either heterozygous control (blue circles) for any parameter examined. Furthermore, in panels B–D, both heterozygous controls were significantly different to both homozygous mutant controls, and there were no significant differences between either of the heterozygous controls or either of the homozygous mutant controls, respectively. E, F, Representative traces of EJPs and mEJPs, respectively, for each of the lines tested in A–D. G, Pan-neuronal expression of UAS-Ras64BRNAi is sufficient to rescue tactile hypersensitivity in NF1P1 larvae. All data are presented as mean ± SEM. All statistical comparisons were made via one-way ANOVA followed by Tukey's multiple comparisons test.
Table 8.
Statistical comparisons from Figure 8
| Control line | Experimental line | Test | F(df), p | p | |
|---|---|---|---|---|---|
| A | elav/+;;NF1P1/+ | elav>Ras64BRNAi/+;NF1P1 | One-way ANOVA, Tukey's |
F(4,60) = 0.64 p = 0.64 |
n/a |
| Ras64BRNAi/+;NF1P1/+ | |||||
| elav/+;;NF1P1 | |||||
| Ras64BRNAi/+;NF1P1 | |||||
| B | elav/+;;NF1P1/+ | elav>Ras64BRNAi/+;NF1P1 |
F(4,60) = 11.64 p < 0.0001 |
0.35 (ns) | |
| Ras64BRNAi/+;NF1P1/+ | 0.91 (ns) | ||||
| elav/+;;NF1P1 | 0.005 | ||||
| Ras64BRNAi/+;NF1P1 | 0.03 | ||||
| C | elav/+;;NF1P1/+ | elav>Ras64BRNAi/+;NF1P1 |
F(4,60) = 10.93 p < 0.0001 |
>0.99 (ns) | |
| Ras64BRNAi/+;NF1P1/+ | 0.99 (ns) | ||||
| elav/+;;NF1P1 | 0.0002 | ||||
| Ras64BRNAi/+;NF1P1 | 0.001 | ||||
| D | elav/+;;NF1P1/+ | elav>Ras64BRNAi/+;NF1P1 |
F(4,60) = 13.03 p < 0.0001 |
0.99 (ns) | |
| Ras64BRNAi/+;NF1P1/+ | 0.99 (ns) | ||||
| elav/+;;NF1P1 | 0.0001 | ||||
| Ras64BRNAi/+;NF1P1 | 0.0002 | ||||
| G | elav/+;;NF1P1/+ | elav>Ras64BRNAi/+;NF1P1 |
F(4,15) = 231.0 p < 0.0001 |
0.88 (ns) | |
| Ras64BRNAi/+;NF1P1/+ | 0.99 (ns) | ||||
| elav/+;;NF1P1 | <0.0001 | ||||
| Ras64BRNAi/+;NF1P1 | <0.0001 |
The p value in the rightmost column refers to that of the post hoc test following the one-way ANOVA. df = degrees of freedom. Where the p value of the ANOVA was not significant (A), no post hoc p value is given. ns = not significant.
Figure 9.
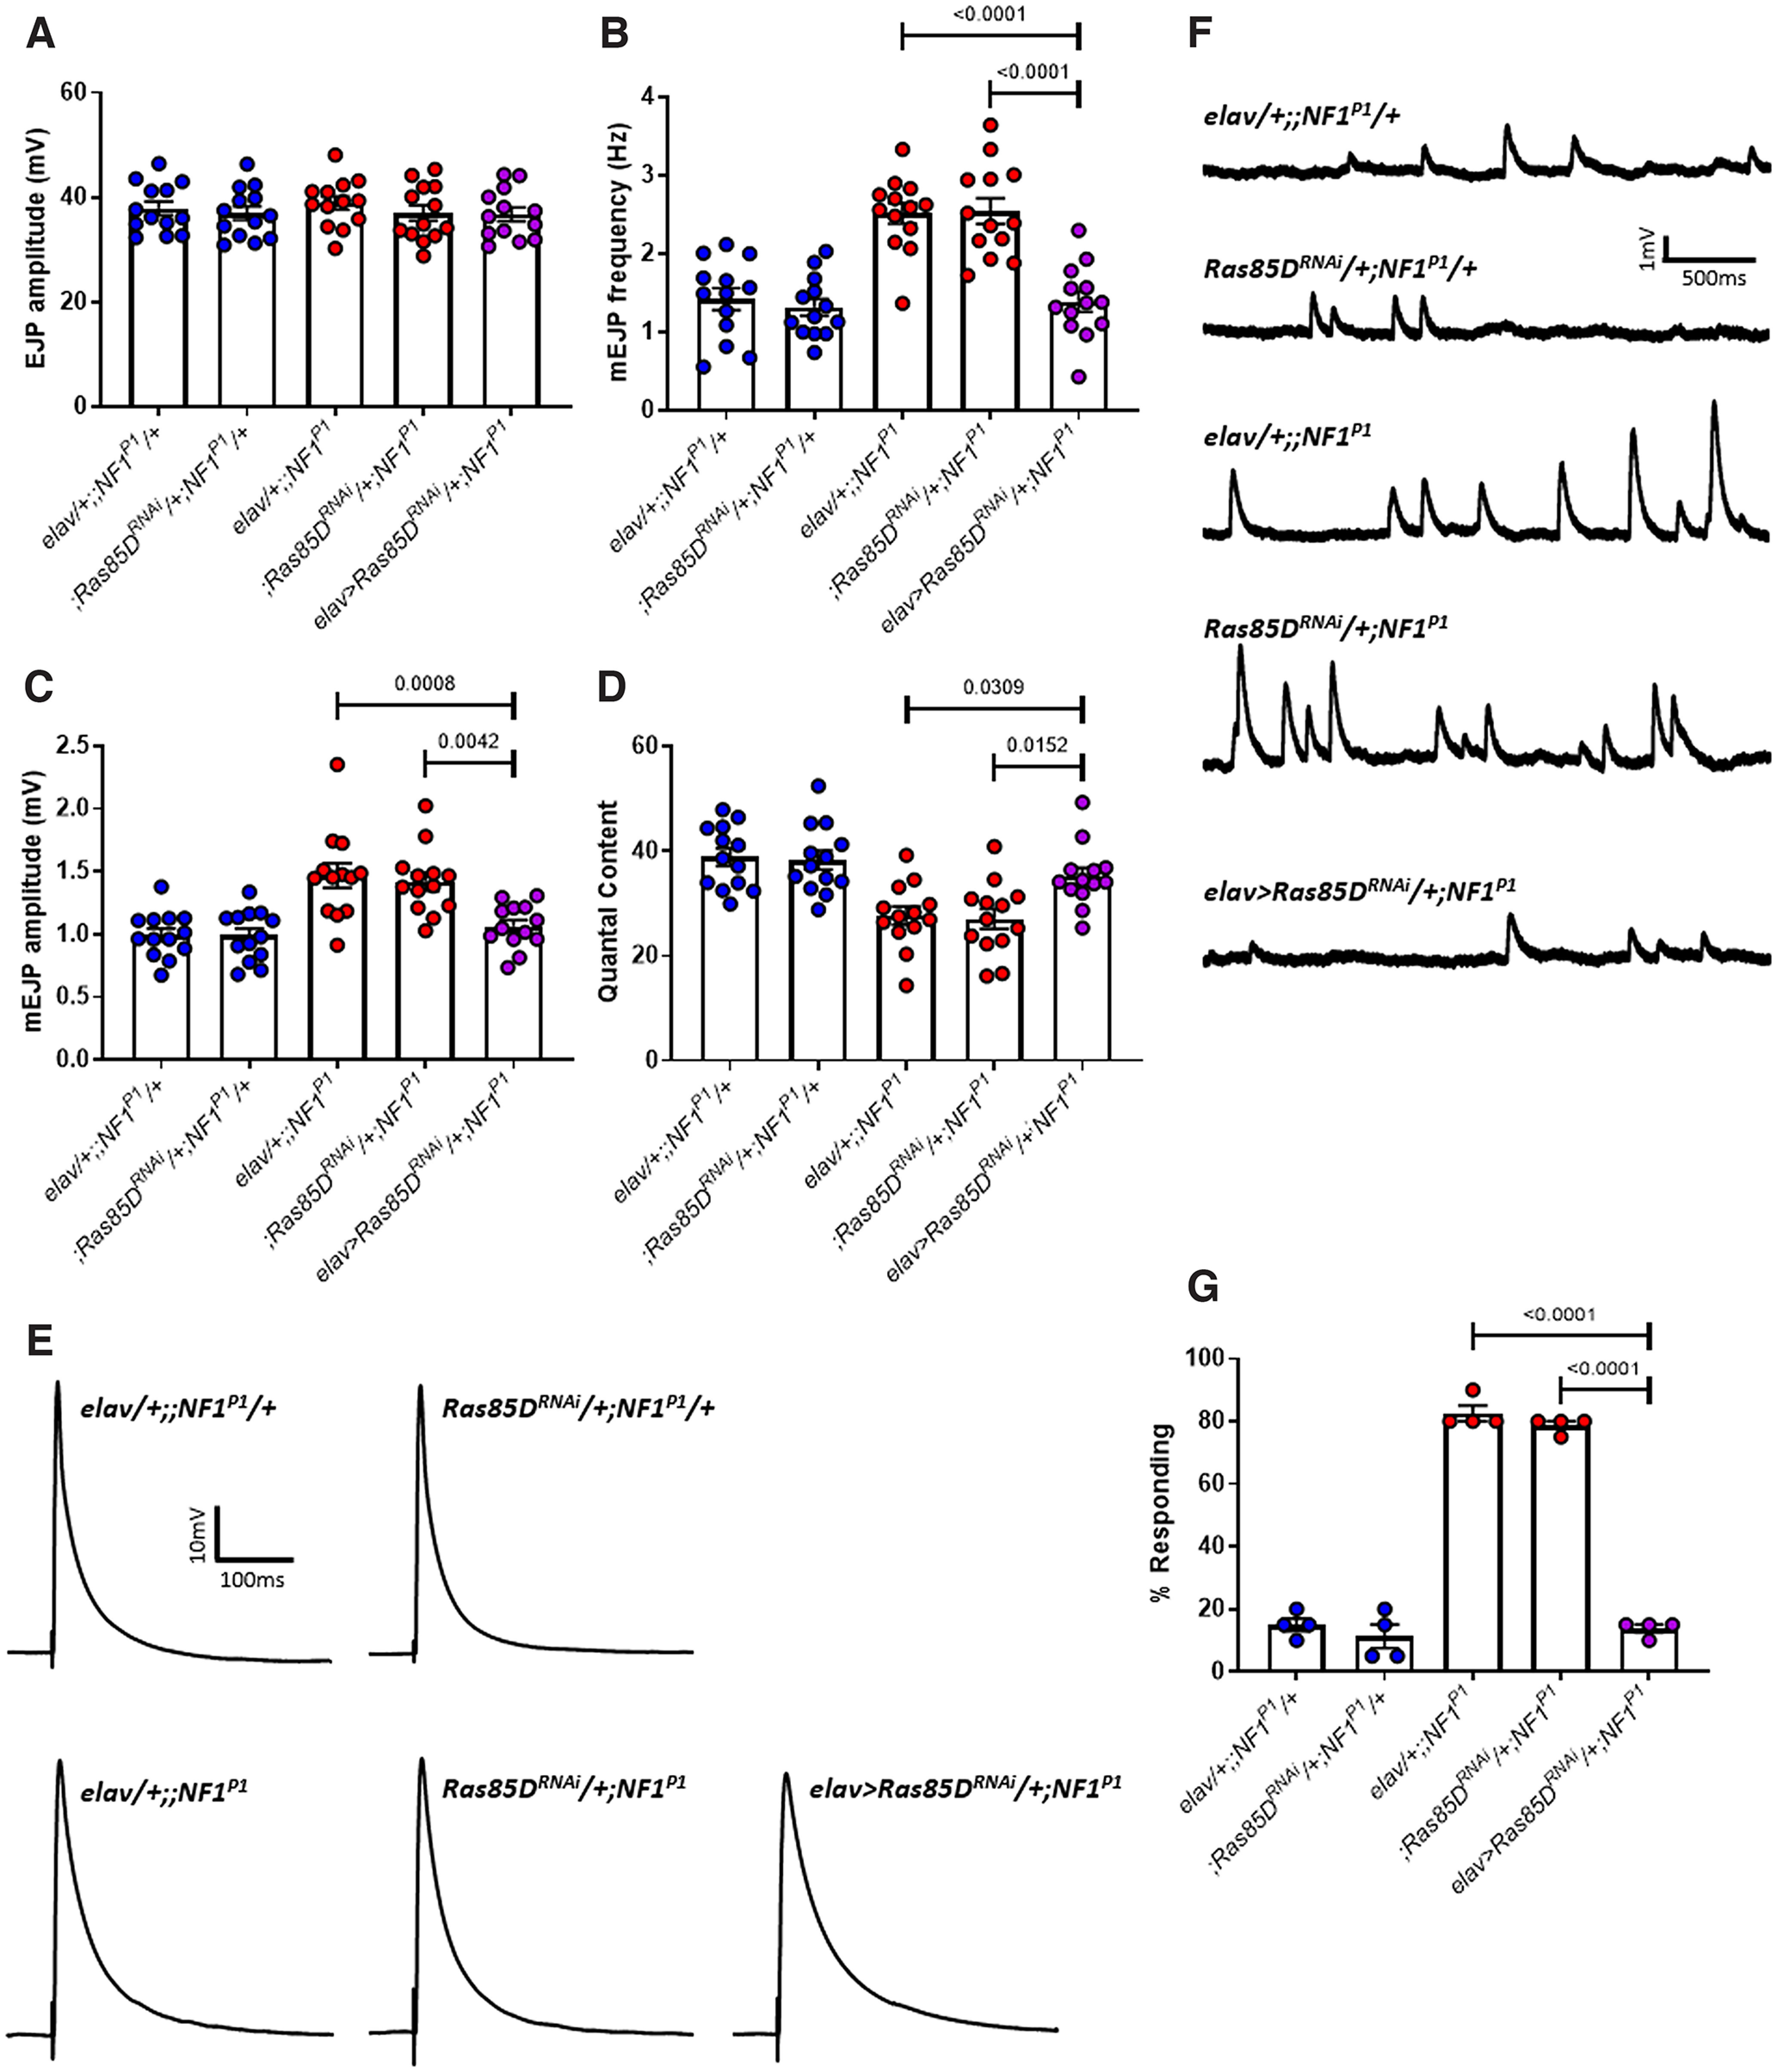
Knock-down of Ras85D rescues synaptic transmission deficits and tactile hypersensitivity in NF1P1 larvae. A, EJP amplitude was not significantly different between any of the lines tested. B, mEJP frequency in elav>Ras85DRNAi/+;NF1P1 larvae (rescue line; purple circles) is significantly reduced compared with both homozygous mutant lines (red circles). Expression of UAS-Ras85DRNAi also rescues (C) increased mEJP amplitude and (D) reduced quantal content. There were no significant differences between the rescue line and either heterozygous control (blue circles) for any parameter examined. Furthermore, in panels B–D, both heterozygous controls were significantly different to both homozygous mutant controls, and there were no significant differences between either of the heterozygous controls or either of the homozygous mutant controls, respectively. E, F, Representative traces of EJPs and mEJPs, respectively, for each of the lines tested in A–D. G, Pan-neuronal expression of UAS-Ras85DRNAi is sufficient to rescue tactile hypersensitivity in NF1P1 larvae. All data are presented as mean ± SEM. All statistical comparisons were made via a one-way ANOVA followed by Tukey's post hoc test.
Table 9.
Statistical comparisons from Figure 9
| Control line | Experimental line | Test | F(df), p | p | |
|---|---|---|---|---|---|
| A | elav/+;;NF1P1/+ | elav>Ras85DRNAi/+;NF1P1 | One-way ANOVA, Tukey's |
F(4,60) = 0.44 p = 0.78 |
n/a |
| Ras85DRNAi/+;NF1P1/+ | |||||
| elav/+;;NF1P1 | |||||
| Ras85DRNAi/+;NF1P1 | |||||
| B | elav/+;;NF1P1/+ | elav>Ras85DRNAi/+;NF1P1 |
F(4,60) = 21.70 p < 0.0001 |
0.99 (ns) | |
| Ras85DRNAi/+;NF1P1/+ | 0.99 (ns) | ||||
| elav/+;;NF1P1 | <0.0001 | ||||
| Ras85DRNAi/+;NF1P1 | <0.0001 | ||||
| C | elav/+;;NF1P1/+ | elav>Ras85DRNAi/+;NF1P1 |
F(4,60) = 12.15 p < 0.0001 |
0.95 (ns) | |
| Ras85DRNAi/+;NF1P1/+ | 0.94 (ns) | ||||
| elav/+;;NF1P1 | 0.0008 | ||||
| Ras85DRNAi/+;NF1P1 | 0.004 | ||||
| D | elav/+;;NF1P1/+ | elav>Ras85DRNAi/+;NF1P1 |
F(4,60) = 10.49 p < 0.0001 |
0.57 (ns) | |
| Ras85DRNAi/+;NF1P1/+ | 0.71 (ns) | ||||
| elav/+;;NF1P1 | 0.03 | ||||
| Ras85DRNAi/+;NF1P1 | 0.02 | ||||
| G | elav/+;;NF1P1/+ | elav>Ras85DRNAi/+;NF1P1 |
F(4,15) = 246.7 p < 0.0001 |
0.99 (ns) | |
| Ras85DRNAi/+;NF1P1/+ | 0.94 (ns) | ||||
| elav/+;;NF1P1 | <0.0001 | ||||
| Ras85DRNAi/+;NF1P1 | <0.0001 |
The p value in the rightmost column refers to that of the post hoc test following the one-way ANOVA. df = degrees of freedom. Where the p value of the ANOVA was not significant (A), no post hoc p value is given. ns = not significant.
Knock-down of Ras64B in wild-type larvae (elav>Ras64BRNAi/+) had no effect on EJP amplitude, mEJP frequency, or quantal content (Fig. 10A–F; Table 10). Knock-down of Ras85D in wild-type larvae (elav>Ras85DRNAi/+) also did not alter EJP amplitude or mEJP frequency compared with either elav/+ or Ras85DRNAi/+ controls (i.e., parental lines crossed to K33), but did induce a significant reduction in mEJP amplitude and a significant increase in quantal content relative to the Ras85DRNAi/+ control only (Fig. 10G–L; Table 10). While this observation is consistent with the effect of Ras85D knock-down in the NF1P1 mutant, it should be interpreted with caution given that significance is not reached when comparing elav>Ras85DRNAi/+ to the elav/+ control. Moreover, knock-down of neither Ras64B (Fig. 10M; Table 10) or Ras85D (Fig. 10N; Table 10) had any effect on tactile sensory relative to controls (i.e., progeny of parental lines crossed to K33).
Figure 10.
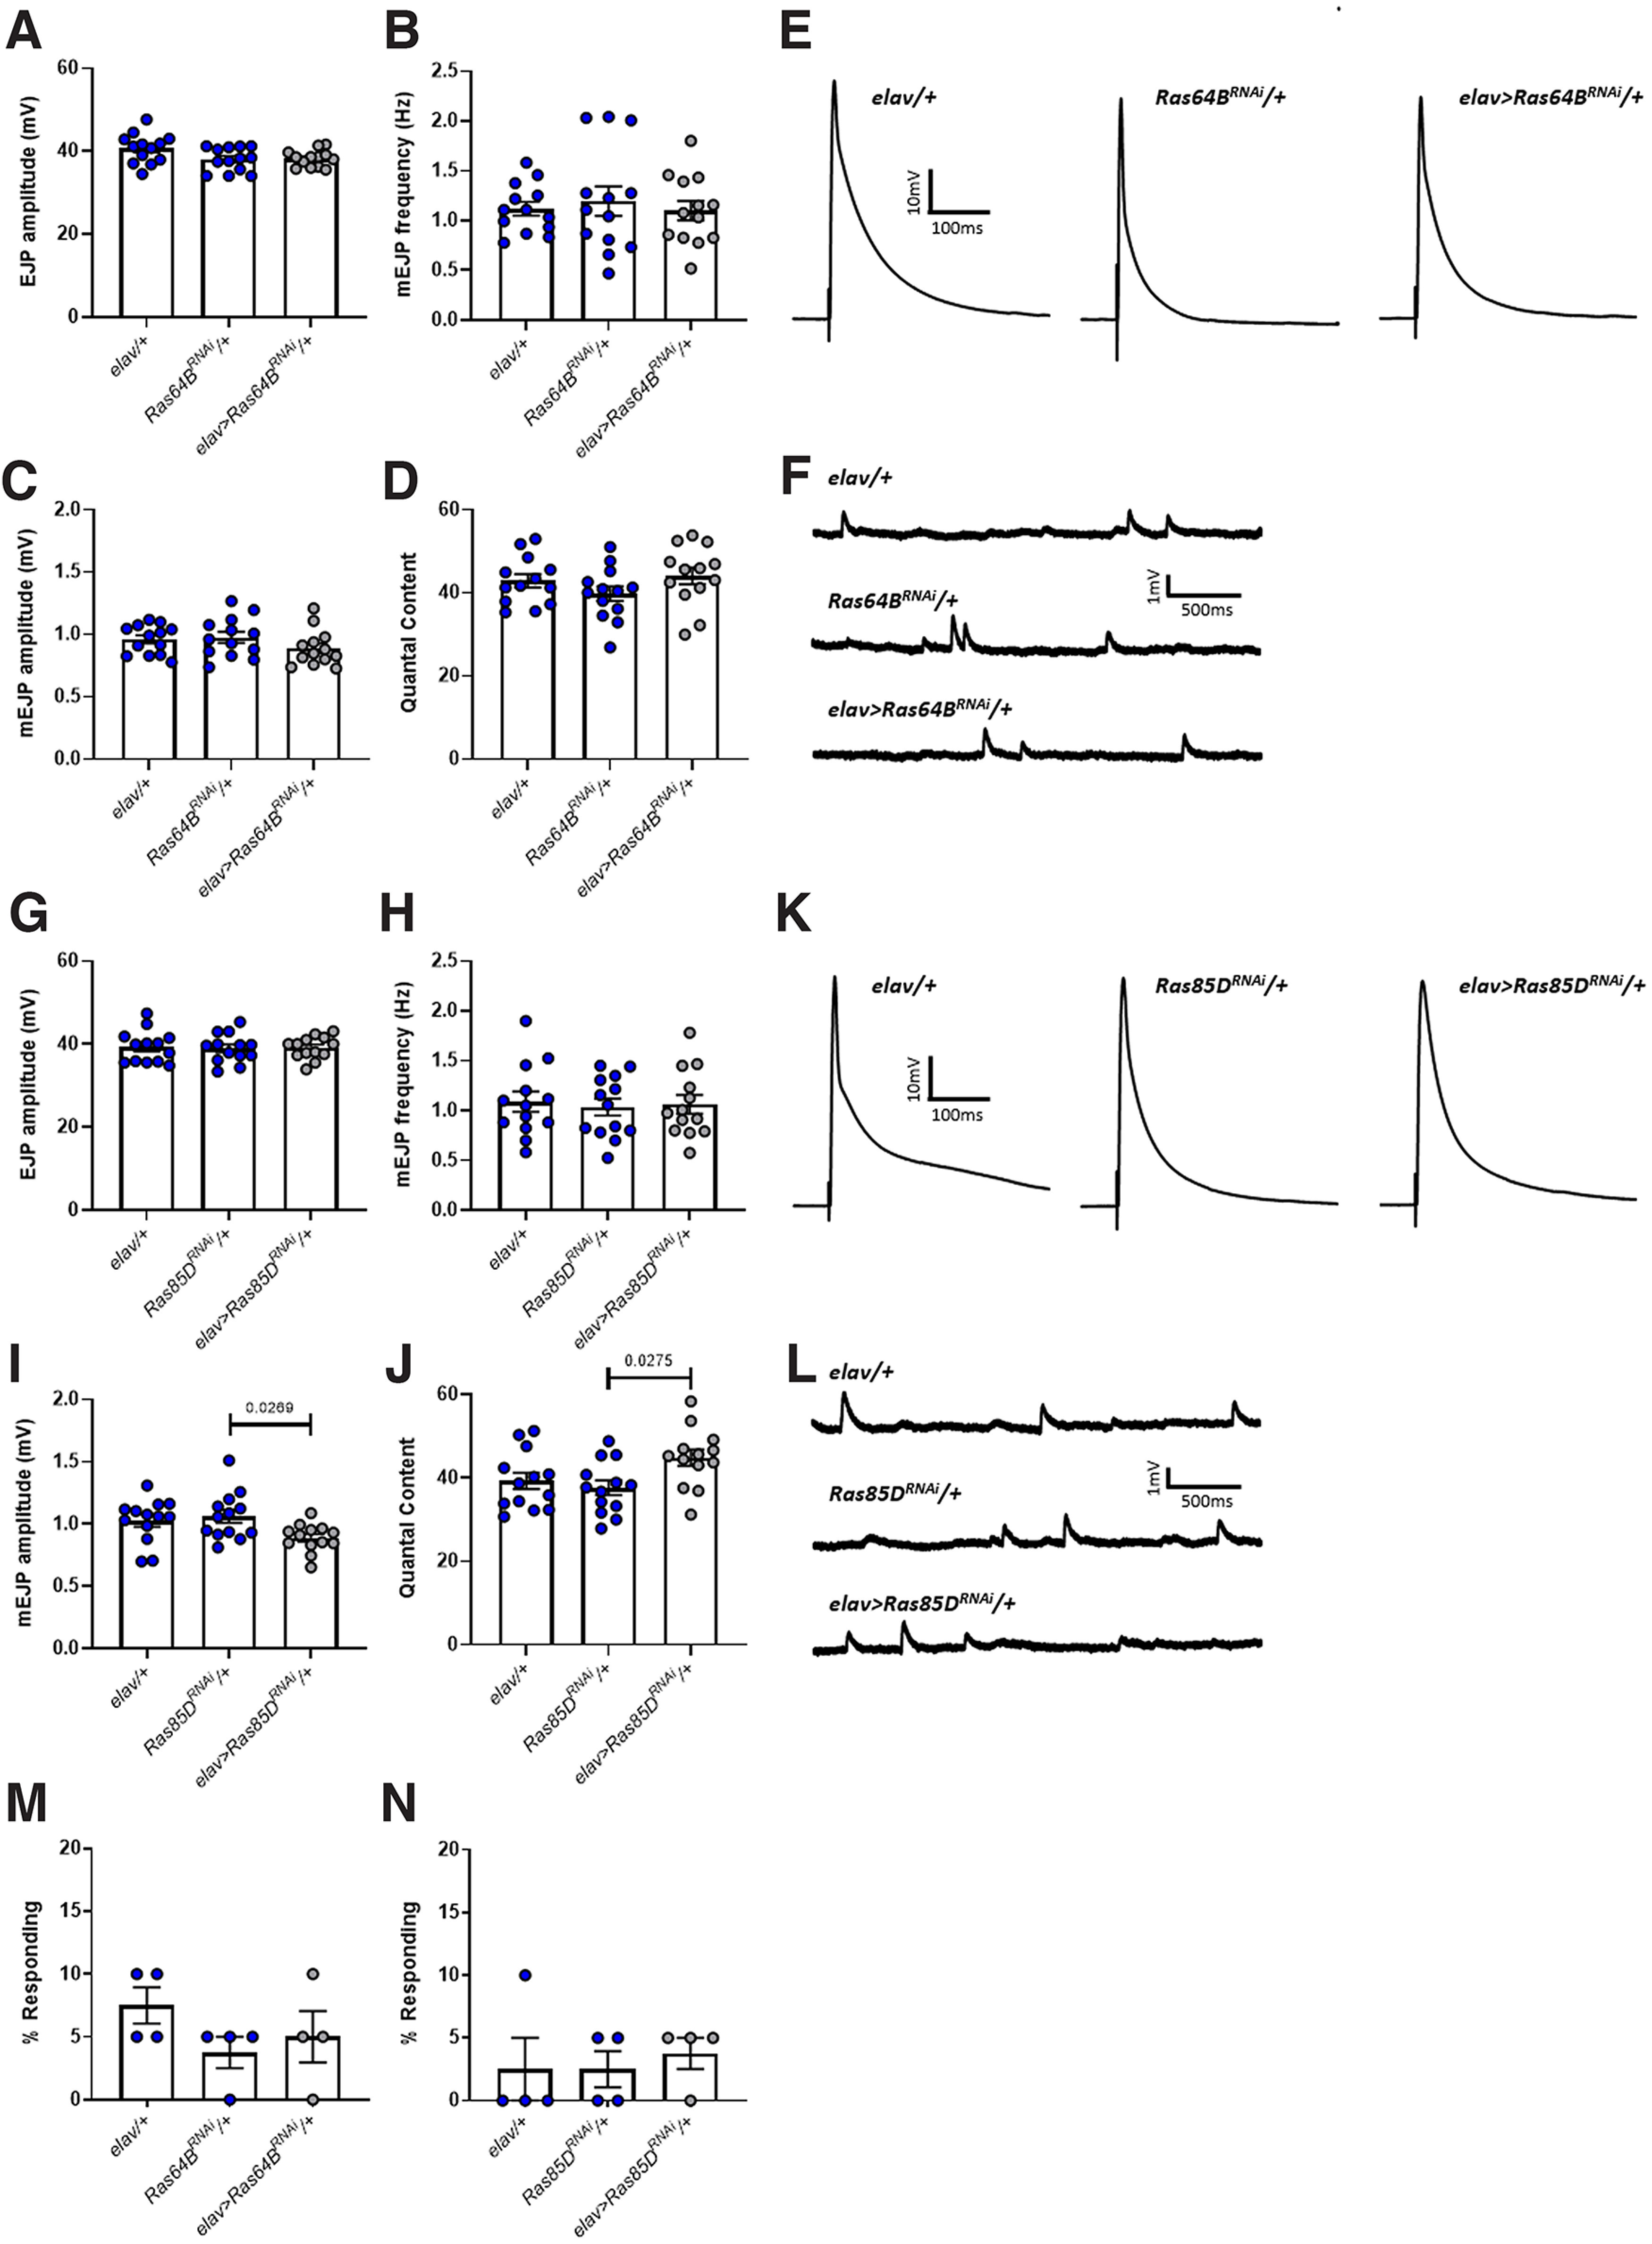
Pan-neuronal knock-down of either Ras64B or Ras85D in otherwise wild-type larvae has no consistent effect on NMJ synaptic transmission or larval tactile sensitivity. A, EJP amplitude is not significantly different between elav/+, Ras64BRNAi/+, and elav>Ras64BRNAi/+ lines, nor is (B) mEJP frequent, (C) mEJP amplitude, or (D) quantal content. E, F, Representative traces of EJPs and mEJPs, respectively, for each of the lines tested in A–D. G, There is also no significant difference in EJP amplitude between elav/+, Ras85DRNAi/+, and elav>Ras85DRNAi/+ lines, as is the case for (H) mEJP frequency. I, However, elav>Ras85DRNAi/+ larvae display a significant increase in mEJP amplitude compared with Ras85DRNAi/+ controls, but not when compared with elav/+ controls. J, Quantal content is also significantly reduced in elav>Ras85DRNAi/+ larvae, but again, only when compared with the Ras85DRNAi/+ control line. K, L, Representative traces of EJPs and mEJPs, respectively, for each of the lines tested in G–J. M, N, There is no effect of Ras64B or Ras85D knock-down, respectively, on the likelihood of a larva exhibiting a nocifensive response following mechanical stimulation. All data are presented as mean ± SEM. In the graphs, control lines are depicted in blue, while experimental lines are depicted in gray. All statistical comparisons were made via a one-way ANOVA followed by Tukey's post hoc test.
Table 10.
Statistical comparisons from Figure 10
| Control line | Experimental line | Test | F(df), p | p | |
|---|---|---|---|---|---|
| A | elav/+ | elav> Ras64BRNAi/+ | One-way ANOVA, Tukey's |
F(2,36) = 3.42 p = 0.04 |
0.09 (ns) |
| Ras64BRNAi/+ | 0.99 (ns) | ||||
| B | elav/+ | elav> Ras64BRNAi/+ |
F(2,36) = 0.21 p = 0.81 |
n/a | |
| Ras64BRNAi/+ | |||||
| C | elav/+ | elav> Ras64BRNAi/+ |
F(2,36) = 1.47 p = 0.24 |
n/a | |
| Ras64BRNAi/+ | |||||
| D | elav/+ | elav> Ras64BRNAi/+ |
F(2,36) = 1.49 p = 0.24 |
n/a | |
| Ras64BRNAi/+ | |||||
| G | elav/+ | elav> Ras85DRNAi/+ |
F(2,36) = 0.03 p = 0.97 |
n/a | |
| Ras85DRNAi/+ | |||||
| H | elav/+ | elav> Ras85DRNAi/+ |
F(2,36) = 0.08 p = 0.92 |
n/a | |
| Ras85DRNAi/+ | |||||
| I | elav/+ | elav> Ras85DRNAi/+ |
F(2,36) = 4.11 p = 0.02 |
0.09 (ns) | |
| Ras85DRNAi/+ | 0.03 | ||||
| J | elav/+ | elav> Ras85DRNAi/+ |
F(2,36) = 4.00 p = 0.03 |
0.11 (ns) | |
| Ras85DRNAi/+ | 0.03 | ||||
| M | elav/+ | elav> Ras64BRNAi/+ |
F(2,9) = 1.40 p = 0.3 |
n/a | |
| Ras64BRNAi/+ | |||||
| N | elav/+ | elav> Ras85DRNAi/+ |
F(2,9) = 0.16 p = 0.86 |
n/a | |
| Ras85DRNAi/+ |
The p value in the rightmost column refers to that of the post hoc test following the one-way ANOVA. df = degrees of freedom. Where the p value of the ANOVA was not significant (B–H, M, N), no post hoc p value is given. ns = not significant.
As an additional control, to show specificity of RNAi-mediated knock-down, we also targeted the dopamine transporter DAT in the NF1P1 mutant (elav>DATRNAi/+;NF1P1) to demonstrate that the rescue observed in Figures 8 and 9 is specific to the reduction in Ras transcripts. DAT is required for the reuptake of dopamine into presynaptic neurons at dopaminergic synapses (Martin and Krantz, 2014). Therefore, modulating its expression should have no impact on glutamatergic transmission at the NMJ. Indeed, there was no significant difference between elav>DATRNAi/+;NF1P1 and either elav/+;;NF1P1 or DATRNAi/+;NF1P1 homozygous mutant control lines for EJP amplitude, mEJP frequency, mEJP amplitude, or quantal content (Fig. 11A–F; Table 11). Furthermore, there was no significant difference in the mean percentage of larvae responding to mechanical stimulation across four independent trials (n = 20 per trial) between elav>DATRNAi/+;NF1P1 and elav/+;;NF1P1 or DATRNAi/+;NF1P1 lines (Fig. 11G; Table 11). Thus, the rescue of impaired synaptic transmission and tactile hypersensitivity appears to arise specifically from the attenuation of Ras transcript expression. That reduced expression of each Ras homolog, alone, is able to rescue synaptic dysfunction and abnormal behavior may indicate that increased activity of both Ras64B and Ras85D following loss of NF1 is necessary to alter synaptic transmission and behavior, such that reduced expression of either homolog is sufficient to restore these to normal.
Figure 11.
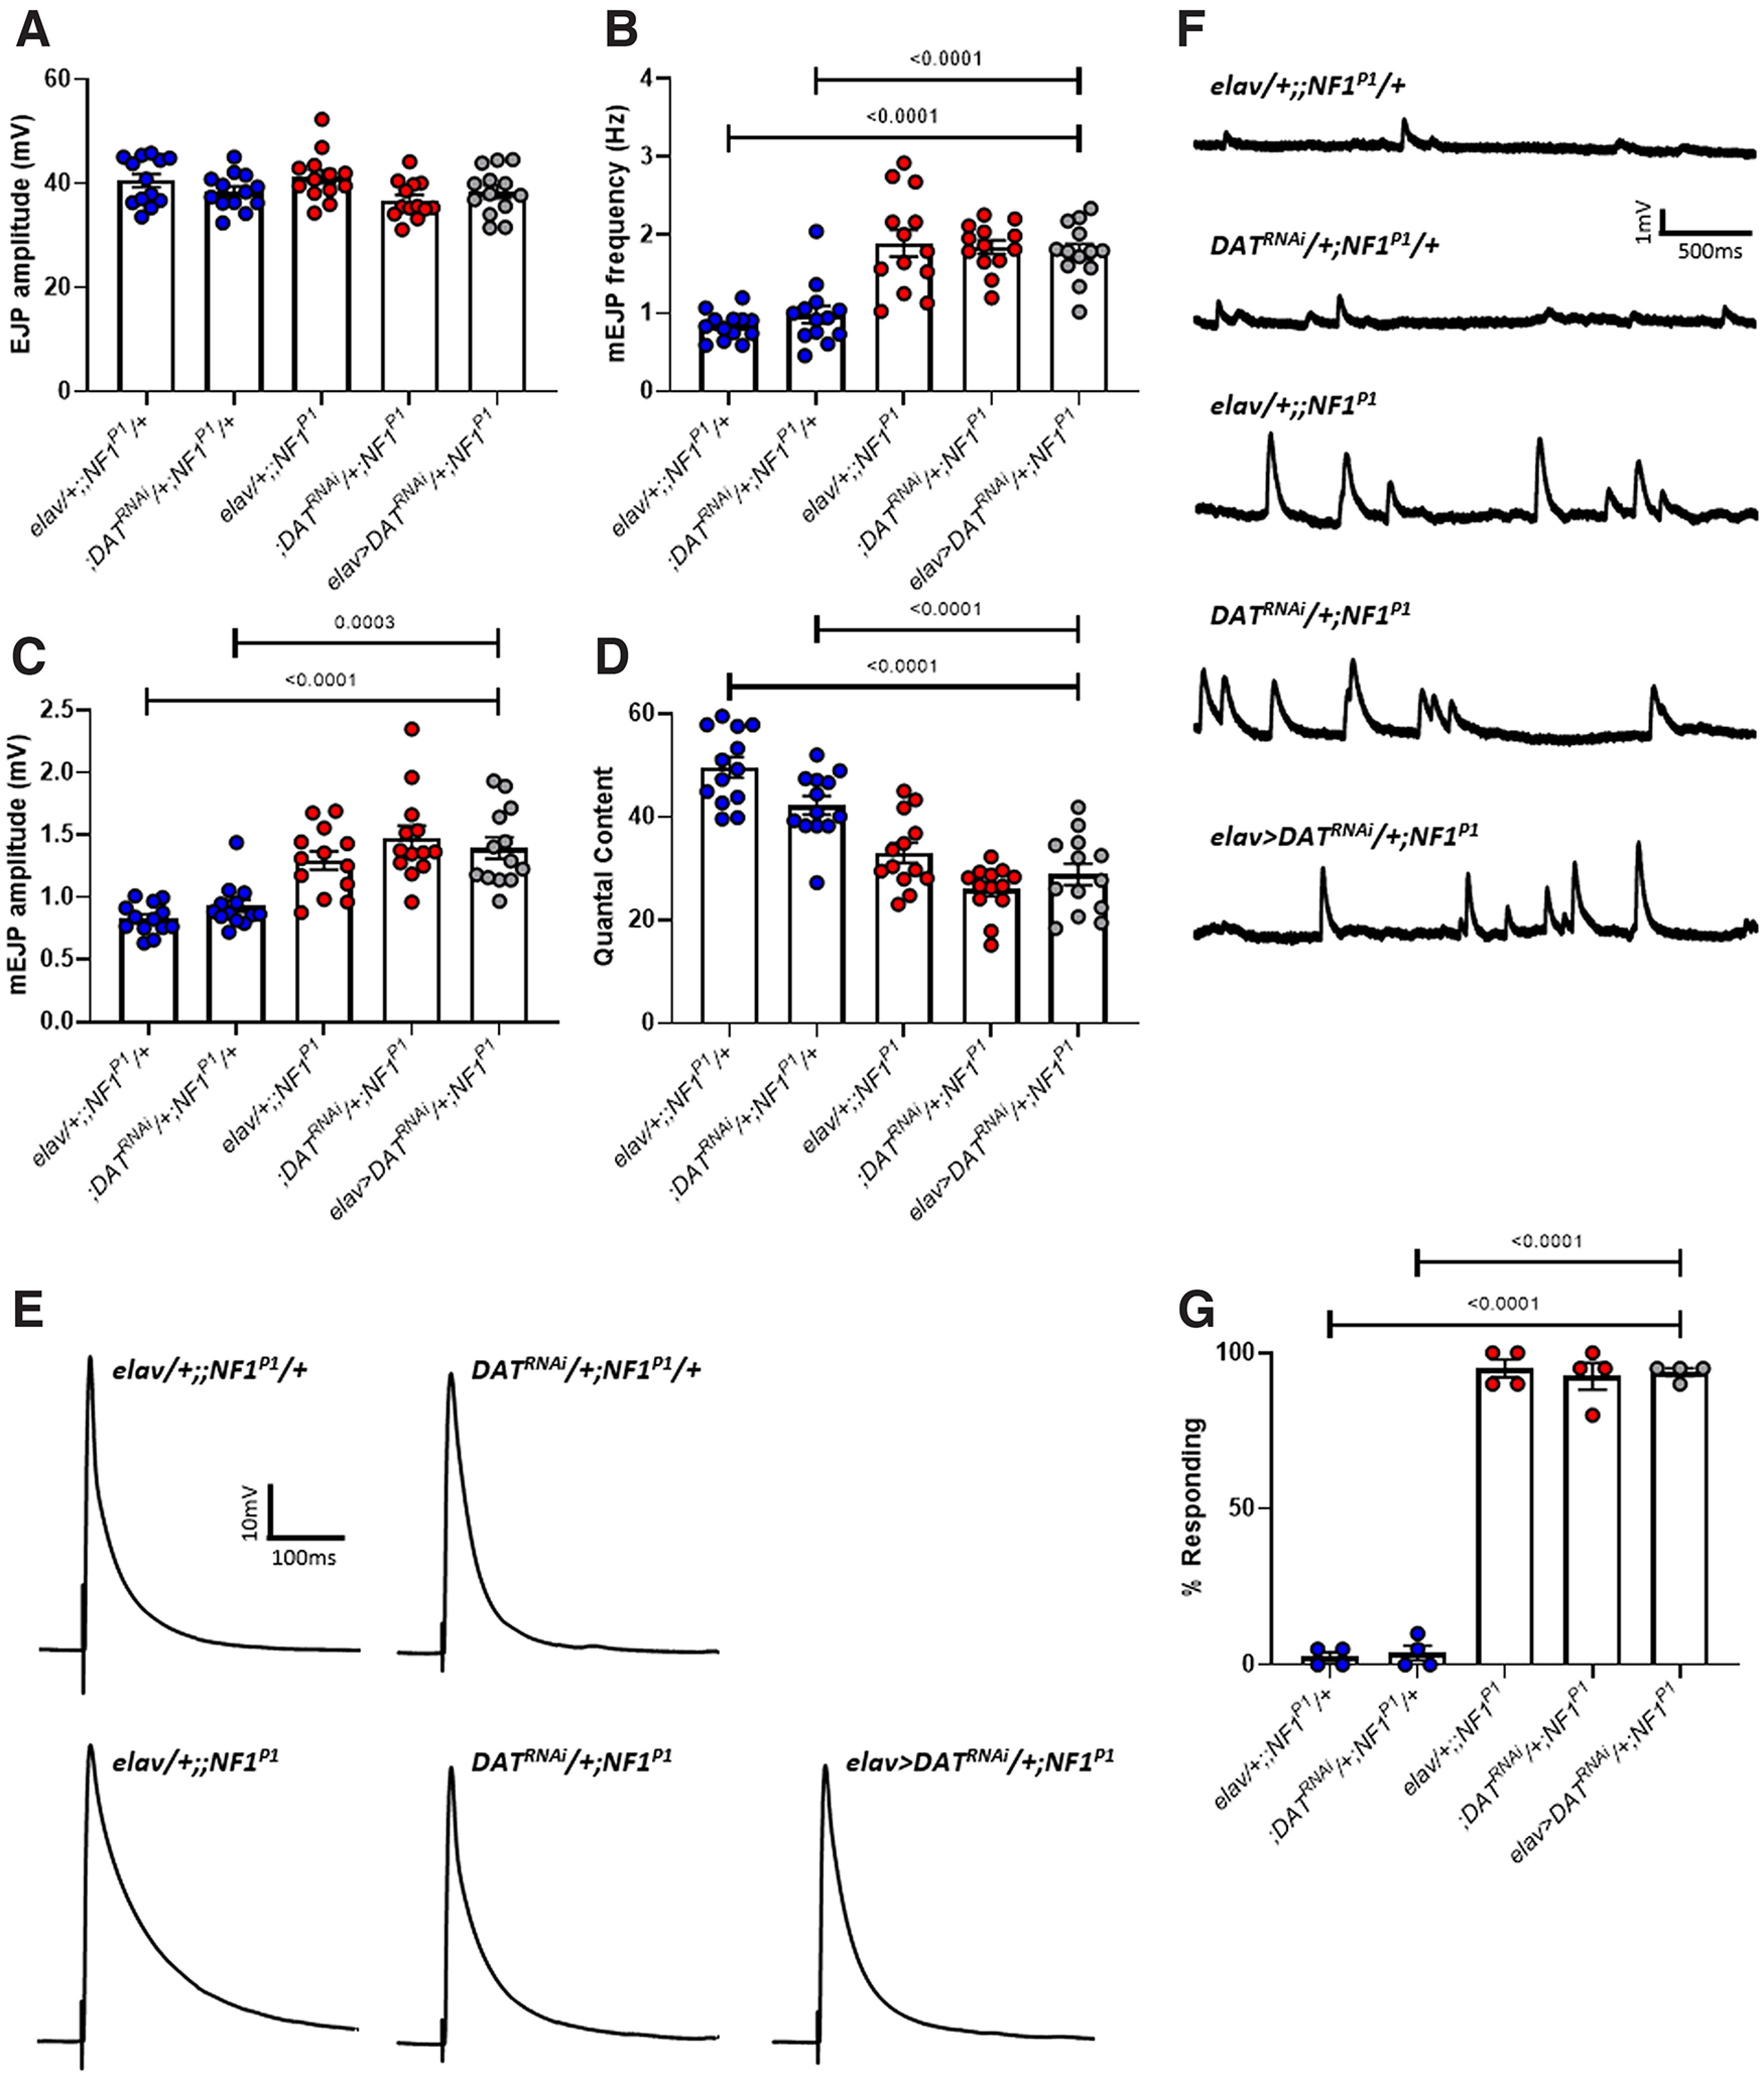
Knock-down of DAT has no impact on synaptic transmission or tactile hypersensitivity in NF1P1 larvae. A, EJP amplitude was not significantly different between any of the lines tested. B, mEJP frequency in elav>DATRNAi/+;NF1P1 larvae (gray circles) remains significantly increased compared with both heterozygous control lines (blue circles), as is also the case for (C) mEJP amplitude. D, Quantal content remains significantly reduced in elav>DATRNAi/+;NF1P1 larvae compared with both heterozygous controls. There are no significant differences between the elav>DATRNAi/+;NF1P1 line and either homozygous mutant control (red circles) for any parameter examined. Furthermore, in panels B–D, both heterozygous controls were significantly different to both homozygous mutant controls, and there were no significant differences between either of the heterozygous controls or either of the homozygous mutant controls, respectively. E, F, Representative traces of EJPs and mEJPs, respectively, for each of the lines tested in A–D. G, Pan-neuronal expression of UAS-DATRNAi has no impact on the mean percentage of NF1P1 larvae responding to a mechanical stimulus. All data are presented as mean ± SEM. All statistical comparisons were made via one-way ANOVA followed by Tukey's multiple comparisons test.
Table 11.
Statistical comparisons from Figure 11
| Control line | Experimental line | Test | F(df), p | p | |
|---|---|---|---|---|---|
| A | elav/+;;NF1P1/+ | elav>DATRNAi/+;NF1P1 | One-way ANOVA, Tukey's |
F(4,60) = 2.44 p = 0.06 |
n/a |
| DATRNAi/+;NF1P1/+ | |||||
| elav/+;;NF1P1 | |||||
| DATRNAi/+;NF1P1 | |||||
| B | elav/+;;NF1P1/+ | elav>DATRNAi/+;NF1P1 |
F(4,60) = 21.47 p < 0.0001 |
<0.0001 | |
| DATRNAi/+;NF1P1/+ | <0.0001 | ||||
| elav/+;;NF1P1 | 0.96 (ns) | ||||
| DATRNAi/+;NF1P1 | 0.99 (ns) | ||||
| C | elav/+;;NF1P1/+ | elav>DATRNAi/+;NF1P1 |
F(4,60) = 15.74 p < 0.0001 |
<0.0001 | |
| DATRNAi/+;NF1P1/+ | 0.0003 | ||||
| elav/+;;NF1P1 | 0.86 (ns) | ||||
| DATRNAi/+;NF1P1 | 0.94 (ns) | ||||
| D | elav/+;;NF1P1/+ | elav>DATRNAi/+;NF1P1 |
F(4,60) = 28.15 p < 0.0001 |
<0.0001 | |
| DATRNAi/+;NF1P1/+ | <0.0001 | ||||
| elav/+;;NF1P1 | 0.51 (ns) | ||||
| DATRNAi/+;NF1P1 | 0.81 (ns) | ||||
| G | elav/+;;NF1P1/+ | elav>DATRNAi/+;NF1P1 |
F(4,15) = 338.0 p < 0.0001 |
<0.0001 | |
| DATRNAi/+;NF1P1/+ | <0.0001 | ||||
| elav/+;;NF1P1 | 0.99 (ns) | ||||
| DATRNAi/+;NF1P1 | 0.99 (ns) |
The p value in the rightmost column refers to that of the post hoc test following the one-way ANOVA. df = degrees of freedom. Where the p value of the ANOVA was not significant (A), no post hoc p value is given. ns = not significant.
Discussion
Behavioral complications are common in NF1 and contribute considerably to the poor quality of life often experienced by individuals with this condition (Gutmann et al., 2017). They include an increased prevalence of ASD, estimated at 10–25% among NF1 individuals (Garg et al., 2013a; Morris et al., 2016; Eijk et al., 2018) but at only ∼1.85% within the overall population (Maenner et al., 2020). Moreover, because those with NF1 score more highly on assessments of quantitative autistic traits, pathogenic variants within the NF1 gene are suggested to act as ASD quantitative trait loci (Morris et al., 2016). Approximately 60% of children with ASD display clear differences in tactile sensitivity (Tomchek and Dunn, 2007), and altered reactivity to sensory stimuli is now included as part of the diagnostic criteria for ASD under DSM-V (American Psychiatric Association, 2013). Here, we demonstrate tactile hypersensitivity in two different NF1−/− larval lines that is specific to loss of NF1 function, which we propose may parallel the sensory sensitivity abnormalities seen in ASD in the clinic. Although tactile sensitivity specifically has not been investigated in individuals with both NF1 and ASD, a recent study has shown that auditory processing abnormalities present in early development correlate with the later emergence of ASD traits in NF1 infants (Begum-Ali et al., 2021). While the method of stimulation used here differs from that in other studies of larval nociception (Mauthner et al., 2014; Walcott et al., 2018), we deem it appropriate for assaying tactile hypersensitivity given that it generally does not induce a response in control larvae but yields a strong and consistent phenotype in the mutant.
Consistent with a belief that synaptic transmission abnormalities contribute to ASD pathophysiology, loss of NF1 expression under physiologically relevant conditions (Stewart et al., 1994) results in a reduction in evoked release that is homeostatically compensated for, but an increase in spontaneous release. Despite observing similar phenotypes across four different NF1 paradigms here (Figs. 2–4), our findings are inconsistent with those from a previous study (Tsai et al., 2012) in which it was shown that NF1E2 mutants display an increased EJP amplitude and quantal content, with no change in mEJP amplitude or frequency. The reason for this discrepancy is unclear. One possible explanation was that the earlier study (Tsai et al., 2012) used reduced Ca2+ (0.2 mm) and Mg2+ (4 mm). However, we were unable to replicate their findings even under identical conditions (Fig. 12; Table 12), and instead observed a milder version of the phenotypes shown in Figure 2. That we see a similar phenotype in different NF1−/− and knock-down lines, each with a different genetic background, also precludes mutation-dependent mechanisms and/or genetic modifiers as likely explanations. Therefore, we postulate that some environmental factor may be involved, such as larval diet. In support of this, it was recently shown that different standard fly food recipes may enhance or suppress the severity of a seizure phenotype in mutant paraShu flies (Kasuya et al., 2019).
Figure 12.
NF1−/− larvae in HL3.1 saline with reduced (0.2 mm) Ca2+ exhibit a “milder” version of the phenotype observed in normal recording conditions. A, EJP amplitude is not significantly different between K33 and NF1P1 larvae in 0.2 mm HL3.1 saline, while (B) mEJP frequency is significantly increased in the NF1P1 line. C, NF1P1 larvae display a slight but not significantly different increase in mEJP amplitude. D, Quantal content is significantly reduced in the NF1P1 mutant. E, F, Representative traces of EJPs and mEJPs, respectively, for K33 and NF1P1 lines. G, EJP amplitude is not significantly different between w1118 and NF1E2 larvae, while (H) mEJP frequency and (I) mEJP amplitude are significantly increased in the NF1E2 line. J, In contrast, there is no longer a significant reduction in quantal content between w1118 and NF1E2 larvae. K, L, Representative traces of EJPs and mEJPs, respectively, for w1118 and NF1E2 lines. All data are presented as mean ± SEM. All statistical comparisons were made via unpaired, two-tailed Student's t test.
Table 12.
Statistical comparisons from Figure 2
| Control line | Experimental line | Test | t (df) | P | |
|---|---|---|---|---|---|
| A | K33 | NF1P1 | Unpaired, two-tailed, Student's t test | t(24) = 1.28 | 0.21 (ns) |
| B | t(24) = 3.54 | 0.0017 | |||
| C | t(24) = 1.40 | 0.17 (ns) | |||
| D | t(24) = 2.63 | 0.015 | |||
| G | w1118 | NF1E2 | t(24) = 0.52 | 0.61 (ns) | |
| H | t(24) = 5.14 | <0.0001 | |||
| I | t(24) = 2.43 | 0.023 | |||
| J | t(24) = 1.44 | 0.16 (ns) |
The p value in the rightmost column refers to that of the t test. df = degrees of freedom. ns = not significant.
There are also notable differences between the findings presented here and those from murine NF1 models. In NF1 mutant hippocampal neurons, evoked release, whether inhibitory (Omrani et al., 2015) or excitatory (Wang et al., 2010), is augmented, in contrast to the data presented here showing a reduction in evoked release. Furthermore, while the frequency of spontaneous and/or miniature transmission is typically found to be increased in NF1 mouse models, in the hippocampus (Cui et al., 2008; Omrani et al., 2015), medial prefrontal cortex, and striatum (Shilyansky et al., 2010), this is the case only for inhibitory and not excitatory currents. Although an increase in mEPSC frequency is present in the basolateral amygdala of NF1+/− mice, the molecular mechanism giving rise to this is unclear, as the deletion of PAK1, which would be expected to attenuate Ras/MAPK signaling, leads to a further increase in mEPSC frequency (Molosh et al., 2014). Conversely, our data suggest that synaptic dysfunction at the NF1P1 NMJ is a direct result of excessive Ras activity, in line with studies of increased inhibitory transmission in NF1 (Cui et al., 2008; Shilyansky et al., 2010; Molosh et al., 2014; Omrani et al., 2015).
Studies of NF1 mouse models do not indicate an increase in the amplitude of mIPSCs or mEPSCs (Cui et al., 2008; Molosh et al., 2014; Omrani et al., 2015). Similarly, mEJC amplitude in NF1P1 larvae is unaltered, and we posit that the increase in mEJP amplitude simply reflects a compensatory response to reduced evoked release such that EJP amplitude is unaltered. This homeostatic response appears to be a noncell-autonomous postsynaptic increase in Rin, mediated by a reduction in muscle leak current, and not because of any change in muscle size (Fig. 6). That EJP amplitude is marginally reduced in NF1P1/E2 (Fig. 2) and elav>NF1RNAi/+;Dicer2/+ larvae (Fig. 3) may indicate that compensation does not occur to the same extent as in NF1P1 or NF1E2 larvae.
Differences also exist between murine models and clinical studies. While the former exhibit increases in GABA/Glu ratio and/or GABAA receptor expression (Gonçalves et al., 2017), all consistent with electrophysiological studies indicating enhanced inhibitory firing (Cui et al., 2008; Shilyansky et al., 2010; Molosh et al., 2014; Omrani et al., 2015), individuals with NF1 exhibit reduced GABA levels and/or a reduction in GABAA receptor density (Violante et al., 2013, 2016; Ribeiro et al., 2015). However, in both mice and humans, these changes occur in a region-dependent manner; thus, they may suggest that NF1 has numerous molecular and cellular functions that may be specific to a particular neuronal subtype or brain area, and which may account for apparent discrepancies between studies of NF1 in diverse model systems. It is also possible that certain differences in a particular model reflect homeostatic alterations to early neuronal activity changes, rather than the primary deficit (Nelson and Valakh, 2015).
An important question remaining to be resolved is how increased spontaneous transmission can be reconciled with reduced evoked release. One possibility is that NF1 is involved in the “clamp” that prevents vesicle fusion in the absence of stimulation, thereby restricting spontaneous release. This would result in spontaneous release being increased at the expense of evoked transmission in NF1−/− mutants, as is seen in synaptotagmin mutant larvae (Littleton et al., 1993, 1994). However, in synaptotagmin mutants, the degree of dysfunction is more severe and is not compensated for, such that evoked EJP amplitude is significantly reduced. Alternatively, because spontaneous and evoked release at the NMJ do not necessarily occur at the same active zones (AZs; Melom et al., 2013), NF1 may play a role in determining the type of release in which a particular AZ is involved. If NF1 promotes formation and/or function of “evoked release” AZs, its loss of expression might be predicted to lead to fewer evoked release events and an increase in spontaneous events. Other possibilities include enhanced spontaneous release, rather than being a direct result of reduced NF1 expression, being a consequence of the homeostatic increase in muscle Rin and subsequent increase in neuronal excitability, assuming a similar mechanism occurs in synapses between neurons as well as at the NMJ. Clearly future studies will be required to distinguish between these possible mechanisms.
Given the increase in burst firing in NF1P1 larvae (Fig. 7), the increase in mEJP frequency we observe does indeed appear consistent with neuronal hyperexcitability. This lends support to the excitatory/inhibitory imbalance theory of ASD, which posits that net excitatory activity is increased in certain neural systems such as those involved in social and sensory processing (Rubenstein and Merzenich, 2003). The deficit we observe includes central neurons, as only cholinergic knock-down of NF1 recapitulated the phenotype, while knock-down in peripheral/sensory neurons did not. Likewise, only cholinergic knock-down of NF1 gave rise to tactile hypersensitivity, whereas knock-down in sensory/peripheral neurons did not (Fig. 7F). This is important in supporting the relevance of our work to ASD. Initially, it could have been argued that the enhanced nocifensive response is more appropriate as a model of severe pain, another common complication in NF1. However, research into pain in NF1 strongly points to a role for neuronal hyperexcitability in peripheral sensory neurons (Bellampalli and Khanna, 2019), suggesting that this behavior in NF1−/− larvae is unrelated.
Cortical hyperexcitability in ASD is often suggested to underlie behavioral hypersensitivity and inappropriate neural responses to stimuli (Takarae and Sweeney, 2017). Therefore, we speculate that excessive excitatory firing, arising from the central locomotor circuitry, underlies tactile hypersensitivity in NF1P1 larvae. In support of this, both increased spontaneous transmission, which is typically indicative of neuronal hyperexcitability (Mosca et al., 2005), and tactile hypersensitivity are rescuable via the knock-down of Ras proteins, consistent with the two phenotypes sharing a common mechanism. However, our data are only correlational, and narrowing down the neuronal subtypes involved, as well as the downstream Ras effectors, will be necessary to validate this hypothesis.
It is also important to consider how synaptic dysfunction and tactile hypersensitivity might relate to other phenotypes in Drosophila models of NF1, particularly those mirroring ASD symptomatology. Recently, it was shown that NF1P1 male flies exhibit social interaction deficits in the form of impaired courtship behavior (Moscato et al., 2020). However, this requires NF1 in peripheral ppk23-expressing chemosensory neurons (Moscato et al., 2020), thus is unlikely to be related to larval hypersensitivity. The same may be concluded for NF1-dependent learning deficits in the fly, since they arise because of GABAergic dysfunction (Georganta et al., 2021). On the other hand, hyperactivity in the form of excessive grooming behavior in NF1P1 flies, proposed to reflect the repetitive behaviors characteristic of ASD individuals (King et al., 2016), arises from loss of NF1 in cholinergic neurons of the CNS and is Ras dependent (King et al., 2020). Although excessive grooming arises because of developmental loss of NF1 specifically in the pupa, after the larval stage, it is still possible that the underlying mechanisms for both behavioral changes are similar. Of note, degree of hypersensitivity has been shown to positively correlate with repetitive behavior severity in both ASD children and, to a lesser extent, typically developing children also (Boyd et al., 2010; Schulz and Stevenson, 2019).
In summary, we have shown in this study that NF1−/− larvae display hypersensitivity to a mechanical stimulus and exhibit excitatory synaptic transmission deficits suggestive of neuronal hyperexcitability, both of which strengthen the argument for the use of Drosophila models of NF1 in the study of ASD. Although the data presented here are consistent with a causal relationship between the two phenotypes, further evidence will be required to conclusively demonstrate this. We predict that these phenotypes will provide tractable outputs by which to screen for genetic and/or therapeutic modifiers of NF1 and/or ASD in the future.
Footnotes
This work was supported by a Medical Research Council Doctoral Training Partnership (A.D.) and by the Biotechnology and Biological Sciences Research Council Grant BB/L027690/1 (to R.A.B.). Work on this project benefited from the Manchester Fly Facility, established through funds from the University and the Wellcome Trust (087742/Z/08/Z). S.G. is supported by the Neurofibromatosis Therapeutic Acceleration Program (NTAP) Francis Collins Scholarship. D.G.E. is supported by the Manchester National Institute for Health and Care Research Biomedical Research Center Grant IS-BRC-1215-20007. We thank Seth Tomchik for providing NF1P1 and K33 lines, Cheng-Ting Chien for providing NF1E2 and w1118 lines, and James Walker for providing the UAS-NF1 line.
The authors declare no competing financial interests.
References
- American Psychiatric Association (2013) Diagnostic and statistical manual of mental disorders, Ed 5. Arlington: American Psychiatric Association. [Google Scholar]
- Bai L, Sehgal A (2015) Anaplastic lymphoma kinase acts in the Drosophila mushroom body to negatively regulate sleep. Plos Genet 11:e1005611. 10.1371/journal.pgen.1005611 [DOI] [PMC free article] [PubMed] [Google Scholar]
- Begum-Ali J, Kolesnik-Taylor A, Quiroz I, Mason L, Garg S, Green J, Johnson MH, Jones EJH; STAARS and EDEN Teams (2021) Early differences in auditory processing relate to autism spectrum disorder traits in infants with neurofibromatosis type I. J Neurodev Disord 13:22. 10.1186/s11689-021-09364-3 [DOI] [PMC free article] [PubMed] [Google Scholar]
- Bellampalli SS, Khanna R (2019) Towards a neurobiological understanding of pain in neurofibromatosis type 1: mechanisms and implications for treatment. Pain 160:1007–1018. 10.1097/j.pain.0000000000001486 [DOI] [PMC free article] [PubMed] [Google Scholar]
- Bergoug M, Doudeau M, Godin F, Mosrin C, Vallée B, Bénédetti H (2020) Neurofibromin structure, functions and regulation. Cells 9:2365. 10.3390/cells9112365 [DOI] [PMC free article] [PubMed] [Google Scholar]
- Botero V, Stanhope BA, Brown EB, Grenci EC, Boto T, Park SJ, King LB, Murphy KR, Colodner KJ, Walker JA, Keene AC, Ja WW, Tomchik SM (2021) Neurofibromin regulates metabolic rate via neuronal mechanisms in Drosophila. Nat Commun 12:4285. 10.1038/s41467-021-24505-x [DOI] [PMC free article] [PubMed] [Google Scholar]
- Boyd BA, Baranek GT, Sideris J, Poe MD, Watson LR, Patten E, Miller H (2010) Sensory features and repetitive behaviors in children with autism and developmental delays. Autism Res 3:78–87. 10.1002/aur.124 [DOI] [PMC free article] [PubMed] [Google Scholar]
- Buchanan ME, Davis RL (2010) A distinct set of Drosophila brain neurons required for neurofibromatosis type 1-dependent learning and memory. J Neurosci 30:10135–10143. 10.1523/JNEUROSCI.0283-10.2010 [DOI] [PMC free article] [PubMed] [Google Scholar]
- Costa RM, Federov NB, Kogan JH, Murphy GG, Stern J, Ohno M, Kucherlapati R, Jacks T, Silva AJ (2002) Mechanism for the learning deficits in a mouse model of neurofibromatosis type 1. Nature 415:526–530. 10.1038/nature711 [DOI] [PubMed] [Google Scholar]
- Cui YJ, Costa RM, Murphy GG, Elgersma Y, Zhu Y, Gutmann DH, Parada LF, Mody I, Silva AJ (2008) Neurofibromin regulation of ERK signaling modulates GABA release and learning. Cell 135:549–560. 10.1016/j.cell.2008.09.060 [DOI] [PMC free article] [PubMed] [Google Scholar]
- Dark C, Homman-Ludiye J, Bryson-Richardson RJ (2018) The role of ADHD associated genes in neurodevelopment. Dev Biol 438:69–83. 10.1016/j.ydbio.2018.03.023 [DOI] [PubMed] [Google Scholar]
- Daston MM, Scrable H, Nordlund M, Sturbaum AK, Nissen LM, Ratner N (1992) The protein product of the neurofibromatosis type 1 gene is expressed at highest abundance in neurons, Schwann cells, and oligodendrocytes. Neuron 8:415–428. 10.1016/0896-6273(92)90270-N [DOI] [PubMed] [Google Scholar]
- Diao F, Ironfield H, Luan H, Diao F, Shropshire WC, Ewer J, Marr E, Potter CJ, Landgraf M, White BH (2015) Plug-and-play genetic access to Drosophila cell types using exchangeable exon cassettes. Cell Rep 10:1410–1421. 10.1016/j.celrep.2015.01.059 [DOI] [PMC free article] [PubMed] [Google Scholar]
- Dietzl G, Chen D, Schnorrer F, Su KC, Barinova Y, Fellner M, Gasser B, Kinsey K, Oppel S, Scheiblauer S, Couto A, Marra V, Keleman K, Dickson BJ (2007) A genome-wide transgenic RNAi library for conditional gene inactivation in Drosophila. Nature 448:151–156. 10.1038/nature05954 [DOI] [PubMed] [Google Scholar]
- Eijk S, Mous SE, Dieleman GC, Dierckx B, Rietman AB, de Nijs PFA, ten Hoopen LW, van Minkelen R, Elgersma Y, Catsman-Berrevoets CE, Oostenbrink R, Legerstee JS (2018) Autism spectrum disorder in an unselected cohort of children with neurofibromatosis type 1 (NF1). J Autism Dev Disord 48:2278–2285. 10.1007/s10803-018-3478-0 [DOI] [PMC free article] [PubMed] [Google Scholar]
- Feeney CJ, Karunanithi S, Pearce J, Govind CK, Atwood HL (1998) Motor nerve terminals on abdominal muscles in larval flesh flies, Sarcophaga bullata: comparisons with Drosophila. J Comp Neurol 402:197–209. [DOI] [PubMed] [Google Scholar]
- Fenckova M, Blok LER, Asztalos L, Goodman DP, Cizek P, Singgih EL, Glennon JC, IntHout J, Zweier C, Eichler EE, von Reyn CR, Bernier RA, Asztalos Z, Schenck A (2019) Habituation learning Is a widely affected mechanism in Drosophila models of intellectual disability and autism spectrum disorders. Biol Psychiatry 86:294–305. 10.1016/j.biopsych.2019.04.029 [DOI] [PMC free article] [PubMed] [Google Scholar]
- Feng YF, Ueda A, Wu CF (2004) A modified minimal hemolymph-like solution, HL3.1, for physiological recordings at the neuromuscular junctions of normal and mutant Drosophila larvae. J Neurogenet 18:377–402. 10.1080/01677060490894522 [DOI] [PubMed] [Google Scholar]
- Friggi-Grelin F, Coulom H, Meller M, Gomez D, Hirsh J, Birman S (2003) Targeted gene expression in Drosophila dopaminergic cells using regulatory sequences from tyrosine hydroxylase. J Neurobiol 54:618–627. 10.1002/neu.10185 [DOI] [PubMed] [Google Scholar]
- Garg S, Green J, Leadbitter K, Emsley R, Lehtonen A, Evans DG, Huson SM (2013a) Neurofibromatosis type 1 and autism spectrum disorder. Pediatrics 132:E1642–E1648. 10.1542/peds.2013-1868 [DOI] [PubMed] [Google Scholar]
- Garg S, Lehtonen A, Huson SM, Emsley R, Trump D, Evans DG, Green J (2013b) Autism and other psychiatric comorbidity in neurofibromatosis type 1: evidence from a population-based study. Dev Med Child Neurol 55:139–145. 10.1111/dmcn.12043 [DOI] [PubMed] [Google Scholar]
- Georganta EM, Moressis A, Skoulakis EMC (2021) Associative learning requires neurofibromin to modulate GABAergic inputs to Drosophila mushroom bodies. J Neurosci 41:5274–5286. 10.1523/JNEUROSCI.1605-20.2021 [DOI] [PMC free article] [PubMed] [Google Scholar]
- Giachello CNG, Baines RA (2015) Inappropriate neural activity during a sensitive period in embryogenesis results in persistent seizure-like behavior. Curr Biol 25:2964–2968. 10.1016/j.cub.2015.09.040 [DOI] [PMC free article] [PubMed] [Google Scholar]
- Goldstein SAN, Price LA, Rosenthal DN, Pausch MH (1996) ORK1, a potassium-selective leak channel with two pore domains cloned from Drosophila melanogaster by expression in Saccharomyces cerevisiae. Proc Natl Acad Sci U S A 93:13256–13261. 10.1073/pnas.93.23.13256 [DOI] [PMC free article] [PubMed] [Google Scholar]
- Gonçalves J, Violante IR, Sereno J, Leitão RA, Cai Y, Abrunhosa A, Silva AP, Silva AJ, Castelo-Branco M (2017) Testing the excitation/inhibition imbalance hypothesis in a mouse model of the autism spectrum disorder: in vivo neurospectroscopy and molecular evidence for regional phenotypes. Mol Autism 8:47. 10.1186/s13229-017-0166-4 [DOI] [PMC free article] [PubMed] [Google Scholar]
- Guo HF, Tong JY, Hannan F, Luo L, Zhong Y (2000) A neurofibromatosis-1-regulated pathway is required for learning in Drosophila. Nature 403:895–898. 10.1038/35002593 [DOI] [PubMed] [Google Scholar]
- Gutmann DH, Ferner RE, Listernick RH, Korf BR, Wolters PL, Johnson KJ (2017) Neurofibromatosis type 1. Nat Rev Dis Primers 3:17004. 10.1038/nrdp.2017.4 [DOI] [PubMed] [Google Scholar]
- He JZ, Li BT, Han SZ, Zhang Y, Liu K, Yi SM, Liu YQ, Xiu MH (2022) Drosophila as a model to study the mechanism of nociception. Front Physiol 13:854124. 10.3389/fphys.2022.854124 [DOI] [PMC free article] [PubMed] [Google Scholar]
- Hwang RY, Zhong LX, Xu YF, Johnson T, Zhang F, Deisseroth K, Tracey WD (2007) Nociceptive neurons protect Drosophila larvae from parasitoid wasps. Curr Biol 17:2105–2116. 10.1016/j.cub.2007.11.029 [DOI] [PMC free article] [PubMed] [Google Scholar]
- Hyman SL, Shores A, North KN (2005) The nature and frequency of cognitive deficits in children with neurofibromatosis type 1. Neurology 65:1037–1044. 10.1212/01.wnl.0000179303.72345.ce [DOI] [PubMed] [Google Scholar]
- Im SH, Galko MJ (2012) Pokes, sunburn, and hot sauce: Drosophila as an emerging model for the biology of nociception. Dev Dyn 241:16–26. 10.1002/dvdy.22737 [DOI] [PMC free article] [PubMed] [Google Scholar]
- Kasuya J, Iyengar A, Chen HL, Lansdon P, Wu CF, Kitamoto T (2019) Milk-whey diet substantially suppresses seizure-like phenotypes of para(Shu), a Drosophila voltage-gated sodium channel mutant. J Neurogenet 33:164–178. 10.1080/01677063.2019.1597082 [DOI] [PMC free article] [PubMed] [Google Scholar]
- Kernan M, Cowan D, Zuker C (1994) Genetic dissection of mechanosensory transduction: mechanoreception-defective mutations of Drosophila. Neuron 12:1195–1206. 10.1016/0896-6273(94)90437-5 [DOI] [PubMed] [Google Scholar]
- Keshishian H, Broadie K, Chiba A, Bate M (1996) The Drosophila neuromuscular junction: a model system for studying synaptic development and function. Annu Rev Neurosci 19:545–575. 10.1146/annurev.ne.19.030196.002553 [DOI] [PubMed] [Google Scholar]
- Kim SE, Coste B, Chadha A, Cook B, Patapoutian A (2012) The role of Drosophila Piezo in mechanical nociception. Nature 483:209–212. 10.1038/nature10801 [DOI] [PMC free article] [PubMed] [Google Scholar]
- King LB, Koch M, Murphy KR, Velazquez Y, Ja WW, Tomchik SM (2016) Neurofibromin loss of function drives excessive grooming in Drosophila. G3 (Bethesda) 6:1083–1093. 10.1534/g3.115.026484 [DOI] [PMC free article] [PubMed] [Google Scholar]
- King LB, Boto T, Botero V, Aviles AM, Jomsky BM, Joseph C, Walker JA, Tomchik SM (2020) Developmental loss of neurofibromin across distributed neuronal circuits drives excessive grooming in Drosophila. Plos Genet 16:e1008920. 10.1371/journal.pgen.1008920 [DOI] [PMC free article] [PubMed] [Google Scholar]
- Korf BR (2013) Neurofibromatosis. Handb Clin Neurol 111:333–340. [DOI] [PubMed] [Google Scholar]
- Kratschmer P, Lowe SA, Buhl E, Chen KF, Kullmann DM, Pittman A, Hodge JJL, Jepson JEC (2021) Impaired pre-motor circuit activity and movement in a Drosophila model of KCNMA1-linked dyskinesia. Mov Disord 36:1158–1169. 10.1002/mds.28479 [DOI] [PMC free article] [PubMed] [Google Scholar]
- Lee D, O'Dowd DK (1999) Fast excitatory synaptic transmission mediated by nicotinic acetylcholine receptors in Drosophila neurons. J Neurosci 19:5311–5321. 10.1523/JNEUROSCI.19-13-05311.1999 [DOI] [PMC free article] [PubMed] [Google Scholar]
- Lin WH, He MM, Baines RA (2015) Seizure suppression through manipulating splicing of a voltage-gated sodium channel. Brain 138:891–901. 10.1093/brain/awv012 [DOI] [PMC free article] [PubMed] [Google Scholar]
- Littleton JT, Stern M, Schulze K, Perin M, Bellen HJ (1993) Mutational analysis of Drosophila synaptotagmin demonstrates its essential role in Ca(2+)-activated neurotransmitter release. Cell 74:1125–1134. 10.1016/0092-8674(93)90733-7 [DOI] [PubMed] [Google Scholar]
- Littleton JT, Stern M, Perin M, Bellen HJ (1994) Calcium-dependence of neurotransmitter release and rate of spontaneous vesicle fusions are altered in Drosophila synaptotagmin mutants. Proc Natl Acad Sci U S A 91:10888–10892. 10.1073/pnas.91.23.10888 [DOI] [PMC free article] [PubMed] [Google Scholar]
- Livak KJ, Schmittgen TD (2001) Analysis of relative gene expression data using real-time quantitative PCR and the 2(T)(-Delta Delta C) method. Methods 25:402–408. 10.1006/meth.2001.1262 [DOI] [PubMed] [Google Scholar]
- Maenner MJ, et al. (2020) Prevalence of autism spectrum disorder among children aged 8 years - Autism and Developmental Disabilities Monitoring Network, 11 Sites, United States, 2016. Mmwr Surveill Summ 69:1–12. 10.15585/mmwr.ss6904a1 [DOI] [PMC free article] [PubMed] [Google Scholar]
- Mahr A, Aberle H (2006) The expression pattern of the Drosophila vesicular glutamate transporter: a marker protein for motoneurons and glutamatergic centers in the brain. Gene Expr Patterns 6:299–309. 10.1016/j.modgep.2005.07.006 [DOI] [PubMed] [Google Scholar]
- Martin CA, Krantz DE (2014) Drosophila melanogaster as a genetic model system to study neurotransmitter transporters. Neurochem Int 73:71–88. 10.1016/j.neuint.2014.03.015 [DOI] [PMC free article] [PubMed] [Google Scholar]
- Mauthner SE, Hwang RY, Lewis AH, Xiao Q, Tsubouchi A, Wang Y, Honjo K, Skene JHP, Grandl J, Tracey WD (2014) Balboa binds to pickpocket in vivo and is required for mechanical nociception in Drosophila larvae. Curr Biol 24:2920–2925. 10.1016/j.cub.2014.10.038 [DOI] [PMC free article] [PubMed] [Google Scholar]
- Melom JE, Akbergenova Y, Gavornik JP, Littleton JT (2013) Spontaneous and evoked release Are independently regulated at individual active zones. J Neurosci 33:17253–17263. 10.1523/JNEUROSCI.3334-13.2013 [DOI] [PMC free article] [PubMed] [Google Scholar]
- Molosh AI, Johnson PL, Spence JP, Arendt D, Federici LM, Bernabe C, Janasik SP, Segu ZM, Khanna R, Goswami C, Zhu WG, Park SJ, Li L, Mechref YS, Clapp DW, Shekhar A (2014) Social learning and amygdala disruptions in Nf1 mice are rescued by blocking p21-activated kinase. Nat Neurosci 17:1583–1590. 10.1038/nn.3822 [DOI] [PMC free article] [PubMed] [Google Scholar]
- Morris SM, Acosta MT, Garg S, Green J, Huson S, Legius E, North KN, Payne JM, Plasschaert E, Frazier TW, Weiss LA, Zhang Y, Gutmann DH, Constantino JN (2016) Disease burden and symptom structure of autism in neurofibromatosis type 1: a study of the International NF1-ASD Consortium Team (INFACT). Jama Psychiatry 73:1276–1284. 10.1001/jamapsychiatry.2016.2600 [DOI] [PMC free article] [PubMed] [Google Scholar]
- Mosca TJ, Carrillo RA, White BH, Keshishian H (2005) Dissection of synaptic excitability phenotypes by using a dominant-negative Shaker K+ channel subunit. Proc Natl Acad Sci U S A 102:3477–3482. 10.1073/pnas.0406164102 [DOI] [PMC free article] [PubMed] [Google Scholar]
- Moscato EH, Dubowy C, Walker JA, Kayser MS (2020) Social behavioral deficits with loss of neurofibromin emerge from peripheral chemosensory neuron dysfunction. Cell Rep 32:107856. 10.1016/j.celrep.2020.107856 [DOI] [PMC free article] [PubMed] [Google Scholar]
- Moutal A, Dustrude ET, Khanna R (2017) Sensitization of ion channels contributes to central and peripheral dysfunction in neurofibromatosis type 1. Mol Neurobiol 54:3342–3349. 10.1007/s12035-016-9907-1 [DOI] [PubMed] [Google Scholar]
- Nelson SB, Valakh V (2015) Excitatory/inhibitory balance and circuit homeostasis in autism spectrum disorders. Neuron 87:684–698. 10.1016/j.neuron.2015.07.033 [DOI] [PMC free article] [PubMed] [Google Scholar]
- Noyes NC, Walkinshaw E, Davis RL (2020) Ras acts as a molecular switch between two forms of consolidated memory in Drosophila. Proc Natl Acad Sci U S A 117:2133–2139. 10.1073/pnas.1819925117 [DOI] [PMC free article] [PubMed] [Google Scholar]
- Omrani A, van der Vaart T, Mientjes E, van Woerden GM, Hojjati MR, Li KW, Gutmann DH, Levelt CN, Smit AB, Silva AJ, Kushner SA, Elgersma Y (2015) HCN channels are a novel therapeutic target for cognitive dysfunction in neurofibromatosis type 1. Mol Psychiatry 20:1311–1321. 10.1038/mp.2015.48 [DOI] [PMC free article] [PubMed] [Google Scholar]
- Powers AS, Grizzaffi J, Ribchester R, Lnenicka GA (2016) Regulation of quantal currents determines synaptic strength at neuromuscular synapses in larval Drosophila. Pflugers Arch 468:2031–2040. 10.1007/s00424-016-1893-7 [DOI] [PubMed] [Google Scholar]
- Ratner N, Miller SJ (2015) A RASopathy gene commonly mutated in cancer: the neurofibromatosis type 1 tumour suppressor. Nat Rev Cancer 15:290–301. 10.1038/nrc3911 [DOI] [PMC free article] [PubMed] [Google Scholar]
- Ribeiro MJ, Violante IR, Bernardino I, Edden RAB, Castelo-Branco M (2015) Abnormal relationship between GABA, neurophysiology and impulsive behavior in neurofibromatosis type 1. Cortex 64:194–208. 10.1016/j.cortex.2014.10.019 [DOI] [PMC free article] [PubMed] [Google Scholar]
- Roignant JY, Carré C, Mugat B, Szymczak D, Lepesant JA, Antoniewski C (2003) Absence of transitive and systemic pathways allows cell-specific and isoform-specific RNAi in Drosophila. Rna 9:299–308. 10.1261/rna.2154103 [DOI] [PMC free article] [PubMed] [Google Scholar]
- Rubenstein JLR, Merzenich MM (2003) Model of autism: increased ratio of excitation/inhibition in key neural systems. Genes Brain Behav 2:255–267. 10.1034/j.1601-183x.2003.00037.x [DOI] [PMC free article] [PubMed] [Google Scholar]
- Sage BT, Wu MD, Csink AK (2008) Interplay of developmentally regulated gene expression and heterochromatic silencing in trans in Drosophila. Genetics 178:749–759. 10.1534/genetics.107.083105 [DOI] [PMC free article] [PubMed] [Google Scholar]
- Sanchez-Ortiz E, Cho W, Nazarenko I, Mo W, Chen J, Parada LF (2014) NF1 regulation of RAS/ERK signaling is required for appropriate granule neuron progenitor expansion and migration in cerebellar development. Genes Dev 28:2407–2420. 10.1101/gad.246603.114 [DOI] [PMC free article] [PubMed] [Google Scholar]
- Schulz SE, Stevenson RA (2019) Sensory hypersensitivity predicts repetitive behaviours in autistic and typically-developing children. Autism 23:1028–1041. 10.1177/1362361318774559 [DOI] [PubMed] [Google Scholar]
- Schuster CM, Davis GW, Fetter RD, Goodman CS (1996) Genetic dissection of structural and functional components of synaptic plasticity. II. Fasciclin II controls presynaptic structural plasticity. Neuron 17:655–667. 10.1016/s0896-6273(00)80198-1 [DOI] [PubMed] [Google Scholar]
- Shih YT, Huang TN, Hu HT, Yen TL, Hsueh YP (2020) Vcp overexpression and leucine supplementation increase protein synthesis and improve fear memory and social interaction of Nf1 mutant mice. Cell Rep 31:107835. 10.1016/j.celrep.2020.107835 [DOI] [PubMed] [Google Scholar]
- Shilyansky C, Karlsgodt KH, Cummings DM, Sidiropoulou K, Hardt M, James AS, Ehninger D, Bearden CE, Poirazi P, Jentsch JD, Cannon TD, Levine MS, Silva AJ (2010) Neurofibromin regulates corticostriatal inhibitory networks during working memory performance. Proc Natl Acad Sci U S A 107:13141–13146. 10.1073/pnas.1004829107 [DOI] [PMC free article] [PubMed] [Google Scholar]
- Shofty B, Bergmann E, Zur G, Asleh J, Bosak N, Kavushansky A, Castellanos FX, Ben-Sira L, Packer RJ, Vezina GL, Constantini S, Acosta MT, Kahn I (2019) Autism-associated Nf1 deficiency disrupts corticocortical and corticostriatal functional connectivity in human and mouse. Neurobiol Dis 130:104479. 10.1016/j.nbd.2019.104479 [DOI] [PMC free article] [PubMed] [Google Scholar]
- Stewart BA, Atwood HL, Renger JJ, Wang J, Wu CF (1994) Improved stability of Drosophila larval neuromuscular preparations in haemolymph-like physiological solutions. J Comp Physiol A Neuroethol Sens Neural Behav Physiol 175:179–191. 10.1007/BF00215114 [DOI] [PubMed] [Google Scholar]
- Takarae Y, Sweeney J (2017) Neural hyperexcitability in autism spectrum disorders. Brain Sci 7:129. 10.3390/brainsci7100129 [DOI] [PMC free article] [PubMed] [Google Scholar]
- The I, Hannigan GE, Cowley GS, Reginald S, Zhong Y, Gusella JF, Hariharan IK, Bernards A (1997) Rescue of a Drosophila NF1 mutant phenotype by protein kinase A. Science 276:791–794. 10.1126/science.276.5313.791 [DOI] [PubMed] [Google Scholar]
- Tomchek SD, Dunn W (2007) Sensory processing in children with and without autism: a comparative study using the short sensory profile. Am J Occup Ther 61:190–200. 10.5014/ajot.61.2.190 [DOI] [PubMed] [Google Scholar]
- Tracey WD, Wilson RI, Laurent G, Benzer S (2003) painless, a Drosophila gene essential for nociception. Cell 113:261–273. 10.1016/s0092-8674(03)00272-1 [DOI] [PubMed] [Google Scholar]
- Tsai PI, Wang MY, Kao HH, Cheng YJ, Walker JA, Chen RH, Chien CT (2012) Neurofibromin mediates FAK signaling in confining synapse growth at Drosophila neuromuscular junctions. J Neurosci 32:16971–16981. 10.1523/JNEUROSCI.1756-12.2012 [DOI] [PMC free article] [PubMed] [Google Scholar]
- van der Voet M, Harich B, Franke B, Schenck A (2016) ADHD-associated dopamine transporter, latrophilin and neurofibromin share a dopamine-related locomotor signature in Drosophila. Mol Psychiatry 21:565–573. 10.1038/mp.2015.55 [DOI] [PMC free article] [PubMed] [Google Scholar]
- Vernon SW, Goodchild J, Baines RA (2018) The VAChTY49N mutation provides insecticide-resistance but perturbs evoked cholinergic neurotransmission in Drosophila. PLoS One 13:e0203852. 10.1371/journal.pone.0203852 [DOI] [PMC free article] [PubMed] [Google Scholar]
- Violante IR, Ribeiro MJ, Edden RAE, Guimarães P, Bernardino I, Rebola J, Cunha G, Silva E, Castelo-Branco M (2013) GABA deficit in the visual cortex of patients with neurofibromatosis type 1: genotype-phenotype correlations and functional impact. Brain 136:918–925. 10.1093/brain/aws368 [DOI] [PubMed] [Google Scholar]
- Violante IR, Patricio M, Bernardino I, Rebola J, Abrunhosa AJ, Ferreira N, Castelo-Branco M (2016) GABA deficiency in NF1: a multimodal C-11 -flumazenil and spectroscopy study. Neurology 87:897–904. 10.1212/WNL.0000000000003044 [DOI] [PMC free article] [PubMed] [Google Scholar]
- Walcott KCE, Mauthner SE, Tsubouchi A, Robertson J, Tracey WD (2018) The Drosophila small conductance calcium-activated potassium channel negatively regulates nociception. Cell Rep 24:3125–3132.e3. 10.1016/j.celrep.2018.08.070 [DOI] [PMC free article] [PubMed] [Google Scholar]
- Walker JA, Tchoudakova AV, McKenney PT, Brill S, Wu DY, Cowley GS, Hariharan IK, Bernards A (2006) Reduced growth of Drosophila neurofibromatosis 1 mutants reflects a non-cell-autonomous requirement for GTPase-activating protein activity in larval neurons. Genes Dev 20:3311–3323. 10.1101/gad.1466806 [DOI] [PMC free article] [PubMed] [Google Scholar]
- Walker JA, Gouzi JY, Long JB, Huang SD, Maher RC, Xia HJ, Khalil K, Ray A, Van Vactor D, Bernards R, Bernards A (2013) Genetic and functional studies implicate synaptic overgrowth and ring gland cAMP/PKA signaling defects in the Drosophila melanogaster neurofibromatosis-1 growth deficiency. Plos Genet 9:e1003958. 10.1371/journal.pgen.1003958 [DOI] [PMC free article] [PubMed] [Google Scholar]
- Wang YY, Brittain JM, Wilson SM, Hingtgen CM, Khanna R (2010) Altered calcium currents and axonal growth in Nf1 haploinsufficient mice. Transl Neurosci 1:106–114. 10.2478/v10134-010-0025-8 [DOI] [PMC free article] [PubMed] [Google Scholar]
- Williams JA, Su HS, Bernards A, Field J, Sehgal A (2001) A circadian output in Drosophila mediated by neurofibromatosis-1 and Ras/MAPK. Science 293:2251–2256. 10.1126/science.1063097 [DOI] [PubMed] [Google Scholar]
- Yenkoyan K, Grigoryan A, Fereshetyan K, Yepremyan D (2017) Advances in understanding the pathophysiology of autism spectrum disorders. Behav Brain Res 331:92–101. 10.1016/j.bbr.2017.04.038 [DOI] [PubMed] [Google Scholar]
Associated Data
This section collects any data citations, data availability statements, or supplementary materials included in this article.
Supplementary Materials
Typical K33 response to mechanical stimulation. Upon brief mechanical stimulation, K33 larvae typically do not display the stereotypic larval nocifensive response.
Typical NF1P1 response to mechanical stimulation. Upon brief mechanical stimulation, NF1P1 larvae typically display the stereotypic larval nocifensive response.