Abstract
In recent years, metabarcoding has become the method of choice for investigating the composition and assembly of microbial eukaryotic communities. The number of environmental data sets published has increased very rapidly. Although unprocessed sequence files are often publicly available, processed data, in particular clustered sequences, are rarely available in a usable format. Clustered sequences are reported as operational taxonomic units (OTUs) with different similarity levels or more recently as amplicon sequence variants (ASVs). This hampers comparative studies between different environments and data sets, for example examining the biogeographical patterns of specific groups/species, as well analysing the genetic microdiversity within these groups. Here, we present a newly‐assembled database of processed 18S rRNA metabarcodes that are annotated with the PR2 reference sequence database. This database, called metaPR2, contains 41 data sets corresponding to more than 4000 samples and 90,000 ASVs. The database, which is accessible through both a web‐based interface (https://shiny.metapr2.org) and an R package, should prove very useful to all researchers working on protist diversity in a variety of systems.
Keywords: 18S rRNA, database, metabarcodes, PCR, protist, R, shiny
1. INTRODUCTION
Protists, that is, microbial eukaryotes that are not plants, animals or fungi (Archibald et al., 2017), are one of the most dominant life forms on earth, comprising up to 80% of the total eukaryotic diversity in the environment (de Vargas et al., 2015; Mahé et al., 2017; Massana et al., 2015). Protists play key ecological roles and are involved in primary productivity, nutrient cycling and carbon sequestration. It is thus crucial to assess protist diversity and the factors that determine community composition in order to predict how protists will respond to environmental change (Cavicchioli et al., 2019). While protists have historically been more difficult to study due to their small size, the explosion of metabarcoding studies over the past 10 years has greatly expanded our knowledge of these organisms (Burki et al., 2021; Santoferrara et al., 2020).
Metabarcoding, which reveals the taxa present in an environment by amplifying and then massively sequencing a standardized genetic marker (Santoferrara, 2019; Taberlet et al., 2012), has become a very powerful and widespread approach to investigate protist diversity in a range of environments (marine, freshwater, soils, microbiomes, etc.) in recent years. By far, the most common marker used for eukaryotic microbes is the gene coding for ribosomal small subunit RNA (18S rRNA). This gene has the advantage of being universal and having well annotated reference databases such as Silva or PR2 (Guillou et al., 2013; Quast et al., 2013) which allow, for many protist groups, a precise taxonomic assignation. Within the 18S rRNA gene, several variable regions have been used as barcodes, in particular the V4 region located near the middle of the gene and the shorter V9 region located at its 3′ end (Burki et al., 2021; Pawlowski et al., 2012). The V4 region has most often been used in recent studies (Lopes dos Santos et al., 2021). Over the years, metabarcoding has been used to study various aspects of protist diversity. The first studies aimed to simply establish the real extent of eukaryotic diversity that was underestimated with traditional clone library approaches (e.g., Stoeck et al., 2009). In marine waters, metabarcoding studies now tackle more focused questions, for example analysing the distribution of protist groups in the ocean as a function of their size (de Vargas et al., 2015), the diversity of heterotrophic protists in the deep layers of the ocean (Giner et al., 2020; Obiol et al., 2021), detailed biogeographic distribution of specific taxa (e.g., Malviya et al., 2016; Yau et al., 2020), factors structuring marine plankton communities (Logares et al., 2020; Sommeria‐Klein et al., 2021), and the seasonal succession of taxa (e.g., Giner et al., 2019; Lambert et al., 2019). Fewer metabarcoding studies have been carried out in freshwater and soils, but that is rapidly changing with recent implementation of some large scale studies (e.g., for soils Mahé et al., 2017).
For bacteria and archaea, large metabarcoding projects using the 16S rRNA gene have been undertaken, such as the Earth Microbiome Project which encompassed more than 23,000 samples of both free‐living and host‐associated microbes, allowing inferences of global patterns of prokaryotic diversity (Thompson et al., 2017). For eukaryotes, although a few large scale sampling programs have been performed, such as Tara Oceans, Ocean Sampling Day (OSD) and Malaspina (de Vargas et al., 2015; Duarte, 2015; Kopf et al., 2015) for marine systems, most eukaryotic metabarcoding studies have targeted geographically restricted specific environments. Most studies that have performed analyses on the global ocean microbiota have relied on the three data sets mentioned, in particular Tara Oceans (e.g., Ibarbalz et al., 2019; Sommeria‐Klein et al., 2021). Many smaller‐scale metabarcoding studies have also been carried out, in particular for environments that have not been sampled by these expeditions, such as soils or freshwater lakes and rivers (Lopes dos Santos et al., 2021). Unfortunately, it is difficult to combine the data from these studies with those of the large scale expeditions for a range of reasons. First, even if the unprocessed data files containing raw reads have been deposited to GenBank SRA (sequence read archive), secondary data (e.g., clustered sequences) and metadata (e.g., sample coordinates, temperature) are rarely available, or, if available, are hard to locate since they are stored in a range of formats (DOCX, XLSX or TXT files) as supplementary files to the studies, often protected behind a pay‐wall. Clustered sequences can be provided as operational taxonomic units (OTUs) that depend on a specific similarity threshold or amplified sequence variants (ASVs, Callahan et al., 2016) that do not. OTUs clustered with different levels of similarity (e.g., 97 vs. 99%) are not directly comparable, meaning that if two studies are to be combined, clustering has to be performed de novo from the raw sequences. In contrast, ASVs from different studies can be directly compared. Secondly, taxonomic assignation is often conducted with different reference databases, such as GenBank, Silva or PR2 (Guillou et al., 2013; Quast et al., 2013). Some studies have tried to combine sets of samples from different environments (e.g., marine, freshwater and soil, Singer et al., 2021), but these efforts remain limited (for example, the Singer et al., 2021 study only included 122 sampling sites). The Ocean Barcode Atlas (Vernette et al., 2021) provides a web service allowing mapping of barcodes and diversity analyses. Unfortunately, at present it is restricted solely to Tara Oceans data sets and the taxonomy has not been updated since the publication of the original study (de Vargas et al., 2015). Thus, there is clearly a need to provide the protist research community with a reference database of metabarcodes which would allow full exploration of the available sequencing data by combining existing studies across different environments.
In this study, we introduce a database of metabarcodes (metaPR2) containing more than 4150 samples originating from 41 published studies, most using the V4 region of the 18S rRNA gene. The database focusses on ASVs in order for the different metabarcodes to be directly comparable. All raw sequence files were reprocessed with a pipeline based on the dada2 R package (Callahan et al., 2016). The taxonomy of the resulting ASVs was assigned using PR2 (Guillou et al., 2013) as a reference database. We have developed a web application available in two forms (website and R package) that allows analysis, visualization and download of the data. This database will be extended in the future with novel publicly available data sets and should prove very useful to the protist research community. In addition to introducing the database, we also provide basic statistics on the database and preliminary analyses of ASV diversity across different biomes.
2. MATERIALS AND METHODS
2.1. Data set selection and metabarcode processing
Data sets were selected from published studies (Table 1). Raw sequence files and metadata were downloaded from the NCBI SRA website (https://www.ncbi.nlm.nih.gov/Traces/study) when available or obtained directly from the investigators. Information about the study and about the samples (substrate, size fraction, etc.), as well as available metadata (geographic location, depth, date, temperature, etc.), were stored in three distinct tables in a master MySQL database, the coherence of which was checked with the R validate package (van der Loo & de Jonge, 2021). For each study, raw sequence files were processed independently de novo on the Roscoff ABIMS (Analysis and Bioinformatics for Marine Science) cluster. Primer sequences were removed with cutadapt version 2.8 (Martin, 2011) using the default parameters (maximum error rate = 10%) and the ‐g flag which removes any base upstream of the primers. Amplicon processing was performed under the R software version 3.5.1 (R Development Core Team, 2021) using the dada2 package version 1.14.0 (Callahan et al., 2016). Read quality was visualized with the plotQualityProfile function. Reads were filtered using the filterAndTrim function, adapting parameters (truncLen, minLen, truncQ, maxEE) according to overall sequence quality. Merging of the forward and reverse reads was undertaken with the mergePairs function using the default parameters (minOverlap = 12, maxMismatch = 0). Chimeras were removed using removeBimeraDenovo with default parameters. ASVs with similar sequences from different studies were merged together and identified with a unique 10 character code which corresponds to the start of the 40 character hash value of the sequence computed using the sha1 function from the R digest package. Taxonomic classification of ASVs was performed using the assignTaxonomy function from dada2 against the PR2 database (Guillou et al., 2013) version 4.14 (https://pr2‐database.org/). We did not threshold bootstrap values (minBoot = 0). ASV sequence, taxonomy assignment and bootstrap values, as well as abundance in each sample, were stored in tables in the same master database as the metadata. In order to limit the size of the online database, we removed ASVs that corresponded to less than 100 reads over all studies included in the database and did not consider sequences that had an assignment bootstrap value lower than 75% at the supergroup level. However, the master database contains all ASVs without any filter on their abundance or bootstrap values which will allow future evolution as the number of ASVs increases with the addition of new data sets. The total number of reads in each sample was normalized to 100 by dividing the number of reads for a given ASV in a given sample by the total number of reads in the sample multiplied by 100. In this way, read abundance could be expressed as % of total eukaryotic reads in the sample in visualizations (e.g., in maps, see below). Sequence processing scripts can be found at https://github.com/vaulot/Paper‐2021‐Vaulot‐metapr2/tree/main/R_processing.
TABLE 1.
List of eukaryotic data sets and studies included in the metaPR2 database
| ID | Name | Area | Ecosystem | Substrate | Samples | Technology | Region | Reads | ASVs | Bioproject | DOI |
|---|---|---|---|---|---|---|---|---|---|---|---|
| 1 | Ocean Sampling Day ‐ 2014 ‐ V4 LGC | Ocean survey | Coastal | Water | 154 | Illumina | V4 | 31,460 | 6557 | PRJEB8682 | 10.1186/s13742‐015‐0066‐5 |
| 2 | Ocean Sampling Day ‐ 2015 ‐ V4 | Ocean survey | Coastal | Water | 138 | Illumina | V4 | 62,575 | 6033 | 10.1186/s13742‐015‐0066‐5 | |
| 3 | Ocean Sampling Day ‐ 2014 ‐ V4 LW | Ocean survey | Coastal | Water | 29 | Illumina | V4 | 313,694 | 5872 | 10.1186/s13742‐015‐0066‐5 | |
| 5 | MALINA cruise ‐ 2009 | Arctic Ocean | Oceanic | Water | 24 | 454 | V4 | 6704 | 270 | PRJNA202104 | 10.1038/ismej.2014.197 |
| 6 | Central Arctic Ocean ‐ 2012 | Arctic Ocean | Oceanic | Ice | 8 | 454 | V4 | 36,628 | 182 | PRJEB7577 | 10.1080/09670262.2015.1077395 |
| 9 | Nansen Basin ‐ 2012 | Arctic Ocean | Oceanic | Water | 17 | 454 | V4 | 13,700 | 328 | PRJEB11449 | 10.1371/journal.pone.0148512 |
| 11 | Feldes Bay ‐ 2013 | Southern Ocean | Coastal | Water | 10 | Illumina | V4 | 13,631 | 69 | PRJNA254097 | 10.1007/s00300‐015‐1815‐8 |
| 16 | Feldes Bay ‐ 2015 | Southern Ocean | Coastal | Water | 123 | Illumina | V4 | 48,288 | 689 | PRJNA645244 | 10.1038/s41598‐020‐80,568‐8 |
| 18 | Feldes Bay sorted ‐ 2015 | Southern Ocean | Coastal | sorted Phytoplankton | 60 | Illumina | V4 | 31,615 | 280 | PRJNA645244 | 10.1038/s41598‐020‐80,568‐8 |
| 19 | Gulf of Finland ‐ 2012‐2013 | Baltic Sea | Coastal | Water, ice | 73 | Illumina | V4 | 71,195 | 933 | PRJEB21047 | 10.3354/meps12645 |
| 20 | Oslo fjord ‐ 2009‐2011 | Atlantic Ocean | Coastal | Water | 78 | 454 | V4 | 4822 | 806 | PRJNA497792 | 10.1111/jeu.12700 |
| 34 | Malaspina ‐ depth profiles ‐ 2010‐2011 | Ocean survey | Oceanic | Water | 179 | Illumina | V4 | 78,420 | 6075 | PRJEB23771 | 10.1038/s41396‐019‐0506‐9 |
| 35 | Malaspina ‐ surface ‐ 2010‐2011 | Ocean survey | Oceanic | Water | 119 | Illumina | V4 | 194,174 | 7059 | PRJEB23913 | 10.1186/s40168‐020‐00827‐8 |
| 36 | Blanes Bay ‐ 2004‐2013 | Mediterranean Sea | Coastal | Water | 288 | Illumina | V4 | 79,154 | 9141 | PRJEB23788 | 10.1111/mec.14929 |
| 37 | Baffin Bay ‐ 2013 | Arctic Ocean | Oceanic | Water | 32 | Illumina | V4 | 36,046 | 518 | PRJNA383398 | 10.1038/s41598‐018‐27,705‐6 |
| 38 | White Sea ‐ 2013‐2015 | Arctic Ocean | Oceanic | Ice | 17 | Illumina | V4 | 24,210 | 385 | PRJNA368621 | 10.1007/s00248‐017‐1076‐x |
| 39 | ARK‐XXVII/3 cruise ‐ 2012 | Arctic Ocean | Oceanic | water, ice, ice‐Algal aggregates | 45 | Illumina | V4 | 74,029 | 987 | PRJEB23005 | 10.3389/fmicb.2018.01035. |
| 40 | Arctic Ocean ‐ Survey ‐ 2005‐2011 | Arctic Ocean | Oceanic | Water | 36 | 454 | V4 | 7136 | 467 | PRJNA243055 | 10.1128/AEM.02737‐14 |
| 41 | ICESCAPE cruise ‐ 2010 | Arctic Ocean | Oceanic | Water | 23 | 454 | V4 | 5799 | 259 | PRJNA217438 | 10.1128/AEM.02737‐14 |
| 42 | Nares Strait ‐ 2014 | Arctic Ocean | Oceanic | Water | 247 | Illumina | V4 | 36,708 | 1533 | PRJEB24314 | 10.3389/fmars.2019.00479 |
| 43 | Gdansk Gulf ‐ 2012 | Baltic Sea | Coastal | Water | 35 | 454 | V4 | 3461 | 267 | PRJEB23971 | 10.1002/lno.11177 |
| 49 | Bay of Naples ‐ 2011 | Mediterranean Sea | Coastal | Water | 8 | Illumina | V4 | 213,716 | 2255 | PRJEB24595 | 10.1093/femsec/fiw200 |
| 53 | Biomarks project ‐ 2009 | coast of Europe | Coastal | Water, sediments | 120 | 454 | V4 | 9416 | 1152 | PRJEB9133 | 10.1016/j.cub.2014.02.050 |
| 69 | Mariana Trench ‐ 2016 ‐ 1 | Mariana Trench | Oceanic | Water | 32 | Illumina | V4 | 53,391 | 2800 | PRJNA451086 | 10.1038/s41598‐018‐33,790‐4 |
| 70 | Mariana Trench ‐ 2016 ‐ 2 | Mariana Trench | Oceanic | Water | 12 | Illumina | V4 | 15,713 | 213 | PRJNA399026 | 10.3389/fmicb.2018.02023 |
| 150 | River Saint‐Charles ‐ 2016‐2017 | Canada | freshwater Rivers | Water | 142 | Illumina | V4 | 8614 | 862 | PRJNA486319 | 10.3389/fmicb.2019.02359 |
| 183 | Lake Fuxian ‐ 2015 | China | freshwater Lakes | Water | 17 | Illumina | V4 | 67,202 | 764 | PRJNA534173 | 10.3389/fmicb.2019.02016 |
| 185 | Lake Chaohu ‐ 2014‐2015 | China | freshwater lakes | Water | 24 | Illumina | V4 | 63,312 | 999 | PRJNA534176, PRJNA330896 | 10.1016/j.scitotenv.2019.134803 |
| 195 | Lake Baikal ‐ 2013 | Siberia | freshwater Lakes | Water | 23 | Illumina | V4 | 66,056 | 431 | PRJEB24415 | 10.3390/microorganisms8040543 |
| 196 | Lake Chevreuse ‐ 2012 | France | freshwater Lakes | Water | 12 | 454 | V4 | 8480 | 124 | PRJNA259710 | 10.1111/1462‐2920.12591 |
| 197 | Lakes mountain ‐ 2013 | Austria, Chile, Ethiopia | freshwater Lakes | Water | 19 | Illumina | V4 | 54,102 | 608 | PRJNA299108 | 10.1111/mec.13633 |
| 198 | Lake Garda | Italy | freshwater Lakes | Water | 64 | Illumina | V4 | 53,628 | 628 | PRJEB36925 | 10.3389/fmicb.2020.00789 |
| 199 | Soils Neotropical | Central/South America | Terrestrial | Soil | 174 | Illumina | V4 | 381,103 | 10,685 | PRJNA317860 | 10.1038/s41559‐017‐0091 |
| 200 | River Parana | South America | Freshwater Rivers | Water | 10 | Illumina | V4 | 137,981 | 1385 | PRJEB23471 | 10.3389/fevo.2018.00099 |
| 201 | Soils Swiss Alps | Switzerland | Terrestrial | Soil | 580 | Illumina | V4 | 31,824 | 9640 | PRJEB30010 | 10.1111/jbi.13755 |
| 202 | Lakes Argentina | Argentina | freshwater Lakes | Water | 14 | Illumina | V9 | 291,546 | 1648 | PRJEB41211 | 10.1016/j.envint.2020.106262 |
| 203 | Lakes Scandinavia | Scandinavia | freshwater Lakes | Water | 87 | 454 | V4 | 3077 | 301 | 10.1093/femsec/fiw231 | |
| 204 | Soils Global ‐ 2012 | Global | Terrestrial | Soil | 25 | 454 | V4 | 1169 | 95 | 10.1038/ismej.2012.147 | |
| 205 | Tara Ocean ‐ V4 | Ocean survey | Oceanic | Water | 104 | Illumina | V4 | 198,981 | 9009 | PRJEB6610 | 10.1016/j.cell.2019.10.008 |
| 206 | Tara Arctic ‐ V4 | Arctic Ocean | Oceanic | Water | 28 | Illumina | V4 | 156,105 | 1416 | PRJEB9737 | 10.1016/j.cell.2019.10.008 |
| 392 | Tara Ocean ‐ V9 | Ocean survey | Oceanic | Water | 1152 | Illumina | V9 | 695,190 | 30,675 | PRJEB6610 | 10.1126/science.1261605 |
Notes: Data sets sequenced with 454 technology are single reads while those processed with Illumina are paired end reads. The column “Samples” corresponds to the number of samples that have more than 1000 reads after processing. The column “Region” correspond to the 18S rRNA gene region used for metabarcoding. The column “Reads” corresponds to mean number of reads per sample after processing. The column “ASVs” corresponds to the number of ASVs in the data set after removing ASVs that have less than 100 reads over all the data sets.
2.2. Metabarcode clustering
Since the data sets included in metaPR2 used different sets of primers (see below Table S3), for the purpose of this study we clustered ASVs with 100% similarity using the –cluster_fast option of vsearch version 2.18.0. ASVs within each cluster were merged together, using the centroid ASV as the new ASV, called cASV. This led to a slight reduction in the total number of ASVs from 79,000 to 70,000 once clustered. In general, sequences included in a given cluster were widely overlapping, although a few bases could be different outside the overlap region, indicating some microdiversity within these clusters (Figure S1). Clustering was only used in the framework of this study and the data provided in the web application are not clustered.
2.3. Metabarcode similarity to reference sequences
In order to evaluate the similarity of ASVs to existing reference sequences, in the context of this study we followed the approach of Metz et al. (2022). We compared ASVs to sequences from the PR2 database (Guillou et al., 2013) version 4.14 (https://pr2‐database.org/) using the –usearch_global option of vsearch with iddef = 2. The similarity information was stored in the MySQL database, then retrieved and merged with the ASV information using an R script. Alpha and beta diversity analyses were performed using the R phyloseq package (McMurdie & Holmes, 2013).
2.4. Ecological function
We used Table S1 from the study by Sommeria‐Klein et al. (2021) which assigns one of four ecological functions (phototroph, phagotroph, parasite, metazoa) to taxonomic groups (mostly at the class or division level). We merged this table with the PR2 taxonomy table, propagating the ecological function down to the species level. For taxonomic groups for which the Sommeria‐Klein et al. (2021) study had not defined any function, we assigned a function based on general knowledge for protists, generating a new table (Table S1).
2.5. Diversity analyses
Diversity analyses were performed with the phyloseq R package (McMurdie & Holmes, 2013). NMDS was based on Bray–Curtis dissimilarity. Upset plots to visualize the number of cASVs common to two or more environments were performed with the UpSetR R package.
2.6. R shiny application
All post‐processing was conducted with the R software. The data were extracted from the MySQL database using a custom script and stored in files using the R qs package that allows extremely fast loading of files (Travers, 2021). The data were post‐processed using the dplyr and tidyr packages. An R shiny application was developed to interact with the database using the following R packages: shiny, DT, shinyvalidate, shinyWidgets and shinycssloaders (Sali & Attali, 2020). Data were plotted using the ggplot2, treemapify, leaflet, leaftlet.minipie and plotly packages. Alpha and beta diversity analyses were performed using the phyloseq package (McMurdie & Holmes, 2013). The shiny application is available in two forms: a web‐based application (https://shiny.metapr2.org) and an R package (https://github.com/pr2database/metapr2‐shiny). The web interface runs on a Google Cloud Virtual Machine with a 20 Gb virtual disk and 4.5 Gb of memory. The R package can be installed on any computer and run off‐line.
3. RESULTS AND DISCUSSION
3.1. Overview of metaPR2 data sets
Forty‐one data sets are included in the current version (1.1) of the metaPR2 database (Table 1). We selected global oceanic data sets (OSD, Malaspina, Tara Oceans) that have been used in numerous publications (e.g., Giner et al., 2020; Ibarbalz et al., 2019; Tragin & Vaulot, 2018) as well as smaller data sets in particular from polar waters which have not been sampled in the global data sets. Eleven out of the 41 data sets were sequenced using the 454 technology and the rest with Illumina (mostly 2 × 250). The vast majority of the 41 data sets used the V4 region of the 18S rRNA gene which is the most commonly used metabarcode to date (Lopes dos Santos et al., 2021), with only two data sets representing the V9 region (Tara Oceans and Argentinian lakes, Table 1). The most common primer pairs used for V4 (Figure S2, Table S2 and S3) were those designed by Stoeck et al. (2010) and modified by Piredda et al. (2017). The V4 metabarcodes varied from 309 to 672 bp and were overlapping (Figure S2).
The metaPR2 database contains more than 4150 samples (Figure 1). These samples originate from three major ecosystems: marine, freshwater and terrestrial (mostly soil substrate) (Figure 2). Among water samples, different size fractions from pico (0.2–3 μm) to meso (100–1000 μm) are represented, with the majority corresponding to the pico and total fractions (Figure 2). Most aquatic samples correspond to the surface or euphotic layer. Location data (longitude, latitude) are available for all samples but other metadata, for example, temperature or salinity, are missing for some samples (Figure S3).
FIGURE 1.
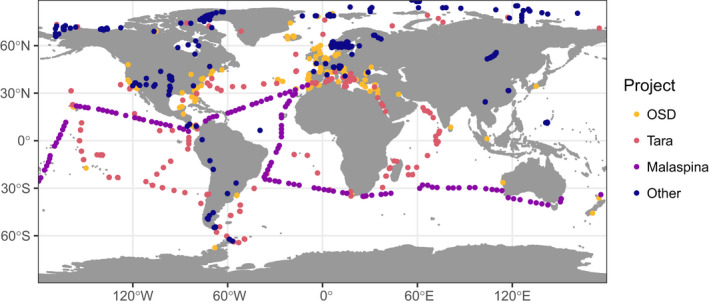
Map of stations included in the metaPR2 database
FIGURE 2.
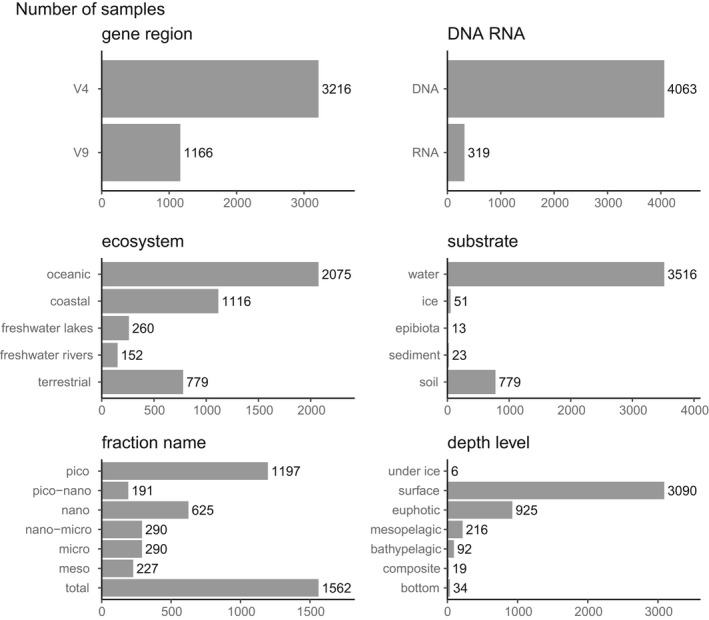
Distribution of samples by gene region, DNA or RNA, ecosystem, substrate, fraction name and depth level
The number of samples per data set is quite heterogeneous, ranging from less than 10 to almost 1150 for Tara Oceans (Table 1). The total number of reads analysed is almost 800 million for V9 and above 220 million for V4. The average number of reads per data set is also highly variable ranging from about 1000 in the older studies sequenced by 454 technology to almost 700,000 for Tara V9 (Table 1), which explains why overall there are more reads for V9 than V4 despite only two data sets using V9. The total number of ASVs was about 90,000. The number of ASVs in a given study ranges from less than 100 to more than 30,000 depending on both the number of samples and the depth of sequencing (Table 1). Since different studies have used different primer sets, it was necessary for the purpose of the analyses presented below to cluster ASVs with 100% similarity (cASVs, see Materials and Methods).
3.2. Protist composition
Overall, the database is dominated by Opisthokonta (Metazoa and fungi) and Alveolata (Dinoflagellata) (Figure S4). In this study, we decided to focus on protists and on the V4 region. The focus on protists is justified because the sampling strategy of most data sets was optimal for microbial eukaryotes. DNA from the three divisions (metazoa, plants and fungi) not included in protists were probably unevenly sampled, for example, plant seeds in soils or larval stages of metazoa in water environments. The focus on the V4 data sets that contain almost 3000 samples and 850 sites is due to that fact that the data for the V9 region are dominated by the Tara Oceans data set, which has been extensively analysed previously (e.g., de Vargas et al., 2015).
Protist sequences represent more than 41,000 ASVs (~33,000 cASVs once clustered). In terms of reads and cASVs, the database is dominated by Alveolata (in particular dinoflagellates), followed by stramenopiles (mostly photosynthetic Ochrophyta), Hacrobia, Archaeplastida and Rhizaria (Figure 3). The over‐representation of Alveolata and especially dinoflagellates in 18S rRNA‐based surveys has already been noted and is in particular due to the large number of rRNA operons per genome in this group (Zhu et al., 2005). Based on the number of cASVs, Rhizaria, despite their lower read abundance, rank just after the stramenopiles. Such a large number of unique Rhizaria sequences compared to read numbers has been observed before, possibly linked to higher error rates in regions of the RNA molecule that form secondary structures (Behnke et al., 2011). The most abundant cASVs (Figure 4a) belong to dinoflagellates.
FIGURE 3.
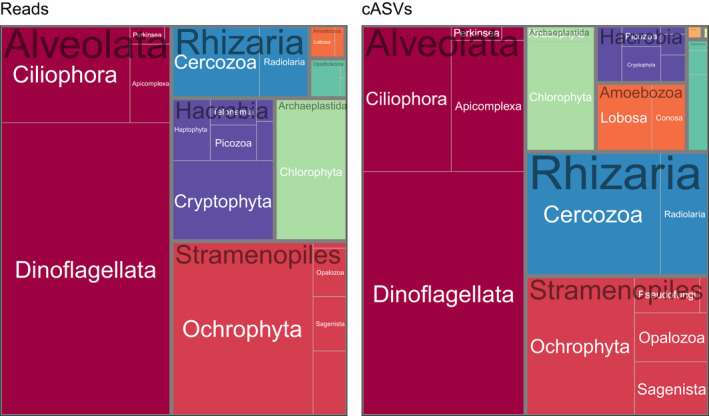
Treemaps of most abundant protist taxa (supergroup and division) for V4 data sets based on number of reads after normalization (left) or number of clustered ASVs (cASVs, right)
FIGURE 4.
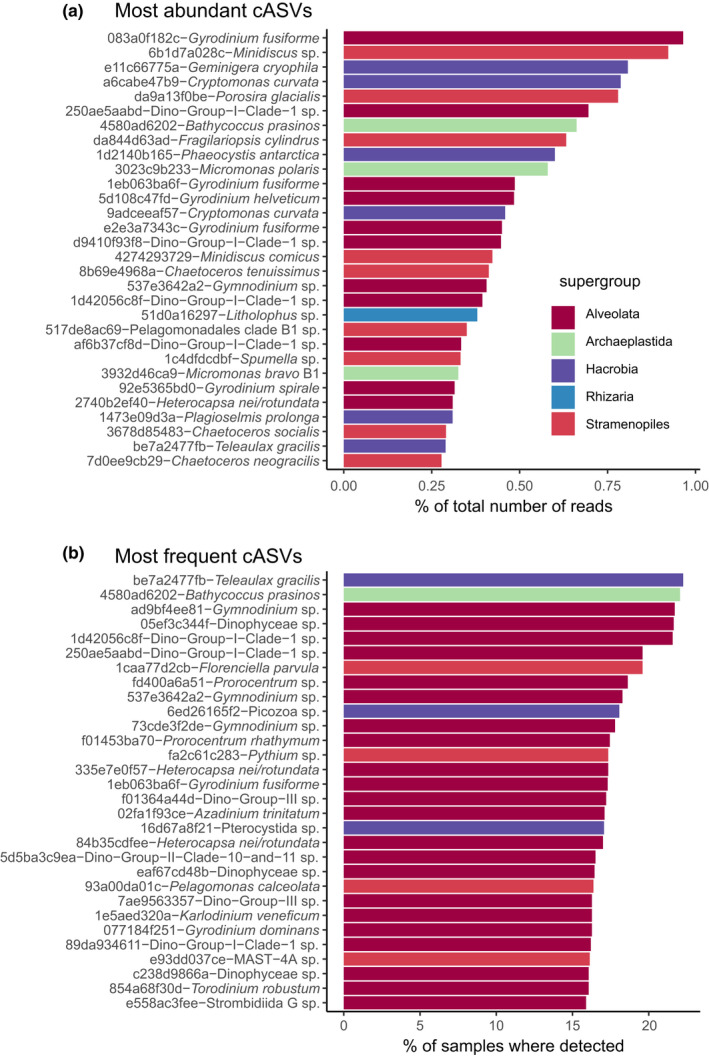
Protist V4 cASVs. (a) Most abundant cASVs (after normalization per sample). (b) Most frequent cASVs. Each cASV is coded by a 10‐letter string representing the start of the 40‐character hash value of the sequence (see Materials and Methods)
(Gyrodinium), diatoms (Minidiscus, Porosira, Fragilariopsis), cryptophytes (Geminigera, Cryptomonas), haptophytes (Phaeocystis) and green algae (Bathycoccus, Micromonas). The most abundant cASVs are often also the most frequently occurring (Figure 4b and Figure S5), although for example the marine picoplanktonic genus Florenciella is quite frequent despite not being one of the most abundant. In contrast, the small diatom Minidiscus cASV is quite abundant but not present among the 30 most frequent cASVs. The contrast in read abundance and cASV frequency between these two marine phytoplanktonic genera might be a reflection of their coastal versus oceanic distribution, which can be easily observed with the online interface of metaPR2. Florenciella is a truly ubiquitous genus, found in both coastal and oceanic samples, although often in low abundance. In contrast, the nanoplanktonic diatom Minidiscus is mostly found in coastal environments or continental platforms, where it can form sporadic blooms (Leblanc et al., 2018). At the genus level, the five most abundant genera (Figure S6a) are the dinoflagellate Gyrodinium, followed by the cryptophyte Cryptomonas, the diatom Chaetoceros, the dinoflagellate Heterocapsa and the chlorophyte Micromonas. In contrast, the five most frequent genera (Figure S6b) are four dinoflagellates (Gyrodinium, Prorocentrum, Gymnodinium and Heterocapsa) followed by the diatom Chaetoceros. In terms of diversity, as measured by the number of cASVs belonging to a given genus (Figure S6c), three parasitic alveolates are most diverse (Leidyana, Monocystis, Syncystis), followed by the dinoflagellate Prorocentrum and the diatom Chaetoceros.
Comparing the metaPR2 metabarcodes to reference sequences, such as those from PR2, reveals that there are very few novel metabarcodes for supergroups such as Hacrobia and Archaeplastida that contain many photosynthetic taxa. In contrast, for supergroups that contain mostly heterotrophic organisms, and in particular Amoebozoa, the median similarity of metabarcodes to any reference sequence is below 90% (Figure 5a) suggesting the existence of a lot of unknown taxa. A similar observation was recently reported for a restricted set of samples from a river floodplain in Argentina (Metz et al., 2022).
FIGURE 5.
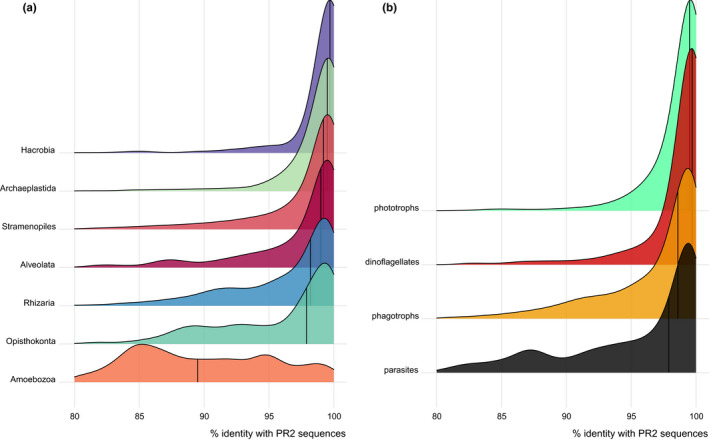
Protist V4 cASVs. Similarity of cASVs to sequences from the PR2 database as a (a) function of supergroup and (b) of the ecological function
3.3. Global trends across environments
Analysis of the metaPR2 database corroborates some trends that have been observed in studies with much fewer samples. Singer et al. (2021) examined patterns of diversity across marine, freshwater and terrestrial (soil) ecosystems based on 122 samples. Using the metaPR2 database which contain 23 times more samples, we were able to establish clear differences across five types of ecosystems: marine, coastal, freshwater lakes and rivers, and terrestrial (soils). In terrestrial environments, Hacrobia are almost completely absent. In contrast, Amoebozoa are absent in all environments except terrestrial ones (Figure 6a). If we use the ecological function, defined for each major taxonomic group by Sommeria‐Klein et al. (2021), the five environments clearly differ. For example, soils are characterized by the abundance of parasites, a small number of phototrophs and the absence of dinoflagellates. While parasites are abundant in soils, they are not as abundant in freshwater and increase from coastal to oceanic waters (Figure 6b). Using the Shannon index as an indicator of individual sample diversity, terrestrial ecosystems are most diverse, followed by rivers, oceanic and coastal environments, with lakes the least diverse in agreement with previous analyses (Singer et al., 2021), these differences all being significant (Figure S7). Most cASVs are restricted to a single type of ecosystem, with less than 2% (620 out of 33,235) common to two or more ecosystems if we consider coastal and oceanic ecosystems together (Figure 7). This segregation based on ecosystem type is probably not linked to the use of different primers. Since we used clustered ASVs (cASVs), we grouped together similar sequences even if they originated from data sets using different primers. Moreover, some data sets from different ecosystems used the same primer sets. For example, data sets numbers 34 and 204 (ocean), number 197 (lakes) and number 199 (soils) used the same TAReuk454FWD1/TAReukREV3 primer sets. The highest number of cASVs corresponds to marine ecosystems (coastal and oceanic), followed by terrestrial and freshwater. Interestingly, both coastal and oceanic ecosystems have a large number of specific cASVs with roughly one third purely oceanic, one third purely coastal and one third common. It is also striking that there are very few cASVs common between freshwater rivers and lakes (just above 7%). In terms of novelty, that is, of cASVs with low similarity to known sequences, terrestrial ecosystems are the least known with a median similarity below 95%, followed by rivers, lakes, coastal and oceanic ecosystems (Figure 5b). In some way, this reflects the fact that soil protists have only recently been investigated (Geisen et al., 2018). A comparison between the community structures from these different ecosystems using NMDS based on Bray‐Curtis dissimilarity (Figure 8) reveals a clear gradient: terrestrial ecosystems, followed by rivers and lakes, then coastal and oceanic ecosystems. Interestingly, river communities are the closest to soil communities, as they are probably enriched in terrestrial protists through soil drainage.
FIGURE 6.
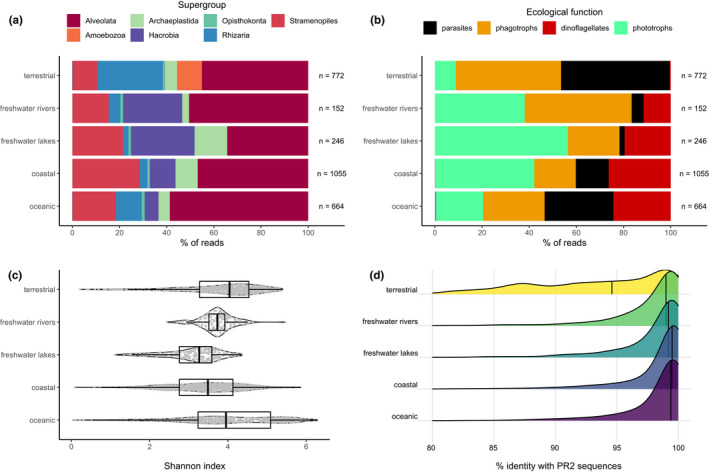
Protist V4 cASVs. Composition as a function of the environment based on (a) taxonomy or (b) on ecological function and (c) Shannon index. Similarity of cASVs to sequences from the PR2 database as a function of the environment (d)
FIGURE 7.
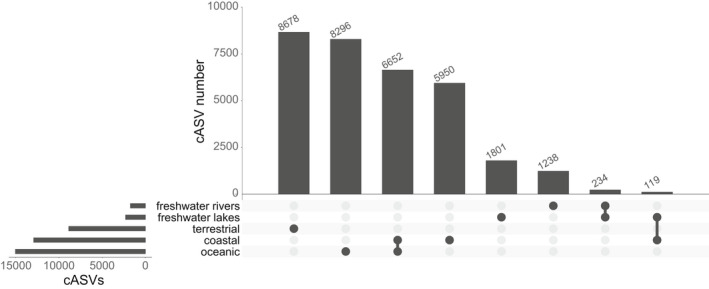
Protist V4 cASVs found on one or more environments (so‐called “upset” plot)
FIGURE 8.
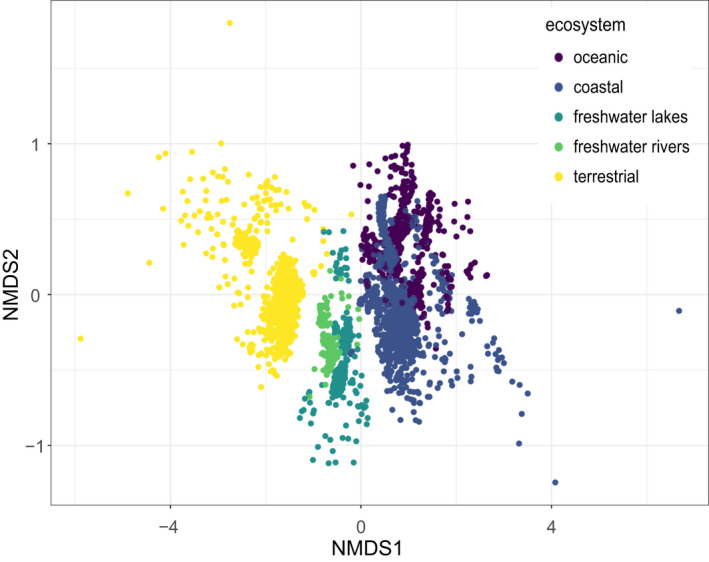
Protist V4 cASVs. NMDS analysis based on Bray–Curtis dissimilarity. Colour correspond to sample environment
3.4. Shiny application
With a database of such size and complexity, it is necessary to create tools that allow to explore the database and to download the data of interest (e.g., for a specific taxonomic group or environment). We developed an R Shiny application (Figure 9 and Figure S8) for this purpose. R Shiny is an open source tool that offers numerous advantages for developing web‐based applications in comparison to coding directly under languages such as JavaScript or PHP. It offers predefined components allowing the user to interact with the data (user interface), while the server component performs the necessary computations (e.g., filtering, summarizing the data, etc.) in the background. Moreover, a Shiny application can easily be deployed on a server using open source tools such as Shiny server and can be packaged in a Docker container that can be downloaded onto a personal computer and run locally or delivered as an R package.
FIGURE 9.
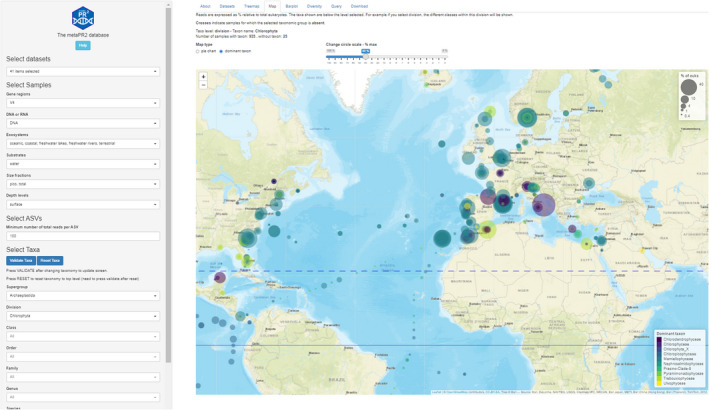
The metaPR2 shiny application available at https://shiny.metapr2.org
The metaPR2 Shiny application is structured in a number of panels, each dedicated to one type of analysis (e.g., map, diversity). It is possible to select/deselect specific data sets or groups of data sets, such as all oceanic data sets (Figure S9). Selection can also be based on sample characteristics such as whether samples come from DNA or RNA, the ecosystem, the type of substrate (e.g., ice, water, soil), the size fraction and the depth level (Figure S10). It is possible through reactive menus to navigate the taxonomy tree down to the species and even ASV level (potentially corresponding to cryptic species or subspecies). ASVs can be filtered based on the number of reads found for this ASV in the whole database (between 100 and 10,000). The number of total reads for a given taxonomic level can be visualized in a treemap (Figure S11) with the number of reads normalized to 100 for each sample. The distribution of any taxon can be visualized on a map (Figure S12). Two visualization modes are proposed for maps: either a pie chart at each station with a fraction of the different taxa immediately below the level selected (for example species, if genus is the level selected) or alternatively a colour circle indicating the dominant taxon immediately below the level selected (for example the dominant species in the previous example). The size of the circles is proportional to the percent of reads of the taxon selected relative to the total number of eukaryotic reads. The size of the circles can be adjusted for taxa in low abundance. Another representation is in the form of barplot (Figure S13), where the x‐axis represents the fraction of reads per taxon while the y‐axis represents one of the variables from the metadata (depth level, temperature, etc.). For continuous variables, bins are created. The barplot panel can also be used for time series with different levels of aggregation (year, month, day). Alpha and beta diversity (Figure S14) can be computed for a limited number of samples (1000 maximum). The whole set of ASV sequences can be searched using a BLAST‐like query and the resulting ASVs mapped (Figure S15). Finally, it is possible to download data sets and sample metadata as well as ASV sequences and read abundance for the data sets, samples and taxa selected (Figure S16).
Besides being very useful for research, the metaPR2 shiny application can also be used for teaching purposes in the field of microbial ecology. In the framework of the undergraduate course ES2304 ‐ Microbes in Natural Systems at Nanyang Technological University (Singapore), the application was used to investigate the biogeography of several groups of phytoplankton (diatoms, bolidophytes, dinoflagellates, green algae) by groups of four students in a flipped‐classroom model. Each group had to do some research on the genus it was assigned and then analyse the distribution and diversity of key species, answering questions such as whether species had ubiquitous distributions or distributions controlled by latitude or temperature and whether species appeared to contain different genotypes as reflected by the presence of several ASVs. In order to make their analysis less daunting, they only analysed the OSD, Malaspina and Tara Oceans V4 data sets. Despite the fact that they had only 1 week to discover the interface and produce their analyses, this hands‐on experience resulted in very positive feedback from the students, who especially enjoyed using the platform to look at “real‐world” research data.
4. PERSPECTIVES
Like its sister database, PR2, which is revised every 6–12 months with the addition of novel sequences as well as with taxonomy updates, the metaPR2 database will evolve with time to include more data sets and more samples, in particular from ecosystems (e.g., extreme environments), regions (e.g., tropical and southern latitudes) and substrate (e.g., host microbiomes) that are still underrepresented. We have listed more than 280 metabarcoding studies of protist diversity, for most of which data are available from GenBank SRA (Lopes dos Santos et al., 2021). These data will be processed and incorporated into the database with probably yearly releases. The taxonomy of metaPR2 will evolve in parallel to that of PR2 and we will add other functional and phenotypic traits (e.g., size, mixotrophy type) as there is clear tendency to use this approach more widely for protists (Schneider et al., 2020). We will also develop novel functionalities for the R shiny application and package, for example heat maps and phylogenetic analyses. This will constitute a very rich resource that will help researchers to compare eukaryotic communities across habitats.
AUTHOR CONTRIBUTIONS
Daniel Vaulot conceived the study. Daniel Vaulot, Adriana Lopes dos Santos, Denise Ong, Bryan Teo, Charlie Biwer scanned the literature and metadata. Daniel Vaulot, Denise Ong, Bryan Teo, Mahwash Jamy, Charlie Biwer collected and compiled metadata from the different data sets. Daniel Vaulot developed the database structure, the analysis scripts and the R shiny application. Daniel Vaulot performed the metabarcode analyses. Clarence Wei Hung Sim compiled the functional trait information. Daniel Vaulot and Adriana Lopes dos Santos wrote the first draft of the manuscript, and all coauthors edited and approved the final version.
CONFLICT OF INTEREST
The authors declare no competing financial interests.
OPEN RESEARCH BADGES
This article has earned an Open Data badge for making publicly available the digitally‐shareable data necessary to reproduce the reported results. The data is available at [[insert provided URL from Open Research Disclosure Form]].
Supporting information
Data S1
ACKNOWLEDGEMENTS
We are very grateful to the many researchers that answered our queries about their publications, in particular pointing us to the available metadata. We thank Javier de Campo, Catherine Ribeiro, Ana Maria Cabello for their shiok suggestions on the shiny application. We are grateful to Ian Probert for the final editing of the manuscript. We thank the ABIMS platform of the FR2424 (CNRS, Sorbonne Université) for bioinformatic resources. Daniel Vaulot was partially supported by the ANR Phenomap (ANR‐20‐CE02‐0025). Adriana Lopes dos Santos and Clarence Wei Hung Sim were supported by grants RG26/19 and RG91/21 from the Singapore Ministry of Education, Academic Research Fund Tier 1. The work of Mahwash Jamy and Charlie Biwer was supported by a grant from Science for Life Laboratory available to F. Burki.
Vaulot, D. , Sim, C. W. H. , Ong, D. , Teo, B. , Biwer, C. , Jamy, M. , & Lopes dos Santos, A. (2022). metaPR2 : A database of eukaryotic 18S rRNA metabarcodes with an emphasis on protists. Molecular Ecology Resources, 22, 3188–3201. 10.1111/1755-0998.13674
Handling Editor: Simon Creer
Contributor Information
Daniel Vaulot, Email: vaulot@gmail.com.
Adriana Lopes dos Santos, Email: lopesas.ufrj@gmail.com.
DATA AVAILABILITY STATEMENT
The source code for the Shiny server has been made available as an R package from GitHub (https://github.com/pr2database/metapr2‐shiny, doi: 10.5281/zenodo.5992354). The source code for this study has been made available from GitHub (https://github.com/vaulot/Paper‐2021‐Vaulot‐metapr2). Source code for sequence processing has been made available from GitHub https://github.com/vaulot/Paper‐2021‐Vaulot‐metapr2/tree/main/R_processing.
REFERENCES
- Archibald, J. , Simpson, A. , & Slamovits, C. (2017). Handbook of the protists. Springer International Publishing. [Google Scholar]
- Behnke, A. , Engel, M. , Christen, R. , Nebel, M. , Klein, R. R. , & Stoeck, T. (2011). Depicting more accurate pictures of protistan community complexity using pyrosequencing of hypervariable SSU rRNA gene regions. Environmental Microbiology, 13, 340–349. [DOI] [PubMed] [Google Scholar]
- Burki, F. , Sandin, M. M. , & Jamy, M. (2021). Diversity and ecology of protists revealed by metabarcoding. Current Biology, 31, R1267–R1280. [DOI] [PubMed] [Google Scholar]
- Callahan, B. J. , McMurdie, P. J. , Rosen, M. J. , Han, A. W. , Johnson, A. J. A. , & Holmes, S. P. (2016). DADA2: High‐resolution sample inference from Illumina amplicon data. Nature Methods, 13, 581–583. [DOI] [PMC free article] [PubMed] [Google Scholar]
- Cavicchioli, R. , Ripple, W. J. , Timmis, K. N. , Azam, F. , Bakken, L. R. , Baylis, M. , Behrenfeld, M. J. , Boetius, A. , Boyd, P. W. , Classen, A. T. , Crowther, T. W. , Danovaro, R. , Foreman, C. M. , Huisman, J. , Hutchins, D. A. , Jansson, J. K. , Karl, D. M. , Koskella, B. , Mark Welch, D. B. , … Webster, N. S. (2019). Scientists' warning to humanity: Microorganisms and climate change. Nature Reviews Microbiology, 17, 569–586. [DOI] [PMC free article] [PubMed] [Google Scholar]
- de Vargas, C. , Audic, S. , Henry, N. , Decelle, J. , Mahé, F. , Logares, R. , Lara, E. , Berney, Ć. , Le Bescot, N. , Probert, I. , Carmichael, M. , Poulain, J. , Romac, S. , Colin, S. , Aury, J. M. , Bittner, L. , Chaffron, S. , Dunthorn, M. , Engelen, S. , … Velayoudon, D. (2015). Eukaryotic plankton diversity in the sunlit ocean. Science, 348, 1261605. [DOI] [PubMed] [Google Scholar]
- Duarte, C. M. (2015). Seafaring in the 21st century: The Malaspina 2010 circumnavigation expedition. Limnology and Oceanography Bulletin, 24, 11–14. [Google Scholar]
- Geisen, S. , Mitchell, E. A. D. , Adl, S. , Bonkowski, M. , Dunthorn, M. , Ekelund, F. , Fernández, L. D. , Jousset, A. , Krashevska, V. , Singer, D. , Spiegel, F. W. , Walochnik, J. , & Lara, E. (2018). Soil protists: A fertile frontier in soil biology research. FEMS Microbiology Reviews, 42, 293–323. [DOI] [PubMed] [Google Scholar]
- Giner, C. R. , Balagué, V. , Krabberød, A. K. , Ferrera, I. , Reñé, A. , Garcés, E. , Gasol, J. M. , Logares, R. , & Massana, R. (2019). Quantifying long‐term recurrence in planktonic microbial eukaryotes. Molecular Ecology, 28, 923–935. [DOI] [PubMed] [Google Scholar]
- Giner, C. R. , Pernice, M. C. , Balagué, V. , Duarte, C. M. , Gasol, J. M. , Logares, R. , & Massana, R. (2020). Marked changes in diversity and relative activity of picoeukaryotes with depth in the world ocean. ISME Journal, 14, 437–449. [DOI] [PMC free article] [PubMed] [Google Scholar]
- Guillou, L. , Bachar, D. , Audic, S. , Bass, D. , Berney, C. , Bittner, L. , Boutte, C. , Burgaud, G. , de Vargas, C. , Decelle, J. , del Campo, J. , Dolan, J. R. , Dunthorn, M. , Edvardsen, B. , Holzmann, M. , Kooistra, W. H. C. F. , Lara, E. , Le Bescot, N. , Logares, R. , … Christen, R. (2013). The protist ribosomal reference database (PR2): A catalog of unicellular eukaryote small sub‐unit rRNA sequences with curated taxonomy. Nucleic Acids Research, 41, D597–D604. [DOI] [PMC free article] [PubMed] [Google Scholar]
- Ibarbalz, F. M. , Henry, N. , Brandão, M. C. , Martini, S. , Busseni, G. , Byrne, H. , Coelho, L. P. , Endo, H. , Gasol, J. M. , Gregory, A. C. , Mahé, F. , Rigonato, J. , Royo‐Llonch, M. , Salazar, G. , Sanz‐Sáez, I. , Scalco, E. , Soviadan, D. , Zayed, A. A. , Zingone, A. , … Zinger, L. (2019). Global trends in marine plankton diversity across kingdoms of life. Cell, 179, 1084–1097.e21. [DOI] [PMC free article] [PubMed] [Google Scholar]
- Kopf, A. , Bicak, M. , Kottmann, R. , Schnetzer, J. , Kostadinov, I. , Lehmann, K. , Fernandez‐Guerra, A. , Jeanthon, C. , Rahav, E. , Ullrich, M. , Wichels, A. , Gerdts, G. , Polymenakou, P. , Kotoulas, G. , Siam, R. , Abdallah, R. Z. , Sonnenschein, E. C. , Cariou, T. , O'Gara, F. , … Glöckner, F. O. (2015). The ocean sampling day consortium. GigaScience, 4, 27. [DOI] [PMC free article] [PubMed] [Google Scholar]
- Lambert, S. , Tragin, M. , Lozano, J. C. , Ghiglione, J. F. , Vaulot, D. , Bouget, F. Y. , & Galand, P. E. (2019). Rhythmicity of coastal marine picoeukaryotes, bacteria and archaea despite irregular environmental perturbations. ISME Journal, 13, 388–401. [DOI] [PMC free article] [PubMed] [Google Scholar]
- Leblanc, K. , Quéguiner, B. , Diaz, F. , Cornet, V. , Michel‐Rodriguez, M. , Durrieu De Madron, X. , Bowler, C. , Malviya, S. , Thyssen, M. , Grégori, G. , Rembauville, M. , Grosso, O. , Poulain, J. , De Vargas, C. , Pujo‐Pay, M. , & Conan, P. (2018). Nanoplanktonic diatoms are globally overlooked but play a role in spring blooms and carbon export. Nature Communications, 9, 953. [DOI] [PMC free article] [PubMed] [Google Scholar]
- Logares, R. , Deutschmann, I. M. , Junger, P. C. , Giner, C. R. , Krabberød, A. K. , Schmidt, T. S. , RubinatRipoll, L. , Mestre, M. , Salazar, G. , Ruiz‐González, C. , Sebastián, M. , De Vargas, C. , Acinas, S. G. , Duarte, C. M. , Gasol, J. M. , & Massana, R. (2020). Disentangling the mechanisms shaping the surface ocean microbiota. Microbiome, 8, 55. [DOI] [PMC free article] [PubMed] [Google Scholar]
- Lopes dos Santos, A. , Ribeiro Gérikas, C. , Ong, D. , Garczarek, L. , Shi, X. L. , Nodder, S. , Vaulot, D. , & Gutierrez‐Rodriguez, A. (2021). Phytoplankton diversity and ecology through the lens of high throughput sequencing technologies. In Advances in phytoplankton ecology. Applications of emerging technologies (pp. 353–413). Elsevier. [Google Scholar]
- Mahé, F. , de Vargas, C. , Bass, D. , Czech, L. , Stamatakis, A. , Lara, E. , Singer, D. , Mayor, J. , Bunge, J. , Sernaker, S. , Siemensmeyer, T. , Trautmann, I. , Romac, S. , Berney, C. , Kozlov, A. , Mitchell, E. A. , Seppey, C. V. , Egge, E. , Lentendu, G. , … Dunthorn, M. (2017). Parasites dominate hyperdiverse soil protist communities in neotropical rainforests. Nature Ecology and Evolution, 1, 0091. [DOI] [PubMed] [Google Scholar]
- Malviya, S. , Scalco, E. , Audic, S. , Vincent, F. , Veluchamy, A. , Poulain, J. , Wincker, P. , Iudicone, D. , De Vargas, C. , Bittner, L. , Zingone, A. , & Bowler, C. (2016). Insights into global diatom distribution and diversity in the world's ocean. Proceedings of the National Academy of Sciences of the United States of America, 113, E1516–E1525. [DOI] [PMC free article] [PubMed] [Google Scholar]
- Martin, M. (2011). Cutadapt removes adapter sequences from high‐throughput sequencing reads. EMBnet.journal, 17, 10. [Google Scholar]
- Massana, R. , Gobet, A. , Audic, S. , Bass, D. , Bittner, L. , Boutte, C. , Chambouvet, A. , Christen, R. , Claverie, J. M. , Decelle, J. , Dolan, J. R. , Dunthorn, M. , Edvardsen, B. , Forn, I. , Forster, D. , Guillou, L. , Jaillon, O. , Kooistra, W. H. , Logares, R. , … de Vargas, C. (2015). Marine protist diversity in European coastal waters and sediments as revealed by high‐throughput sequencing. Environmental Microbiology, 17, 4035–4049. [DOI] [PubMed] [Google Scholar]
- McMurdie, P. J. , & Holmes, S. (2013). Phyloseq: An R package for reproducible interactive analysis and graphics of microbiome census data. PLoS One, 8, e61217. [DOI] [PMC free article] [PubMed] [Google Scholar]
- Metz, S. , Huber, P. , Accattatis, V. , Lopes dos Santos, A. , Bigeard, E. , Unrein, F. , Chambouvet, A. , Not, F. , Lara, E. , & Devercelli, M. (2022). Freshwater protists: Unveiling the unexplored in a large floodplain system. Environmental Microbiology, 24, 1731–1745. [DOI] [PubMed] [Google Scholar]
- Obiol, A. , Muhovic, I. , & Massana, R. (2021). Oceanic heterotrophic flagellates are dominated by a few widespread taxa. Limnology and Oceanography, 66, 4240–4253. [Google Scholar]
- Pawlowski, J. , Audic, S. , Adl, S. , Bass, D. , Belbahri, L. , Berney, C. , Bowser, S. S. , Cepicka, I. , Decelle, J. , Dunthorn, M. , Fiore‐Donno, A. M. , Gile, G. H. , Holzmann, M. , Jahn, R. , Jirků, M. , Keeling, P. J. , Kostka, M. , Kudryavtsev, A. , Lara, E. , … de Vargas, C. (2012). CBOL protist working group: Barcoding eukaryotic richness beyond the animal, plant, and fungal kingdoms. PLoS Biology, 10, e1001419. [DOI] [PMC free article] [PubMed] [Google Scholar]
- Piredda, R. , Tomasino, M. P. , D'Erchia, A. M. , Manzari, C. , Pesole, G. , Montresor, M. , Kooistra, W. H. , Sarno, D. , & Zingone, A. (2017). Diversity and temporal patterns of planktonic protist assemblages at a Mediterranean long term ecological research site. FEMS Microbiology Ecology, 93, fiw200. [DOI] [PubMed] [Google Scholar]
- Quast, C. , Pruesse, E. , Yilmaz, P. , Gerken, J. , Schweer, T. , Yarza, P. , Peplies, J. , & Glöckner, F. O. (2013). The SILVA ribosomal RNA gene database project: Improved data processing and web‐based tools. Nucleic Acids Research, 41, D590–D596. [DOI] [PMC free article] [PubMed] [Google Scholar]
- R Development Core Team . (2021). R: A language and environment for statistical computing. R Foundation for Statistical Computing. https://www.R‐project.org/ [Google Scholar]
- Sali, A. , & Attali, D. (2020). Shinycssloaders: Add loading animations to a ‘shiny’ output while it's recalculating. https://github.com/daattali/shinycssloaders
- Santoferrara, L. , Burki, F. , Filker, S. , Logares, R. , Dunthorn, M. , & McManus, G. B. (2020). Perspectives from ten years of protist studies by high‐throughput metabarcoding. Journal of Eukaryotic Microbiology, 67, 612–622. [DOI] [PubMed] [Google Scholar]
- Santoferrara, L. F. (2019). Current practice in plankton metabarcoding: Optimization and error management. Journal of Plankton Research, 41, 571–582. [Google Scholar]
- Schneider, L. , Anestis, K. , Mansour, J. , Anschütz, A. , Gypens, N. , Hansen, P. , John, U. , Klemm, K. , Martin, J. , Medic, N. , Not, F. , & Stolte, W. (2020). A dataset on trophic modes of aquatic protists. Biodiversity Data Journal, 8, e56648. [DOI] [PMC free article] [PubMed] [Google Scholar]
- Singer, D. , Seppey, C. V. , Lentendu, G. , Dunthorn, M. , Bass, D. , Belbahri, L. , Blandenier, Q. , Debroas, D. , de Groot, G. A. , de Vargas, C. , Domaizon, I. , Duckert, C. , Izaguirre, I. , Koenig, I. , Mataloni, G. , Schiaffino, M. R. , Mitchell, E. A. , Geisen, S. , & Lara, E. (2021). Protist taxonomic and functional diversity in soil, freshwater and marine ecosystems. Environment International, 146, 106262. [DOI] [PubMed] [Google Scholar]
- Sommeria‐Klein, G. , Watteaux, R. , Ibarbalz, F. M. , Pierella Karlusich, J. J. , Iudicone, D. , Bowler, C. , & Morlon, H. (2021). Global drivers of eukaryotic plankton biogeography in the sunlit ocean. Science, 374, 594–599. [DOI] [PubMed] [Google Scholar]
- Stoeck, T. , Bass, D. , Nebel, M. , Christen, R. , Jones, M. D. M. , Breiner, H. W. , & Richards, T. A. (2010). Multiple marker parallel tag environmental DNA sequencing reveals a highly complex eukaryotic community in marine anoxic water. Molecular Ecology, 19, 21–31. [DOI] [PubMed] [Google Scholar]
- Stoeck, T. , Behnke, A. , Christen, R. , Amaral‐Zettler, L. , Rodriguez‐Mora, M. J. , Chistoserdov, A. , Orsi, W. , & Edgcomb, V. P. (2009). Massively parallel tag sequencing reveals the complexity of anaerobic marine protistan communities. BMC Biology, 7, 72. [DOI] [PMC free article] [PubMed] [Google Scholar]
- Taberlet, P. , Coissac, E. , Pompanon, F. , Brochmann, C. , & Willerslev, E. (2012). Towards next‐generation biodiversity assessment using DNA metabarcoding. Molecular Ecology, 21, 2045–2050. [DOI] [PubMed] [Google Scholar]
- Thompson, L. R. , Sanders, J. G. , McDonald, D. , Amir, A. , Ladau, J. , Locey, K. J. , Prill, R. J. , Tripathi, A. , Gibbons, S. M. , Ackermann, G. , Navas‐Molina, J. A. , Janssen, S. , Kopylova, E. , Vázquez‐Baeza, Y. , González, A. , Morton, J. T. , Mirarab, S. , Zech Xu, Z. , Jiang, L. , … Knight, R. (2017). A communal catalogue reveals Earth's multiscale microbial diversity. Nature, 551, 457–463. [DOI] [PMC free article] [PubMed] [Google Scholar]
- Tragin, M. , & Vaulot, D. (2018). Green microalgae in marine coastal waters: The ocean sampling day (OSD) dataset. Scientific Reports, 8, 14020. [DOI] [PMC free article] [PubMed] [Google Scholar]
- Travers, C. (2021). Qs R package. Quick Serialization of R Objects .
- van der Loo, M. P. J. , & de Jonge, E. (2021). Data Validation Infrastructure for R. Journal of Statistical Software, 97. [Google Scholar]
- Vernette, C. , Henry, N. , Lecubin, J. , de Vargas, C. , Hingamp, P. , & Lescot, M. (2021). The ocean barcode atlas: A web service to explore the biodiversity and biogeography of marine organisms. Molecular Ecology Resources., 21, 1347–1358. [DOI] [PubMed] [Google Scholar]
- Yau, S. , Lopes dos Santos, A. , Eikrem, W. , Gérikas Ribeiro, C. , Gourvil, P. , Balzano, S. , Escande, M. L. , Moreau, H. , & Vaulot, D. (2020). Mantoniella beaufortii and Mantoniella baffinensis sp. nov. (Mamiellales, Mamiellophyceae), two new green algal species from the high arctic1. Journal of Phycology, 56, 37–51. [DOI] [PubMed] [Google Scholar]
- Zhu, F. , Massana, R. , Not, F. , Marie, D. , & Vaulot, D. (2005). Mapping of picoeucaryotes in marine ecosystems with quantitative PCR of the 18S rRNA gene. FEMS Microbiology Ecology, 52, 79–92. [DOI] [PubMed] [Google Scholar]
Associated Data
This section collects any data citations, data availability statements, or supplementary materials included in this article.
Supplementary Materials
Data S1
Data Availability Statement
The source code for the Shiny server has been made available as an R package from GitHub (https://github.com/pr2database/metapr2‐shiny, doi: 10.5281/zenodo.5992354). The source code for this study has been made available from GitHub (https://github.com/vaulot/Paper‐2021‐Vaulot‐metapr2). Source code for sequence processing has been made available from GitHub https://github.com/vaulot/Paper‐2021‐Vaulot‐metapr2/tree/main/R_processing.


