

Abstract
Dysregulation of protein prenylation has been implicated in many diseases, including Alzheimer’s disease (AD). Prenylomic analysis, the combination of metabolic incorporation of an isoprenoid analogue (C15AlkOPP) into prenylated proteins with a bottom-up proteomic analysis, has allowed identification of prenylated proteins in various cellular models. Here, transgenic AD mice were administered with C15AlkOPP through intracerebroventricular (ICV) infusion over 13 days. Using prenylomic analysis, 36 prenylated proteins were enriched in the brains of AD mice. Importantly, the prenylated forms of 15 proteins were consistently upregulated in AD mice compared to non-transgenic wild-type controls. These results highlight the power of this in vivo metabolic labeling approach to identify multiple post-translationally modified proteins that may serve as potential therapeutic targets for a disease that has proved refractory to treatment thus far. Moreover, this method should be applicable to many other types of protein modifications, significantly broadening its scope.
Graphical Abstract

Introduction
Advances in science and medicine over the last 100 years have triggered a dramatic increase in life expectancy. With a longer-living population, it is expected that there will be an increase in aging-related diseases including Alzheimer’s disease (AD). This debilitating diagnosis is not exclusive in its devastation, and it places the family of the afflicted under extreme emotional and financial stress. Currently there are over 6 million Americans living with AD, and by 2060 that number is projected to grow to 13.8 million,1. The traditional pathological markers of AD, including aggregation of amyloid-β peptide (Aβ) in neuritic plaques and formation of neurofibrillary tangles from hyper-phosphorylation of Tau protein, have been meticulously characterized and pursued as potential targets for therapeutic development,2–4. Unfortunately, which dysregulated biological mechanisms lead to the pathogenesis of AD, especially sporadic AD, is still not well understood. In the search for possible mechanisms for AD pathogenesis, one important process, that has been implicated yet underexplored, is protein prenylation.
Protein prenylation is a widespread post-translational modification of proteins consisting of the addition of an isoprenoid near the C-terminus for intracellular protein localization and trafficking,5–8.The prenylation of proteins is integral to proper cellular signaling and regulation and specific prenylated proteins, including Rab10 and H-Ras, have been associated with the development of AD,6,9–12. There are three types of prenylation: farnesylation, type I geranylgeranylation, and type II geranylgeranylation. During farnesylation and type I geranylgeranylation, either a farnesyl group from farnesyl diphosphate (FPP, Fig.1A) or a geranylgeranyl group from geranylgeranyl diphosphate (GGPP, Fig. 1A) molecule is transferred to a protein via the action of farnesyltransferase (FTase) or geranylgeranyltransferase type I (GGTase I) respectively,13. Protein substrates for farnesylation or type I geranylgeranylation have an identifying tetrapeptide motif at the C-terminus recognized by these enzymes. This CaaX motif, where C is cysteine and the site of modification, a is an aliphatic amino acid, and X is a variable amino acid, determines whether a protein is prenylated and which type of prenylation occurs,14. For type II geranylgeranylation, there are different motifs, CXC, XCXC, and CC, which have two cysteine residues for the transfer of two geranylgeranyl groups from GGPP. An additional upstream sequence element is required for this type of modification. The substrate scope for geranylgeranylation type II is exclusive to Rab proteins, a subset of the small GTPase proteins,15.
Figure 1. Brain metabolic labeling after a single bolus ICV injection and 13-day ICV infusion of C15AlkOPP.

(A) Structures of endogenous substrates for prenylation, alkyne-containing diphosphate analogue (C15AlkOPP) used in this study and the alcohol (C15AlkOH) analogue. (B) Schematic representation of ICV bolus injection and ICV infusion and (C) the relative locations of brain coronal sections (400 μm) from the injection/infusion site that were used for the representative in-gel fluorescence. The brain section (600 μm) located between section #1 and #2 was PFA-fixed for in situ click reaction and imaging. (D) In-gel fluorescence and Coomassie blue gel staining images of brain regions depicted in B. Brains were harvested 48 hours after the left ICV bolus injection of 150 mM C15AlkOPP (10 μL) or 10 mM Simvastatin (SV) (10 μL) + 150 mM C15AlkOPP (10 μL); or 13 days after the initiation of left ICV infusion of followings: 150 mM C15AlkOPP, or 10 mM simvastatin (SV) + 150 mM C15AlkOPP (1:3).
Prenylation was initially linked to AD through retroactive epidemiological analysis of clinical records that demonstrated that patients who take statins have significantly lower incidences of AD diagnosis,4,10,11,16,17. Statins, which are 3-hydroxy-3-methylglutaryl coenzyme A (HMG-CoA) reductase inhibitors, decrease cholesterol production by suppressing the production of mevalonate and the biosynthesis of the downstream isoprenoids FPP and GGPP. This decrease in isoprenoid production, and concomitant decrease in protein prenylation, is likely the mechanism behind statin-induced, cholesterol-independent pleiotropic effects including neuroprotection,4,11,18. Beyond epidemiological data, there is also compelling biochemical evidence that directly shows that prenylation is dysregulated in AD brains. Analysis of brain tissue from AD patients has revealed increased levels of FPP and GGPP and elevated mRNA expression for the corresponding synthases for these two compounds,19. Recent studies further showed that FTase per se, its farnesylated substrates, and downstream signaling pathways were significantly increased in human AD brains,12. This dysregulation, was further confirmed in experiments using the transgenic AD model APP/PS1 mice, in which either FTase haplodeficiency or neuron-specific FTase-deficiency rescued cognitive function, decreased Aβ deposition, and attenuated neuroinflammation,12,20. Interestingly, GGTase haploid deficient APP/PS1 mice showed a decrease in Aβ and neuroinflammation but without rescuing cognitive function, highlighting potential distinct roles of the different types of prenylation in AD,21. Recently, it was reported that an FTase inhibitor attenuates axonal dystrophy and reduces amyloid pathology in mice.22 While some prenylated proteins have been individually implicated in the development of AD and Aβ processing including H-Ras, Rac1, Rho, Rab5, Rab7, Rab10, and Rab35,12,23–28 a method for simultaneously tracking the prenylation of all prenyltransferase protein substrates would be highly useful for clarifying the role of protein prenylation in AD.
Prenylomic analysis involves the use of metabolic labeling of prenylated proteins with an alkyne-containing analogue of FPP and GGPP (Fig. 1A), bioorthogonal labeling and subsequent enrichment followed by quantitative bottom-up proteomic analysis. Metabolic labeling is possible since FTase, GGTase I, and GGTase II have shown some flexibility with regards to the isoprenoid substrate structure, allowing for the development of analogues of the natural substrate containing biorthogonal functionality. The structure of C15AlkOPP, an analogue that is an efficient substrate for both FPP- and GGPP-utilizing prenyltransferases is shown in Fig. 1A,29–31 Prenylomic analysis using C15AlkOPP, and related compounds, have been employed to identify and track the levels of specific prenylated proteins in cell culture-based systems and to explore their roles in diseases including cancer,32–35. In earlier work, this method was used to profile prenylated proteins in brain-derived cell lines using both primary and immortalized cells,36 Those experiments revealed similarities and differences in the identities and levels of prenylated proteins found between different cell types. However, such experiments using only one cell type cannot capture the complex pathology of a disease such as AD. While metabolic labeling in mice has been previously reported,37, the application of metabolic labeling combined with proteomic analysis is quite limited,38
Here, methodology is described that extends the application of prenylomic analysis to the transgenic APP/PS1 mouse model that recapitulates many of the hallmarks of AD. First, different methods for delivery of C15AlkOPP to the brain of non-transgenic wild-type (WT) mice were explored to maximize incorporation of the analogue. It was found that constant slow intracerebroventricular (ICV) infusion of C15AlkOPP for approximately two weeks using an osmotic pump gave substantially higher levels of protein labeling compared with single injections as determined via in-gel fluorescence analysis. Using this methodology, three pairs of APP/PS1 and WT mice were labeled with C15AlkOPP, followed by prenylomic analysis. The triplicate comparison of APP/PS1 to WT mice showed a consistent increase in prenylation in the AD model. A group of 15 prenylated proteins were identified across all three pairs. Importantly, many of these proteins have a documented relationship to the neuropathology of AD. This is the first example of the use of prenylomic analysis to characterize the dysregulation of a prenylome in vivo.
Methods
Mouse surgery
Acute bolus intracerebroventricular (ICV) injection: For bolus injection, mice were deeply anesthetized with isoflurane throughout the surgery. 10 μL of vehicle (25 mM NH4HCO3), 10 μL of 150 mM C15AlkOPP, or 20 μL of 150 mM C15AlkOPP + 10 mM SV mixture (1:1) was loaded into a Hamilton syringe (Hamilton, 80300; 80501), and stereotaxically injected into the left ventricle at an administration rate of 1 μL per min using a microinjector using the following coordinates: A/P −0.5 mm, M/L +1.1 mm, D/V −2.5 mm. Brain tissues were collected 48 h after the injection. Chronic ICV infusion: The Brain infusion kit 3 (Cat# 0008851; Pump model #1002) was purchased from Alzet (Cupertino, CA, USA). For initial testing each pump was filled with one of the following: 100 μL of vehicle (25 mM NH4HCO3); 150 mM C15AlkOPP; 1:3 mixture of 10 mM simvastatin and 150 mM C15AlkOPP. For comparison between APP/PS1 mice and wild type controls, each pump was filled with 100 μL of 100 mM C15AlkOPP. A single 0.5 mm spacer was attached to the cannula to adjust the depth to 2.5 mm. A 2-cm long catheter tube was used to connect the osmotic pump with the cannula. The assembled brain infusion pump was placed in sterile normal saline until use. Pumps were filled and assembled in a class II biosafety cabinet to achieve sterility. Prior to and throughout the surgery, mice were deeply anesthetized by isoflurane. The osmotic pump was implanted into the subcutaneous space in front of the left hind limb, and the cannula was stereotaxically placed to the left ventricle using the same coordinate as the bolus injection. After 13 days, the pumps were removed, and the brains were harvested.
Brain tissue collection and processing
Acute ICV injection and chronic ICV infusion comparison samples: After harvesting, the olfactory bulbs and cerebellum were removed from the brains. Then the brains were cut sagittally into the left and right hemispheres, both of which were acutely sliced coronally using a Vibratome (Leica Microsystems Inc.) at an alternating thickness of 400 μm and 600 μm from anterior to posterior. The 600 μm brain slices were fixed in 4% paraformaldehyde (PFA) at room temperature for 20 min, rinsed with PBS, and stored in 4°C immersed in PBS containing 0.02 % sodium azide until use. The 400 μm brain slices were homogenized in 250 μL of PBS containing 1% SDS and AEBSF using a Bullet Blender® tissue homogenizer (Next Advance, Inc., NY), then further homogenized by applying 2-s sonicating pulses 15 times with 4 s intervals on ice. Lysates were cleared by centrifugation at 13,000 × g for 15 min at room temperature, and protein concentrations of supernatants were measured by Bradford assay (Thermo Fisher, 23246) following the manufacturer’s protocol.
Results and Discussion
A single bolus ICV injection of C15AlkOPP showed limited brain labeling of prenylated proteins
Previously, brain metabolic labeling was attempted by intraperitoneally (IP) injecting an isoprenoid analogue C15AlkOH (Fig. 1A) dissolved in normal saline containing 5% Tween 80. Although IP delivery of C15AlkOH successfully labeled prenylation substrates in the peripheral organs, it failed at brain labeling, possibly due to its limited blood brain barrier (BBB) permeability (unpublished data). Therefore, a direct brain injection approach was employed to ensure the delivery of the isoprenoid analogue to the brain. Diphosphate isoprenoid analogue C15AlkOPP manifests superior labeling efficiency compared to alcohol based C15AlkOH in multiple cell lines,39, and therefore, C15AlkOPP was chosen over C15AlkOH in this study. The chemical structures of C15AlkOPP, C15AlkOH, and the endogenous isoprenoids FPP and GGPP are shown in Fig. 1A.
To maximize the potential injection volume and brain distribution, the lateral ventricle was chosen as the target site of administration (SI Fig. 1A). After unsuccessful attempts using 10 mM C15AlkOPP, the injection concentration of C15AlkOPP was increased to 150 mM. After 48 hours following a 10 μL bolus left ICV injection of vehicle or 150 mM C15AlkOPP with or without co-administration of 10 mM simvastatin (SV), brains were collected from mice. To survey the distribution of the analogue in relation to the injection site, both left and right cerebral hemispheres were sliced at alternating thickness of 400 μm and 600 μm. Brain slices of 600 μm thickness were fixed for in situ click reaction. Meanwhile, all the 400-μm slices that were located within 2 mm anterior or posterior to the injection site were homogenized and subjected to click reaction with TAMRA-azide for visualization of metabolic labeling. In-gel fluorescence showed increased TAMRA fluorescence in the 60–65 kDa region in mice injected with C15AlkOPP compared to mice injected with vehicle, in the brain region adjacent to the injection site (SI Fig. 1B and 1C). This labeling was greater in the mouse that received the mixture of both SV and the analogue because statins increase the incorporation efficiency of exogenous analogues into target proteins by reducing endogenous FPP and GGPP levels,29,36,40. However, surprisingly, there was no TAMRA fluorescence band in the 20–25 kDa region of the gel where many prenylated small-GTPases migrate, suggesting that C15AlkOPP did not efficiently label small GTPases in this experiment (SI Fig. 1 C).
To verify that the specific analogue solution used for the injection could modify small GTPases and other known prenylation substrates, the same C15AlkOPP solution was diluted and tested using the human neuroblastoma SH-SY5Y cell line at a final concentration of 10 μM. After 24 hours, the incorporation of the analogue was visualized using in-gel fluorescence. The protein labeling pattern in SH-SY5Y cells was similar to that previously reported in HeLa and COS-7 cells,29,36, with intense fluorescence bands in the 20–25 kDa region (SI Fig.1D). These results confirmed the integrity of the analogue sample and that the observed absence of small GTPases labeling in vivo most likely resulted from poor labeling efficiency due to the single bolus injection approach.
In vivo brain labeling with sustained ICV infusion of C15AlkOPP
To achieve prolonged delivery of the isoprenoid analogue, osmotic pump mediated ICV infusion was employed. After 13 day-infusions of 150 mM C15AlkOPP, or a 1:3 mixture of 10 μM SV and 150 mM C15AlkOPP to the left ventricle (Fig. 1A, right diagram), brains were collected and sectioned the same way as described for the bolus ICV injection samples. Fluorescent labeling of lysate obtained from each 400 μm slice proximal to the infusion showed intense fluorescent signals throughout the entire lane including the 20–25 kDa region (Fig. 1B). As expected, co-administration of SV with C15AlkOPP led to more intense labeling than infusing C15AlkOPP alone, but the presence of SV did not change the overall fluorescent banding pattern. In addition, the labeling was restricted to the brain regions ipsilateral to the injection/infusion site (left). To directly visualize the distribution and cellular uptake of C15AlkOPP following the 13-day infusion in the brain, prefixed 600 μm brain slices from the region adjacent to the most intensely labeled brain slides per in-gel fluorescence were selected. These slides were further sectioned at a thickness of 50 μm, and in situ click reaction was performed directly on the section using TAMRA- azide along with the immunostaining of a neuronal marker NeuN (SI Fig. 2). Even though significant background labeling was detected, overall, the TAMRA fluorescence intensity in the C15AlkOPP-treated brain section was significantly higher than that in the vehicle-treated mouse brain section. This supports the conclusion that C15AlkOPP was successfully delivered to the brain parenchyma around the infusion site after being introduced into the ventricle.
Prenylomic profiling of brains from WT mice following ICV infusion of C15AlkOPP with or without statin
To identify and quantify the prenylated proteins that were visualized in both the in-gel fluorescence analysis (Fig. 1D) and in-situ labeling experiments (SI Fig. 2), the prenylomic workflow shown in Fig. 2A was employed. This allows the identities and relative levels of prenylated proteins to be determined through a combination of metabolic incorporation of C15AlkOPP, bioorthogonal labeling, and subsequent enrichment followed by quantitative bottom-up proteomic analysis. Initial profiling experiments were performed comparing a WT mouse that had undergone a 13-day ICV infusion with a mouse that received the probe vehicle in the same manner. For the enrichment of these samples, the brain lysate containing 2 mg of total protein from each mouse was subjected to CuAAC labeling with biotin-azide.As previously established,36 this method allows for the enrichment of prenylated proteins from complex mixtures using a neutravidin-resin pull down followed by on-bead digestion with trypsin. The resulting peptide samples were then divided into three technical replicates, as shown in Fig. 2A, for a TMT 6plex labeling quantification strategy. Before mass spectrometric analysis, the samples were fractionated at high pH and then subjected to a Nano-LC-MS3 separation and analysis. The resulting data was processed with MaxQuant using a non-redundant mouse protein reference library.
Figure 2: Prenylomic profiling of WT mice after ICV infusion of C15AlkOPP with or without a statin treatment.

(A) Schematic representation of the prenylomic workflow depicting the enrichment of prenylated proteins, their digestion, and the subsequent division of peptides into three replicates. This scheme shows the process for C15AlkOPP treated samples. The vehicle sample was treated in the same manner with the only change being that vehicle replicates were labeled with TMT 126, TMT127, and TMT128 reagents. (B) Gel fluorescence analysis of the brain samples used in this analysis. After harvesting, the left side of the brain was lysed and subjected to a click reaction with TAMRA-azide to visualize the level of alkyne-probe incorporation in these samples. Lane 1 contains vehicle sample, Lane 2 contains C15AlkOPP sample and Lane 3 contains the sample treated with C15AlkOPP and statin. (C) Volcano plot comparing C15AlkOPP with vehicle ICV infusion (FDR=5%). (D) Volcano plot comparing C15AlkOPP and simvastatin coadministration with vehicle ICV infusion (FDR=5%). (E) Venn diagrams showing the distribution of prenylated proteins obtained from the volcano plots shown in panels C and D. These are further subdivided by type of prenylation shown in color. Proteins that are grouped differently across the pairs are entered as one protein. Example: In C15AlkOPP treatment alone Rab3a,3b,3c are grouped, and in the SV+C15AlkOPP treated mouse Rab 3a,3b, and 3c are not grouped. Therefore, for simplicity, Rab 3a,3b and 3c are one data point in the Venn diagram. Color scheme: prenylated proteins that are known substrates for FTase (red); prenylated proteins that are substrates for GGTase I (blue); prenylated proteins that are known substrates for GGTase II (green).
In this initial proof-of-concept work, the level of the incorporation of C15AlkOPP in the brain of WT mice after the 13-day ICV infusion allowed the detection of 17 prenylated proteins in mice treated with the analogue versus the vehicle (Fig. 2C, SI Table 5). Those 17 proteins are mostly substrates for GGTase I (4 proteins, blue) or II (11 proteins, green). In previous work, performed in cell culture, it has been demonstrated that treatment with a statin leads to increased incorporation of C15AlkOPP, as evidenced by a larger number of proteins identified with greater fold changes as well as by an increase in the identification of farnesylated proteins,36,39,40.
When WT mice were treated with C15AlkOPP in conjunction with simvastatin, a similar increase was seen with 37 prenylated proteins found, compared with 17 observed in the absence of statin. This 20-protein increase included a significant increase in the number of FTase substrates. Thus, in the presence of simvastatin, 8 FTase substrates, 9 GGTase I substrates and 20 GGTase II substrates were detected (SI Table 5). From these two experiments, two important baselines for the identification of prenylated proteins from the in vivo metabolic labeling of mouse brains were defined. In the case of C15AlkOPP treatment alone, the identification of 17 proteins suggested that it should be possible to monitor the levels of those proteins in WT versus diseased mice. In contrast, the 37 proteins detected using C15AlkOPP in the presence of a statin likely defines an upper bound for the number of prenylated proteins that might be studied via the current implementation of this metabolic labeling strategy. Thus, these experiments set the stage for the application of this methodology for the study of protein prenylation in the APP/PS1 mouse model.
In vivo brain labeling of APP/PS1 and WT mice via ICV infusion of C15AlkOPP
Next, to test whether the C15AlkOPP-mediated brain labeling can probe prenylomic changes associated with the amyloid pathology, metabolic labeling was performed in a group of aged female (16–20 months) APP/PS1 mice and their WT controls (n=3 mice/genotype). At this age, APP/PS1 mice have significant amyloid plaque pathology as well as cognitive behavioral deficits,41. During the preliminary testing of ICV infusion, some precipitation of C15AlkOPP was noted at the concentration of 150 mM. Therefore, the analogue was diluted to 100 mM to avoid any potential precipitation of C15AlkOPP inside the pump or in the brain. Both groups were administered the same amount of C15AlkOPP through a brain infusion osmotic pump (Fig. 3A). Brains were collected 13 days after initiating the ICV infusion. Based on the labeling pattern observed from the brain slices, the left-brain region around the infusion site (including the area 1–2 mm anterior and posterior to the infusion site was dissected out (Fig. 3B), homogenized and subjected to click reaction with TAMRA-azide and subsequent in-gel fluorescence (Fig.3C). Interestingly, in all 3 cases, the level of fluorescent labeling in the samples obtained from the APP/PS1 mice was substantially higher than what was observed in the samples from the WT mice. This finding suggests that protein prenylation is increased in the brain of AD mice.
Figure 3. Brain metabolic labeling of APP/PS1 and wild type control mice.
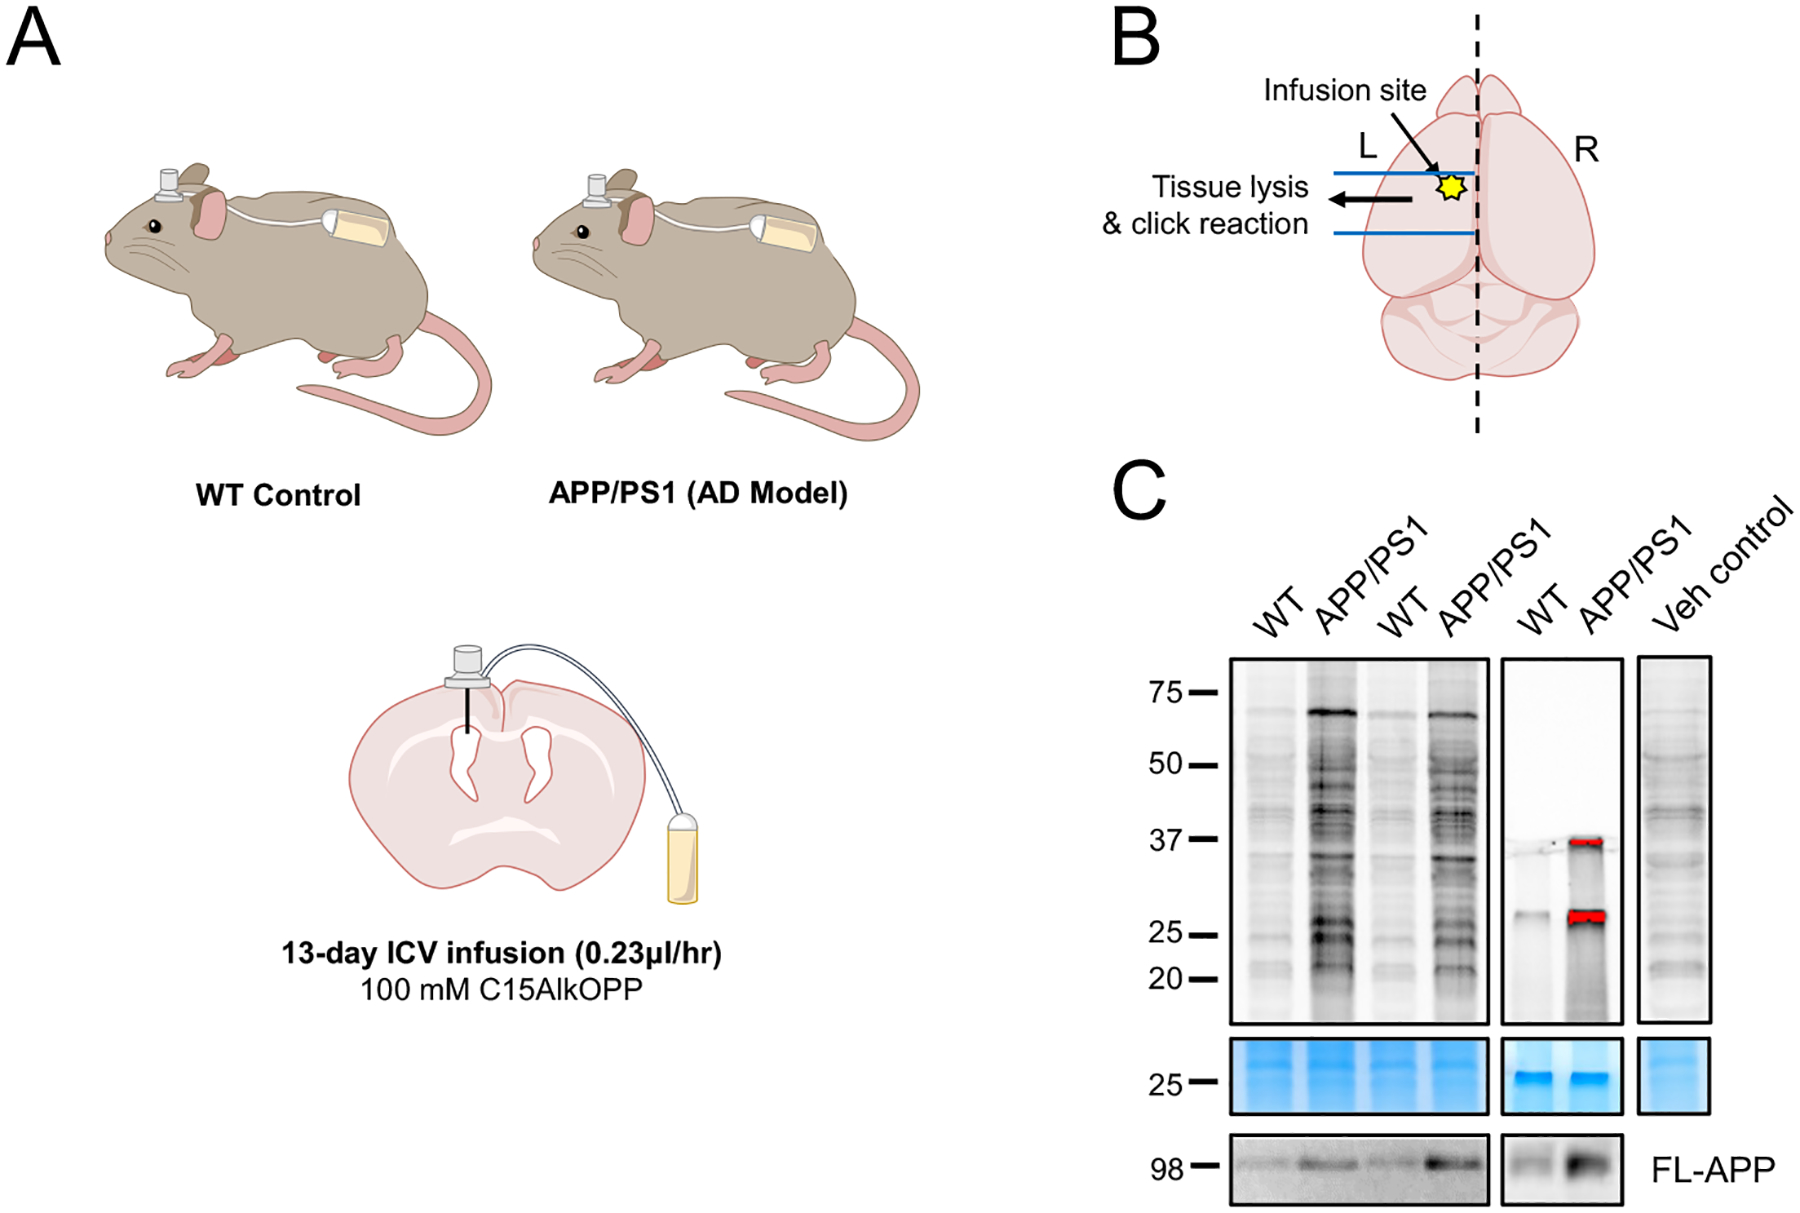
(A) Schematic representation of the site of ICV infusion and (B) brain area used for the representative in-gel fluorescence and the prenylome profiling. (C) In-gel fluorescence and Coomassie blue gel staining images of WT and APP/PS1 mice after 13-day left ICV infusion of 100 mM C15AlkOPP. Full-length APP (FL-APP) was measured via immunoblot assay to confirm the genotypes.
Proteomic analysis identified significantly enriched prenylated proteins in the brain of APP/PS1 mice compared to WT controls
To explore how the levels of prenylation differ in the AD model, the brain samples from three pairs of mice described above were subjected to the prenylomic workflow as illustrated in Fig. 2A. By comparing APP/PS1 mice treated with C15AlkOPP with WT mice treated with the same amount of C15AlkOPP, differences in the levels of specific prenylated proteins in the two groups could be determined. If prenylation is unaffected in AD, then the modified prenylated proteins should not manifest statistically significant fold changes, resulting in them residing in the interior of the volcano plots. In all three pairs this was not the case; instead, it was found across all three pairs that increased prenylation was observed in the AD mice. In total, 26–28 prenylated proteins were enriched preferentially in each of the APP/PS1 mouse vs WT mouse comparisons (Fig. 4A; SI Fig. 3). Those observations match well with the in-gel fluorescence data described above where APP/PS1 tissue showed dramatically higher fluorescence labeling than the WT samples (Fig. 3C). Of all the prenylation substrate proteins enriched in the APP/PS1 mice, 15 of them were observed in all three comparisons. Those proteins are 4-trimethylaminobutyraldehyde dehydrogenase (Aldh9A1), Ras-related protein Ral-A (Rala), Synaptobrevin homolog Ykt6 (Ykt6), Ubiquitin carboxyl-terminal hydrolase isozyme L1 (Uchl1), Cell division control protein 42 homolog (Cdc42), Ras-related protein Rap-1b;1a,(Rab1b;Rap1a), 2,3-cyclic-nucleotide 3-phosphodiesterase (Cnp), Rab10, Rab11a; b, Rab18, Rab1a;b, Rab2a;b, Rab35, Rab3a, and Rab6a;b (Fig. 4C). While ALDH9A1 is listed here as a farnesylated protein, the identity of the isoprenoid on this protein and the mechanism of its prenylation has not been unambiguously established.42 Ranking of the enriched proteins by either their average fold-change or p-score revealed that Rab18 was the top ranked protein on both lists (SI Fig.4)43. Many of these proteins have previously been implicated as key players in the processing and regulation of Aβ peptide, APP, or tau proteins as highlighted in SI Table 1. It should also be noted that while there were a few proteins that were enriched in the WT mice compared with the APP/PS1 mice, none of those were observed consistently across three pairs.
Figure 4. Prenylomic analysis of three pairs of APP/PS1 vs WT mice both subjected to ICV infusion of C15AlkOPP.

(A) Volcano plots for each pair of mice (FDR=5% for all three plots). Data was processed in MaxQuant with the same parameters with non-prenlyated proteins removed for clarity. Color scheme: prenylated proteins that are known substrates for FTase (red); prenylated proteins that are substrates for GGTase I (blue); prenylated proteins that are known substrates for GGTase II (green). (B) Venn diagram showing the distribution of prenylated proteins across the three pairs of mice. This is further subdivided by the type of prenylation shown in color. Proteins that are grouped differently across the pairs are entered as one protein. Example: In pair 2 Hras;Kras;Nras are grouped, and in pair 3 Kras is not grouped and Hras;Nras are. So for simplicity, Hras;Nras and Kras are one data point in the Venn diagram. (C) Graph indicating the fold-change for the 15 proteins observed across all three pairs.
To test whether immunoblot analysis could be used to detect the differences in the prenylated versus unprenylated forms of those proteins, the brain tissue lysates from another cohort of APP/PS1 and WT mice were subjected to ultracentrifugation to separate membrane-associated (prenylated) and cytosolic (unprenylated) proteins as we described previously12, followed by immunoblot analysis. This more complex method was required since the prenylated and unprenylated forms of many Rab proteins are not baseline separable via SDS-PAGE making quantification of the two different forms difficult44. The proteins analyzed included Rab6, Rab10, and Rab35. The results showed a consistent trend of increase in the membrane-associated form of all three proteins in APP/PS1 mice compared with WT mice (SI Fig. 5), although the differences did not reach statistical significance, indicating that immunoblot analysis may not be sensitive enough to detect the changes. This highlights the advantages of the quantitative MS approach used in this study45.
Enrichment and protein-protein interaction analyses revealed overrepresented Gene Ontology (GO) terms and KEGG pathways among identified prenylated proteins and their interactions with AD network proteins
Finally, to gain additional insight into the functions of enriched prenylated proteins in the brains of APP/PS1 versus WT mice, functional enrichment analysis was performed using the complete list of all enriched proteins (36 total) including those that were found to be enriched only once, twice or in all three experiments (Fig. 5A). GO term enrichment analysis indicated endosomal transport (38%), cortical cytoskeleton organization (33%), and peptidyl-cysteine methylation (15%) as the top three biological processes, and synaptic vesicle membrane (47%) as the most enriched cellular component term (Fig. 5A). As expected, molecular function terms that are associated with GTPase activity were significantly enriched as well as Ras signaling (62%) in KEGG pathways (Fig. 5A). To investigate how these enriched prenylated proteins may be involved in AD pathogenesis, a protein-protein interaction network of these proteins and known AD network proteins46,47, was constructed (Fig. 5B). A total of 19 out of 36 prenylated proteins enriched in the brains of APP/PS1 compared to WT mice directly or indirectly interact with AD network proteins including amyloid precursor protein (APP) and microtubule-associated protein tau (MAPT). To confirm that the enriched prenylated proteins in APP/PS1 mice were associated with AD pathology, 36 grouped proteins were randomly chosen from a previously published list of prenylated proteins as a control set, and the same analyses were performed (SI Fig. 6). When these proteins were mapped with AD network proteins, only 6 out of 36 grouped proteins had known interactions with AD network proteins, suggesting that the list of identified enriched prenylated proteins in APP/PS1 are likely associated with AD pathology-related changes. The roles of AD network proteins interacting with these prenylation substrates are summarized in SI Table 3.4,12,23,48–75
Figure 5. Gene Ontology (GO) term, KEGG pathway enrichment analyses and protein-protein interaction network of identified prenylated proteins and known AD network proteins.

(A) Top enriched GO terms and KEGG pathways among prenylated proteins enriched in APP/PS1 mice. (B) Protein-protein interaction network showing direct/indirect interactions between AD network proteins and enriched prenylated proteins in APP/PS1 mice. A total of 19 prenylated proteins have known interactions with proteins involved in AD pathogenesis including amyloid precursor protein (App) and microtubule-associated protein tau (Mapt).
Despite the functional importance of protein prenylation in biological systems, experiments that monitor changes in the levels of multiple prenylated proteins, simultaneously, in whole animals have not been reported to date. In this study, the profiling of the brain prenylome in live mice was tested using a synthetic alkyne-modified isoprenoid analogue, C15AlkOPP. Recently, the same analogue was employed to characterize the prenylome in neuronal and glial cell lines as well as primary astrocytes,36 demonstrating its utility as a reporter for prenylation in multiple brain cell types. Due to the limited brain penetration of the analogue when administered via IP injection, a stereotaxic brain injection strategy was used to bypass the BBB. Although direct intracerebral injection would be preferable to introduce the analogue into the brain, this route is not suitable for a large injection volume or for global brain delivery. To minimize injection-associated damage while maximizing the delivery of the probe to different brain regions, the lateral ventricle was selected as the site of injection. Because of anatomical interconnectivity of the brain ventricular system, a single side ICV injection/infusion of C15AlkOPP was expected to result in metabolic labeling of both ipsilateral and contralateral sides of the brain. However, even with prolonged infusion (~2 weeks), labeling was mostly restricted to the brain regions ipsilateral to the site of injection/infusion and further limited to the brain regions that are within ~2 mm from the infusion site. In situ visualization of the labeling obtained with this probe indicated that a large fraction of the injected probe remained in the extracellular space in the brain parenchyma. Nevertheless, sufficient analogue incorporation was obtained using the ICV injection strategy to analyze the brain prenylome.
Consistent with previous findings,36,39,40 statin treatment augmented isoprenoid analogue incorporation. Metabolic labeling in the brain with C15AlkOPP resulted in the identification of 17 prenylated proteins in the absence of statin. Upon cotreatment with simvastatin, a total of 37 prenylated proteins were enriched including 8 farnesylated proteins, 9 GGTase I substrates and 20 GGTase II substrates. While the enhanced probe incorporation in the presence of the statin expanded the number of prenylated proteins that could be identified, we elected to perform subsequent labeling experiments with APP/PS1 AD model mice in the absence of statin reasoning that the presence of a statin could perturb cell physiology and complicate the interpretation of any differences observed between APP/PS1 and WT mice. Notably, in vitro labeling with C15AlkOPP was employed recently to probe the mouse brain prenylome in a related study. In contrast to the experiments performed here where analogue incorporation occurred in vivo, the in vitro labeling study used brain lysate obtained from mice engineered with neuron-specific knockouts of either FTase or GGTase,76. In this latter type of experiment, C15AlkOPP labeling was obtained by incubating brain lysate with C15AlkOPP and exogenous FTase or GGTase I followed by biotinylation, enrichment and proteomic analysis. Using that in vitro labeling approach, 13 farnesylated proteins and 7 GGTase I substrates were identified,76 It is interesting to note that only one of the proteins found enriched in this study were found enriched across all three APP/PS1 pairs (Rap1b;1a), and one (Rhoa), was found enriched in at least 2 pairs,76. Those differences probably reflect the different conditions those experiments were performed under. While the in vitro labeling strategy detects the unprenylated forms of proteins resulting from the genetic deletion of FTase or GGTase I in neurons the in vivo metabolic labeling detects prenylated proteins naturally occurring in the brain. Further, as the half-lives of prenylated proteins can be different from their unprenylated counterparts, these differences are not surprising and serve to highlight the utility of the in vivo approach described here.
Application of the ICV injection/infusion strategy detailed here comparing three pairs of APP/PS1 and WT mice yielded a total of 36 prenylated proteins enriched in the APP/PS1 mice across all three pairs. Of those 15 were seen in all three paired experiments with another 9 observed in at least two pairs. No prenylated proteins were consistently detected at higher levels in the WT mice compared with the APP/PS1 mice. It is also critical to note here that there was not simply a uniform increase in the levels of all prenylated proteins in the APP/PS1 mice, suggesting that the results obtained here cannot be solely attributable to higher probe uptake in the disease model. Taken together, those results suggest that the levels of at least some prenylated proteins are elevated in AD. When comparing the APP/PS1 results to those of the initial prenylome profiling of WT mice it should be noted that four of the 15 commonly enriched proteins, Rab35, Rab3a, Cnp, and Ykt6 were found to have greater fold changes in the APP/PS1 mice than even in the statin treated WT mouse (SI Fig. 7) showing that the increase in prenylation of these proteins seen in the AD model surpasses the expected upper limit of enrichment established by the SV and C15AlkOPP profiling experiment. These results are consistent with the higher levels of C15AlkOPP incorporation observed in the in-gel fluorescence experiments reported above.
Importantly, many of the 15 prenylated proteins enriched in APP/PS1 mice have been previously implicated in human AD as summarized in SI Table 1. For example, mRNA expression of Rab10 was significantly increased in the temporal cortex of AD patients, and knockdown of Rab10 was shown to reduce Aβ42 levels,28,77. Also, the stress hormone induced downregulation of Rab35 has been shown to cause tau hyperphosphorylation. Overexpression of Rab35 in the hippocampus of mice was sufficient to prevent stress-induced tau accumulation and downstream dendrite and spine loss,78. Recently a direct role of Rab35 in the regulation of BACE1 activation and APP cleavage was reported.27 In addition, a SILAC-based proteomics study found elevated levels of a myelin protein Cnp in APP-overexpressing rat neuroblastoma B103 cells,79. Notably, the known prenylated protein Uchl1,80,81, which was found to be enriched in all experiments here, had not been reported in previous prenylomic experiments,32,36. Intriguingly, membrane-associated farnesylated Uchl1 promotes α-synuclein neurotoxicity and is implicated in the pathogenesis of Parkinson’s disease (PD),80. The down regulation and extensive oxidation of Uchl1 is observed in AD as well as PD patients; in particular in sporadic AD the levels of soluble cytosolic Uchl1 are inversely proportional to neurofibrillary tangle amounts,82–84. Furthermore, a subset of protein hits including Rab18 was consistently enriched in the APP/PS1 mouse,85 Since Rab18 is a known regulator of neuronal migration and structure formation,86, its augmented prenylation in APP/PS1 mice may perturb neuronal homeostasis and contribute to AD.
Additional prenylated proteins enriched in APP/PS1 mice in two of the three replicate mouse pairs have also shown AD-associated changes in expression and signaling. Rhoa showed changes in expression level and its downstream signaling related to AD87, while genetic knockdown or pharmacological inhibition of the downstream effectors of Rhoa, ROCK1/2, have been shown to reduce Aβ levels as well as Aβ-induced cytoskeletal instability in neurons,24,87,88 Interestingly, when examining previously reported RNA-seq data comparing the mRNA levels in APP/PS1 mice to WT mice, no statistically relevant changes in the levels of the 15 proteins highlighted here was noted, Fig.6B,12. There were also no changes at the protein level for those same proteins when the APP/PS1 mouse proteome was profiled, Fig.6A,89. It is interesting to note that the enzymes responsible for FPP and GGPP biosynthesis as well as the prenyltransferase enzymes themselves all showed no statistically significant dysregulation between the APP/PS1 mice and WT mice in either the aforementioned transcriptomic or proteomic studies (SI Table 4). Similar analysis of the enzymes in the mevalonate pathway, the biosynthetic source of isoprenoids showed no change in expression or abundance between the APP/PS1 mice and the WT except for one enzyme, isopentenyl-diphosphate delta-isomerase, which produces the key intermediate dimethylallyl diphosphate (DMAPP) that was found to be at much higher relative abundance in the proteomic analysis of APP/PS1 mice (SI Table 4). Such an increase could increase the pool of isoprenoid diphosphates available for protein prenylation. Indeed, higher levels of FPP and GGPP have been found in brain tissue samples obtained from AD patients,19. Bioinformatic analysis indicates that many of the enriched prenylated proteins are involved in cytoskeletal organization (Rho GTPases) and vesicle-mediated transport (Rab GTPases) which are important biological processes for synaptic plasticity and cellular component trafficking/recycling. Protein-protein interaction network analysis between these proteins and AD-associated proteins revealed that approximately half of the enriched prenylated proteins in the brain APP/PS1 mice directly or indirectly interact with AD pathology-related proteins. Those results suggest that dysregulated upregulation of prenylation of these proteins is potentially involved in pathogenic processing of APP and tau.
Figure 6: Transcriptomic and native abundance comparisons showed that prenylation is upregulated in the APP/PS1 mice.

A) comparisons of the log2 fold change for the 15 common enriched proteins found in the prenylomic analysis of APP/PS1 mice (orange) compared to a total bottom-up proteomic analysis of APP/PS1 mice compared to WT from externally reported data from proteome exchange (green). B) comparisons of the log2 fold change for the 15 common enriched proteins found in the prenylomic analysis of APP/PS1 mice (orange) compared to previously reported RNAseq data comparing the expression of proteins in APP/PS1 mice to WT mice. Numerical values for plot are in SI Table 2.
Overall, this study demonstrates the utility of metabolic labeling in vivo with an alkyne-modified isoprenoid analogue for studying disease-associated changes in prenylated proteins in AD. With prolonged infusion of the isoprenoid analogue into the cerebral ventricle, brain tissue was successfully labeled with the analogue in live mice. Through a subsequent proteomic analysis, fifteen prenylated proteins were found to be consistently enriched in APP/PS1 AD mice. These results demonstrate increased protein prenylation in AD, a new and potentially highly significant observation. The elevated levels of specific prenylated proteins noted here could potentially be useful for the development of new diagnostic tools for AD detection and the proteins identified pursued as novel therapeutic targets. Finally, the overall strategy reported here involving prolonged infusion, metabolic labeling, enrichment and quantitative proteomic analysis should be applicable to the study of other posttranslational modifications in mouse models of brain disorders.
Supplementary Material
Acknowledgements
The authors acknowledge the Minnesota Supercomputing Institute (MSI) at the University of Minnesota for providing resources that contributed to the prenylomic research results reported within this paper (http://www.msi.umn.edu) and Y. Zhao and P. Villalta for the assistance with proteomic data collection in the Analytical Biochemistry Shared Resource of the Masonic Cancer Center, designated by the National Cancer Institute and supported by P30 CA077598
Funding
This work was supported in part by the National Institute of Health grants RF1AG056976 (LL and MDD), R35GM141853 (MDD), R21AG056025 (LL) and RF1AG058081 (LL). SA was supported by National Institute of Health Training Grants T32 GM132029 and T32 AG029796.
Footnotes
Supporting Information
Supporting information including Figures showing gel-based labeling, microscopy images, complete volcano plots, immunoblot analysis, bioinformatic analysis and ranking analysis along with Tables listing enriched proteins, fold change from RNAseq and proteomic analysis, profiling data and details of protein-protein interaction analysis. This material is available free of charge via the internet at http://pubs.acs.org.
Competing interests
None
Data Availability
The raw mass spectrometry files for the proteomics data have been deposited to the ProteomeXchange Consortium via the PRIDE partner repository with the dataset identifier PXD032350. The previously reported APP/PS1 RNAseq Data is deposited in Gene Expression Omnibus (accession# GSE 174314). The previously reported total proteome profiling of APP/PS1 mice was pulled from the ProteomeXchange Consortium via the PRIDE repository (accession# PXD015335).
References:
- (1).2021 Alzheimer’s Disease Facts and Figures. Alzheimer’s & Dementia 2021, 17 (3), 327–406. 10.1002/ALZ.12328. [DOI] [PubMed] [Google Scholar]
- (2).Glenner GG; Wong CW Alzheimer’s Disease: Initial Report of the Purification and Characterization of a Novel Cerebrovascular Amyloid Protein. Biochem. Biophys. Res. Commun 1984, 120 (3), 885–890. 10.1016/S0006-291X(84)80190-4. [DOI] [PubMed] [Google Scholar]
- (3).Bondi MW; Edmonds EC; Salmon DP Alzheimer’s Disease: Past, Present, and Future HHS Public Access. J Int Neuropsychol Soc 2017, 23 (9), 818–831. 10.1017/S135561771700100X. [DOI] [PMC free article] [PubMed] [Google Scholar]
- (4).Jeong A; Suazo KF; Wood WG; Distefano MD; Li L Isoprenoids and Protein Prenylation: Implications in the Pathogenesis and Therapeutic Intervention of Alzheimer’s Disease. Crit Rev Biochem Mol Biol. Taylor and Francis Ltd; May 4, 2018, pp 279–310. 10.1080/10409238.2018.1458070. [DOI] [PMC free article] [PubMed] [Google Scholar]
- (5).Palsuledesai CC; Distefano MD Protein Prenylation: Enzymes, Therapeutics, and Biotechnology Applications. ACS Chem. Biol American Chemical Society; January 16, 2015, pp 51–62. 10.1021/cb500791f. [DOI] [PMC free article] [PubMed] [Google Scholar]
- (6).Wang M; Casey PJ Protein Prenylation: Unique Fats Make Their Mark on Biology. Nat. Rev. Mol. Cell Biol 2016, 17 (2), 110–122. 10.1038/nrm.2015.11. [DOI] [PubMed] [Google Scholar]
- (7).Schafer WR; Rine J Protein Prenylation: Genes, Enzymes, Targets, and Functions. Annu Rev Genet 1992, 26 (1), 209–237. 10.1146/annurev.ge.26.120192.001233. [DOI] [PubMed] [Google Scholar]
- (8).Jiang H; Zhang X; Chen X; Aramsangtienchai P; Tong Z; Lin H Protein Lipidation: Occurrence, Mechanisms, Biological Functions, and Enabling Technologies. Chem. Rev 2018, 118 (3), 919–988. 10.1021/ACS.CHEMREV.6B00750/ASSET/IMAGES/ACS.CHEMREV.6B00750.SOCIAL.JPEG_V03. [DOI] [PMC free article] [PubMed] [Google Scholar]
- (9).Tavana JP; Rosene M; Jensen NO; Ridge PG; Kauwe JS; Karch CM RAB10: An Alzheimer’s Disease Resilience Locus and Potential Drug Target. Clin Interv Aging. 2019, 14, 73–79. 10.2147/CIA.S159148. [DOI] [PMC free article] [PubMed] [Google Scholar]
- (10).Hottman DA; Li L Protein Prenylation and Synaptic Plasticity: Implications for Alzheimer’s Disease. Mol. Neurobiol Humana Press Inc. October 2, 2014, pp 177–185. 10.1007/s12035-013-8627-z. [DOI] [PMC free article] [PubMed] [Google Scholar]
- (11).Li W; Cui Y; Kushner SA; Brown RAM; Jentsch JD; Frankland PW; Cannon TD; Silva AJ The HMG-CoA Reductase Inhibitor Lovastatin Reverses the Learning and Attention Deficits in a Mouse Model of Neurofibromatosis Type 1. Curr. Biol 2005, 15 (21), 1961–1967. 10.1016/j.cub.2005.09.043. [DOI] [PubMed] [Google Scholar]
- (12).Jeong A; Cheng S; Zhong R; Bennett DA; Bergö MO; Li L Protein Farnesylation Is Upregulated in Alzheimer’s Human Brains and Neuron-Specific Suppression of Farnesyltransferase Mitigates Pathogenic Processes in Alzheimer’s Model Mice. Acta Neuropathol. Commun 2021, 9 (1), 1–24. 10.1186/S40478-021-01231-5/FIGURES/11. [DOI] [PMC free article] [PubMed] [Google Scholar]
- (13).Zhang FL; Casey PJ Protein Prenylation: Molecular Mechanisms and Functional Consequences. Annu. Rev. Biochem 1996, 65 (1), 241–269. 10.1146/annurev.bi.65.070196.001325. [DOI] [PubMed] [Google Scholar]
- (14).Casey PJ Biochemistry of Protein Prenylation. J. Lipid Res 1992, 33 (12), 1731–1740. 10.1016/S0022-2275(20)41331-8. [DOI] [PubMed] [Google Scholar]
- (15).Anant JS; Desnoyers L; Machius M; Demeler B; Hansen JC; Westover KD; Deisenhofer J; Seabra MC Mechanism of Rab Geranylgeranylation: Formation of the Catalytic Ternary Complex†. Biochem 1998, 37 (36), 12559–12568. 10.1021/BI980881A. [DOI] [PubMed] [Google Scholar]
- (16).Wolozin B; Kellman W; Ruosseau P; Celesia GG; Siegel G Decreased Prevalence of Alzheimer Disease Associated with 3-Hydroxy-3-Methyglutaryl Coenzyme A Reductase Inhibitors. Arch. Neurol 2000, 57 (10), 1439–1443. 10.1001/archneur.57.10.1439. [DOI] [PubMed] [Google Scholar]
- (17).M Haag MD; Hofman A; Koudstaal PJ; C Stricker BH; B Breteler MM; M B Breteler PM Statins Are Associated with a Reduced Risk of Alzheimer Disease Regardless of Lipophilicity. The Rotterdam Study. J Neurol Neurosurg Psychiatry 2008, 80 (1), 13–17. 10.1136/jnnp.2008.150433. [DOI] [PubMed] [Google Scholar]
- (18).Mans RA; McMahon LL; Li L Simvastatin-Mediated Enhancement of Long-Term Potentiation Is Driven by Farnesyl-Pyrophosphate Depletion and Inhibition of Farnesylation. Neuroscience 2012, 202, 1–9. 10.1016/j.neuroscience.2011.12.007. [DOI] [PMC free article] [PubMed] [Google Scholar]
- (19).Eckert GP; Hooff GP; Strandjord DM; Igbavboa U; Volmer DA; Müller WE; Wood WG Regulation of the Brain Isoprenoids Farnesyl- and Geranylgeranylpyrophosphate Is Altered in Male Alzheimer Patients. Neurobiol. Dis 2009, 35 (2), 251–257. 10.1016/J.NBD.2009.05.005. [DOI] [PMC free article] [PubMed] [Google Scholar]
- (20).Cheng S; Cao D; Hottman DA; Yuan LL; Bergo MO; Li L Farnesyltransferase Haplodeficiency Reduces Neuropathology and Rescues Cognitive Function in a Mouse Model of Alzheimer Disease. Journal of Biological Chemistry 2013, 288 (50), 35952–35960. 10.1074/jbc.M113.503904. [DOI] [PMC free article] [PubMed] [Google Scholar]
- (21).Hottman D; Cheng S; Gram A; LeBlanc K; Yuan L-L; Li L Systemic or Forebrain Neuron-Specific Deficiency of Geranylgeranyltransferase-1 Impairs Synaptic Plasticity and Reduces Dendritic Spine Density. Neuroscience 2018, 373, 207–217. 10.1016/j.neuroscience.2018.01.026. [DOI] [PMC free article] [PubMed] [Google Scholar]
- (22).Cuddy LK; Alia AO; Salvo MA; Chandra S; Grammatopoulos TN; Justman CJ; Lansbury PT; Mazzulli JR; Vassar R Farnesyltransferase Inhibitor LNK-754 Attenuates Axonal Dystrophy and Reduces Amyloid Pathology in Mice. Molecular Neurodegeneration 2022 17:1 2022, 17 (1), 1–23. 10.1186/S13024-022-00561-9. [DOI] [PMC free article] [PubMed] [Google Scholar]
- (23).Costa RM; Federov NB; Kogan JH; Murphy GG; Stern J; Ohno M; Kucherlapati R; Jacks T; Silva AJ Mechanism for the Learning Deficits in a Mouse Model of Neurofibromatosis Type 1. Nat. 2002, 415 (6871), 526–530. 10.1038/nature711. [DOI] [PubMed] [Google Scholar]
- (24).Henderson BW; Gentry EG; Rush T; Troncoso JC; Thambisetty M; Montine TJ; Herskowitz JH Rho-Associated Protein Kinase 1 (ROCK1) Is Increased in Alzheimer’s Disease and ROCK1 Depletion Reduces Amyloid-β Levels in Brain. J. Neurochem 2016, 525–531. 10.1111/JNC.13688/FORMAT/PDF. [DOI] [PMC free article] [PubMed] [Google Scholar]
- (25).Mendoza-Naranjo A; Gonzalez-Billault C; Maccioni RB Aβ1–42 Stimulates Actin Polymerization in Hippocampal Neurons through Rac1 and Cdc42 Rho GTPases. J. Cell Sci 2007, 120 (2), 279–288. 10.1242/JCS.03323. [DOI] [PubMed] [Google Scholar]
- (26).Ginsberg SD; Mufson EJ; Counts SE; Wuu J; Alldred MJ; Nixon RA; Che S Regional Selectivity of Rab5 and Rab7 Protein up Regulation in Mild Cognitive Impairment and Alzheimer’s Disease. J. Alzheimer’s Dis 2010, 22 (2), 631. 10.3233/JAD-2010-101080. [DOI] [PMC free article] [PubMed] [Google Scholar]
- (27).Zhuravleva V; Vaz-Silva J; Zhu M; Gomes P; Silva JM; Sousa N; Sotiropoulos I; Waites CL; Waites C Rab35 and Glucocorticoids Regulate APP and BACE1 Trafficking to Modulate Aβ Production. Cell Death Dis 2021, 12. 10.1101/2021.05.10.443354. [DOI] [PMC free article] [PubMed] [Google Scholar]
- (28).Tavana JP; Rosene M; Jensen NO; Ridge PG; Kauwe JSK; Karch CM RAB10: An Alzheimer’s Disease Resilience Locus and Potential Drug Target. Clin Interv Aging 2019, 14, 73. 10.2147/CIA.S159148. [DOI] [PMC free article] [PubMed] [Google Scholar]
- (29).Palsuledesai CC; Ochocki JD; Kuhns MM; Wang Y-C; Warmka JK; Chernick DS; Wattenberg E. v; Li L; Arriaga EA; Distefano MD Metabolic Labeling with an Alkyne-Modified Isoprenoid Analog Facilitates Imaging and Quantification of the Prenylome in Cells. ACS Chem. Biol 2016, 11 (10), 2820–2828. 10.1021/acschembio.6b00421. [DOI] [PMC free article] [PubMed] [Google Scholar]
- (30).Suazo KF; Park K-Y; Distefano MD A Not-So-Ancient Grease History: Click Chemistry and Protein Lipid Modifications. Chem. Rev 2021, 121 (12), 7178–7248. 10.1021/ACS.CHEMREV.0C01108. [DOI] [PMC free article] [PubMed] [Google Scholar]
- (31).Hosokawa A; Wollack JW; Zhang Z; Chen L; Barany G; Distefano MD Evaluation of an Alkyne-Containing Analogue of Farnesyl Diphosphate as a Dual Substrate for Protein-Prenyltransferases. Int J Pept Res Ther 2007, 13 (1–2), 345–354. 10.1007/s10989-007-9090-3. [DOI] [Google Scholar]
- (32).Storck EM; Morales-Sanfrutos J; Serwa RA; Panyain N; Lanyon-Hogg T; Tolmachova T; Ventimiglia LN; Martin-Serrano J; Seabra MC; Wojciak-Stothard B; Tate EW Dual Chemical Probes Enable Quantitative System-Wide Analysis of Protein Prenylation and Prenylation Dynamics. Nat. Chem 2019, 11 (6), 552–561. 10.1038/s41557-019-0237-6. [DOI] [PMC free article] [PubMed] [Google Scholar]
- (33).Suazo KF; Schaber C; Palsuledesai CC; Odom John AR; Distefano MD Global Proteomic Analysis of Prenylated Proteins in Plasmodium Falciparum Using an Alkyne-Modified Isoprenoid Analogue. Sci. Rep 2016, 6. 10.1038/srep38615. [DOI] [PMC free article] [PubMed] [Google Scholar]
- (34).Kho Y; Kim SC; Jiang C; Barma D; Kwon SW; Cheng J; Jaunbergs J; Weinbaum C; Tamanoi F; Falck J; Zhao Y A Tagging-via-Substrate Technology for Detection and Proteomics of Farnesylated Proteins. PNAS 2004, 101 (34), 12479–12484. 10.1073/PNAS.0403413101/SUPPL_FILE/03413FIG8.PDF. [DOI] [PMC free article] [PubMed] [Google Scholar]
- (35).Charron G; Li MMH; MacDonald MR; Hang HC Prenylome Profiling Reveals S-Farnesylation Is Crucial for Membrane Targeting and Antiviral Activity of ZAP Long-Isoform. PNAS 2013, 110 (27), 11085–11090. 10.1073/PNAS.1302564110/SUPPL_FILE/PNAS.201302564SI.PDF. [DOI] [PMC free article] [PubMed] [Google Scholar]
- (36).Suazo KF; Jeong A; Ahmadi M; Brown C; Qu W; Li L; Distefano MD Metabolic Labeling with an Alkyne Probe Reveals Similarities and Differences in the Prenylomes of Several Brain-Derived Cell Lines and Primary Cells. Sci. Rep 2021, 11 (1), 1–17. 10.1038/s41598-021-83666-3. [DOI] [PMC free article] [PubMed] [Google Scholar]
- (37).Dube DH; Prescher JA; Quang CM; Bertozzi CR Probing Mucin-Type O-Linked Glycosylation in Living Animals. PNAS 2006, 103 (13), 4819–4824. 10.1073/PNAS.0506855103. [DOI] [PMC free article] [PubMed] [Google Scholar]
- (38).Xie R; Dong L; Du Y; Zhu Y; Hua R; Zhang C; Chen X In Vivo Metabolic Labeling of Sialoglycans in the Mouse Brain by Using a Liposome-Assisted Bioorthogonal Reporter Strategy. PNAS 2016, 113 (19), 5173–5178. 10.1073/PNAS.1516524113. [DOI] [PMC free article] [PubMed] [Google Scholar]
- (39).Suazo KF; Hurben AK; Liu K; Xu F; Thao P; Sudheer C; Li L; Distefano MD Metabolic Labeling of Prenylated Proteins Using Alkyne-Modified Isoprenoid Analogues. Curr. protoc. chem. biol 2018, 10 (3), e46. 10.1002/cpch.46. [DOI] [PMC free article] [PubMed] [Google Scholar]
- (40).Ahmadi M; Suazo KF; Distefano MD Optimization of Metabolic Labeling with Alkyne-Containing Isoprenoid Probes. In Methods mol. biol; Humana Press Inc., 2019; Vol. 2009, pp 35–43. 10.1007/978-1-4939-9532-5_3. [DOI] [PMC free article] [PubMed] [Google Scholar]
- (41).Jankowsky JL; Slunt HH; Ratovitski T; Jenkins NA; Copeland NG; Borchelt DR Co-Expression of Multiple Transgenes in Mouse CNS: A Comparison of Strategies. Biomol. Eng 2001, 17 (6), 157–165. 10.1016/S1389-0344(01)00067-3. [DOI] [PubMed] [Google Scholar]
- (42).Suazo KF; Auger SA; Schey GL; Ling L; Distefano MD Thinking outside the CaaX-box: an unusual reversible prenylation on ALDH9A1. bioRxiv 2022.08.29.505770; doi: 10.1101/2022.08.29.505770 [DOI] [PMC free article] [PubMed] [Google Scholar]
- (43).Xiao Y; Hsiao TH; Suresh U; Chen HIH; Wu X; Wolf SE; Chen Y A Novel Significance Score for Gene Selection and Ranking. Bioinformatics 2014, 30 (6), 801–807. 10.1093/BIOINFORMATICS/BTR671. [DOI] [PMC free article] [PubMed] [Google Scholar]
- (44).Yang C; Mayau V; Godeau F; Goud B Characterization of the Unprocessed and Processed Forms of Rab6 Expressed in Baculovirus/Insect Cell Systems. Biochem Biophys Res Commun 1992, 182 (3), 1499–1505. 10.1016/0006-291X(92)91903-4. [DOI] [PubMed] [Google Scholar]
- (45).Aebersold R; Burlingame AL; Bradshaw RA Western Blots versus Selected Reaction Monitoring Assays: Time to Turn the Tables? Molecular & Cellular Proteomics 2013, 12 (9), 2381–2382. 10.1074/MCP.E113.031658. [DOI] [PMC free article] [PubMed] [Google Scholar]
- (46).Breuza L; Arighi CN; Argoud-Puy G; Casals-Casas C; Estreicher A; Famiglietti ML; Georghiou G; Gos A; Gruaz-Gumowski N; Hinz U; Hyka-Nouspikel N; Kramarz B; Lovering RC; Lussi Y; Magrane M; Masson P; Perfetto L; Poux S; Rodriguez-Lopez M; Stoeckert C; Sundaram S; Wang LS; Wu E; Orchard S A Coordinated Approach by Public Domain Bioinformatics Resources to Aid the Fight Against Alzheimer’s Disease Through Expert Curation of Key Protein Targets. J. Alzheimer’s Dis 2020, 77 (1), 257–273. 10.3233/JAD-200206. [DOI] [PMC free article] [PubMed] [Google Scholar]
- (47).Chatr-Aryamontri A; Breitkreutz BJ; Heinicke S; Boucher L; Winter A; Stark C; Nixon J; Ramage L; Kolas N; O’Donnell L; Reguly T; Breitkreutz A; Sellam A; Chen D; Chang C; Rust J; Livstone M; Oughtred R; Dolinski K; Tyers M The BioGRID Interaction Database: 2013 Update. Nucleic Acids Res. 2013, 41 (D1), D816–D823. 10.1093/NAR/GKS1158. [DOI] [PMC free article] [PubMed] [Google Scholar]
- (48).Jiang S; Li Y; Zhang X; Bu G; Xu H; Zhang YW Trafficking Regulation of Proteins in Alzheimer’s Disease. Mol Neurodegener 2014, 9 (1). 10.1186/1750-1326-9-6. [DOI] [PMC free article] [PubMed] [Google Scholar]
- (49).King GD; Perez RG; Steinhilb ML; Gaut JR; Turner RS X11alpha Modulates Secretory and Endocytic Trafficking and Metabolism of Amyloid Precursor Protein: Mutational Analysis of the YENPTY Sequence. Neuroscience 2003, 120 (1), 143–154. 10.1016/S0306-4522(03)00284-7. [DOI] [PubMed] [Google Scholar]
- (50).Pourhaghighi R; Ash PEA; Phanse S; Goebels F; Hu LZM; Chen S; Zhang Y; Wierbowski SD; Boudeau S; Moutaoufik MT; Malty RH; Malolepsza E; Tsafou K; Nathan A; Cromar G; Guo H; al Abdullatif A; Apicco DJ; Becker LA; Gitler AD; Pulst SM; Youssef A; Hekman R; Havugimana PC; White CA; Blum BC; Ratti A; Bryant CD; Parkinson J; Lage K; Babu M; Yu H; Bader GD; Wolozin B; Emili A BraInMap Elucidates the Macromolecular Connectivity Landscape of Mammalian Brain. Cell Syst. 2020, 10 (4), 333–350.e14. 10.1016/J.CELS.2020.03.003. [DOI] [PMC free article] [PubMed] [Google Scholar]
- (51).Eggert S; Paliga K; Soba P; Evin G; Masters CL; Weidemann A; Beyreuther K The Proteolytic Processing of the Amyloid Precursor Protein Gene Family Members APLP-1 and APLP-2 Involves Alpha-, Beta-, Gamma-, and Epsilon-like Cleavages: Modulation of APLP-1 Processing by n-Glycosylation. J Biol Chem. 2004, 279 (18), 18146–18156. 10.1074/JBC.M311601200. [DOI] [PubMed] [Google Scholar]
- (52).Minogue AM; Stubbs AK; Frigerio CS; Boland B; Fadeeva J. v.; Tang J; Selkoe DJ; Walsh DM γ-Secretase Processing of APLP1 Leads to the Production of a P3-like Peptide That Does Not Aggregate and Is Not Toxic to Neurons. Brain Res. 2009, 1262, 89–99. 10.1016/J.BRAINRES.2009.01.008. [DOI] [PubMed] [Google Scholar]
- (53).Jacobsen KT; Iverfeldt K Amyloid Precursor Protein and Its Homologues: A Family of Proteolysis-Dependent Receptors. Cell. Mol. Life Sci 2009, 66 (14), 2299–2318. 10.1007/S00018-009-0020-8. [DOI] [PMC free article] [PubMed] [Google Scholar]
- (54).del Prete D; Rice RC; Rajadhyaksha AM; D’Adamio L Amyloid Precursor Protein (APP) May Act as a Substrate and a Recognition Unit for CRL4CRBN and Stub1 E3 Ligases Facilitating Ubiquitination of Proteins Involved in Presynaptic Functions and Neurodegeneration. J. Biol. Chem 2016, 291 (33), 17209–17227. 10.1074/JBC.M116.733626. [DOI] [PMC free article] [PubMed] [Google Scholar]
- (55).Suh J; Romano DM; Nitschke L; Herrick SP; DiMarzio BA; Dzhala V; Bae JS; Oram MK; Zheng Y; Hooli B; Mullin K; Gennarino VA; Wasco W; Schmahmann JD; Albers MW; Zoghbi HY; Tanzi RE Loss of Ataxin-1 Potentiates Alzheimer’s Pathogenesis by Elevating Cerebral BACE1 Transcription. Cell 2019, 178 (5), 1159–1175.e17. 10.1016/J.CELL.2019.07.043. [DOI] [PMC free article] [PubMed] [Google Scholar]
- (56).Zhang S; Williamson NA; Bogoyevitch MA Complementary Proteomics Strategies Capture an Ataxin-1 Interactome in Neuro-2a Cells. Sci. Data 2018, 5 (1), 1–6. 10.1038/sdata.2018.262. [DOI] [PMC free article] [PubMed] [Google Scholar]
- (57).Bustos FJ; Ampuero E; Jury N; Aguilar R; Falahi F; Toledo J; Ahumada J; Lata J; Cubillos P; Henríquez B; Guerra M. v.; Stehberg J; Neve RL; Inestrosa NC; Wyneken U; Fuenzalida M; Härtel S; Sena-Esteves M; Varela-Nallar L; Rots MG; Montecino M; van Zundert B Epigenetic Editing of the Dlg4/PSD95 Gene Improves Cognition in Aged and Alzheimer’s Disease Mice. Brain 2017, 140 (12), 3252–3268. 10.1093/BRAIN/AWX272. [DOI] [PMC free article] [PubMed] [Google Scholar]
- (58).Li J; Zhang W; Yang H; Howrigan DP; Wilkinson B; Souaiaia T; Evgrafov O. v.; Genovese G; Clementel VA; Tudor JC; Abel T; Knowles JA; Neale BM; Wang K; Sun F; Coba MP Spatiotemporal Profile of Postsynaptic Interactomes Integrates Components of Complex Brain Disorders. Nat. Neurosci 2017, 20 (8), 1150–1161. 10.1038/nn.4594. [DOI] [PMC free article] [PubMed] [Google Scholar]
- (59).Li J; Wilkinson B; Clementel VA; Hou J; O’Dell TJ; Coba MP Long-Term Potentiation Modulates Synaptic Phosphorylation Networks and Reshapes the Structure of the Postsynaptic Interactome. Sci. Signal 2016, 9 (440). 10.1126/SCISIGNAL.AAF6716/SUPPL_FILE/9_RS8_TABLES_S1_TO_S7.ZIP. [DOI] [PubMed] [Google Scholar]
- (60).Wahle T; Thal DR; Sastre M; Rentmeister A; Bogdanovic N; Famulok M; Heneka MT; Walter J GGA1 Is Expressed in the Human Brain and Affects the Generation of Amyloid Beta-Peptide. J Neurosci. 2006, 26 (49), 12838–12846. 10.1523/JNEUROSCI.1982-06.2006. [DOI] [PMC free article] [PubMed] [Google Scholar]
- (61).Go CD; Knight JDR; Rajasekharan A; Rathod B; Hesketh GG; Abe KT; Youn JY; Samavarchi-Tehrani P; Zhang H; Zhu LY; Popiel E; Lambert JP; Coyaud É; Cheung SWT; Rajendran D; Wong CJ; Antonicka H; Pelletier L; Palazzo AF; Shoubridge EA; Raught B; Gingras AC A Proximity-Dependent Biotinylation Map of a Human Cell. Nat. 2021, 595 (7865), 120–124. 10.1038/s41586-021-03592-2. [DOI] [PubMed] [Google Scholar]
- (62).Mackenzie KD; Lumsden AL; Guo F; Duffield MD; Chataway T; Lim Y; Zhou XF; Keating DJ Huntingtin-Associated Protein-1 Is a Synapsin I-Binding Protein Regulating Synaptic Vesicle Exocytosis and Synapsin I Trafficking. J Neurochem 2016, 138 (5), 710–721. 10.1111/JNC.13703. [DOI] [PubMed] [Google Scholar]
- (63).Singhrao SK; Thomas P; Wood JD; MacMillan JC; Neal JW; Harper PS; Jones AL Huntingtin Protein Colocalizes with Lesions of Neurodegenerative Diseases: An Investigation in Huntington’s, Alzheimer’s, and Pick’s Diseases. Exp Neurol. 1998, 150 (2), 213–222. 10.1006/EXNR.1998.6778. [DOI] [PubMed] [Google Scholar]
- (64).Kaltenbach LS; Romero E; Becklin RR; Chettier R; Bell R; Phansalkar A; Strand A; Torcassi C; Savage J; Hurlburt A; Cha GH; Ukani L; lou Chepanoske C; Zhen Y; Sahasrabudhe S; Olson J; Kurschner C; Ellerby LM; Peltier JM; Botas J; Hughes RE Huntingtin Interacting Proteins Are Genetic Modifiers of Neurodegeneration. PLoS Genet. 2007, 3 (5), e82. 10.1371/JOURNAL.PGEN.0030082. [DOI] [PMC free article] [PubMed] [Google Scholar]
- (65).Henderson MX; Sengupta M; Trojanowski JQ; Lee VMY Alzheimer’s Disease Tau Is a Prominent Pathology in LRRK2 Parkinson’s Disease. Acta Neuropathol Commun. 2019, 7 (1). 10.1186/S40478-019-0836-X. [DOI] [PMC free article] [PubMed] [Google Scholar]
- (66).Haebig K; Gloeckner CJ; Miralles MG; Gillardon F; Schulte C; Riess O; Ueffing M; Biskup S; Bonin M ARHGEF7 (BETA-PIX) Acts as Guanine Nucleotide Exchange Factor for Leucine-Rich Repeat Kinase 2. PLoS One 2010, 5 (10), e13762. 10.1371/JOURNAL.PONE.0013762. [DOI] [PMC free article] [PubMed] [Google Scholar]
- (67).Shin N; Jeong H; Kwon J; Heo HY; Kwon JJ; Yun HJ; Kim CH; Han BS; Tong Y; Shen J; Hatano T; Hattori N; Kim KS; Chang S; Seol W LRRK2 Regulates Synaptic Vesicle Endocytosis. Exp. Cell Res 2008, 314 (10), 2055–2065. 10.1016/J.YEXCR.2008.02.015. [DOI] [PubMed] [Google Scholar]
- (68).Maziuk BF; Apicco DJ; Cruz AL; Jiang L; Ash PEA; da Rocha EL; Zhang C; Yu WH; Leszyk J; Abisambra JF; Li H; Wolozin B RNA Binding Proteins Co-Localize with Small Tau Inclusions in Tauopathy. Acta Neuropathol. Commun 2018, 6 (1), 71. 10.1186/S40478-018-0574-5/TABLES/1. [DOI] [PMC free article] [PubMed] [Google Scholar]
- (69).Lautrup S; Sinclair DA; Mattson MP; Fang EF NAD + in Brain Aging and Neurodegenerative Disorders. Cell Metab. 2019, 30 (4), 630–655. 10.1016/J.CMET.2019.09.001. [DOI] [PMC free article] [PubMed] [Google Scholar]
- (70).Lewczuk P; Ermann N; Andreasson U; Schultheis C; Podhorna J; Spitzer P; Maler JM; Kornhuber J; Blennow K; Zetterberg H Plasma Neurofilament Light as a Potential Biomarker of Neurodegeneration in Alzheimer’s Disease. Alz Res Therapy 2018, 10 (1), 1–10. 10.1186/S13195-018-0404-9/FIGURES/6. [DOI] [PMC free article] [PubMed] [Google Scholar]
- (71).Garbern JY; Yool DA; Moore GJ; Wilds IB; Faulk MW; Klugmann M; Nave KA; Sistermans EA; van der Knaap MS; Bird TD; Shy ME; Kamholz JA; Griffiths IR Patients Lacking the Major CNS Myelin Protein, Proteolipid Protein 1, Develop Length dependent Axonal Degeneration in the Absence of Demyelination and Inflammation. Brain 2002, 125 (3), 551–561. 10.1093/BRAIN/AWF043. [DOI] [PubMed] [Google Scholar]
- (72).Tsai SYA; Pokrass MJ; Klauer NR; Nohara H; Su TP Sigma-1 Receptor Regulates Tau Phosphorylation and Axon Extension by Shaping P35 Turnover via Myristic Acid. PNAS 2015, 112 (21), 6742–6747. 10.1073/PNAS.1422001112. [DOI] [PMC free article] [PubMed] [Google Scholar]
- (73).Paul S; Dansithong W; Figueroa KP; Scoles DR; Pulst SM Staufen1 Links RNA Stress Granules and Autophagy in a Model of Neurodegeneration. Nat Commun. 2018, 9 (1). 10.1038/S41467-018-06041-3. [DOI] [PMC free article] [PubMed] [Google Scholar]
- (74).Fassio A; Patry L; Congia S; Onofri F; Piton A; Gauthier J; Pozzi D; Messa M; Defranchi E; Fadda M; Corradi A; Baldelli P; Lapointe L; St-Onge J; Meloche C; Mottron L; Valtorta F; Nguyen DK; Rouleau GA; Benfenati F; Cossette P SYN1 Loss-of-Function Mutations in Autism and Partial Epilepsy Cause Impaired Synaptic Function. Hum. Mol. Gen 2011, 20 (12), 2297–2307. 10.1093/HMG/DDR122. [DOI] [PubMed] [Google Scholar]
- (75).Basso M; Berlin J; Xia L; Sleiman SF; Ko B; Haskew-Layton R; Kim E; Antonyak MA; Cerione RA; Iismaa SE; Willis D; Cho S; Ratan RR Transglutaminase Inhibition Protects against Oxidative Stress-Induced Neuronal Death Downstream of Pathological ERK Activation. J Neurosci. 2012, 32 (19), 6561–6569. 10.1523/JNEUROSCI.3353-11.2012. [DOI] [PMC free article] [PubMed] [Google Scholar]
- (76).Qu W; Suazo KF; Liu W; Cheng S; Jeong A; Hottman D; Yuan LL; Distefano MD; Li L Neuronal Protein Farnesylation Regulates Hippocampal Synaptic Plasticity and Cognitive Function. Mol. Neurobiol 2021, 58 (3), 1128–1144. 10.1007/S12035-020-02169-W/FIGURES/6. [DOI] [PMC free article] [PubMed] [Google Scholar]
- (77).Ridge PG; Karch CM; Hsu S; Arano I; Teerlink CC; Ebbert MTW; Gonzalez Murcia JD; Farnham JM; Damato AR; Allen M; Wang X; Harari O; Fernandez VM; Guerreiro R; Bras J; Hardy J; Munger R; Norton M; Sassi C; Singleton A; Younkin SG; Dickson DW; Golde TE; Price ND; Ertekin-Taner N; Cruchaga C; Goate AM; Corcoran C; Tschanz JA; Cannon-Albright LA; Kauwe JSK Linkage, Whole Genome Sequence, and Biological Data Implicate Variants in RAB10 in Alzheimer’s Disease Resilience. Genome Med. 2017, 9 (1). 10.1186/S13073-017-0486-1. [DOI] [PMC free article] [PubMed] [Google Scholar]
- (78).Vaz-Silva J; Gomes P; Jin Q; Zhu M; Zhuravleva V; Quintremil S; Meira T; Silva J; Dioli C; Soares-Cunha C; Daskalakis NP; Sousa N; Sotiropoulos I; Waites CL Endolysosomal Degradation of Tau and Its Role in Glucocorticoid-Driven Hippocampal Malfunction. EMBO J 2018, 37 (20). 10.15252/EMBJ.201899084. [DOI] [PMC free article] [PubMed] [Google Scholar]
- (79).Chaput D; Kirouac LH; Bell-Temin H; Stevens SM; Padmanabhan J SILAC-Based Proteomic Analysis to Investigate the Impact of Amyloid Precursor Protein Expression in Neuronal-like B103 Cells. Electrophoresis 2012, 33 (24), 3728–3737. 10.1002/ELPS.201200251. [DOI] [PMC free article] [PubMed] [Google Scholar]
- (80).Liu Z; Meray RK; Grammatopoulos TN; Fredenburg RA; Cookson MR; Liu Y; Logan T; Lansbury PT Membrane-Associated Farnesylated UCH-L1 Promotes-Synuclein Neurotoxicity and Is a Therapeutic Target for Parkinson’s Disease. PNAS 2009, 106 (12), 4635–4640. [DOI] [PMC free article] [PubMed] [Google Scholar]
- (81).Bishop P; Rubin P; Thomson AR; Rocca D; Henley JM The Ubiquitin C-Terminal Hydrolase L1 (UCH-L1) C Terminus Plays a Key Role in Protein Stability, but Its Farnesylation Is Not Required for Membrane Association in Primary Neurons *. J. Biol. Chem 2014, 289 (52), 36140–36149. 10.1074/JBC.M114.557124. [DOI] [PMC free article] [PubMed] [Google Scholar]
- (82).Forero DA; Benítez B; Arboleda G; Yunis JJ; Pardo R; Arboleda H Analysis of Functional Polymorphisms in Three Synaptic Plasticity-Related Genes (BDNF, COMT AND UCHL1) in Alzheimer’s Disease in Colombia. Neurosci. Res 2006, 55 (3), 334–341. 10.1016/J.NEURES.2006.04.006. [DOI] [PubMed] [Google Scholar]
- (83).Choi J; Levey AI; Weintraub ST; Rees HD; Gearing M; Chin LS; Li L Oxidative Modifications and Down-Regulation of Ubiquitin Carboxyl-Terminal Hydrolase L1 Associated with Idiopathic Parkinson’s and Alzheimer’s Diseases. J. Biol. Chem 2004, 279 (13), 13256–13264. 10.1074/JBC.M314124200. [DOI] [PubMed] [Google Scholar]
- (84).Setsuie R; Wada K The Functions of UCH-L1 and Its Relation to Neurodegenerative Diseases. Neurochem. Int 2007, 51 (2–4), 105–111. 10.1016/J.NEUINT.2007.05.007. [DOI] [PubMed] [Google Scholar]
- (85).Zhang X; Huang TY; Yancey J; Luo H; Zhang Y-W Role of Rab GTPases in Alzheimer’s Disease. ACS Chem. Neurosci 2019, 10 (2), 828–838. 10.1021/acschemneuro.8b00387. [DOI] [PubMed] [Google Scholar]
- (86).Wu Q; Sun X; Yue W; Lu T; Ruan Y; Chen T; Zhang D RAB18, a Protein Associated with Warburg Micro Syndrome, Controls Neuronal Migration in the Developing Cerebral Cortex. Mol. Brain 2016, 9 (1), 1–12. 10.1186/S13041-016-0198-2/FIGURES/7. [DOI] [PMC free article] [PubMed] [Google Scholar]
- (87).Aguilar BJ; Zhu Y; Lu Q Rho GTPases as Therapeutic Targets in Alzheimer’s Disease. Alzheimers Res Ther 2017, 9 (1), 1–10. 10.1186/S13195-017-0320-4/TABLES/2. [DOI] [PMC free article] [PubMed] [Google Scholar]
- (88).Tsushima H; Emanuele M; Polenghi A; Esposito A; Vassalli M; Barberis A; Difato F; Chieregatti E HDAC6 and RhoA Are Novel Players in Abeta-Driven Disruption of Neuronal Polarity. Nat. Commun 2015, 6 (1), 1–14. 10.1038/ncomms8781. [DOI] [PubMed] [Google Scholar]
- (89).Fang P; Xie J; Sang S; Zhang L; Liu M; Yang L; Xu Y; Yan G; Yao J; Gao X; Qian W; Wang Z; Zhang Y; Yang P; Shen H Multilayered N-Glycoproteome Profiling Reveals Highly Heterogeneous and Dysregulated Protein N-Glycosylation Related to Alzheimer’s Disease. Anal. Chem 2020, 92 (1), 867–874. 10.1021/ACS.ANALCHEM.9B03555/SUPPL_FILE/AC9B03555_SI_006.XLSX. [DOI] [PubMed] [Google Scholar]
Associated Data
This section collects any data citations, data availability statements, or supplementary materials included in this article.
Supplementary Materials
Data Availability Statement
The raw mass spectrometry files for the proteomics data have been deposited to the ProteomeXchange Consortium via the PRIDE partner repository with the dataset identifier PXD032350. The previously reported APP/PS1 RNAseq Data is deposited in Gene Expression Omnibus (accession# GSE 174314). The previously reported total proteome profiling of APP/PS1 mice was pulled from the ProteomeXchange Consortium via the PRIDE repository (accession# PXD015335).