

SUMMARY
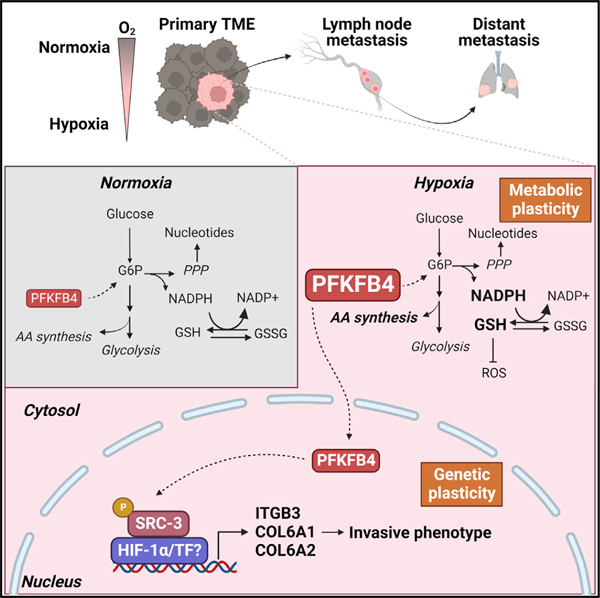
Cancer cells encounter a hostile tumor microenvironment (TME), and their adaptations to metabolic stresses determine metastatic competence. Here, we show that the metabolic enzyme 6-phosphofructo-2-kinase/fructose-2,6-biphosphatase-4 (PFKFB4) is induced in hypoxic tumors acquiring metabolic plasticity and invasive phenotype. In mouse models of breast cancer, genetic ablation of PFKFB4 significantly delays distant organ metastasis, reducing local lymph node invasion by suppressing expression of invasive gene signature including integrin β3. Photoacoustic imaging followed by metabolomics analyses of hypoxic tumors show that PFKFB4 drives metabolic flexibility, enabling rapid detoxification of reactive oxygen species favoring survival under selective pressure. Mechanistically, hypoxic induction triggers nuclear translocation of PFKFB4 accentuating non-canonical transcriptional activation of HIF-1α, and breast cancer patients with increased nuclear PFKFB4 in their tumors are found to be significantly associated with poor prognosis. Our findings imply that PFKFB4 induction is crucial for tumor cell adaptation in the hypoxic TME that determines metastatic competence.
Graphical Abstract
In brief
Dai et al. show a novel mechanism by which metabolic stresses in the primary tumors accentuate metastatic potential. The metabolic enzyme PFKFB4, induced in hypoxic breast tumors, promotes integrin-dependent metastatic potential and rewiring of cellular metabolism. Increased PFKFB4 expression prognosticates TNBC patients with poor outcome.
INTRODUCTION
Distant organ metastasis is largely incurable and a major contributor to the deaths of cancer patients. Metastasis formation is a continuous and complex process that needs to overcome several environmental barriers before tumor cells can successfully colonize in other organs.1,2 Rapid tumor growth and dysregulated tumor vasculature trigger the formation of hypoxia, a major context in the primary tumor microenvironment (TME), along with limited nutrient availability in the tumor core.3,4 Cancer cells need to gain certain metabolic features to survive and grow under a hypoxic and nutrient-stressed environment. Increasing evidence supports the notion that tumor cells that successfully adapt and mitigate TME stress factors acquire pro-metastatic features and metabolic plasticity that enable them to survive in later phases of metastasis.5,6 However, the underlying mechanisms that reprogram tumor-intrinsic cellular metabolism leading to an increased invasive phenotype in the TME remain elusive.
One of the most prominent metabolic adaptations in cancer cells is increased uptake of glucose and elevated glycolytic flux to maintain high demand for energy and continuous supply of metabolic intermediates as a carbon source for macromolecule synthesis. A glycolytic shunt enzyme PFKFB4 (6-phospho-fructo-2-kinase/fructose-2,6-biphosphatase 4) functions as a critical regulator of glucose catabolism by modulating the flow of glycolytic flux toward essential pathways.7 This unique bifunctional metabolic enzyme catalyzes the conversion of fructose-6-phosphate (F6P) to fructose-2,6-bisphosphate (F-2,6-BP), which functions as an allosteric activator of phosphofructokinase 1 (PFK1), thereby stimulating increased glucose catabolism.8–10 In addition, PFKFB4 enzyme can divert the glucose flux toward pentose phosphate pathway (PPP) by converting F-2,6-BP back to F6P.8,10 PFKFB4-mediated increased glucose flux through PPP results in the production of ribose-5-phosphate for nucleic acid synthesis as well as regenerating NADPH to diminish oxidative stress in the tumor cells,11–13 suggesting its important role in tumor metabolic adaptation. PFKFB4 expression is elevated in variety of tumors,14–21 and increased expression of PFKFB4 has been found to be associated with poor prognosis of cancer patients,15,19,20,22,23 particularly with triple-negative breast cancer (TNBC).16,23–27 However, it remains unknown how the PFKFB4-dependent metabolic adaptations in the hostile TME promote the development of more invasive clones that metastasize to distant organs. In the present study, we sought to identify the functional significance of PFKFB4 to mitigate hypoxic and nutrient stress in the TNBC microenvironment and to define the underlying mechanisms regulating invasive phenotype, with the anticipation that these metabolic and cellular adjustments could serve as fundamental determinants of metastatic competence.
RESULTS
PFKFB4 drives metastatic breast cancer and prognosticates TNBC patients with poor outcome
PFKFB4 expression is significantly elevated in different subtypes of breast cancer compared with adjoining normal tissues.14–21 To investigate in which subtype of breast cancer patients PFKFB4 expression is associated with the poor prognosis, we analyzed patient datasets obtained from The Cancer Genome Atlas (TCGA) and Gene Expression Omnibus (GEO: GSE21653)28 and stratified disease-free survival of patients based on PFKFB4 expression. TNBC patients with high PFKFB4 expression were associated with poor survival compared with patients with low PFKFB4 expression in the GSE21653 dataset (p = 0.054), but not in the hormone-positive breast cancer cohort (Figure S1A). Using transcriptomics analysis of wild-type (WT) or PFKFB4 knockout (KO) mouse mammary tumor line EMT6, we identified a set of 32 genes that were significantly modulated by PFKFB4 (Figures S1B and S1C). Tumors with high PFKFB4 signature were found to be significantly associated with poor disease-free survival only in TNBC subtype, but not in hormone-positive breast cancer patients (Figures 1A and S1D). Several oncogenic pathways such as epithelial-to-mesenchymal transition, extracellular matrix receptor interaction, hypoxia, and focal adhesion were accentuated in tumors with high PFKFB4 signature (Figure S1E). Since activation of these oncogenic pathways leads to more aggressive disease, we investigated whether elevated expression of PFKFB4 is enriched in metastatic lesions of breast cancer patients. Breast cancer metastatic lesions from lung, brain, and liver showed significantly higher PFKFB4 expression compared with matched primary tumors (Figure 1B), suggesting PFKFB4-high tumors may be more invasive, providing a strong clinical relevance to study the functional significance of PFKFB4 in metastatic breast cancer.
Figure 1. PFKFB4 drives metastatic breast cancer and prognosticates TNBC patients with poor outcome.

(A) Kaplan-Meier survival plots of TNBC breast cancer patients with low or high PFKFB4 signature score in TCGA (n = 149) and GEO: GSE21653 (n = 85) database. Medium cut point of PFKFB4 signature score was used to stratified patients. p values were calculated by log rank test.
(B) Relative mRNA expression of PFKFB4 in primary tumors and matching metastases in breast cancer patients from GEO: GSE110590 database. p values were calculated by one-way ANOVA and paired t test, two tailed.
(C) Immunoblot analyses of PFKFB4 protein expression in LM3.3 human breast cancer cells stably expressing doxycycline inducible non-targeting shRNA (dox-shNT) or two shRNAs targeting PFKFB4 (dox-shPFKFB4 #97 and #99) with or without doxycycline treatment (2 μg/mL). β-actin was used as a loading control.
(D) Schematic overview depicting LM3.3 spontaneous metastatic breast cancer model with doxycycline treatment schedule (n = 10).
(E) The weight of resected primary tumors (n = 10). Error bars are presented as mean ± SD. ns, not significant, calculated by one-way ANOVA with Dunnett’s multiple comparisons test.
(F) Immunoblot analyses of PFKFB4 expression in surgically resected LM3.3 primary tumors after 7 days of doxycycline treatment. Three animal bearing tumors (n = 3) from each group were used for analysis.
(G) Representative IVIS image of systemic metastases from each group at day 26 after primary tumor implantation.
(H) The kinetics of systemic metastases development after primary tumors were resected, as measured by IVIS imaging (n = 10). Error bars are presented as mean ± SEM. ***p < 0.001 by two-way ANOVA with Dunnett’s multiple comparisons test. See also Figure S1.
To test directly whether PFKFB4 expression drives breast cancer recurrence and metastasis, we used a highly metastatic TNBC line LM3.3 to stably express two doxycycline-inducible shRNAs targeting PFKFB4 (shPFKFB4) and control non-targeting shRNA (shNT) (Figure 1C). We implanted the stable cells orthotopically in the mammary fat pad of severe combined immunodeficiency (SCID) mice and allowed the tumors to engraft for 2 weeks followed by doxycycline treatment to induce PFKFB4 knockdown in vivo (Figure 1D). After a week of doxycycline administration, we surgically resected the primary tumors without any appreciable changes in tumor volume across the groups (Figure 1E). Western immunoblot analysis of primary tumors confirmed reduced levels of PFKFB4 in tumors expressing shPFKFB4 (#97 and #99, n = 3) compared with shNT-expressing tumors (Figures 1F and S2A). 1 week of doxycycline treatment did not show significant difference in Ki67 staining, indicating minimal changes in tumor cell proliferation (Figures S2B and S2C) at this time point. Next, we monitored tumor recurrence in these animals by IVIS imaging following surgical resection of primary tumors to determine the role of PFKFB4 in driving TNBC metastasis independent of primary tumor growth. Genetic inhibition of PFKFB4 significantly reduced the metastatic burden in animals compared with the control shNT-expressing group that showed profound distant organ metastasis within 5 weeks of primary tumor removal (Figures 1G and 1H). These experimental findings align with our clinical observations confirming that elevated levels of PFKFB4 lead to an aggressive metastatic disease that reduces the likelihood of disease-free survival in TNBC patients.
Since overt metastatic disease is mostly incurable, we envisioned to identify early ‘‘organotropic metastases’’ associated with elevated levels of PFKFB4. For this, we undertook a similar experimental strategy as shown in Figure 1D, except terminating the experiment 2 weeks after primary tumor resection when the first signs of metastases were observed by in vivo bioluminescence imaging (Figure 2A). Strikingly, we found that the majority of bioluminescent signals came from the axillary lymph nodes, which was confirmed by counterstaining with Evans blue dye29 (Figure 2B), and PFKFB4 ablation significantly reduced lymph node metastasis (Figure 2C). Pathological interpretation of H&E sections of lymph nodes confirmed abundant metastatic deposits (indicated by T) in shNT group compared with shPFKFB4 (Figure 2D), and immunohistochemical staining with human Ki67 and lymphatic endothelial cell marker (LYVE-1) demonstrated that the PFKFB4 deletion significantly reduced enrichment of TNBC cells in the lymph node sections and whole-mount lymph nodes (Figures 2E–2G and S2D). Taken together, our data indicate that PFKFB4 expression is a critical driving factor for breast cancer metastasis to the lymph nodes that may subsequently prime tumor cells for widespread systemic metastasis.
Figure 2. PFKFB4 ablation reduces local invasion of the breast tumors to the axillary lymph nodes.
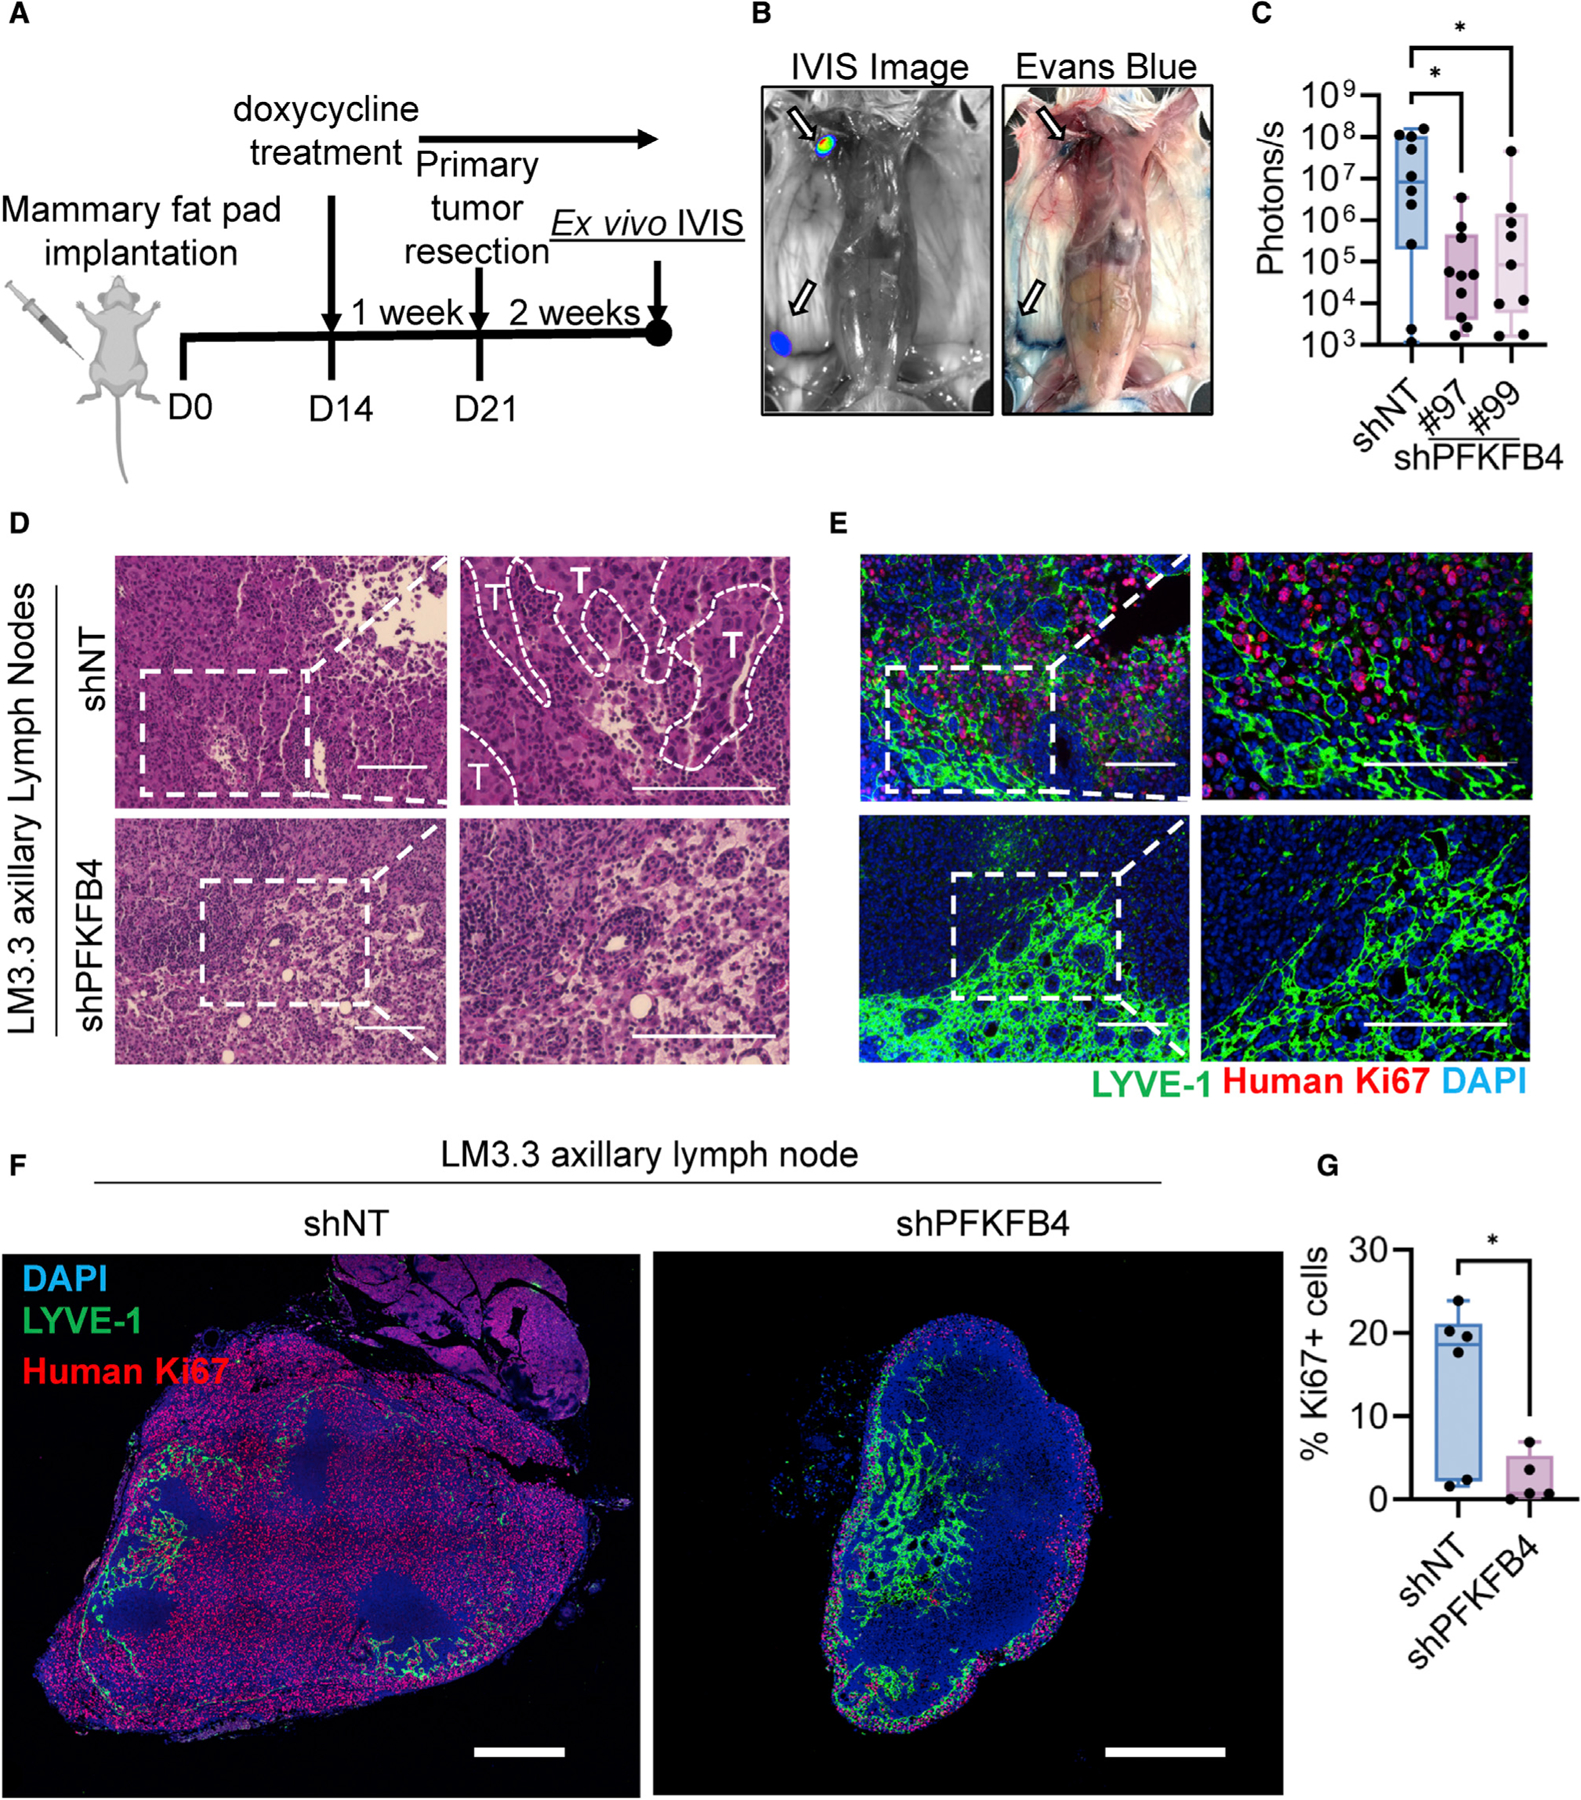
(A) Schematic overview of LM3.3 spontaneous metastatic breast cancer model terminated 2 weeks after primary tumor resection (n = 9–10).
(B) Representative IVIS image and Evans blue mapping of mouse lymph nodes. Inguinal lymph node and axillary lymph nodes are marked with arrow.
(C) Ex vivo measurement of axillary lymph node metastases by IVIS imaging 2 weeks after primary tumor resection (n = 9–10). Error bars are presented as mean ± SD. *p < 0.05 by one-way ANOVA with Dunnett’s multiple comparisons test.
(D and E) Representative H&E (D) and matching immunohistochemistry (E) images showing axillary lymph node metastases. Tumor margins (T) are marked by dashed line. Human Ki67 (red) was used as a marker for proliferating cancer cells. LYVE-1 (green) is a marker for lymphatic endothelial cells. Scale bar, 150 μm.
(F) Representative immunohistochemical staining of Ki67 (red), LYVE-1 (green), and DAPI (blue) in whole axillary lymph node sections imaged by confocal microscopy, showing the overall distribution of the tumor cell enrichment. Scale bar, 500 μm.
(G) Quantification of the percentage of Ki67-positive cells in the axillary lymph node (n = 5–6). Error bars are presented as mean ± SD. *p < 0.05 by unpaired two-tailed t test. See also Figure S2.
Integrin β3 pathway is enhanced by tumor-intrinsic PFKFB4
To define the underlying mechanisms of PFKFB4-dependent breast cancer metastasis, we performed single-end mRNA sequencing of human TNBC line MDA-MB-231 and mouse mammary tumor line EMT6 expressing CRISPR-Cas9-mediated stable deletion of PFKFB4 (PFKFB4-KO) compared with parental lines with endogenous PFKFB4 (WT). Knockout clones with deletion of PFKFB4 from both alleles were confirmed by targeted amplicon sequencing and were selected for further studies (Figure S3A). We identified 128 gene sets that were enriched in WT cells compared with PFKFB4-KO cells (Figure S3B), among which αvβ3 integrin pathway was found to be significantly altered by PFKFB4 in both the cell lines examined (Figure 3A). Integrin αvβ3 is a cell surface heterodimeric adhesion receptor for extracellular matrix proteins, such as fibronectin and vitronectin, which are associated with an increased incidence of metastatic breast cancer.30–32 Several genes associated with the αvβ3 integrin pathway such as fibronectin, collagens, and integrins were significantly reduced and clustered along with PFKFB4 deletion (Figure 3B). Quantitative PCR and western immunoblot analysis confirmed that integrin β3 (ITGB3) was significantly reduced in both the PFKFB4-KO lines (Figures 3C, 3D, S3C, and S3D). Our data also revealed that PFKFB4 has modest regulation over other integrin subunits (Figures 3C and S3C), indicating PFKFB4-mediated regulation of integrins is fairly specific to β3. Since integrin signaling in tumors promotes invasive traits33–36 required for intravasation into the blood or lymphatic vessels,37 we investigated whether ablation of PFKFB4 has any effects on cell migration and invasion. Boyden chamber migration and Matrigel-coated invasive assays with serum as a chemoattractant revealed that loss of PFKFB4 robustly attenuated migratory and invasive potential of TNBC cells (Figures 3E, S4A, and S4B). Since fibronectin and vitronectin are known ligands activating integrin αvβ3,33,34,36,38,39 we used them as chemo-attractants and observed increased migration in WT cells, whereas the migratory potential of PFKFB4-KO cells was severely attenuated (Figures 3F and 3G). This migratory defect observed due to loss of PFKFB4 was independent of cellular proliferation (Figure S4C). Gain-of-function experiments revealed that ectopic expression of PFKFB4 significantly enhanced migratory potential of breast cancer cells toward serum or fibronectin (integrin αvβ3 ligand) (Figures S4D–S4I). These findings indicate that PFKFB4-mediated integrin β3 regulation activates invasive traits in TNBC cells. Immunostaining also demonstrated significantly elevated expression of integrin β3 in the metastatic lesions of LM3.3 shNT tumors enriched in the lymph nodes as confirmed by HLA counterstain, compared with shPFKFB4 tumors (Figures 3H and 3I). In summary, our findings identified that PFKFB4 activates the expression of integrin β3, inducing migratory and invasive potential of breast tumor cells, which function as molecular determinants of distant organ metastasis.
Figure 3. PFKFB4 mediates migratory and invasive potential by activating αvβ3 integrin pathway.

(A) Gene sets enriched in WT or PFKFB4-KO EMT6 cells identified in RNA-seq data. Top five gene sets significantly enriched in WT cells are listed. Plot showing gene set enrichment analysis (GSEA) of αvβ3 integrin pathway in EMT6 cells.
(B) Heatmap showing differentially expressed genes (DEGs) (p < 0.05, Log2FC < −1.5 or > 1.5) in αvβ3 integrin pathway.
(C) The mRNA expression of ITGB1, ITGB3 (encoding integrin β3), ITGB5, and ITGAV in EMT6 WT and PFKFB4-KO cells measured by quantitative PCR (n = 3). Error bars are presented as mean ± SD. ****p < 0.0001 by one-way ANOVA with Dunnett’s multiple comparisons test.
(D) The protein expression of integrin β3 and PFKFB4 in EMT6 WT and PFKFB4-KO cells measured by immunoblotting. β-actin was used as a loading control.
(E) Boyden chamber migration assay using EMT6 WT and PFKFB4-KO cells with serum as chemoattractant (n = 3). Scale bar, 300 μm. Error bars are presented as mean ± SD. ****p < 0.0001 by one-way ANOVA with Dunnett’s multiple comparisons test.
(F) Boyden chamber migration assay using EMT6 WT and PFKFB4-KO cells using fibronectin (FN; 10 μg/mL) and vitronectin (VN; 5 μg/mL) as chemoattractant. Scale bar, 300 μm.
(G) Quantification of FN- and VN-dependent migration (n = 3). Error bars are presented as mean ± SD. **p < 0.01 by unpaired two-tailed t test.
(H) Representative immunohistochemistry images showing integrin β3 (red) expression in shNT and shPFKFB4 metastatic lymph nodes from LM3.3 mouse experiments described in Figure 2A. Human HLA (green) was used as a marker for human tumor cells. Scale bar, 50 μm.
(I) Quantification of integrin β3 expression in human HLA-positive cells (n = 3). Error bars are presented as mean ± SD. *p < 0.05 by unpaired two-tailed t test. See also Figures S3 and S4.
Hypoxia stimulates PFKFB4-dependent promigratory and invasive traits
To apprehend our unexpected finding that a metabolic enzyme PFKFB4 can induce invasive traits in TNBC to drive distant organ metastasis, we decided to carefully dissect the importance of tumor-intrinsic PFKFB4 expression in the TME. One of the major stresses in the TME is hypoxia, and the key mediator of cellular homeostasis in response to hypoxia is the transcription factor hypoxia-inducible factor 1α (HIF-1α).40,41 PFKFB4 has been identified as one of the robust targets of HIF-1α with a canonical HIF-1α binding site on the proximal promoter 422–429 bp upstream of the transcriptional start site,42–44 but the role of PFKFB4 under tumor hypoxia remains largely unexplored. Hence, we asked whether PFKFB4-dependent acquisition of invasiveness is triggered by hypoxic response in the TME. Both human and mouse TNBC lines showed strong induction of PFKFB4 expression in response to 1% O2 hypoxia (Figure 4A), so we performed wound healing assay using EMT6 WT and PFKFB4-KO cells to decipher the importance of PFKFB4 in cancer cell migration under hypoxic stress. Our data revealed that PFKFB4 deletion significantly diminished the wound closure, but the effect was more robust under hypoxia (1% O2) (Figures 4B, S5A, and S5B). Next, we analyzed whether integrin β3, identified as a specific PFKFB4 downstream target, is activated under hypoxic stress. Our findings demonstrate that integrin β3 expression was vigorously induced by hypoxia both in messenger and protein levels, and PFKFB4 deletion completely abrogated effects of hypoxia on integrin β3 expression (Figures 4C–4E and S5C). Ectopic re-expression of integrin β3 in PFKFB4-KO EMT6 cells (Figure 4F) was sufficient to rescue the migratory defects observed due to loss of PFKFB4 in both normoxic and hypoxic conditions (Figures 4G, 4H, S5D, and S5E). Taken together, our data indicate that under hypoxic stress, induction of PFKFB4 expression hyperactivates integrin β3 signaling, imparting enhanced migratory and invasive properties in TNBC cells.
Figure 4. Hypoxia stimulates PFKFB4-dependent promigratory and invasive traits.

(A) Quantitative PCR showing the relative levels of PFKFB4 in MDA-MB-468, MDA-MB-231, and EMT6 cells cultured in normoxia (21% O2) or hypoxia (1% O2) (n = 3). Error bars are presented as mean ± SD. **p < 0.01; ***p < 0.001 by unpaired two-tailed t test.
(B) Wound healing assay using EMT6 WT and PFKFB4-KO cells cultured in normoxic (21% O2) or hypoxic condition (1% O2) (n = 3). Error bars are presented as mean ± SD. *p < 0.05; ****p < 0.0001; ns, not significant, calculated by one-way ANOVA with Sidak’s multiple comparisons test.
(C) The mRNA expression of ITGB3 in EMT6 WT and PFKFB4-KO cells under normoxic (21% O2) or hypoxic condition (1% O2) (n = 3). Error bars are presented as mean ± SD. *p < 0.05; ****p < 0.0001 by one-way ANOVA with Sidak’s multiple comparisons test.
(D and E) Immunoblot analyses of integrin β3, HIF-1α, PFKFB4, and β-actin in WT and PFKFB4-KO MDA-MB-468 (D) and EMT6 cells (E) cultured in normoxia (21% O2) or hypoxia (1% O2).
(F) Immunoblot analyses showing the levels of endogenous integrin β3 and GFP-integrin β3 along with PFKFB4. β-actin was used as a loading control.
(G) Boyden chamber migration assay using EMT6 WT, PFKFB4-KO, and PFKFB4-KO cells with ectopic GFP-integrin β3 cultured in hypoxic condition (1% O2). Scale bar, 300 μm.
(H) Quantification of migration assay under hypoxic condition (n = 3). Error bars are presented as mean ± SD. ***p < 0.001 by one-way ANOVA with Dunnett’s multiple comparisons test. See also Figure S5.
PFKFB4 expression is activated in hypoxic tumors in vivo, creating metabolic flexibility
To investigate whether hypoxia in the TME induces PFKFB4 in vivo, we implanted LM3.3 cells stably expressing shNT or two different shRNA clones targeting PFKFB4, as described previously (Figure 1C). After a week of doxycycline administration when the tumors were around 300 mm3, we performed non-invasive live photoacoustic imaging with co-registered B-mode ultrasound (PAI-US) to evaluate tumor hypoxia (Figures 5A and S6A). Photoacoustic imaging exploits the optical characteristics of hemoglobin to provide information on tissue oxygenation.45 We found that periphery of the tumor had profound blood volume and oxygen saturation, indicated by higher total hemoglobin (HbT) and percentage of saturated oxygen (sO2%), whereas tumor core (middle frame) remained extremely hypoxic (Figures 5A, S6A, and S6B). Overall, not much difference in sO2% but a slight reduction in tumor HbT levels were observed between the shNT and shPFKFB4 groups (Figures 5B and S6C), using skin oxygenation levels as negative controls (Figures S6D and S6E). Our findings indicate that the tumors from both shNT and shPFKFB4 groups had an overall similar level of hypoxia independent of PFKFB4 status. The tumors were then resected, sectioned, and stained with pimonidazole (Pimon), a marker for hypoxia, along with immunostaining for PFKFB4 to determine the relative levels of the metabolic enzyme in the normoxic and hypoxic regions of the tumor. PFKFB4 expression in the hypoxic regions in the control LM3.3 tumors was significantly higher compared with the normoxic areas (Figures 5C and 5D). As expected, silencing of PFKFB4 reduced protein expression both in normoxic and hypoxic tumors (Figures 5C and 5D). These studies using cutting-edge imaging and staining techniques demonstrated that hypoxic stress in the TME robustly stimulates PFKFB4 expression in vivo.
Figure 5. PFKFB4 expression is induced in hypoxic regions of breast tumor activating metabolic reprogramming.

(A) Representative images of ultrasound and photoacoustic imaging (US-PAI) from LM3.3 shNT and shPFKFB4 primary tumors. The images were acquired in 3D-mode and presented in three representative frames showing the oxygen saturation (sO2%) from the periphery (left and right frames) and the core (middle frame) of the tumors.
(B) Quantification of oxygen saturation (tumor 3D sO2%) in shNT and shPFKFB4 tumors (n = 3). Error bars are presented as mean ± SD. ns, not significant, calculated by unpaired two-tailed t test.
(C) Immunohistochemical staining of PFKFB4 (red) and pimonidazole (green) from resected LM3.3 shNT and shPFKFB4 primary tumors (n = 4). Pimonidazole isa marker of hypoxia. Each tumor was imaged and quantified in both pimonidazole negative and positive areas. Scale bar, 75 μm.
(D) Quantification of the intensity of PFKFB4 staining (n = 4). Error bars are presented as mean ± SD. **p < 0.01; ***p < 0.001; ****p < 0.0001; ns, not significant, calculated by one-way ANOVA with Sidak’s multiple comparisons test.
(E) Experimental workflow of in vitro (n = 3) and in vivo (n = 5) targeted metabolomics.
(F) Principal component analysis of targeted metabolomics from EMT6 WT and PFKFB4-KO cells cultured in normoxic (21% O2) or hypoxic condition (1% O2).
(G) Relative levels of serine, glycine, aspartate, arginine, and GSH/GSSG in WT and PFKFB4-KO EMT6 cells cultured in normoxia (21% O2) or hypoxia (1% O2) (n = 3). Error bars are presented as mean ± SD. *p < 0.05; **p < 0.01; ***p < 0.001; ****p < 0.0001 by one-way ANOVA with Sidak’s multiple comparisons test.
(H) Unique metabolic signature regulated by PFKFB4 in TNBC is schematically demonstrated. See also Figures S6 and S7.
To decipher the role of PFKFB4 in the TME, we first investigated the metabolic fingerprint of triple-negative breast tumors growing in vivo and under hypoxic or normoxic condition in vitro, with the anticipation to identify selective biochemical advantages associated with PFKFB4 expression. Previous studies have identified the involvement of PFKFB4 as a regulator of glucose catabolism by diverting the carbon flux toward PPP facilitating nucleotide synthesis and NADPH regeneration.11–13 However, none of these studies distinguished the metabolic advantages of PFKFB4 activation in hypoxic tumors. To address this, first we analyzed the metabolic profile of mouse EMT6 WT and PFKFB4-KO cells cultured under hypoxic stress (Figure 5E). Principal component analysis of the metabolic profile revealed distinct clustering of WT breast cancer cells based on oxygenation status (Figure 5F). Moreover, loss of PFKFB4 demonstrated differential clustering according to oxygenation status (Figure 5F), with a distinct metabolic profile regulated by PFKFB4 under hypoxia (Figure S7A). Pathway enrichment analysis identified metabolism of amino acids, purines, and glutathione was significantly altered due to PFKFB4 deletion in hypoxic conditions (Figure S7B). Next, we performed metabolic profiling of human TNBC LM3.3 tumor xenografts grown in mouse (Figure 5E), which were previously demonstrated to have equal presence of hypoxia in both shNT and shPFKFB4 tumors (Figure 5A). We identified a distinct profile involving certain amino acid metabolic pathways that were significantly modulated by PFKFB4 in vivo (Figures S7C and S7D). Combining both the in vitro and in vivo metabolomics datasets, we found a unique metabolic signature containing serine, glycine, aspartate, and arginine metabolic pathways that were significantly reduced in PFKFB4-ablated hypoxic tumors (Figures 5G and 5H). Hypoxia is known to induce reactive oxygen species (ROS), and there remains a higher demand of reducing equivalents including NADPH and glutathione to maintain redox balance.46 Our data revealed that the reduced to oxidized glutathione ratio (GSH/GSSG) was significantly lower in PFKFB4-depleted tumor cells compared with parental cells in hypoxia (Figure 5G). We examined the levels of NADPH required for glutathione regeneration, and we found PFKFB4 ablated breast tumor cells have reduced NADPH compared with parental cells under hypoxic stress (Figure S7E). These findings suggest that PFKFB4 induction under hypoxia is essential to control redox balance by maintaining reduced glutathione and NADPH levels under hypoxic stress. In conclusion, induction of PFKFB4 in hypoxic TME activates metabolic rewiring in TNBC to overcome nutrient and oxidative stress, thereby creating tumor-intrinsic metabolic flexibility and plasticity (Figure 5H) favoring adaptation in a hostile microenvironment.
PFKFB4 promotes adaptation in a hypoxic TME to select invasive tumor clones for distant organ metastasis
Our data showed that PFKFB4 is activated under hypoxic stress in vivo creating metabolic flexibility, and molecularly, it stimulates integrin β3 signaling to induce migratory and invasive traits. Taken together, these findings postulate an interesting hypothesis that PFKFB4 may be essential for TNBC cells to adapt and mitigate TME stresses, facilitating selection of dominant clones with pro-metastatic features. To address this hypothesis, we designed a dual-fluorescence labeling system with plasmids expressing shNT tagged to GFP and shPFKFB4 to RFP, both under the control of doxycycline inducible promoter. The fluorescence constructs were stably expressed in 4T1 cells (Figure 6A), and their expression (Figure 6B), separation spectra (Figure S8A), and knockdown efficiency (Figure S8B) were confirmed. Our first objective was to investigate survival and adaptation advantages of breast tumor cells regulated by PFKFB4 in the TME. For this, we mixed an equal number (5 × 10⁴) of 4T1 cells expressing shNT-GFP and shPFKFB4-RFP, and we implanted them orthotopically into the mammary fat pad of SCID mice. After 7 days, animals were randomly split into three groups (n = 6–9), and doxycycline was administered to induce PFKFB4 silencing, but the treatment period was varied for 2 days, 7 days, or 14 days in three animal groups, respectively, before the tumors were harvested (Figure 6C). The tumors were sectioned, and fluorescence microscopy was performed to image GFP+ shNT and RFP+ shPFKFB4 cells, co-stained with hypoxia marker pimonidazole (Pimon) (Figures 6D, 6E, and S8C). At the 2-day time point, distribution of GFP+ and RFP+ breast cancer cells in the TME was identical, and no difference in enrichment was observed in hypoxic (Pimon+) or normoxic (Pimon–) TME (Figures 6D and 6F). This was expected, for 2 days of doxycycline treatment was not sufficient to induce PFKFB4 silencing. However, in the animals treated with doxycycline for 7 days, we found a robust reduction of RFP+ shPFKFB4-expressing cells compared with GFP+ shNT only in the hypoxic areas of the TME, but not in the normoxic region (Figures 6E and 6G), suggesting PFKFB4 is essential for breast cancer cells to survive in the hypoxic TME. Long-term depletion of PFKFB4 for 14 days showed reduced levels of RFP+ shPFKFB4 cells both in hypoxic and normoxic TME compared with GFP+ shNT cells (Figures S8C and S8D). Quantification of tagged fluorescent proteins revealed that the ratio of shNT to shPFKFB4 cells (shNT/shPFKFB4) significantly increased in hypoxic TME as early as 7 days of PFKFB4 inhibition (Figures 6H, 6I, and S8E), indicating that activation of PFKFB4 is indispensable for breast cancer cells to survive and adapt under hypoxic stress.
Figure 6. PFKFB4 mediates tumor cell survival and adaptation in hypoxic TME.

(A) Inducible constructs expressing shNT-GFP and shPFKFB4-RFP.
(B) Fluorescent microscopy of 4T1 cells stably expressing doxycycline inducible shNT-GFP or shPFKFB4-RFP (doxycycline: 2 μg/mL).
(C) Schematic showing orthotopic implantation of a mixture of shNT-GFP and shPFKFB4-RFP 4T1 cells, followed by doxycycline treatment (2000 mg/kg in diet) for 2, 7, or 14 days.
(D and E) Representative confocal images showing the distribution of shNT (GFP) and shPFKFB4 (RFP) cells in hypoxic tumor region (pimonidazole+, white) after 2 days (D) or 7 days (E) of doxycycline treatment. Pimonidazole (white) is a marker of hypoxia. Scale bar, 250 μm.
(F and G) Quantification of the number of shNT (GFP) and shPFKFB4 (RFP) cells in hypoxic and normoxic region indicated by pimonidazole staining after 2 days
(F) or 7 days (G) of doxycycline treatment (n = 6–9). Data were normalized to the total number of shNT (GFP) cells (100%). Error bars are presented as mean ± SD. *p < 0.05; ns, not significant, calculated by one-way ANOVA with Sidak’s multiple comparisons test.
(H and I) The ratio of the number of shNT cells to shPFKFB4 cells in hypoxic (pimonidazole+) (H) and normoxic region (pimonidazole–) (I). n = 6–9 biological replicates. Error bars are presented as mean ± SD. *p < 0.05; **p < 0.01; ns, not significant, calculated by one-way ANOVA with Tukey’s multiple comparisons test.
See also Figure S8.
Next, we investigated whether PFKFB4-dependent adaptations in the TME instigate a clonal selection of TNBC cells with dominant invasive traits facilitating survival advantages in the later phases of metastasis. For this, we continued administration of doxycycline for 2 more weeks after primary tumors were resected from the animals in three groups (doxycycline: 2 days, 7 days, and 14 days before tumor resection) (Figure S8F). At the end of the experiment, we quantitated the enrichment of GFP+ shNT and RFP+ shPFKFB4 breast cancer cells in the mouse lung tissues by immunohistochemistry (IHC) (Figure S8F). Breast tumors with PFKFB4 depletion for 7 days or 14 days failed to enrich in the lung tissues, as indicated by increased GFP+ cells compared with RFP+ (Figures S8G and S8H). In summary, our findings postulate that PFKFB4-mediated adaptative responses in the TME select dominant breast cancer clones with increased invasive and survival traits to drive distant organ metastasis.
Hypoxia translocates PFKFB4 to the nucleus that stratifies breast cancer patients with poor survival
To investigate the clinical significance of increased PFKFB4 expression in breast cancer patient survival, we performed PFKFB4 immunohistochemistry using multiple tissue microarrays (TMAs) containing human primary breast tumor tissues (n = 122). PFKFB4 antibody20,23,25 was first optimized using cell lines and tissue samples (Figures S9A and S9B). Pathological interpretation of the immuno-stained TMAs revealed two contrasting patterns of PFKFB4 localization, either cytosolic or nuclear, in the tumor tissues (Figures 7A and 7B). Patients with high PFKFB4 expression irrespective of cellular localization showed poor survival (Figures 7C and 7D), but tumors with intense nuclear staining (Figure 7A) were found to be significantly associated with worst prognosis (Figure 7C). PFKFB4 staining pattern was not associated with any established clinical risk factors (Table S1), suggesting nuclear PFKFB4 staining may function as an independent factor to prognosticate breast cancer patients with poor outcome.
Figure 7. Hypoxia increases PFKFB4 localization in the nucleus, which stratifies breast cancer patients with poor survival.

(A and B) Representative PFKFB4 immunohistochemical staining of breast cancer patients (n = 122) with high or low staining of PFKFB4 in the nucleus (A) and cytoplasm (B). Scale bar, 300 μm.
(C and D) Kaplan-Meier analysis of the overall survival of breast cancer patients (n = 122) with high or low expression of PFKFB4 in the nucleus (C) or cytoplasm (D).
(E) WT and PFKFB4-KO MDA-MB-468 cells cultured in normoxic (21% O2) or hypoxic condition (1% O2) were subjected to subcellular fractionation, followed by immunoblot analyses of PFKFB4, β-tubulin, and lamin A/C. PFKFB4 blot was imaged for 30 s to obtain a low exposure and 120 s to obtain a high exposure.
(F) Immunoblot analyses of nuclear fractions from MDA-MB-468 WT and PFKFB4-KO cells cultured in normoxic or hypoxic conditions were probed with PFKFB4, lamin A/C, and HIF-1α antibodies.
(G) MDA-MB-468 cells cultured in normoxic or hypoxic conditions were used for immunofluorescence staining of PFKFB4. Scale bar, 25 μm (low-magnification image) and 10 μm (high-magnification image).
(H and I) The mRNA expression of SLC2A1 (H) and PDK1 (I) in WT and PFKFB4-KO MDA-MB-468 cells under normoxic (21% O2) or hypoxic condition (1% O2) was measured by quantitative PCR (n = 3). Error bars are presented as mean ± SD. *p < 0.05; ***p < 0.001; ****p < 0.0001 by one-way ANOVA with Sidak’s multiple comparisons test.
(J) HIF-1α luciferase (HRE) reporter assay in MDA-MB-468 WT and PFKFB4-KO cells expressing shNT or shSRC-3 cultured in normoxic (21% O2) or hypoxic condition (1% O2) for 24 h. Error bars are presented as mean ± SD. ****p < 0.0001; ns, not significant, calculated by one-way ANOVA with Sidak’s multiple comparisons test.
(K) Immunoblot analyses of SRC-3 and integrin β3 in MDA-MB-231 cells stably expressing shNT or shSRC-3. β-actin was used as a loading control. See also Figures S9 and S10 and Table S1.
The unexpected finding of nuclear PFKFB4 in human breast tumors prompted us to investigate whether TME stress factors such as hypoxia or nutrient stress might play a role in PFKFB4 localization to the nucleus. Cellular fractionation of human TNBC line MDA-MB-468 revealed that only in response to hypoxic stimulation is PFKFB4 protein substantially localized to the nucleus, whereas normoxic cells showed predominantly cytosolic localization (Figures 7E and 7F). Immunofluorescence staining experiments also revealed that increased nuclear localization of PFKFB4 was observed under hypoxic stress (Figures 7G and S9C). To define the nuclear functions of PFKFB4, we investigated whether canonical hypoxia response genes of HIF-1α are regulated by PFKFB4. PFKFB4 depletion significantly reduced messenger expression of HIF-1α target genes such as SLC2A1 and PDK1 in response to hypoxia (Figures 7H, 7I, S10A, and S10B), indicating PFKFB4 might stimulate HIF-1α transcriptional activity. Previously from an unbiased genetic screen, we discovered that transcriptional coregulator steroid receptor coactivator 3 (SRC-3, also known as NCOA3/AIB1) is directly phosphorylated and activated by PFKFB4.47 We found that under hypoxic stress, Ser857 phosphorylation of SRC-3 was also dependent on PFKFB4, and its loss reduced pSRC-3-S857 levels, indicating suppressed transcriptional coregulator activity to induce gene expression (Figure S10C). To test whether PFKFB4 regulation of HIF-1α is mediated by SRC-3, we performed HIF-1α luciferase reporter assays in the presence or absence of PFKFB4 and/or SRC-3.48 As expected, these lines showed increased HRE-luc activity when subjected to hypoxic stimulation. Loss of either SRC-3 or PFKFB4 ablation significantly attenuated HIF-1α activity, but depletion of both did not yield additive effects (Figure 7J). These findings indicate a non-canonical role of nuclear localized PFKFB4 regulating HIF-1α transcriptional activity by stimulating coactivator SRC-3. In accordance with these findings, our SRC-3 chromatin immunoprecipitation (ChIP) followed by sequencing (ChIP-seq) data49 showed strong chromatin occupancy of SRC-3 on the proximal promoter of PFKFB4 target genes in the αvβ3 integrin pathway regulating migratory and invasive functions such as ITGB3, COL6A1, and COL6A2 (Figure S10D). Further, depletion of SRC-3 reduced HIF-1α transcriptional activity in response to hypoxia (Figures S10E and S10F), and it inhibited expression of PFKFB4 target gene integrin β3 both in mRNA and protein levels (Figures 7K and S10G). These mechanistic studies demonstrate that PFKFB4 increases HIF-1α transcriptional activity to stimulate expression of invasive genes by activating SRC-3. These findings provide mechanistic understanding of the clinical significance of increased nuclear PFKFB4 in human breast tumors and its association with worst disease outcome. In conclusion, our study demonstrated that induction of PFKFB4 expression in hypoxic TME functionally promotes tumor cell adaptation and metabolic flexibility, and its nuclear translocation sustains increased HIF-1α transcriptional program to acquire invasive traits driving aggressive metastatic disease.
DISCUSSION
TNBC recurrence and metastasis remains a leading cause for mortality,50,51 and there is an urgent need to better understand the mechanisms by which tumor cells acquire invasive traits in early phases of disease progression. Our study discovered that PFKFB4, a glycolytic shunt enzyme, is highly expressed in breast cancer and activates an invasive gene signature that is associated with poor prognosis of TNBC patients. Using various mouse models of metastasis, we demonstrate that genetic inhibition of PFKFB4 delayed overt metastasis by reducing the local spread to axillary lymph nodes, a commonly observed early metastatic event seen in breast cancer patients with poor outcome.52 Recent studies support the notion that tumor microenvironmental factors play a critical role in selecting cancer cells with cell autonomous and invasive features that promote metastatic progression.3 Limited nutrient availability and hypoxia are two major environmental stresses that enforce a tumor-intrinsic reprogramming to adapt and survive the harsh TME.4 Although the mechanisms remain poorly understood, a combination of metabolic rewiring coupled with transcriptional changes empower the cancer cells with adaptative phenotype that is advantageous for their survival.53 Our findings now provide a broad understanding about the tumor-intrinsic mechanisms that promote these metabolic and genetic alterations in response to hostile TME. We found that PFKFB4 expression is accentuated under hypoxic stimulation in TNBC cells, which induces an invasive gene signature by transcriptionally activating integrin genes to drive invasion metastasis. Interestingly, we demonstrate that in hypoxic tumors, increased expression of PFKFB4 is vital for survival of TNBC cells, eventually acquiring invasive traits to develop distant organ metastasis in the long run.
Metabolomics studies revealed that PFKFB4 creates metabolic flexibility allowing tumors to alter biochemical pathways to generate essential amino acids and redox equivalents necessary for survival. Although the role of PFKFB4 regulating glucose catabolism in cancer cells was well documented,42–44 its metabolic functions in the TME particularly in response to hypoxia remained elusive. Hypoxia induces increased production of ROS that are toxic to the cancer cells.46 Uncontrolled oxidative stress may inactivate protein function, such as ACO2 and OGDH in the TCA cycle,54 induce ferroptosis through lipid peroxidation, and cause DNA damage.55 One of the mitigation processes is the rapid generation of NADPH from one-carbon metabolism to overcome the oxidative stress.46,56 Our data revealed that PFKFB4 promotes glutathione and NADPH synthesis and one-carbon metabolism, potentially by diverting the glucose catabolism toward de novo serine and glycine synthesis to overcome the oxidative stress. In addition, loss of PFKFB4 severely impaired aspartate levels, which is a limiting metabolite for nucleotide synthesis in hypoxic environment,57–59 suggesting PFKFB4-driven metabolic adaptations may be essential to maintain intracellular aspartate pools. Overall, our findings illustrate that activation of PFKFB4 in hypoxic tumors is essential to mitigate the stress factors by creating metabolic flexibility allowing adaptation and survival of TNBC cells in the hostile microenvironment.
Surprisingly, immunohistochemical analysis of TMAs discovered that PFKFB4 is localized to the nucleus in certain breast tumors, and patients with increased nuclear PFKFB4 were significantly associated with poor survival. A majority of the glycolytic enzymes including PFKFB4 are known to be localized in the cytosol, although it is not uncommon for tumors to exploit metabolic enzymes with non-canonical functions.60–63 Although PFKFB4 contains a weak bipartite nuclear localization signal, our cellular fractionation data revealed that hypoxic stimulation substantially increased nuclear localization of PFKFB4. Interestingly, we found that PFKFB4 regulates some of the canonical HIF-1α target genes under hypoxia and stimulates transcriptional coregulator SRC-3 to coactivate HIF-1α transcriptional responses. Finally, we confirmed that PFKFB4-dependent activation of SRC-3 transcriptionally regulates the invasive gene signature including integrin β3 expression. Although further studies are needed to ascertain the functions of PFKFB4 in the nucleus, based on our data, we speculate a non-canonical role of nuclear PFKFB4 stimulating an increased HIF-1α transcriptional activity favoring genetic plasticity.
In conclusion, our study demonstrates that PFKFB4-dependent metabolic and transcriptional reprogramming in hypoxic TME confers breast cancer cells with increased survival and metastatic competence to drive aggressive breast cancer progression. Disrupting cellular adaptations to environmental stresses may be therapeutically exploited to prevent tumor recurrence and metastasis.
Limitations of the study
While our study provides important insights into the breast tumor microenvironment and mechanisms of tumor cell adaptation regulated by metabolic enzyme PFKFB4, the translational feasibility of our findings is limited. We found that genetic inhibition of PFKFB4 significantly reduced systemic metastasis in breast cancer mouse models, but it remains unknown whether specific pharmacological inhibitors targeting PFKFB4 will show similar effects. In addition, PFKFB4 is a rare bifunctional enzyme with active kinase and phosphatase domains, and the relative roles of these domains controlling enzyme functions also remain to be identified. Our study discovered that nuclear-localized PFKFB4 in breast tumors was associated with the worst prognosis, but the immunohistochemical data were derived from a small cohort. Finally, we demonstrate that hypoxic stress could trigger nuclear translocation of PFKFB4, but further studies are needed to identify the mechanisms regulating nuclear import.
STAR★METHODS
RESOURCE AVAILABILITY
Lead contact
Further information and requests for resources and reagents should be directed to and will be fulfilled by the lead contact, Subhamoy Dasgupta (Subhamoy.Dasgupta@RoswellPark.org).
Materials availability
All the materials used in this study are commercially available. This study did not generate new unique reagents.
Data and code availability
RNA-seq data have been deposited at Gene Expression Omnibus (GEO). It is publicly available as of the date of publication. Accession numbers are listed in the key resources table. Microscopy data reported in this paper will be shared by the lead contact upon request.
This paper does not report original code.
Any additional information required to reanalyze the data reported in this paper is available from the lead contact upon request.
KEY RESOURCES TABLE
| REAGENT or RESOURCE | SOURCE | IDENTIFIER |
|---|---|---|
| Antibodies | ||
|
| ||
| Rabbit polyclonal anti-PFKFB4 | Abcam | Cat# ab137785; RRID: AB_2722775 |
| Rabbit polyclonal anti-PFKFB4 | Abnova | Cat# PAB4031; RRID: AB_1578645 |
| Rabbit polyclonal anti-PFKFB4 | Sino Biological | Cat# 202954-T36 |
| Rabbit polyclonal anti-LYVE1 | Abcam | Cat# ab14917; RRID: AB_301509 |
| Mouse monoclonal anti-Ki-67 (clone MIB-1) | Agilent Dako | Cat# M7240; RRID: AB_2142367 |
| Rabbit monoclonal anti-Integrin β3 (clone D7X3P) | Cell Signaling Technology | Cat# 13166; RRID: AB_2798136 |
| Mouse monoclonal anti-pimonidazole (clone 4.3.11.3) | Hypoxyprobe | Cat# HP1-1000Kit; RRID: AB_2811309 |
| Mouse monoclonal anti-β-actin (clone AC-15), peroxidase conjugate | Sigma-Aldrich | Cat# A3854; RRID: AB_262011 |
| Mouse monoclonal anti-AIB-1 (clone 34/AIB-1) | BD Biosciences | Cat# 611105; RRID: AB_2151198 |
| Mouse monoclonal anti-HIF-1α (clone H1alpha67) | Novus Biologicals | Cat# NB100-105; RRID: AB_10001154 |
| Rabbit monoclonal anti-HIF-1α (clone D1S7W) | Cell Signaling Technology | Cat# 36169; RRID: AB_2799095 |
| Rabbit polyclonal anti-Lamin A/C | Cell Signaling Technology | Cat# 2032S; RRID: AB_2136278 |
| Rabbit monoclonal β-Tubulin (clone 9F3) | Cell Signaling Technology | Cat# 2128S; RRID: AB_823664 |
| Anti-Rabbit IgG (H + L), HRP conjugate | Promega | Cat# W4011; RRID: AB_430833 |
| Anti-Mouse IgG (H + L), HRP conjugate | Promega | Cat# W4021; RRID: AB_430834 |
| Goat anti-rabbit, Alexa Fluor 488 conjugate | Invitrogen | Cat# A11008; RRID: AB_143165 |
| Donkey anti-mouse, Alexa Fluor 594 conjugate | Invitrogen | Cat# A21203; RRID: AB_141633 |
| Goat anti-rabbit, Alexa Fluor 594 conjugate | Invitrogen | Cat# A11012; RRID: AB_141359 |
| Goat anti-mouse, Alexa Fluor 488 conjugate | Invitrogen | Cat# A11001; RRID: AB_2534069 |
| Goat anti-rat, Alexa Fluor 647 conjugate | Invitrogen | Cat# A21247; RRID: AB_141778 |
| Goat anti-mouse, Alexa Fluor 568 conjugate | Invitrogen | Cat# A11031; RRID: AB_144696 |
| Goat anti-mouse, Alexa Fluor 405 conjugate | Invitrogen | Cat# A31553; RRID: AB_221604 |
| Normal mouse IgG | Sigma-Aldrich | Cat# 12-371; RRID:AB_145840 |
| Rabbit monoclonal anti-phospho-SRC-3 (Ser857) (Clone 10A6) | Cell Signaling Technology (Dasgupta et al., 2018)47 | Cell culture supernatant produced from hybridoma; Gift from Cell Signaling Technology |
|
| ||
| Biological samples | ||
|
| ||
| Human breast cancer tissue microarrays (TMAs) | RPCCC | N/A |
|
| ||
| Chemicals, peptides, and recombinant proteins | ||
|
| ||
| Doxycycline hyclate | Sigma-Aldrich | Cat# D9891 |
| Doxycycline diet (2000mg/kg) | Envigo | Cat# TD.09633 |
| Lipofectamine 2000 | Cat# 11668500 | |
| Polybrene Infection/Transfection Reagent | Thermo Fisher Scientific Sigma | Cat# TR1003G |
| Vitronectin | Sigma-Aldrich | Cat# 5051-0.1MG |
| Fibronectin Human Protein, Plasma | Thermo Fisher Scientific | Cat# 33016015 |
| Falcon™ Cell Culture Inserts, 8μm | Sigma-Aldrich | Cat# 08-771-21 |
| Corning® BioCoat® Matrigel® Invasion Chambers with 8.0 μm PET Membrane | Corning | Cat# 354480 |
| Protein Ladder | Thermo Fisher Scientific | Cat# LC5800 |
| Pierce™ ECL Plus Western Blotting Substrate | Thermo Fisher Scientific | Cat# 32132X3 |
| RIPA buffer | Thermo Fisher Scientific | Cat# 89900 |
| NP40 lysis buffer | Thermo Fisher Scientific | Cat# FNN0021 |
| Protease Inhibitor Cocktail Set I – Calbiochem | Sigma-Aldrich | Cat# 539131-10VL |
| Halt™ Phosphatase Inhibitor Cocktail | Thermo Fisher Scientific | Cat# 78427 |
| Micro BCA Protein Assay Kit | Thermo Fisher Scientific | Cat# 23235 |
| Acetone | Sigma-Aldrich | Cat# 179973-1L |
| 10% buffered formalin | Sigma-Aldrich | Cat# HT501320 |
| Sucrose | Sigma-Aldrich | Car# 84097 |
| Tissue-Tek O.C.T. Compound | Sakura Finetek | Cat# 4583 |
| Vector® TrueVIEW® Autofluorescence Quenching Kit | Vector Labs | Cat# SP-8400 |
| Antigen Unmasking Solution, Citrate-Based | Vector Labs | Cat# H-3300 |
| Normal Goat Serum Blocking Solution, 2.5% | Vector Labs | Cat# S-1012-50 |
| VectaMount Permanent Mounting Medium, 60 mL | Vector Labs | Cat# H-5000-60 |
| Vectashield vibrance with DAPI, mounting media | Vector Labs | Cat# H-1800-10 |
| Bond Dewax Solution | Leica | Cat# AR9222 |
| Bond Epitope Retrieval 2 | Leica | Cat# AR9640 |
| Bond Polymer Refine Detection kit | Leica | Cat# DS9800 |
| Rabbit Envision | Agilent | Cat# K4003 |
| D-luciferin, potassium salt | Goldbio | Cat# LUCK-1G |
| Matrigel™ Membrane Matrix | Corning | Cat# 354234 |
| Restore™ PLUS Western Blot Stripping Buffer | Thermo Fisher Scientific | Cat# 46430 |
| Protein G magnetic beads, 5mL | Thermo Fisher Scientific | Cat# 88848 |
| RNeasy Mini Kit | Qiagen | Cat# 74106 |
| TURBO DNA-free kit | Invitrogen | Cat# AM1907 |
| SuperScript VILO cDNA synthesis kit | Invitrogen | Cat# 11754250 |
| PowerUp™ SYBR™ Green Master Mix | Thermo Fisher Scientific | Cat# A25777 |
|
| ||
| Critical commercial assays | ||
|
| ||
| ONE-Glo™ EX Luciferase Assay System | Promega | Cat# E8110 |
| NADP/NADPH-Glo™ Assay | Promega | Cat# G9081 |
|
| ||
| Deposited data | ||
|
| ||
| RNA-seq data of WT and PFKFB4-KO cells | This paper | GEO: GSE217132 |
|
| ||
| Experimental models: Cell lines | ||
|
| ||
| Human: MDA-MB-468 cells | ATCC | HTB-132 |
| Human: MDA-MB-231 cells | ATCC | HTB-26 |
| Human: LM3.3 cells | Minn et al., 200564 | N/A |
| Mouse: EMT6 cells | ATCC | CRL-2755 |
| Mouse: 4T1 cells | ATCC | CRL-2539 |
| Human: HEK 293T cells | RPCCC Gene Modulation Services Shared Resource | N/A |
|
| ||
| Experimental models: Organisms/strains | ||
|
| ||
| Mouse: C.B-Igh-1b/IcrTac-Prkdcscid | RPCCC in-house | N/A |
|
| ||
| Oligonucleotides | ||
|
| ||
| Primers used for qPCR analysis, see Table S2 | Integrated DNA Technologies | N/A |
| Primers for Targeted Amplicon Sequencing, see Table S3 | Integrated DNA Technologies | N/A |
|
| ||
| Recombinant DNA | ||
|
| ||
| pLenti-U6-human PFKFB4 gRNA-Cas9-puro | CBASS Core at Baylor College of Medicine | N/A |
| pLenti-U6-mouse PFKFB4 gRNA-Cas9-puro | CBASS Core at Baylor College of Medicine | N/A |
| pLKO.1-puro-shRNA targeting human SRC-3 | Sigma-Aldrich | TRCN0000370321, TRCN0000365196 |
| pLKO.1-puro non-targeting shRNA | Sigma-Aldrich | SHC216 |
| pTRIPZ inducible shRNA targeting human PFKFB4 | Horizon Discovery | V3THS_378097, V3THS_378099 |
| SMARTvector inducible shRNA targeting mouse PFKFB4 | Horizon Discovery | V3IMMHER_13710683, V3IMMHER_14783876 |
| SMARTvector Inducible Nontargeting hEF1a-TurboGFP (control 1) | Horizon Discovery | Cat# VSC11653 |
| pLenti ORF clone of Human ITGB3 tagged with mGFP | Origene | RC221606L4 |
| pLenti ORF clone of Human PFKFB4 tagged with myc-DDK | Origene | RC201573L3 |
| pLenti-luciferase-P2A-Neo | Xu et al., 201865 | Addgene #105621 |
| pLenti HRE-Luc pGK Hygro | Briggs et al., 201648 | Addgene #118706 |
| pMD2.G | Didier Trono Lab | Addgene #12259 |
| psPAX2 | Didier Trono Lab | Addgene #12260 |
|
| ||
| Software and algorithms | ||
|
| ||
| ImageJ v1.52a | https://imagej.nih.gov/ij/index.html | |
| Image Lab Software v6.0.1 | Bio-Rad | https://www.bio-rad.com/en-us/product/image-lab-software?ID=KRE6P5E8Z |
| Aperio ImageScope v12.4.3.7009 | Leica Biosystems | https://www.leicabiosystems.com/us/digital-pathology/manage/aperio-imagescope/ |
| Graphpad Prism v9.3.1 | GraphPad Software | https://www.graphpad.com/ |
| Leica Application Suite X v3.7.4.23463 | Leica Microsystems Inc. | https://www.leica-microsystems.com/products/microscope-software/p/leica-las-x-ls/downloads/ |
| Vevo LAZR | VisualSonics Inc. | https://www.visualsonics.com/product/imaging-systems/vevo-lazr |
| Living Image Software v4.7.3 | PerkinElmer | https://www.perkinelmer.com/lab-products-and-services/resources/in-vivo-imaging-software-downloads.html |
| FCS Express v7.14.0020 | De Novo Software | https://denovosoftware.com/ |
| QuantStudio Real-Time PCR Software v1.3 | Applied Biosystems | https://www.thermofisher.com/us/en/home/global/forms/life-science/quantstudio-6-7-flex-software.html |
EXPERIMENTAL MODEL AND SUBJECT DETAILS
Cell culture
Breast cancer cell line MDA-MB-231, MDA-MB-468, EMT6, and LM3.3 were cultured in DMEM (Gibco, Cat. No. 11965092) supplemented with 10% fetal bovine serum (FBS, Gibco, Cat. No. 16140071), 1% penicillin (100 units/mL), 1% streptomycin (100 μg/mL) and 1% amphotericin B (0.25 μg/mL) (Gibco, Cat. No. 15240062). Mouse mammary cell line 4T1 was cultured in RPMI-1640 supplemented with 10% fetal bovine serum, 1% penicillin, 1% streptomycin and 1% amphotericin B. All cell lines were maintained in 37°C with 5% CO2 unless otherwise stated. All cell lines were mycoplasma-free confirmed by MycoAlert Mycoplasma Detection Kit (Lonza, Cat. No. LT07–318). For hypoxic stress, cells were transferred to hypoxia incubator (BioSpherix Xvivo System) with 1% O2 and 5% CO2 for indicated timepoints.
Animal studies
All animal experiments were carried out in accordance with 1391M protocol approved by the Roswell Park Institutional Animal Care and Use Committee. LM3.3 cells used for animal experiments were stably expressing doxycycline inducible shPFKFB4 or shNT and were never exposed to doxycycline prior to implantation. Two million (2 × 10⁶) tumor cells were injected orthotopically into #4 mammary fat pad of 6–8 weeks old female CB-17 SCID mice (Roswell Park in-house). The mammary tumor length (L) and width (W) were measured by caliper and the tumor volume was calculated as L x W x W/2. Once the mammary tumor size reached around 200–300 mm3, doxycycline was administered to the mice through the water bottle (2 mg/mL) till the study endpoint. One-week after doxycycline treatment, the primary tumors were surgically removed. Animals were monitored for distant metastasis by non-invasive bioluminescence imaging system (PerkinElmer, IVIS Spectrum). Two-weeks after the primary tumor resection, the mice were euthanized and ex vivo bioluminescence imaging was performed to identify the distant metastatic sites. Evans blue lymph node mapping was performed 1-h prior to euthanasia to visualize inguinal and axillary lymph nodes.29
4T1 cells used for animal experiment were transduced with lentiviral vector expressing doxycycline inducible shNT-GFP or shPFKFB4-RFP. Cells that have high GFP or RFP expression upon doxycycline treatment were sorted out for mouse experiment. Equal number of shNT-GFP (5 × 10⁴) and shPFKFB4-GFP (5 × 10⁴) cells were pre-mixed before implanting orthotopically into #4 mammary fat pad of 6–8 weeks old female CB-17 SCID mice. The mice were randomly split into three groups where they received doxycycline diet (2000 mg/kg) for 14, 7 or 2 days before surgical primary tumor resection at day 20. Primary tumors were frozen and stored in −80°C till being used for immunohistochemistry. The mice continuously received doxycycline for another 14 days before being euthanized. Lungs were harvested and stored for immunohistochemistry.
Human breast tumor samples
The breast cancer tissue microarrays (TMAs) were obtained from Roswell Park Comprehensive Cancer Center according to the Institutional Research Board approved protocol BDR099518. Clinical Data Delivery and Honest Broker services for this study were provided by Roswell Park Biomedical Data Science Shared Resource. PFKFB4 Antibody (Abcam, Cat. No. ab137785) at 1/100 was used for staining. Quantification of cytoplasmic and nuclear PFKFB4 staining was conducted by Roswell Park Pathology Network Shared Resource. See method details for additional information about immunohistochemical staining and quantification.
METHOD DETAILS
Analysis of breast cancer patient cohort
The primary breast cancer cohort from The Cancer Genome Atlas (TCGA)66 was downloaded through cBioportal (TCGA provisional),67,68 and primary breast cancer cohort GSE2165369 and metastatic breast cancer cohort GSE11059070 were downloaded from Gene Expression Omnibus (GEO). TCGA and GSE21653 contained gene expression data from 1091 to 252 primary breast cancer tissues of different subtypes, respectively. GSE110590 includes 16 primary tumors and 67 matched metastatic tumors. Since all the patients analyzed in this study were from de-identified publicly available cohorts, approval from institutional review board was waived, and informed consent were obtained by the researchers of the original publications. Using identified 32 differential expressed genes, PFKFB4 signature score was calculated by adding up 18 upregulated gene expressions and subtracting 14 downregulated gene expressions. In TCGA and GSE21653 cohorts, survival analyses were performed using a median cut point of either PFKFB4 expression or PFKFB4 signature score. Gene set enrichment analysis (GSEA) was conducted comparing high and low PFKFB4 signature score for TNBC patients in TCGA using software provided by the Broad Institute (http://software.broadinstitute.org/gsea/index.jsp). Gene sets queried included Hallmark and KEGG available through the Molecular Signatures Database.71
Vectors and lentiviral production
Transfection of plasmid was performed using Lipofectamine 2000 (Invitrogen, Cat. No. 11668500) into HEK-293T cells along with pMD2.G (Addgene, Cat. No. 12259) and psPAX2 (Addgene, Cat. No. 12260).72,73 The viral supernatants were harvested after 48–72 h followed by precipitation using PEG-it Virus Precipitation Solution (System Biosciences). Lentiviruses were transduced into the indicated cell lines with Polybrene (Sigma, Cat. No. TR-1003-G). Cells stably expressing vectors were selected in the presence of antibiotics for more than 3 passages before being used for functional assays.
RNA-sequencing
RNA extraction for RNA-sequencing
The purification of total RNAs were prepared using the miRNeasy mini kit (Qiagen). Cell pellets were lysed using 700 μL of Qiazol reagent. After addition of chloroform, the homogenate was then separated into aqueous and organic phases by centrifugation. The upper, aqueous phase was extracted, and ethanol was added to provide appropriate binding conditions for all RNA molecules from 18 nucleotides upwards. The sample was then applied to the miRNeasy Mini spin column, where the total RNA binds to the membrane and phenol and other contaminants were efficiently washed away. On-column DNase digestion was also performed to remove any residual genomic DNA contamination followed by additional washes. High quality RNA is then eluted in 60 μL of Rnase-free water.
Quantitative assessment of the purified total RNA was then accomplished by using a Qubit Broad Range RNA kit (Thermofisher), and concentration was determined by Ribogreen fluorescent binding to isolated RNA. The RNA was further evaluated qualitatively using RNA Nanotape on the 4200 Tapestation (Agilent technologies), where sizing of the RNA was determined, and a qualitative numerical score (RINe) was assigned.
RNA-sequencing
The sequencing libraries were prepared with the mRNA HyperPrep kit (Roche), from 500ng total RNA. Following manufacturer’s instructions, the first step selects for PolyA RNA using the mRNA Capture Beads (KAPA Biosystems). After PolyA selection, the remaining RNA was purified, fragmented and primed for cDNA synthesis. Fragmented RNA was then reverse transcribed into first strand cDNA using random primers. The next step removes the RNA template and synthesizes a replacement strand, incorporating dUTP in place of dTTP to generate ds cDNA. Pure Beads (Roche) were used to separate the ds cDNA from the second strand reaction mix resulting in blunt-ended cDNA. A single ‘A’ nucleotide was then added to the 3′ ends of the blunt fragments. Multiple indexing adapters, containing a single ‘T’ nucleotide on the 3′ end of the adapter, were ligated to the ends of the ds cDNA, preparing them for hybridization onto a flow cell. Adapter ligated libraries are amplified by PCR, purified using Pure Beads, and validated for appropriate size on a 4200 TapeStation D1000 Screentape (Agilent Technologies, Inc.). The DNA libraries were quantitated using KAPA Biosystems qPCR kit, and were pooled together in an equimolar fashion, following experimental design criteria. Each pool was denatured and diluted to 350pM with 1% PhiX control library added. The resulting pool was then loaded into the appropriate NovaSeq Reagent cartridge, as determined by the number of sequencing cycles desired, and sequenced on a NovaSeq6000 following the manufacturer’s recommended protocol (Illumina Inc.).
RNA-sequencing analyses
Raw feature counts were normalized and differential expression analysis was conducted using DESeq2.74 Differential expression rank order was utilized for subsequent Gene Set Enrichment Analysis (GSEA), performed using the clusterProfiler package in R. Gene sets queried included the Hallmark, Canonical pathways, and GO Biological Processes Ontology collections available through the Molecular Signatures Database (MsigDB).75
Immunohistochemistry (IHC) for animal studies
To prepare formalin-fixed paraffin-embedded sections for IHC, primary tumors, lymph nodes and distant organs were fixed in 10% formalin (Sigma, Cat. No. HT501320) for 24–48 h at room temperature (25°C). Fixed tissues were submitted to Roswell Park Pathology Network Shared Resource for paraffin-embedding, sectioning and hematoxylin and eosin (H&E) staining. Unstained sections were deparaffinized and rehydrated following standard protocol. Heat-induced antigen retrieval was conducted in citrate buffer (Vector Laboratories, Cat. No. H-3300) unless otherwise stated. Sections were then permeabilized, blocked with 2.5% goat serum (Vector Laboratories, Cat. No. S-1012) for 2 h at room temperature (25°C), incubated with primary antibodies overnight at 4°C followed by secondary antibodies for 1 h at room temperature (25°C). Sections were then processed with TrueVIEW Autofluorescence Quenching Kit (Vector Laboratories, Cat. No. SP-8400) to reduce the background following the manufacturer’s instruction and mounted in Anti-fade Mounting Medium with DAPI (Vector Laboratories, Cat. No. H-1800). All images were acquired by Leica TCS SP8 Laser Scanning Spectral Confocal Microscope housed in Roswell Park Flow and Image Cytometry Shared Resource or EVOS M5000 Imaging System (Invitrogen) unless otherwise stated.
To prepare frozen sections for IHC, lungs were fixed in 2.5% formalin (diluted in PBS) and other tissues were fixed in 10% formalin for 1 h at room temperature (25°C). Tissues were then saturated in 30% sucrose (Sigma, Cat. No. 84097) overnight at 4°C, embedded into Tissue-Tek O.C.T. Compound (Sakura Finetek, Cat. No. 4583) and frozen in liquid nitrogen. Frozen tissue blocks were cut into 10μm or 30μm-thick sections by Pathology Network Shared Resource. After being thawed and air-dried at room temperature (25°C), the sections were permeabilized in cold acetone bath for 20 min at 4°C and proceeded with standard IHC staining protocol.
IHC quantification for animal studies
IHC quantification was conducted by ImageJ. To quantify the staining intensity of PFKFB4 and Pimonidazole in the primary mouse tumors, a ‘‘Threshold’’ was first set up for each channel to remove the background and mask the positive signals. Next, we ‘‘Measure’’ the intensity of the pure signals from all the masking area. To acquire the cell count for each image, a mask with an automatic threshold was applied to DAPI channel, and ‘‘Analyze Particle’’ was run to count the number of nucleus (cells). The staining intensity of PFKFB4 and Pimonidazole per cell was calculated using the total signals in each channel divided by the number of nucleus (cells). At least three different tumors were analyzed for each group.
For the quantification of integrin β3 intensity in the metastatic lymph node, we first manually marked the tumor area (human HLA positive area) and applied the tumor area to the integrin β3 channel. The integrin β3 intensity per cell was calculated using the total signals from integrin β3 in the tumor area divided by the number of cells based on the DAPI counts as described before. Three fields were imaged and quantitated for each metastatic lymph node. Three metastatic lymph nodes were analyzed for each group.
To quantify the distribution of GFP and RFP positive cells in hypoxic or normoxic areas of tumors, we first manually marked the hypoxic area based on Pimonidazole staining and applied the hypoxic area to GFP and RFP channel. The rest of the area would be the normoxic area. We generated a mask using automatic threshold setting for GFP and RFP channel separately and acquired the cell count of GFP and RFP cells in hypoxic or normoxic area in each image. The cell count of GFP and RFP cells in each image was normalized based on the average cell size. For each tumor, the quantification was conducted from a large field merged from 5×5 images taken from confocal microscope under 20X magnification.
IHC of human breast tumor specimens
Formalin fixed paraffin sections were cut at 4 μm, placed on charged slides, and dried at 60°C for one hour. Slides were cooled to room temperature (25°C) and added to the Leica Bond Rx, where they were deparaffinized with Bond Dewax Solution (Leica, Cat. No. AR9222) and rinsed in water. Bond Epitope Retrieval 2(Leica, Cat. No. AR9640) was used for target retrieval for 30 min. Slides were blocked using peroxide block from Bond Polymer Refine Detection kit (Leica, Cat. No. DS9800) for 5 min. Slides were incubated with PFKFB4 Antibody (Abcam, Cat. No. ab137785) at 1/100 for 20 min followed by Rabbit Envision (Agilent, Cat. No. K4003) for 30 min. DAB (Diaminobenzidine) from the Bond Polymer Refine Detection kit (Leica, Cat. No. DS9800) was applied for 10 min for visualization. Slides were counterstained with Hematoxylin from the Bond Polymer Refine Detection kit (Leica, Cat. No. DS9800) for 8 min then placed into water. After removing slides from the Bond they were dehydrated, cleared, and coverslipped. Biospecimens or research pathology services for this study were provided by the Pathology Network Shared Resource.
Quantification of cytoplasmic and nuclear PFKFB4 staining
TMA and whole section slides were digitally scanned using Aperio Scanscope (Aperio Technologies, Inc., Vista, CA) with 20x brightfield microscopy. These images were accessible using Spectrum (Aperio Technologies, Inc., Vista, CA), a web-based digital pathology information management system. Once slides were scanned, Aperio ImageScope version 12.4.3.7009 (Aperio Technologies, Inc., Vista, CA) was used to view images for analysis. An annotation layer was created for each whole section slide and multiple areas of interest were circled using the free form pen tool. This annotation was used to define the region of interest for analysis. For TMA slides, an annotation layer was created for each core of interest in the TMA in order to target cells of interest for analysis. Regions were identified and annotated to appropriately represent the heterogeneity of staining of each TMA core or whole section and to reduce irrelevant regions from image analysis calculations.
The Aperio platform was used to develop quantitative image analysis algorithms for the quantification of immunohistochemistry (IHC) slides. Briefly, these algorithms use color de-convolution to separate diaminobenzidine (DAB) from the haematoxylin counterstain thereby providing stain separation. Each algorithm is tailored to fine-tune the cell feature detection using cellular, nuclear, and stain parameters, creating a specific macro based on the cell compartment location of each target protein. The algorithm was adjusted for each antibody target and tissue combination to optimize results.
A Cytoplasmic algorithm was used to create a macro for PFKFB4. The macro analyzes DAB staining intensity and the percentage of cells containing stain within the cytoplasm compartment. The analysis results provide total number of cells, percentage per scoring class, and H- Score. The H-score is a weighted index score derived from the average intensity of the staining of the cytoplasm according to the threshold intervals set in the algorithm. This score equals = 1*(%1+) + 2*(%2+) + 3*(%3+) with the score between 0 and 300, where 300 represents 100% of cells being 3+.
A Nuclear algorithm was also used to create a macro for PFKFB4. This macro detects the positive (DAB) nuclear staining for the individual tumor cells and quantifies their staining intensity. The analysis results provide the total number of detected cells, the percentage of cells per scoring class (0, 1+, 2+ and 3+) and the percentage of positive stained cells along with each sample’s average staining intensity of the positive nuclei as a score of 0, 1+, 2+ and 3+. The H-score was manually generated based on the same formula above.
A Cox proportional hazards model is fitted to test survival differences between high and low PFKFB4 H-score levels using a median cut point for Cytoplasmic and Nuclear data. Differences between H-score levels are examined accounting for several relevant factors like Stage, Grade, Subtypes, Age at Diagnosis and Pathologic Lymph Node Staging using a two-way ANOVA model. All statistical analyses were produced using R programming language (v 4.1.2). Kaplan-Meier survival curves were produced using survminer (v 0.4.9).
Quantitative Real-Time PCR (qPCR)
RNA was isolated using Rneasy Mini kit (Qiagen, Cat. No. 74106), followed by genomic DNA removal with TURBO DNA-free kit (Invitrogen, Cat. No. AM1907). cDNA was then synthesized using SuperScript VILO cDNA synthesis kit (Invitrogen, Cat. No. 11754250). Quantitative Real-Time PCR was conducted with PowerUp SYBR Green Master Mix (Invitrogen, Cat. No. A25741), with indicated primers (Table S2) using QuantStudio 6 Flex Real-Time PCR System (Applied Biosystems). Data were analyzed and quantified in QuantStudio Real-Time PCR software (Applied Biosystems).
Immunoblotting
Cells or tissues were lysed in RIPA lysis buffer (Thermofisher Scientific, Cat. No. 89900) supplemented with protease inhibitor (Sigma, Cat. No. 539131) and phosphatase inhibitor (Thermofisher Scientific, Cat. No. 78420) for 20 min on ice. Protein concentration was estimated using Micro BCA Protein Assay Kit (Thermofisher Scientific, Cat. No. 23235). Protein samples were then denatured with LDS Sample Buffer (Invitrogen, Cat. No. NP0008) and Reducing Agent (Invitrogen, Cat. No. NP0004), separated in NuPAGE Bis-Tris Gel (Invitrogen) and transferred onto nitrocellulose membrane through iBlot 2 Dry Blotting System (Invitrogen). The membrane was first blocked with 5% milk (Bio-Rad, Cat. No. 1706404) or 5% BSA (Sigma, Cat. No. A7906) for 1 h at room temperature (25°C), and then incubated with primary antibodies overnight at 4°C followed by HRP-conjugated secondary antibodies for 2 h at room temperature (25°C). Chemiluminescent signals were developed by supplying ECL Substrate (Thermofisher Scientific, Cat. No. 32132) and acquired by ChemiDoc Imaging System (Bio-Rad). The protein expression was quantitated based on the intensity of the protein of interest that normalized to that of β-actin using Image Lab Software (Bio-Rad).
Wound healing and Boyden chamber assays
For wound healing assay, cells were grown in 6-well plates under regular culture conditions till 100% confluency before scratches were made using sterile pipette tips. Cell debris was washed off and culture media with 1% fetal bovine serum was added to exclude the effects of cell proliferation. Images of baseline wounding area was then taken. After 16 h of incubation in normal cell culture incubator or hypoxia incubator, images were taken again. Baseline and remaining wounding areas were quantitated using ImageJ with MRI Wound Healing Tool Plugin.
For Boyden transwell assays, cells were resuspended in serum free media and seeded on the insert (8μm, Falcon, Cat. No. 08-771-21) for migration assay or insert with pre-coated Matrigel (8μm, Corning, Cat. No. 354480) for invasion assay. Media with 10% serum were added in the bottom well to serve as chemoattractant. After 16 h (migration assay) or 24 h (invasion assay), the non-migrating cells were removed from the upper surface of the insert using cotton swab, and the cells that migrated to the bottom of the insert were fixed in methanol and stained with Crystal Violet. Images were then taken, and the number of migrated cells were quantified based on the confluency estimate by EVOS M5000 microscopy (Invitrogen) or manual cell count. Fibronectin (FN) and vitronectin (VN) dependent cell migration assay was adapted from previous studies.33,34,36,38,39 Briefly, the bottom of the inserts (8μm, Falcon, Cat. No. 08-771-21) was coated with 10 μg/mL of FN (Gibco, Cat. No. 33016015) or 5 μg/mL of VN (Sigma, Cat. No. 5051) diluted in PBS overnight at 4°C. The inserts were then blocked with 1% BSA in PBS for 2 h at 37°C. FBS-free media were used in both the insert and the bottom well. Cells were seeded in the insert and allowed to migrate for 5 h for EMT6 cells and 8 h for LM3.3 cells before proceeding with standard fixation and staining protocol.
Targeted metabolomics
Mouse tumor samples were prepared and analyzed in the Roswell Park Comprehensive Cancer Center Bioanalytics, Metabolomics and Pharmacokinetics Shared Resource, using the MxP Quant 500 kit (Biocrates Life Sciences AG, Innsbruck, Austria) in accordance with the user manual. Breast tumor cells were incubated for 24 h in regular or hypoxic condition and given fresh media 1 h before harvest. Cells were washed with PBS once, snap frozen in liquid nitrogen and stored at −80°C. See experimental details below.
Metabolomics of LM3.3 tumors: around 50 mg frozen mouse tumor samples were weighed and homogenized in a ratio of 1 mg of tissue to 3 μL of solvent (85% ethanol and 15% 0.01 M phosphate buffer) using optimized setting on the Omni-Bead Ruptor 24 (Omni International, Kennesaw, GA). The homogenate was centrifuged to obtain a supernatant which was added to the plate. 10μL of each supernatant, quality control (QC) samples, blank, zero sample, or calibration standard were added on the filterspot (already containing internal standard) in the appropriate wells of the 96-well plate. The plate was then dried under a gentle stream of nitrogen. The samples were derivatized with phenyl isothiocyanate (PITC) for the amino acids and biogenic amines, and dried again. Sample extract elution was performed with 5 mM ammonium acetate in methanol. Sample extracts were diluted with either water for the HPLC-MS/MS analysis (1:1) or kit running solvent (Biocrates Life Sciences AG) for flow injection analysis (FIA)-MS/MS (50:1), using a Sciex 5500 mass spectrometer. Data was processed using MetIDQ software (Biocrates Life Sciences AG), and Limma for differential metabolite analysis. Metabolite Set Enrichment Analysis via MetaboAnalyst was performed using the differential metabolites from each of the analyses.
Metabolomics of EMT6 cells76: cells were harvested in methanol:water (50:50), sonicated, and mixed with ice-cold chloroform. The resulting homogenate was further mixed with ice-cold water and vortexed. The homogenate was incubated at −20°C for 20 min and centrifuged to partition the aqueous and organic layers. The aqueous and organic layers were separated and dried in an Automatic Environmental Speed Vac system (Thermo Fisher Scientific). The aqueous extract was reconstituted in ice-cold methanol:water (50:50) and filtered through 3 kDa molecular filter (Amicon Ultracel-3K Membrane, Millipore Corporation) remove proteins. The filtrate was dried in a speed vac and stored at −80°C until mass spectrometry analysis. Before mass spectrometry analysis, the dried extract was re-suspended in methanol:water (50:50) containing 0.1% formic acid and analyzed in multiple reaction monitoring (MRM) using Agilent QQQ LC-MS systems. Separation of TCA and glycolysis metabolites were performed using 5 mM ammonium acetate in water as buffer pH 9.9 (A), and 100% acetonitrile as buffer (B) using Luna 3 μM NH2 column (Phenomenex, Torrance, CA) and measured 6495 triple quadrupole mass spectrometer via ESI negative mode (Agilent Technologies, Santa Clara, CA). The Gradient used is as follows: 0–20 min-80% B (Flow rate 0.2mL/min); 20–20.10 min- 80% to 2% B; 20.10–25 min-2% B (Flow rate 0.3mL/min); 25–30 min 80% B (Flowrate 0.35mL/min); 30–35 min-80%B (Flow rate 0.4mL/min); 35–38 min 80% B (Flow rate 0.4mL/min); followed by re-equilibration at the end of the gradient to the initial starting condition 80% B at Flow rate of 0.2 mL/min. Separation and measurement of amino acids were performed using Zorbax eclipse XDB C-18, 1.8 micron, 4.6 × 100 mm column on 6495 triple quadrupole mass spectrometer via ESI Positive mode (Agilent Technologies, Santa Clara, CA). Mobile phases A and B were 0.1% formic acid in water and acetonitrile, respectively. The gradient used is as follows: 0 min-2% B; 6 min- 2% of B, 6.5 min-30% B, 7 min90% of B, 12 min 95% of B, 13 min 2% of B followed by re-equilibration at the end of the gradient 20 min to the initial starting condition 2% of B. Flow rate: 0.2 mL/min. Separation and measurement of CoA’s and carnitines were performed using Zorbax eclipse XDB C-18, 1.8 micron, 4.6 × 100 mm column on 6495 triple quadrupole mass spectrometer via ESI Positive mode (Agilent Technologies, Santa Clara, CA). Mobile phases A and B were 0.1% formic acid in water and acetonitrile, respectively. Gradient used is as follows: 0 min-2% B; 6 min- 2% of B, 6.5 min-30% B, 7 min- 90% of B, 12 min 95% of B,13 min 2% of B followed by re-equilibration at end of the gradient 20 min to the initial starting condition 2% of B. Flow rate: 0.2 mL/min. Separation and measurement of nucleotides were performed using Zorbax eclipse XDB C-18, 1.8 micron, 4.6 × 100 mm column on 6495 triple quadrupole mass spectrometer via ESI Positive mode (Agilent Technologies, Santa Clara, CA). Mobile phases A and B were 0.1% formic acid in water and acetonitrile, respectively. The gradient used is as follows: 0–6 min 2% B, 6–6.50 min 30% B, 7–12 min 95% B, 12–13 min 2% B, and re-equilibration till the end of the gradient 20 min. Flow rate: 0.2 mL/min). The data were normalized with internal standards, and log2 transformed on a per-sample, per-method basis. The data was processed using Limma for differential metabolite analysis. Metabolite Set Enrichment Analysis via MetaboAnalyst was performed using the differential metabolites from each of the analyses.
HRE-luc reporter assay
WT and PFKFB4-KO breast tumor cells were transduced with HRE-luc48 lentiviral vector (addgene, Cat. No. 118706) followed by antibiotic selection for 3 passages. Cells seeded for HRE-luc reporter assay were transiently transduced with shNT or shSRC-3 lentiviral vectors for 3 days and then incubated under normal culture condition or hypoxia (1%) for 24 h. After the incubation, cells were trypsinized, counted and seeded in white 96 well plate (4 × 10⁴ cells). The bioluminescent signals were developed by Luciferase Assay System (Promega, Cat. No. E8110) and measured by plate reader (BioTek) following the manufacturer’s protocol.
Photoacoustic imaging with co-registered ultrasound
Photoacoustic imaging (PAI) with co-registered ultrasound (US) was performed using the Vevo® LAZR imaging system with a 21 MHz transducer containing built in fiber-optics (Vevo® LAZR; VisualSonics Inc., Toronto).77,78 Prior to imaging, animals were depilated, anesthetized (2.5% Isoflurane; Benson Medical Industries, Markham, ON, Canada) and secured to the imaging platform. Quantification of oxygen saturation (sO2%) and total hemoglobin concentration (HbT) was performed by tracing a region of interest over the tumor on the US images using Vevo LAB (Ver 1.7.2). Color maps representing HbT and %sO2 were displayed using a color lookup table superimposed on to corresponding B-mode US images. sO2% and HbT measurements of corresponding skin surrounding the tumors were used as controls.
Targeted Amplicon Sequencing
The sequencing libraries were prepared using a two-step PCR method targeting approximately 300bp surrounding the genomic variants of interest. Primers targeting the genomic regions were designed using Primer3 software (http://bioinfo.ut.ee/primer3-0.4.0/) and forward and reverse adaptor sequence were added to the primers (Table S3) which are necessary for the second round PCR amplification step. The first round PCR utilized a gradient annealing temperature which decreased by 1°C per cycle from 68°C to 58°C followed by 25 cycles with a 57°C annealing temperature and 72°C extension and 94°C denature steps. 12.5 ng of genomic DNA was used to amplify each of the target regions. After purification with AMPureXP beads (Beckman Coulter) and analysis on a Tapestation DNA1000 screentape (Agilent) which ensures desired target size, the amplicons from the same sample are normalized and pooled to a total of 15ng using quantitation data from the Tapestation. The amplicon pool from the first round PCR is amplified with 8 cycles of PCR using the Nextera Index Kit (Illumina Inc.), which uses primers that target the overhang adaptor sequence incorporated during the first round of PCR to add a unique indexed tag to each sample which allows pooling of libraries and multiplex sequencing. Indexed libraries were purified with AMPureXP beads, run on a Tapestation DNA1000 screentape to verify desired size distribution, quantified by KAPAqPCR (KAPA Biosystems) and pooled equal molar in a final concentration of 4 nM. 2 × 250 cycle sequencing is performed on a MiSeq (Illumina, Inc.), per manufacturer protocol. CRIS.py tool was used for analysis.79
Cellular fractionation
Breast tumor cells were incubated under normal cell culture condition or in hypoxia incubator (1% O2) for 24 h before fractionation. Cells were first washed with PBS. Hypotonic buffer (10 mM HEPES (pH = 7.9), 5 mM KCl and 1.5 mM MgCl2) with protease/phosphatase inhibitors was added onto the plate. Cells were scrapped, collected in a tube and incubated on ice for 10 min for cell membrane rupturing. The sample was centrifuged at 2000 rpm for 5 min at 4°C. Supernatant was collected as cytosolic fraction and the nuclear pellet was further processed. Isolated crude nuclei were washed in hypotonic buffer. Clean nuclei were then pelleted by centrifugation at 2000 rpm for 5 min at 4°C. The isolated nuclei were lysed with RIPA lysis buffer with protease/phosphatase inhibitors on ice for 20 min, followed by sonication for 6 s with 10% amplitude. Both cytosolic fraction and nuclear lysate were centrifuged at 16000g for 15 min at 4°C. Supernatants were collected for protein quantification and immunoblotting.
Immunoprecipitation (IP)
Cells were lysed in NP40 lysis buffer (ThermoFisher, Cat. No. FNN0021) with protease and phosphatase inhibitors on a rotator for one hour at 4°C. Protein lysates were then sonicated and centrifuged at 16000g for 10 min at 4°C. Supernatant was collected and subjected to BCA assay for protein concentration estimation. One mg of protein was used for each IP. Samples were pre-cleared with Protein G magnetic beads (ThermoFisher, Cat. No. 88848) on a rotator for one hour at 4°C. Pre-cleared samples were incubated with either mouse IgG (Sigma, Cat. No. 12–371) or SRC-3 antibody (BD Biosciences, Cat. No. 611105) on a rotator for 4 h at 4°C, followed by the addition of 25 μL Protein G magnetic beads and overnight incubation at 4°C. Beads were washed with TBST (25mM Tris, 150mM NaCl and 0.05% Tween) for 3 times and subjected to protein denaturing and immunoblotting.
Immunofluorescence (IF)
Cells were seeded on a coverslip in 24-well tissue culture plate and incubated in regular cell culture incubator or hypoxia incubator for 24 h. Cells were first fixed with 10% buffered formalin for 10 min at room temperature (25°C) and then permeabilized with PBST (PBS with 0.25% Triton X-100) for 30 min at room temperature (25°C). Cells were blocked with 2.5% goat serum (Vector Labs, Cat. No. S-1012), followed by overnight incubation with PFKFB4 antibody (1:300, Abcam, Cat. No. 137785). Cells were then incubated with fluorochrome-conjugated secondary antibody (1:750, Thermofisher) and mounted in Anti-fade Mounting Medium with DAPI (Vector Laboratories, Cat. No. H-1800).
NADPH assay
Cells were counted and seeded in 96-well tissue culture plate and incubated at 1% O2 hypoxia for 24 h before the assay. NADPH was measured by NADP/NADPH-Glo Assay Kit (Promega) following the manufacturer’s instructions. Briefly, cells were first lysed, and the lysates were heated in basic solution to selectively destroy NADP+. NADPH was then measured through coupled enzymatic reactions that generate bioluminescent signal. Standard curve of NADPH was used to measure the absolute concentration of NADPH. NADPH level was normalized to the number of cells seeded in 96-well plate.
QUANTIFICATION AND STATISTICAL ANALYSIS
Statistical analyses were performed in consultation with Roswell Park Biostatistics Shared Resource. All experiments were repeated in at least three biological replicates. Unless otherwise indicated, all results were represented as mean ± SD, and comparisons between groups were analyzed by two-tailed Student’s t-test, one-way or two-way ANOVA with appropriate corrections. In all cases, p < 0.05 was considered statistically significant.
Supplementary Material
Highlights.
Hypoxic TNBC microenvironment induces metabolic enzyme PFKFB4
PFKFB4 activates invasive phenotype by transcriptional activation of integrin β3
Activation of PFKFB4 promotes metabolic rewiring by increasing glutathione levels
Hypoxia localizes PFKFB4 to the nucleus, creating genetic and metabolic plasticity
ACKNOWLEDGMENTS
We would like to thank the shared resource facilities at Roswell Park Comprehensive Cancer Center supported by NCI P30CA16056: Genomics, Bio-analytics Metabolomics & Pharmacokinetics (BMPK), Flow and Image Cytometry, Laboratory Animal Facility, Pathology, Biomedical Research Informatics, Biostatistics and Bioinformatics, and Translational Imaging Shared Resource. We would like to thank Vivek Anand and Malachi Blundon for their help on this project, Hannah Fay and Marianna Giorgi for their kind help with in vitro hypoxia experiments, and Abu Hena Mostafa Kamal and Nagireddy Putluri from Baylor College of Medicine for metabolomics analysis (CPRIT RP170005 and NIH P30 CA125123). This work was primarily supported by Susan G. Komen Career Catalyst Research Award (CCR18547413), funds from NIH (DP2CA260421 and R01CA252092), and Roswell Park Alliance Foundation to S.D.; Predoctoral Fellowship from Breast Cancer Coalition of Rochester to T.D.; NIH U24CA232979 to S.L.; and NIH S10OD010393-01 and S10OD016450-01 to M.S.
Footnotes
SUPPLEMENTAL INFORMATION
Supplemental information can be found online at https://doi.org/10.1016/j.celrep.2022.111756.
DECLARATION OF INTERESTS
S.L. serves on the Scientific Advisory Board of 20n Bio, and S.D. holds equity in Coactigon Inc.
INCLUSION AND DIVERSITY
One or more of the authors of this paper self-identifies as an underrepresented ethnic minority in science.
REFERENCES
- 1.Lambert AW, Pattabiraman DR, and Weinberg RA (2017). Emerging biological principles of metastasis. Cell 168, 670–691. 10.1016/j.cell.2016.11.037. [DOI] [PMC free article] [PubMed] [Google Scholar]
- 2.Fares J, Fares MY, Khachfe HH, Salhab HA, and Fares Y (2020). Molecular principles of metastasis: a hallmark of cancer revisited. Signal Transduct. Target. Ther 5, 28. 10.1038/s41392-020-0134-x. [DOI] [PMC free article] [PubMed] [Google Scholar]
- 3.Faubert B, Solmonson A, and DeBerardinis RJ (2020). Metabolic reprogramming and cancer progression. Science 368, eaaw5473. 10.1126/science.aaw5473. [DOI] [PMC free article] [PubMed] [Google Scholar]
- 4.Vaupel P, and Mayer A (2007). Hypoxia in cancer: significance and impact on clinical outcome. Cancer Metastasis Rev 26, 225–239. 10.1007/s10555-007-9055-1. [DOI] [PubMed] [Google Scholar]
- 5.Rankin EB, and Giaccia AJ (2016). Hypoxic control of metastasis. Science 352, 175–180. 10.1126/science.aaf4405. [DOI] [PMC free article] [PubMed] [Google Scholar]
- 6.Nobre AR, Entenberg D, Wang Y, Condeelis J, and Aguirre-Ghiso JA (2018). The different routes to metastasis via hypoxia-regulated programs. Trends Cell Biol 28, 941–956. 10.1016/j.tcb.2018.06.008. [DOI] [PMC free article] [PubMed] [Google Scholar]
- 7.Kotowski K, Rosik J, Machaj F, Supplitt S, Wiczew D, Jabłońska K, Wiechec E, Ghavami S, and Dzięgiel P (2021). Role of PFKFB3 and PFKFB4 in cancer: genetic basis, impact on disease development/progression, and potential as therapeutic targets. Cancers 13, 909. 10.3390/cancers13040909. [DOI] [PMC free article] [PubMed] [Google Scholar]
- 8.Pilkis SJ, Claus TH, Kurland IJ, and Lange AJ (1995). 6-Phospho-fructo-2-kinase/fructose-2, 6-bisphosphatase: a metabolic signaling enzyme. Annu. Rev. Biochem 64, 799–835. 10.1146/annurev.bi.64.070195.004055. [DOI] [PubMed] [Google Scholar]
- 9.Rider MH, Bertrand L, Vertommen D, Michels PA, Rousseau GG, and Hue L (2004). 6-phosphofructo-2-kinase/fructose-2, 6-bisphosphatase: head-to-head with a bifunctional enzyme that controls glycolysis. Bio-chem. J 381, 561–579. 10.1042/bj20040752. [DOI] [PMC free article] [PubMed] [Google Scholar]
- 10.Okar DA, Manzano A, Navarro-Sabaté A, Riera L, Bartrons R, and Lange AJ (2001). PFK-2/FBPase-2: maker and breaker of the essential biofactor fructose-2, 6-bisphosphate. Trends Biochem. Sci 26, 30–35. 10.1016/s0968-0004(00)01699-6. [DOI] [PubMed] [Google Scholar]
- 11.Ros S, Santos CR, Moco S, Baenke F, Kelly G, Howell M, Zamboni N, and Schulze A (2012). Functional metabolic screen identifies 6-phosphofructo-2-kinase/fructose-2, 6-biphosphatase 4 as an important regulator of prostate cancer cell survival. Cancer Discov 2, 328–343. 10.1158/2159-8290.Cd-11-0234. [DOI] [PubMed] [Google Scholar]
- 12.Dang CV (2012). Cancer cell metabolism: there is No ROS for the weary. Cancer Discov 2, 304–307. 10.1158/2159-8290.cd-12-0069. [DOI] [PubMed] [Google Scholar]
- 13.Ros S, Flöter J, Kaymak I, Da Costa C, Houddane A, Dubuis S, Griffiths B, Mitter R, Walz S, Blake S, et al. (2017). 6-Phosphofructo-2-kinase/fructose-2, 6-biphosphatase 4 is essential for p53-null cancer cells. Oncogene 36, 3287–3299. 10.1038/onc.2016.477. [DOI] [PubMed] [Google Scholar]
- 14.Li W, Cohen A, Sun Y, Squires J, Braas D, Graeber TG, Du L, Li G, Li Z, Xu X, et al. (2016). The role of CD44 in glucose metabolism in prostatic small cell neuroendocrine carcinoma. Mol. Cancer Res 14, 344–353. 10.1158/1541-7786.Mcr-15-0466. [DOI] [PMC free article] [PubMed] [Google Scholar]
- 15.Goidts V, Bageritz J, Puccio L, Nakata S, Zapatka M, Barbus S, Toedt G, Campos B, Korshunov A, Momma S, et al. (2012). RNAi screening in glioma stem-like cells identifies PFKFB4 as a key molecule important for cancer cell survival. Oncogene 31, 3235–3243. 10.1038/onc.2011.490. [DOI] [PubMed] [Google Scholar]
- 16.Gao R, Liu Y, Li D, Xun J, Zhou W, Wang P, Liu C, Li X, Shen W, Su W, et al. (2018). PFKFB4 promotes breast cancer metastasis via induction of hyaluronan production in a p38-dependent manner. Cell. Physiol. Biochem 50, 2108–2123. 10.1159/000495055. [DOI] [PubMed] [Google Scholar]
- 17.Chesney J, Clark J, Klarer AC, Imbert-Fernandez Y, Lane AN, and Telang S (2014). Fructose-2, 6-bisphosphate synthesis by 6-phosphofructo-2-kinase/fructose-2, 6-bisphosphatase 4 (PFKFB4) is required for the glycolytic response to hypoxia and tumor growth. Oncotarget 5, 6670–6686. 10.18632/oncotarget.2213. [DOI] [PMC free article] [PubMed] [Google Scholar]
- 18.Zhang H, Lu C, Fang M, Yan W, Chen M, Ji Y, He S, Liu T, Chen T, and Xiao J (2016). HIF-1alpha activates hypoxia-induced PFKFB4 expression in human bladder cancer cells. Biochem. Biophys. Res. Commun 476, 146–152. 10.1016/j.bbrc.2016.05.026. [DOI] [PubMed] [Google Scholar]
- 19.Feng C, Li Y, Li K, Lyu Y, Zhu W, Jiang H, and Wen H (2021). PFKFB4 is overexpressed in clear-cell renal cell carcinoma promoting pentose phosphate pathway that mediates Sunitinib resistance. J. Exp. Clin. Cancer Res 40, 308. 10.1186/s13046-021-02103-5. [DOI] [PMC free article] [PubMed] [Google Scholar]
- 20.Wang F, Wu X, Li Y, Cao X, Zhang C, and Gao Y (2021). PFKFB4 as a promising biomarker to predict a poor prognosis in patients with gastric cancer. Oncol. Lett 21, 296. 10.3892/ol.2021.12557. [DOI] [PMC free article] [PubMed] [Google Scholar]
- 21.Minchenko OH, Ochiai A, Opentanova IL, Ogura T, Minchenko DO, Caro J, Komisarenko SV, and Esumi H (2005). Overexpression of 6-phosphofructo-2-kinase/fructose-2, 6-bisphosphatase-4 in the human breast and colon malignant tumors. Biochimie 87, 1005–1010. 10.1016/j.biochi.2005.04.007. [DOI] [PubMed] [Google Scholar]
- 22.Wang Q, Zeng F, Sun Y, Qiu Q, Zhang J, Huang W, Huang J, Huang X, and Guo L (2018). Etk interaction with PFKFB4 modulates chemoresistance of small-cell lung cancer by regulating autophagy. Clin. Cancer Res 24, 950–962. 10.1158/1078-0432.Ccr-17-1475. [DOI] [PubMed] [Google Scholar]
- 23.Yao L, Wang L, Cao ZG, Hu X, and Shao ZM (2019). High expression of metabolic enzyme PFKFB4 is associated with poor prognosis of operable breast cancer. Cancer Cell Int 19, 165. 10.1186/s12935-019-0882-2. [DOI] [PMC free article] [PubMed] [Google Scholar]
- 24.Truong TH, Benner EA, Hagen KM, Temiz NA, Kerkvliet CP, Wang Y, Cortes-Sanchez E, Yang C-H, Trousdell MC, Pengo T, et al. (2021). PELP1/SRC-3-dependent regulation of metabolic PFKFB kinases drives therapy resistant ER+ breast cancer. Oncogene 40, 4384–4397. 10.1038/s41388-021-01871-w. [DOI] [PMC free article] [PubMed] [Google Scholar]
- 25.Cai YC, Yang H, Shan HB, Su HF, Jiang WQ, and Shi YX (2021). PFKFB4 overexpression facilitates proliferation by promoting the G1/S transition and is associated with a poor prognosis in triple-negative breast cancer. Dis. Markers 2021, 8824589. 10.1155/2021/8824589. [DOI] [PMC free article] [PubMed] [Google Scholar]
- 26.Cheung RA, Kraft AM, and Petty HR (2021). Relocation of phosphofructokinases within epithelial cells is a novel event preceding breast cancer recurrence that accurately predicts patient outcomes. Am. J. Physiol. Cell Physiol 321, C654–C670. 10.1152/ajpcell.00176.2021. [DOI] [PubMed] [Google Scholar]
- 27.Li D, Tang J, Gao R, Lan J, Shen W, Liu Y, Chen Y, Sun H, Yan J, Nie Y, and Luo N (2022). PFKFB4 promotes angiogenesis via IL-6/STAT5A/P-STAT5 signaling in breast cancer. J. Cancer 13, 212–224. 10.7150/jca.66773. [DOI] [PMC free article] [PubMed] [Google Scholar]
- 28.Sabatier R, Finetti P, Cervera N, Lambaudie E, Esterni B, Mamessier E, Tallet A, Chabannon C, Extra JM, Jacquemier J, et al. (2011). A gene expression signature identifies two prognostic subgroups of basal breast cancer. Breast Cancer Res. Treat [DOI] [PubMed] [Google Scholar]
- 29.Harrell MI, Iritani BM, and Ruddell A (2008). Lymph node mapping in the mouse. J. Immunol. Methods 332, 170–174. 10.1016/j.jim.2007.11.012. [DOI] [PMC free article] [PubMed] [Google Scholar]
- 30.Hamidi H, and Ivaska J (2018). Every step of the way: integrins in cancer progression and metastasis. Nat. Rev. Cancer 18, 533–548. 10.1038/s41568-018-0038-z. [DOI] [PMC free article] [PubMed] [Google Scholar]
- 31.Sloan EK, Pouliot N, Stanley KL, Chia J, Moseley JM, Hards DK, and Anderson RL (2006). Tumor-specific expression of alphavbeta3 integrin promotes spontaneous metastasis of breast cancer to bone. Breast Cancer Res 8, R20. 10.1186/bcr1398. [DOI] [PMC free article] [PubMed] [Google Scholar]
- 32.Zhao Y, Bachelier R, Treilleux I, Pujuguet P, Peyruchaud O, Baron R, Clément-Lacroix P, and Clézardin P (2007). Tumor alphavbeta3 integrin is a therapeutic target for breast cancer bone metastases. Cancer Res 67, 5821–5830. 10.1158/0008-5472.can-06-4499. [DOI] [PubMed] [Google Scholar]
- 33.Liu H, Radisky DC, Yang D, Xu R, Radisky ES, Bissell MJ, and Bishop JM (2012). MYC suppresses cancer metastasis by direct transcriptional silencing of αv and β3 integrin subunits. Nat. Cell Biol 14, 567–574. 10.1038/ncb2491. [DOI] [PMC free article] [PubMed] [Google Scholar]
- 34.Stefansson S, and Lawrence DA (1996). The serpin PAI-1 inhibits cell migration by blocking integrin αvβ3 binding to vitronectin. Nature 383, 441–443. 10.1038/383441a0. [DOI] [PubMed] [Google Scholar]
- 35.Simon KO, Nutt EM, Abraham DG, Rodan GA, and Duong LT (1997). The alphavbeta3 integrin regulates alpha5beta1-mediated cell migration toward fibronectin. J. Biol. Chem 272, 29380–29389. 10.1074/jbc.272.46.29380. [DOI] [PubMed] [Google Scholar]
- 36.Aznavoorian S, Stracke ML, Parsons J, McClanahan J, and Liotta LA (1996). Integrin alphavbeta3 mediates chemotactic and haptotactic motility in human melanoma cells through different signaling pathways. J. Biol. Chem 271, 3247–3254. 10.1074/jbc.271.6.3247. [DOI] [PubMed] [Google Scholar]
- 37.Welch DR, and Hurst DR (2019). Defining the hallmarks of metastasis. Cancer Res 79, 3011–3027. 10.1158/0008-5472.can-19-0458. [DOI] [PMC free article] [PubMed] [Google Scholar]
- 38.Desgrosellier JS, Barnes LA, Shields DJ, Huang M, Lau SK, Prévost N, Tarin D, Shattil SJ, and Cheresh DA (2009). An integrin αvβ3–c-Src oncogenic unit promotes anchorage-independence and tumor progression. Nat. Med 15, 1163–1169. 10.1038/nm.2009. [DOI] [PMC free article] [PubMed] [Google Scholar]
- 39.Kim S, Harris M, and Varner JA (2000). Regulation of integrin alpha vbeta 3-mediated endothelial cell migration and angiogenesis by integrin alpha5beta1 and protein kinase A. J. Biol. Chem 275, 33920–33928. 10.1074/jbc.M003668200. [DOI] [PubMed] [Google Scholar]
- 40.Kaelin WG Jr., and Ratcliffe PJ (2008). Oxygen sensing by metazoans: the central role of the HIF hydroxylase pathway. Mol. Cell 30, 393–402. 10.1016/j.molcel.2008.04.009. [DOI] [PubMed] [Google Scholar]
- 41.Semenza GL (2012). Hypoxia-inducible factors in physiology and medicine. Cell 148, 399–408. 10.1016/j.cell.2012.01.021. [DOI] [PMC free article] [PubMed] [Google Scholar]
- 42.Xia X, Lemieux ME, Li W, Carroll JS, Brown M, Liu XS, and Kung AL (2009). Integrative analysis of HIF binding and transactivation reveals its role in maintaining histone methylation homeostasis. Proc. Natl. Acad. Sci. USA 106, 4260–4265. 10.1073/pnas.0810067106. [DOI] [PMC free article] [PubMed] [Google Scholar]
- 43.Xia X, and Kung AL (2009). Preferential binding of HIF-1 to transcriptionally active loci determines cell-type specific response to hypoxia. Genome Biol 10, R113. 10.1186/gb-2009-10-10-r113. [DOI] [PMC free article] [PubMed] [Google Scholar]
- 44.Schödel J, Oikonomopoulos S, Ragoussis J, Pugh CW, Ratcliffe PJ, and Mole DR (2011). High-resolution genome-wide mapping of HIF-binding sites by ChIP-seq. Blood 117, e207–e217. 10.1182/blood-2010-10-314427. [DOI] [PMC free article] [PubMed] [Google Scholar]
- 45.Rich LJ, and Seshadri M (2016). Photoacoustic monitoring of tumor and normal tissue response to radiation. Sci. Rep 6, 21237. 10.1038/srep21237. [DOI] [PMC free article] [PubMed] [Google Scholar]
- 46.Samanta D, and Semenza GL (2017). Maintenance of redox homeostasis by hypoxia-inducible factors. Redox Biol 13, 331–335. 10.1016/j.redox.2017.05.022. [DOI] [PMC free article] [PubMed] [Google Scholar]
- 47.Dasgupta S, Rajapakshe K, Zhu B, Nikolai BC, Yi P, Putluri N, Choi JM, Jung SY, Coarfa C, Westbrook TF, et al. (2018). Metabolic enzyme PFKFB4 activates transcriptional coactivator SRC-3 to drive breast cancer. Nature 556, 249–254. 10.1038/s41586-018-0018-1. [DOI] [PMC free article] [PubMed] [Google Scholar]
- 48.Briggs KJ, Koivunen P, Cao S, Backus KM, Olenchock BA, Patel H, Zhang Q, Signoretti S, Gerfen GJ, Richardson AL, et al. (2016). Paracrine induction of HIF by glutamate in breast cancer: EglN1 senses cysteine. Cell 166, 126–139. 10.1016/j.cell.2016.05.042. [DOI] [PMC free article] [PubMed] [Google Scholar]
- 49.Zhu B, Zhang Q, Pan Y, Mace EM, York B, Antoulas AC, Dacso CC, and O’Malley BW (2017). A cell-autonomous mammalian 12 hr clock coordinates metabolic and stress rhythms. Cell Metab 25, 1305–1319.e9. 10.1016/j.cmet.2017.05.004. [DOI] [PMC free article] [PubMed] [Google Scholar]
- 50.Rueda OM, Sammut S-J, Seoane JA, Chin S-F, Caswell-Jin JL, Callari M, Batra R, Pereira B, Bruna A, Ali HR, et al. (2019). Dynamics of breast-cancer relapse reveal late-recurring ER-positive genomic subgroups. Nature 567, 399–404. 10.1038/s41586-019-1007-8. [DOI] [PMC free article] [PubMed] [Google Scholar]
- 51.Foulkes WD, Smith IE, and Reis-Filho JS (2010). Triple-negative breast cancer. N. Engl. J. Med 363, 1938–1948. 10.1056/NEJMra1001389. [DOI] [PubMed] [Google Scholar]
- 52.Jatoi I, Hilsenbeck SG, Clark GM, and Osborne CK (1999). Significance of axillary lymph node metastasis in primary breast cancer. J. Clin. Oncol 17, 2334–2340. 10.1200/jco.1999.17.8.2334. [DOI] [PubMed] [Google Scholar]
- 53.Godet I, Shin YJ, Ju JA, Ye IC, Wang G, and Gilkes DM (2019). Fate-mapping post-hypoxic tumor cells reveals a ROS-resistant phenotype that promotes metastasis. Nat. Commun 10, 4862. 10.1038/s41467-019-12412-1. [DOI] [PMC free article] [PubMed] [Google Scholar]
- 54.Quijano C, Trujillo M, Castro L, and Trostchansky A (2016). Interplay between oxidant species and energy metabolism. Redox Biol 8, 28–42. 10.1016/j.redox.2015.11.010. [DOI] [PMC free article] [PubMed] [Google Scholar]
- 55.Cheung EC, and Vousden KH (2022). The role of ROS in tumour development and progression. Nat. Rev. Cancer 22, 280–297. 10.1038/s41568-021-00435-0. [DOI] [PubMed] [Google Scholar]
- 56.Samanta D, and Semenza GL (2016). Serine synthesis helps hypoxic cancer stem cells regulate redox. Cancer Res 76, 6458–6462. 10.1158/0008-5472.can-16-1730. [DOI] [PubMed] [Google Scholar]
- 57.Sullivan LB, Gui DY, Hosios AM, Bush LN, Freinkman E, Vander Heiden MG, and Matthew G (2015). Supporting aspartate biosynthesis is an essential function of respiration in proliferating cells. Cell 162, 552–563. 10.1016/j.cell.2015.07.017. [DOI] [PMC free article] [PubMed] [Google Scholar]
- 58.Garcia-Bermudez J, Baudrier L, La K, Zhu XG, Fidelin J, Sviderskiy VO, Papagiannakopoulos T, Molina H, Snuderl M, Lewis CA, et al. (2018). Aspartate is a limiting metabolite for cancer cell proliferation under hypoxia and in tumours. Nat. Cell Biol 20, 775–781. 10.1038/s41556-018-0118-z. [DOI] [PMC free article] [PubMed] [Google Scholar]
- 59.Birsoy K, Wang T, Chen WW, Freinkman E, Abu-Remaileh M, and Sabatini DM (2015). An essential role of the mitochondrial electron transport chain in cell proliferation is to enable aspartate synthesis. Cell 162, 540–551. 10.1016/j.cell.2015.07.016. [DOI] [PMC free article] [PubMed] [Google Scholar]
- 60.Xu D, Shao F, Bian X, Meng Y, Liang T, and Lu Z (2021). The evolving landscape of noncanonical functions of metabolic enzymes in cancer and other pathologies. Cell Metab 33, 33–50. 10.1016/j.cmet.2020.12.015. [DOI] [PubMed] [Google Scholar]
- 61.Pan C, Li B, and Simon MC (2021). Moonlighting functions of metabolic enzymes and metabolites in cancer. Mol. Cell 81, 3760–3774. 10.1016/j.molcel.2021.08.031. [DOI] [PubMed] [Google Scholar]
- 62.Boukouris AE, Zervopoulos SD, and Michelakis ED (2016). Metabolic enzymes moonlighting in the nucleus: metabolic regulation of gene transcription. Trends Biochem. Sci 41, 712–730. 10.1016/j.tibs.2016.05.013. [DOI] [PubMed] [Google Scholar]
- 63.Li B, Qiu B, Lee DSM, Walton ZE, Ochocki JD, Mathew LK, Mancuso A, Gade TPF, Keith B, Nissim I, and Simon MC (2014). Fructose-1, 6-bisphosphatase opposes renal carcinoma progression. Nature 513, 251–255. 10.1038/nature13557. [DOI] [PMC free article] [PubMed] [Google Scholar]
- 64.Minn AJ, Gupta GP, Siegel PM, Bos PD, Shu W, Giri DD, et al. (2005). Genes that mediate breast cancer metastasis to lung. Nature 436, 518–524. [DOI] [PMC free article] [PubMed] [Google Scholar]
- 65.Xu Y, Milazzo JP, Somerville TDD, Tarumoto Y, Huang Y-H, Ostrander EL, Wilkinson JE, Challen GA, and Vakoc CRA (2018). TFIID-SAGA perturbation that targets MYB and suppresses acute myeloid leukemia. Cancer Cell 33, 13–28.e8. 10.1016/j.ccell.2017.12.002. [DOI] [PMC free article] [PubMed] [Google Scholar]
- 66.Cancer Genome Atlas Network (2012). Comprehensive molecular portraits of human breast tumours. Nature 490, 61–70. 10.1038/nature11412. [DOI] [PMC free article] [PubMed] [Google Scholar]
- 67.Gao J, Aksoy BA, Dogrusoz U, Dresdner G, Gross B, Sumer SO, Sun Y, Jacobsen A, Sinha R, Larsson E, et al. (2013). Integrative analysis of complex cancer genomics and clinical profiles using the cBioPortal. Sci. Signal 6, pl1. 10.1126/scisignal.2004088. [DOI] [PMC free article] [PubMed] [Google Scholar]
- 68.Cerami E, Gao J, Dogrusoz U, Gross BE, Sumer SO, Aksoy BA, Jacobsen A, Byrne CJ, Heuer ML, Larsson E, et al. (2012). The cBio cancer genomics portal: an open platform for exploring multidimensional cancer genomics data. Cancer Discov 2, 401–404. 10.1158/2159-8290.cd-12-0095. [DOI] [PMC free article] [PubMed] [Google Scholar]
- 69.Sabatier R, Finetti P, Cervera N, Lambaudie E, Esterni B, Mamessier E, Tallet A, Chabannon C, Extra JM, Jacquemier J, et al. (2011). A gene expression signature identifies two prognostic subgroups of basal breast cancer. Breast Cancer Res. Treat 126, 407–420. 10.1007/s10549-010-0897-9. [DOI] [PubMed] [Google Scholar]
- 70.Siegel MB, He X, Hoadley KA, Hoyle A, Pearce JB, Garrett AL, Kumar S, Moylan VJ, Brady CM, Van Swearingen AE, et al. (2018). Integrated RNA and DNA sequencing reveals early drivers of metastatic breast cancer. J. Clin. Invest 128, 1371–1383. 10.1172/jci96153. [DOI] [PMC free article] [PubMed] [Google Scholar]
- 71.Liberzon A, Birger C, Thorvaldsdóttir H, Ghandi M, Mesirov JP, and Tamayo P (2015). The Molecular Signatures Database (MSigDB) hallmark gene set collection. Cell Syst 1, 417–425. 10.1016/j.cels.2015.12.004. [DOI] [PMC free article] [PubMed] [Google Scholar]
- 72.Sawant Dessai A, Dominguez MP, Chen UI, Hasper J, Prechtl C, Yu C, Katsuta E, Dai T, Zhu B, Jung SY, et al. (2021). Transcriptional repression of SIRT3 potentiates mitochondrial aconitase activation to drive aggressive prostate cancer to the bone. Cancer Res 81, 50–63. 10.1158/0008-5472.can-20-1708. [DOI] [PMC free article] [PubMed] [Google Scholar]
- 73.Dasgupta S, Putluri N, Long W, Zhang B, Wang J, Kaushik AK, Arnold JM, Bhowmik SK, Stashi E, Brennan CA, et al. (2015). Coactivator SRC-2-dependent metabolic reprogramming mediates prostate cancer survival and metastasis. J. Clin. Invest 125, 1174–1188. 10.1172/jci76029. [DOI] [PMC free article] [PubMed] [Google Scholar]
- 74.Love MI, Huber W, and Anders S (2014). Moderated estimation of fold change and dispersion for RNA-seq data with DESeq2. Genome Biol 15, 550. 10.1186/s13059-014-0550-8. [DOI] [PMC free article] [PubMed] [Google Scholar]
- 75.Liberzon A, Subramanian A, Pinchback R, Thorvaldsdóttir H, Tamayo P, and Mesirov JP (2011). Molecular signatures database (MSigDB) 3.0. Bioinformatics 27, 1739–1740. 10.1093/bioinformatics/btr260. [DOI] [PMC free article] [PubMed] [Google Scholar]
- 76.Kornberg MD, Bhargava P, Kim PM, Putluri V, Snowman AM, Putluri N, Calabresi PA, and Snyder SH (2018). Dimethyl fumarate targets GAPDH and aerobic glycolysis to modulate immunity. Science 360, 449–453. 10.1126/science.aan4665. [DOI] [PMC free article] [PubMed] [Google Scholar]
- 77.Rich LJ, Damasco JA, Bulmahn JC, Kutscher HL, Prasad PN, and Seshadri M (2020). Photoacoustic and magnetic resonance imaging of hybrid manganese dioxide-coated ultra-small NaGdF4 nanoparticles for spatiotemporal modulation of hypoxia in head and neck cancer. Cancers 12, 3294. [DOI] [PMC free article] [PubMed] [Google Scholar]
- 78.Verma A, Rich LJ, Vincent-Chong VK, and Seshadri M (2018). Visualizing the effects of metformin on tumor growth, vascularity, and metabolism in head and neck cancer. J. Oral Pathol. Med 47, 484–491. 10.1111/jop.12705. [DOI] [PMC free article] [PubMed] [Google Scholar]
- 79.Connelly JP, and Pruett-Miller SM (2019). CRIS.py: a versatile and high-throughput analysis program for CRISPR-based genome editing. Sci. Rep 9, 4194. 10.1038/s41598-019-40896-w. [DOI] [PMC free article] [PubMed] [Google Scholar]
Associated Data
This section collects any data citations, data availability statements, or supplementary materials included in this article.
Supplementary Materials
Data Availability Statement
RNA-seq data have been deposited at Gene Expression Omnibus (GEO). It is publicly available as of the date of publication. Accession numbers are listed in the key resources table. Microscopy data reported in this paper will be shared by the lead contact upon request.
This paper does not report original code.
Any additional information required to reanalyze the data reported in this paper is available from the lead contact upon request.
KEY RESOURCES TABLE
| REAGENT or RESOURCE | SOURCE | IDENTIFIER |
|---|---|---|
| Antibodies | ||
|
| ||
| Rabbit polyclonal anti-PFKFB4 | Abcam | Cat# ab137785; RRID: AB_2722775 |
| Rabbit polyclonal anti-PFKFB4 | Abnova | Cat# PAB4031; RRID: AB_1578645 |
| Rabbit polyclonal anti-PFKFB4 | Sino Biological | Cat# 202954-T36 |
| Rabbit polyclonal anti-LYVE1 | Abcam | Cat# ab14917; RRID: AB_301509 |
| Mouse monoclonal anti-Ki-67 (clone MIB-1) | Agilent Dako | Cat# M7240; RRID: AB_2142367 |
| Rabbit monoclonal anti-Integrin β3 (clone D7X3P) | Cell Signaling Technology | Cat# 13166; RRID: AB_2798136 |
| Mouse monoclonal anti-pimonidazole (clone 4.3.11.3) | Hypoxyprobe | Cat# HP1-1000Kit; RRID: AB_2811309 |
| Mouse monoclonal anti-β-actin (clone AC-15), peroxidase conjugate | Sigma-Aldrich | Cat# A3854; RRID: AB_262011 |
| Mouse monoclonal anti-AIB-1 (clone 34/AIB-1) | BD Biosciences | Cat# 611105; RRID: AB_2151198 |
| Mouse monoclonal anti-HIF-1α (clone H1alpha67) | Novus Biologicals | Cat# NB100-105; RRID: AB_10001154 |
| Rabbit monoclonal anti-HIF-1α (clone D1S7W) | Cell Signaling Technology | Cat# 36169; RRID: AB_2799095 |
| Rabbit polyclonal anti-Lamin A/C | Cell Signaling Technology | Cat# 2032S; RRID: AB_2136278 |
| Rabbit monoclonal β-Tubulin (clone 9F3) | Cell Signaling Technology | Cat# 2128S; RRID: AB_823664 |
| Anti-Rabbit IgG (H + L), HRP conjugate | Promega | Cat# W4011; RRID: AB_430833 |
| Anti-Mouse IgG (H + L), HRP conjugate | Promega | Cat# W4021; RRID: AB_430834 |
| Goat anti-rabbit, Alexa Fluor 488 conjugate | Invitrogen | Cat# A11008; RRID: AB_143165 |
| Donkey anti-mouse, Alexa Fluor 594 conjugate | Invitrogen | Cat# A21203; RRID: AB_141633 |
| Goat anti-rabbit, Alexa Fluor 594 conjugate | Invitrogen | Cat# A11012; RRID: AB_141359 |
| Goat anti-mouse, Alexa Fluor 488 conjugate | Invitrogen | Cat# A11001; RRID: AB_2534069 |
| Goat anti-rat, Alexa Fluor 647 conjugate | Invitrogen | Cat# A21247; RRID: AB_141778 |
| Goat anti-mouse, Alexa Fluor 568 conjugate | Invitrogen | Cat# A11031; RRID: AB_144696 |
| Goat anti-mouse, Alexa Fluor 405 conjugate | Invitrogen | Cat# A31553; RRID: AB_221604 |
| Normal mouse IgG | Sigma-Aldrich | Cat# 12-371; RRID:AB_145840 |
| Rabbit monoclonal anti-phospho-SRC-3 (Ser857) (Clone 10A6) | Cell Signaling Technology (Dasgupta et al., 2018)47 | Cell culture supernatant produced from hybridoma; Gift from Cell Signaling Technology |
|
| ||
| Biological samples | ||
|
| ||
| Human breast cancer tissue microarrays (TMAs) | RPCCC | N/A |
|
| ||
| Chemicals, peptides, and recombinant proteins | ||
|
| ||
| Doxycycline hyclate | Sigma-Aldrich | Cat# D9891 |
| Doxycycline diet (2000mg/kg) | Envigo | Cat# TD.09633 |
| Lipofectamine 2000 | Cat# 11668500 | |
| Polybrene Infection/Transfection Reagent | Thermo Fisher Scientific Sigma | Cat# TR1003G |
| Vitronectin | Sigma-Aldrich | Cat# 5051-0.1MG |
| Fibronectin Human Protein, Plasma | Thermo Fisher Scientific | Cat# 33016015 |
| Falcon™ Cell Culture Inserts, 8μm | Sigma-Aldrich | Cat# 08-771-21 |
| Corning® BioCoat® Matrigel® Invasion Chambers with 8.0 μm PET Membrane | Corning | Cat# 354480 |
| Protein Ladder | Thermo Fisher Scientific | Cat# LC5800 |
| Pierce™ ECL Plus Western Blotting Substrate | Thermo Fisher Scientific | Cat# 32132X3 |
| RIPA buffer | Thermo Fisher Scientific | Cat# 89900 |
| NP40 lysis buffer | Thermo Fisher Scientific | Cat# FNN0021 |
| Protease Inhibitor Cocktail Set I – Calbiochem | Sigma-Aldrich | Cat# 539131-10VL |
| Halt™ Phosphatase Inhibitor Cocktail | Thermo Fisher Scientific | Cat# 78427 |
| Micro BCA Protein Assay Kit | Thermo Fisher Scientific | Cat# 23235 |
| Acetone | Sigma-Aldrich | Cat# 179973-1L |
| 10% buffered formalin | Sigma-Aldrich | Cat# HT501320 |
| Sucrose | Sigma-Aldrich | Car# 84097 |
| Tissue-Tek O.C.T. Compound | Sakura Finetek | Cat# 4583 |
| Vector® TrueVIEW® Autofluorescence Quenching Kit | Vector Labs | Cat# SP-8400 |
| Antigen Unmasking Solution, Citrate-Based | Vector Labs | Cat# H-3300 |
| Normal Goat Serum Blocking Solution, 2.5% | Vector Labs | Cat# S-1012-50 |
| VectaMount Permanent Mounting Medium, 60 mL | Vector Labs | Cat# H-5000-60 |
| Vectashield vibrance with DAPI, mounting media | Vector Labs | Cat# H-1800-10 |
| Bond Dewax Solution | Leica | Cat# AR9222 |
| Bond Epitope Retrieval 2 | Leica | Cat# AR9640 |
| Bond Polymer Refine Detection kit | Leica | Cat# DS9800 |
| Rabbit Envision | Agilent | Cat# K4003 |
| D-luciferin, potassium salt | Goldbio | Cat# LUCK-1G |
| Matrigel™ Membrane Matrix | Corning | Cat# 354234 |
| Restore™ PLUS Western Blot Stripping Buffer | Thermo Fisher Scientific | Cat# 46430 |
| Protein G magnetic beads, 5mL | Thermo Fisher Scientific | Cat# 88848 |
| RNeasy Mini Kit | Qiagen | Cat# 74106 |
| TURBO DNA-free kit | Invitrogen | Cat# AM1907 |
| SuperScript VILO cDNA synthesis kit | Invitrogen | Cat# 11754250 |
| PowerUp™ SYBR™ Green Master Mix | Thermo Fisher Scientific | Cat# A25777 |
|
| ||
| Critical commercial assays | ||
|
| ||
| ONE-Glo™ EX Luciferase Assay System | Promega | Cat# E8110 |
| NADP/NADPH-Glo™ Assay | Promega | Cat# G9081 |
|
| ||
| Deposited data | ||
|
| ||
| RNA-seq data of WT and PFKFB4-KO cells | This paper | GEO: GSE217132 |
|
| ||
| Experimental models: Cell lines | ||
|
| ||
| Human: MDA-MB-468 cells | ATCC | HTB-132 |
| Human: MDA-MB-231 cells | ATCC | HTB-26 |
| Human: LM3.3 cells | Minn et al., 200564 | N/A |
| Mouse: EMT6 cells | ATCC | CRL-2755 |
| Mouse: 4T1 cells | ATCC | CRL-2539 |
| Human: HEK 293T cells | RPCCC Gene Modulation Services Shared Resource | N/A |
|
| ||
| Experimental models: Organisms/strains | ||
|
| ||
| Mouse: C.B-Igh-1b/IcrTac-Prkdcscid | RPCCC in-house | N/A |
|
| ||
| Oligonucleotides | ||
|
| ||
| Primers used for qPCR analysis, see Table S2 | Integrated DNA Technologies | N/A |
| Primers for Targeted Amplicon Sequencing, see Table S3 | Integrated DNA Technologies | N/A |
|
| ||
| Recombinant DNA | ||
|
| ||
| pLenti-U6-human PFKFB4 gRNA-Cas9-puro | CBASS Core at Baylor College of Medicine | N/A |
| pLenti-U6-mouse PFKFB4 gRNA-Cas9-puro | CBASS Core at Baylor College of Medicine | N/A |
| pLKO.1-puro-shRNA targeting human SRC-3 | Sigma-Aldrich | TRCN0000370321, TRCN0000365196 |
| pLKO.1-puro non-targeting shRNA | Sigma-Aldrich | SHC216 |
| pTRIPZ inducible shRNA targeting human PFKFB4 | Horizon Discovery | V3THS_378097, V3THS_378099 |
| SMARTvector inducible shRNA targeting mouse PFKFB4 | Horizon Discovery | V3IMMHER_13710683, V3IMMHER_14783876 |
| SMARTvector Inducible Nontargeting hEF1a-TurboGFP (control 1) | Horizon Discovery | Cat# VSC11653 |
| pLenti ORF clone of Human ITGB3 tagged with mGFP | Origene | RC221606L4 |
| pLenti ORF clone of Human PFKFB4 tagged with myc-DDK | Origene | RC201573L3 |
| pLenti-luciferase-P2A-Neo | Xu et al., 201865 | Addgene #105621 |
| pLenti HRE-Luc pGK Hygro | Briggs et al., 201648 | Addgene #118706 |
| pMD2.G | Didier Trono Lab | Addgene #12259 |
| psPAX2 | Didier Trono Lab | Addgene #12260 |
|
| ||
| Software and algorithms | ||
|
| ||
| ImageJ v1.52a | https://imagej.nih.gov/ij/index.html | |
| Image Lab Software v6.0.1 | Bio-Rad | https://www.bio-rad.com/en-us/product/image-lab-software?ID=KRE6P5E8Z |
| Aperio ImageScope v12.4.3.7009 | Leica Biosystems | https://www.leicabiosystems.com/us/digital-pathology/manage/aperio-imagescope/ |
| Graphpad Prism v9.3.1 | GraphPad Software | https://www.graphpad.com/ |
| Leica Application Suite X v3.7.4.23463 | Leica Microsystems Inc. | https://www.leica-microsystems.com/products/microscope-software/p/leica-las-x-ls/downloads/ |
| Vevo LAZR | VisualSonics Inc. | https://www.visualsonics.com/product/imaging-systems/vevo-lazr |
| Living Image Software v4.7.3 | PerkinElmer | https://www.perkinelmer.com/lab-products-and-services/resources/in-vivo-imaging-software-downloads.html |
| FCS Express v7.14.0020 | De Novo Software | https://denovosoftware.com/ |
| QuantStudio Real-Time PCR Software v1.3 | Applied Biosystems | https://www.thermofisher.com/us/en/home/global/forms/life-science/quantstudio-6-7-flex-software.html |