

Abstract
Higher order chromatin structure is important for regulation of genes by distal regulatory sequences 1,2. Structural variants that alter 3D genome organization can lead to enhancer-promoter rewiring and human disease, particularly in the context of cancer 3. However, only a small minority of structural variants are associated with altered gene expression 4,5, and it remains unclear why certain structural variants lead to changes in distal gene expression and others do not. To address these questions, we used a combination of genomic profiling and genome engineering to identify sites of recurrent changes in 3D genome structure in cancer and determine the effects of specific rearrangements on oncogene activation. By analyzing Hi-C data from 92 cancer cell lines and patient samples, we identified loci affected by recurrent alterations to 3D genome structure, including oncogenes such as MYC, TERT, and CCND1. Using CRISPR/Cas9 genome engineering to generate de novo structural variants, we show that oncogene activity can be predicted using “Activity-by-Contact” models that consider partner region chromatin contacts and enhancer activity. However, Activity-by-Contact models are only predictive of specific subsets of genes in the genome, suggesting that different classes of genes engage in distinct modes of regulation by distal regulatory elements. These results indicate that structural variants that alter 3D genome organization are widespread in cancer genomes and begin to illustrate predictive rules for the consequences of structural variants on oncogene activation.
Introduction
The 3-dimensional organization of the genome is a critical feature for gene regulation by distal enhancers 1,2,6. Recently, both germline and somatic mutations that alter 3D genome structure have been discovered that rewire enhancer-promoter communication and alter gene expression in human disease3, often termed “enhancer hijacking.” Such regulatory rewiring has long been recognized as a potential mechanism for activation of oncogenes in cancer 7,8 and has more recently been identified acting at genes such as IGF29, GFI110, TERT11, MECOM12, and TAL113 in specific cancer types. In addition, recent tools have been developed to directly identify enhancer hijacking events from Hi-C datasets in cancer genomes 14. Apart from structural mutations, trans-acting epigenetic rewiring has also been identified as a mechanism leading to the activation of PDGFRA15 and FGF416. Taken together, these observations suggest a growing recognition of enhancer hijacking as a mechanism for oncogene activation.
Despite our increasing appreciation of the role of structural variants in leading to enhancer hijacking, more recent studies have shown that, in fact, few structural variants actually lead to changes in nearby expression of genes. Specifically, studies examining highly rearranged “balancer” chromosomes in Drosophila or examining structural variants from thousands of patient tumor samples have shown that the vast majority of structural variants appear to have no discernable impact on expression of neighboring genes 4,5. As a result, it is currently unclear what distinguishes structural variants that lead to significant phenotypic consequences by changing nearby gene expression from those that do not.
To address these challenges, we generated Hi-C data for 58 cancer cell lines or patient samples and reanalyzed public Hi-C data for 34 cancer cell lines or patient samples. Using tools for identifying structural variants from Hi-C data, we have identified 4,543 SVs across all 92 samples. We also developed computational tools to classify whether rearrangements result in the formation of new TADs. We identify multiple loci affected by recurrent regulatory 3D genome alterations in diverse cancer types, including the MYC, TERT, and CCND1 genes. Examining structural variant data from patient whole genome sequencing studies, we observe that these loci are associated with an increased frequency of rearrangements between TADs and, in some cases, are associated with a worse prognosis.
We also analyzed patterns of RNA-seq data from patient samples associated with structural variants and observed that even at sites of recurrent structural variation, there were highly heterogeneous effects on the expression of nearby genes. To better understand the molecular basis for this, we used CRISPR/Cas9 technology to engineer structural variants de novo into cell lines. These experiments indicate that the likelihood of activation of an oncogene is associated with the “enhancer load” and 3D genome conformation of the partner region and can be predicted using models that integrate these features, such as “Activity-by-Contact” models. Critically, the expression of only a subset of genes is sensitive to these engineered rearrangements, and we observe that only a minority of genes in the genome show evidence of responsiveness to changes in their local enhancer landscape. These results indicate that alterations to gene regulatory 3D architecture are a critical mechanism that enables oncogene activation in cancer genomes and sheds light on the essential elements for such gene activation events.
Results
Discovery of SVs using Hi-C data
To study the effects of structural variation on 3D genome organization in cancer genomes, we generated Hi-C datasets for 58 cancer cell lines or primary patient tumor samples (48 cancer cell lines, 10 patient tumor samples) and combined these with 34 publicly available datasets (Fig. 1a) 5,17–25. Seventeen of the samples were from patient tumor samples, and the rest (75) were from cancer cell lines (Supplementary Table 1). The Hi-C libraries were sequenced such that the median sample contained 116 million contacts, sufficient for analyzing genomic features such as TADs and structural variants.
Figure 1. TAD fusion events from Hi-C data in cancer samples.
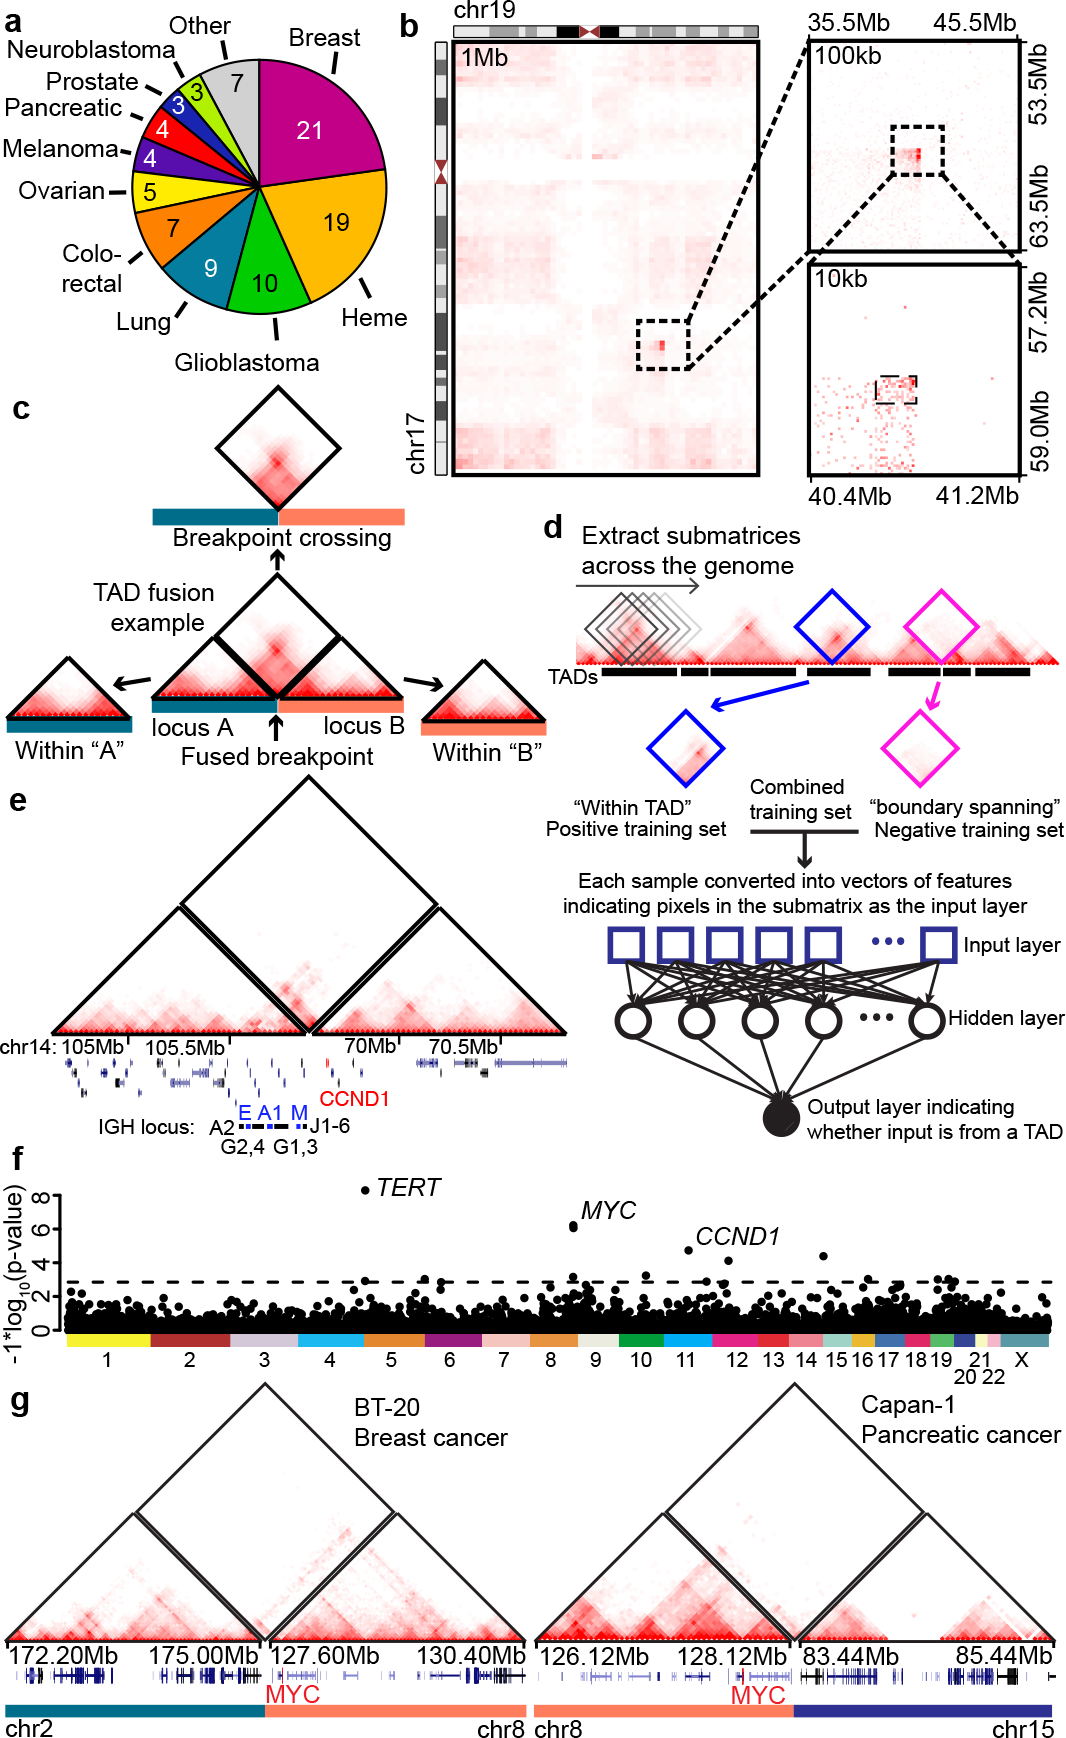
a, Tumor types represented in 92 cancer cell lines and patient tumor samples Hi-C datasets. b, Translocation between chromosomes 17 and 19 from a breast cancer patient tumor sample (C3–14_06). Translocations are first identified from chromatin interactions at low resolutions (1Mb, left heat map) and progressively refined at higher resolutions (right heat maps). c, Strategy of identifying TAD fusion events in rearranged genomes. An example TAD fusion event is between two otherwise distal loci (“locus A” and “locus B”). The chromatin interactions can be broken down into those that occur within the breakpoint proximal regions (triangle heat maps, “within A” or “within B”) and those that cross the breakpoint (diamond heat map). d, Neural network-based classifier for identifying TAD fusion events. “Diamond” matrices from non-rearranged regions within TADs or between TADs are used to train the neural network model. The model then classifies a diamond matrix from a structural variant as derived from a TAD or not. e, Hi-C data from an IGH-CCND1 fusion in the Granta cell line predicted to form a TAD fusion event. The left-hand triangle heat map shows interactions within chromosome 14, the right-hand triangle heat map shows interactions within chromosome 11, and the diamond heat map shows interactions crossing the breakpoint between chromosomes 11 and 14. IGH and CCND1 loci are marked at the bottom. f, P-value for the number of TAD fusion events for each TAD in the genome. The p-value is computed with a null model that considers the overall frequency of TAD fusion events and the size of each domain. The dashed line represents the threshold for an FDR of <20%. g, Examples of identified TAD fusion events at the MYC locus in two cell lines.
To identify structural variants that impact 3D genome structure, we utilized our recently developed method, hic-breakfinder17. As we and others have observed, the presence of SVs leads to large deviations in Hi-C data in the vicinity of the SV breakpoint (Fig. 1b) 17,19,26–29. This signal can be used to identify SVs from Hi-C data, although it is biased toward identifying large (>1Mb) SVs. We identified a total of 4,543 SVs at 10 kb resolution across all 92 samples (Supplementary Table 2), with a median of 33 SVs per sample (Extended Data Fig. 1a,b). To evaluate the sensitivity of our structural variant calls, we included 10 samples with known disease-defining translocations and were able to identify the known events in 10/10 samples (Extended Data Fig. 1c–e). We also evaluated sensitivity using fusion genes called from RNA-seq data30–32 and were able to identify 76% (16/21) of inter-chromosomal (rpkm > 1), and 60% (12/20) of large (>1Mb, rpkm >1) fusion genes. In summary, these results indicate that our Hi-C based SV call set is sensitive to large structural rearrangements across the samples we profiled.
We next examined the distribution of SVs in our dataset. We observed slightly more inter-chromosomal versus intra-chromosomal rearrangements (Extended Data Fig. 2a). However, a subset of samples showed markedly elevated frequencies of intra-chromosomal rearrangements (Extended Data Fig. 2b), reminiscent of complex chromosomal rearrangements such as chromothripsis or chromoplexy 33,34. We identified chromosomes affected by these focal rearrangements by comparing chromosome specific breakpoint occurrences with the genome wide frequency in a given sample (see methods for details). We identified 38 cases of chromosomes showing high-frequency rearrangement clusters in 34% of samples (32/92) (Extended Data Fig. 2c,d), similar to estimates of the frequency of chromothripsis derived from whole genome sequencing samples (29%) 35. For example, the SNU-C1 colon cancer cell line has been previously described as having a chromothripsis event on chromosome 15 36. We observed extensive rearrangement of the entire chromosome 15 of the SNU-C1 colon cancer cell (Extended Data Fig. 2e, upper-right) that is not present in other colon cancer samples (Extended Data Fig. 2e, lower left). In summary, we have assembled a large Hi-C dataset which provides a rich resource for the investigation of structural variants and 3D genome structure in cancer genomes.
Neural networks to identify TAD fusions
Having identified SVs from Hi-C data, we wanted to determine whether these events caused the formation of neo-TADs. Numerous computational tools have been described to identify TADs in Hi-C data 37, but they assume a contiguous linear genome and are unsuitable for rearranged genomes. Therefore, we designed a neural-network classifier to determine whether Hi-C data crossing a structural variant breakpoint forms a new TAD (Fig. 1c,d). This method is trained using non-rearranged regions of the genome based on annotations from standard TAD calling algorithms (Fig. 1d). Using cross-validation, we observed high accuracy (median = 93.5%) and low false discovery (median=6.15%) when applied to the 82 Hi-C datasets with sufficient coverage for TAD based analysis (Extended Data Fig. 2f).
We then applied the classifier across our Hi-C samples and classified 80.7% of structural variants as forming a TAD fusion event, indicating that most rearrangements create new breakpoints crossing TADs. This high frequency of TAD fusion events is consistent with fusion TADs forming by co-opting “loop extrusion”38 to fuse the nearest breakpoint proximal TAD boundaries into a neo-TAD. We next tested whether our method detects known instances of enhancer-hijacking events in our samples. In 5/5 Mantle cell lymphoma samples that contain known IGH-CCND1 rearrangements39, our classifier identified TAD fusion events at the CCND1 locus (Fig. 1e). Furthermore, we identified TAD fusion events at the TERT gene in one out of three neuroblastoma samples (SK-N-AS), consistent with the frequency of TERT rearrangements observed in patient samples (31%)11. Taken together, these results validate that our classifier can identify novel breakpoint crossing enhancer-gene interactions.
We observed that TAD fusion events are enriched for oncogenes (Extended Data Fig. 2g), suggesting that these events may be associated with functional consequences. We also observed that rearranged TADs are more likely to contain active enhancers and super-enhancers (Extended Data Fig. 2h–j). This does not appear to result from increased fragility, as double-strand break (DSB) sequencing40 shows no enrichment of DSBs in TADs containing super enhancers (Extended Data Fig. 2k). A possible explanation for these findings is that TAD fusion events that contain super-enhancers are more likely to induce altered gene expression and confer an oncogenic growth advantage if linked to pro-growth genes.
Recurrent TAD fusions in cancer genomes
Having identified TAD fusion events in cancer cell lines and patient samples, we tested whether any loci showed evidence of recurrent TAD fusions. TADs are largely conserved across cell types41,42, but some boundaries are cell type specific43. To account for cell type variable TAD boundaries, we identified TADs in five samples (human embryonic stem cells - hESCs44, DLD-1, HCC38, MV411, NCI-H1437) representing both non-malignant (hESC) and malignant samples from diverse tumor types. Taking the union of TAD boundaries across these five samples yielded a set of 5,450 domains (Extended Data Fig. 3a).
We then quantified the frequency of TAD fusions across 82 samples accounting for the genome-wide frequency of TAD fusions and domain size (see methods for details). We identified six loci showing recurrent TAD fusions under a false discovery rate (FDR) of 5% and 16 loci with evidence under an FDR of 20% (Fig. 1f, Extended Data Fig. 3b, Supplementary Table 2). Several well-known oncogenes are found within these TADs, including MYC, TERT, and CCND1. Collectively, 46% (38/82) of cell lines or patient samples have a TAD fusion at one of these 16 loci, suggesting that recurrent TAD fusion events are common in cancer genomes. These results also represent a baseline for the number of loci affected by 3D genome alterations, and studies with more extensive and diverse samples will likely detect additional loci.
MYC has been shown to contact numerous regulatory elements over a ~3Mb sized TAD45–47. In our merged TAD call set, this domain is split into four sub-domains (Extended Data Fig. 3c). Both the immediate upstream and downstream sub-TADs are enriched for rearrangements (upstream p=5.96×10⁻⁷, downstream p=8.7×10⁻⁷, permutation test). When considering the entire ~3Mb domain together, the locus surrounding MYC is most frequently affected in our dataset (20.7% or 17/82 samples). MYC is known to undergo copy number changes48, but most of the rearrangements we identified were not accompanied by high level (>6N) copy number changes (Extended Data Fig. 3d). Similarly, MYC is the target of rearrangements in hematopoietic malignancies49, but we observed TAD fusion events in diverse cancer types, including breast, osteosarcoma, neuroblastoma, lymphoma, and pancreatic cancer (Fig. 1g, Extended Data Fig. 3e,f). Together, these results indicate that TAD fusions affecting multiple well-known oncogenes are common in cancer genomes.
MYC Rearrangements in patient samples
Having identified loci with recurrent TAD fusion events in cancer cell lines, we tested whether these loci also show frequent rearrangements in 2,510 tumor samples profiled by the Pan-Cancer Analysis of Whole Genomes - International Cancer Genome Consortium (PCAWG-ICGC)50. As our Hi-C data suggested that most SVs between different TADs result in a TAD fusion, we focused our analysis on SVs where the two break ends map within different TADs (Fig. 2a). We quantified the frequency of rearrangements per TAD after lifting over the union TAD calls to the hg19 genome (15/16 successfully lifted over). We found 10/15 of these TADs show recurrent inter-TAD rearrangements in the PCAWG-ICGC data (FDR = 5% - Fig. 2a).
Figure 2. Inter-domain rearrangements in patient tumor samples.

a, The frequency of inter-TAD rearrangements among 2,510 patient samples for each of 5,384 domains across the genome (5,384/5,450 domains successfully lifted over to hg19 genome). Domains are sorted by size. The four sub-domains near the MYC gene are labelled in orange. The sub-domains immediately upstream (centromeric) or downstream (telomeric) of MYC are labelled “MYC-cen” and “MYC-tel”, respectively. Select domains are also labelled by gene names within each domain. Genes at known fragile sites are labelled with “*”, and genes at known high-frequency gene fusion events are labelled with “†”. Domains that show frequent TAD fusion events based on Hi-C data are shown in pink with the exception of the MYC-cen and MYC-tel domains. b, Expression level of the MYC gene based on RNA-seq in matched patient samples for tumors that do not contain inter-TAD rearrangements at the MYC TAD (“non-rearranged”) or that do contain inter-TAD rearrangements at the MYC locus (“MYC-rearranged”). Results are shown for all patients with matching structural variant and RNA-seq data (“Pan cancer”). P-value is from two-sided Wilcoxon rank sum test. c, Similar to B, but showing expression for specific tumor subsets (MALY-DE – Malignant Lymphoma; BRCA-US – breast cancer; UCEC-US – Endometrial cancer; OV-AU – Ovarian cancer; abbreviations based on Pan-cancer analysis of whole genomes naming conventions). P-value is from two-sided Wilcoxon rank sum test. d, Kaplan-Meier survival curves for patients in a Melanoma cohort (SKCM-US) separated into those with inter-TAD rearrangements at the MYC locus (purple, N=4) and those without (grey, N=34). P-value is from two-sided Cox Proportional Hazard model likelihood ratio test. e, Hi-C data over the TAD containing the MYC gene in H1 hESCs, GM12878 cells, and Mesenchymal stem cells (MSC). Shown below the tracks are ChIP-seq data for H3K27ac in each lineage.
Similar to our observations based on Hi-C data, the upstream and downstream sub-domains at the MYC locus were enriched for inter-TAD rearrangements (Fig. 2a), and the previously described single ~3Mb domain45 was frequently rearranged in diverse cancer types (Extended Data Fig. 4a). The overall frequency of rearrangements across the ~3Mb MYC domain (8.96%, 225/2510) is lower than the frequency observed in our Hi-C dataset (20.7%, 17/82), potentially reflecting differences in cell lines or tumor type. RNA-sequencing data from matched patient tumor samples showed that samples with rearrangements within the MYC domain have higher levels of MYC expression (Fig. 2b). Across all tumor types, the breakpoints for most (94.8%) inter-TAD rearrangements were distal (>10 kb) from the MYC transcription start site, including those associated with elevated MYC expression (Fig. 2b). MYC expression is elevated in different tumor types (Fig. 2c), indicating that the pan-cancer differences in expression are not due to a single affected tumor type.
MYC is frequently amplified in many tumor types 48, and we explored whether the changes in MYC expression could be explained by structural variants, copy number changes, or both. Samples with copy number gains of MYC are more likely to contain structural variants (Extended Data Fig. 4b), likely due to unbalanced translocations or tandem duplications. For samples that lack structural variants, MYC expression increases with increasing copy number, as expected based on “gene dosage”. However, samples containing structural variants display elevated MYC expression regardless of copy number (Extended Data Fig. 4c), suggesting that structural variants that rewire the MYC domain can lead to increased expression regardless of gene dosage. For example, MYC expression is still elevated in tumors that lack high-level amplifications (Extended Data Fig. 4d) and in tumors without any changes in copy number (Extended Data Fig. 4e). Further, some tumor types also show lower overall survival for patients with inter-TAD rearrangements at the MYC domain (Fig. 2d, Supplementary Table 3), indicating that these rearrangements may portend a worse prognosis.
Rearrangements can occur throughout the TAD surrounding MYC, including occurring more than 1Mb away from the MYC gene (Extended Data Fig. 4f). Examining Hi-C data from normal cell lines20,44, the MYC locus shows remarkable cell-type specific chromatin interactions with distal regulatory sequences for over 1–2Mb (Fig. 2e), potentially allowing the MYC to contact many distal regulatory sequences, as has been recently suggested45. This suggests that MYC may be uniquely susceptible to dysregulation by distal regulatory rearrangements.
Examining the partner regions of MYC, we found 285 unique partner TADs in the 225 patients containing inter-TAD rearrangements at the MYC locus. We did not observe any rearrangement partner in more than 5% of patient samples (Extended Data Fig. 4f, Supplementary Table 4), in contrast with what is known to occur in IGH-MYC rearrangements in lymphomas. The most frequently rearranged partners were immediately adjacent to the MYC domain, consistent with SVs occurring more frequently between regions in close spatial proximity51. The majority (223/285) of partner TADs are found in only one patient. These results indicate that while the MYC domain is highly enriched for inter-TAD rearrangements, these rearrangements are not dominated by specific partner regions. This regulatory re-wiring of the MYC locus, in addition to previously well described copy number amplifications and activation of endogenous MYC super-enhancers, represents multiple roads cancer cells will employ to activate the MYC gene.
Generation of de novo translocations
Genetic and cytogenetic features of tumors are frequently used to guide the staging, prognosis, and treatment of cancer patients52,53. However, it is challenging to determine whether an individual SV causes MYC activation as MYC expression is highly heterogeneous in samples with SVs in the MYC TAD (Fig. 2b), and we do not observe specific pan-cancer partner regions (Extended Data Fig. 4f, Supplementary Table 4). These observations, taken together with recent studies indicating that only a minority of structural variants are associated with changes in gene expression4,5, indicate that it is difficult to predict whether a given SV will drive MYC expression from genomic sequence alone. This limits our ability to predict whether a given SV will have a functional impact in an individual patient tumor sample.
To better understand what rearrangements induce MYC expression, we performed CRISPR/Cas9 engineering 54 to generate de novo translocations from diverse partner regions in a neuroblastoma cell line (SK-N-DZ) that lacks MYC expression (Extended Data Fig. 5a,b). We chose neuroblastoma cell lines for this analysis because we and others have shown that neuroblastoma cell lines that contain high levels of MYC expression have TAD fusions at the MYC locus, while lines that do not show MYC expression lack such events17,55.
We engineered 37 clonal cell lines containing translocations between the MYC locus and 15 distinct genomic loci (Fig. 3a,b). These were performed in two sets, a “test” set in wild-type SK-N-DZ cells and a “validation” set in an SK-N-DZ line where an mClover2 reporter was knocked into the 3’ end of the MYC gene. We included partner regions with a wide range of enhancer activities, including domains with weak enhancer activity and domains that contain super enhancers (Fig. 3c). We also included a partner domain in which a strong boundary separates the junction site and a super enhancer. We validated clones by breakpoint crossing PCR and Sanger sequencing (Extended Data Fig. 5c). We then confirmed that each clone contained a large-scale rearrangement using chromosome painting (Fig. 3b, Extended Data Fig. 5d) or directly from Hi-C experiments.
Figure 3. Engineered rearrangements and MYC gene activation.

a, Circos plot of engineered rearrangements. Rearrangements from the “test” set are red and the “validation” set are green. b, Chromosome painting confirming the presence of a large-scale rearrangement targeting chromosome 6. Chromosome 8 is in red and chromosome 6 is green. DNA is blue by DAPI staining. The parent SK-N-DZ cells do not show rearrangements between chromosome 8 and chromosome 6 (left), but translocated chromosomes are observed in the rearranged clones (right). Similar results were observed in a minimum of 20 nuclei for each clone. c, Enhancer activity across TADs in SK-N-DZ cells. Enhancers were identified as distal H3K27ac sites based on ChIP-seq data and summed across domains. Domains in the “test” set are in red, while domains in the “validation” set are in blue. d, Hi-C data from two engineered clones showing de novo TAD fusion events to chromosome 7 (left) and chromosome 12 (right). e, Expression of the MYC gene as measured by RNA-seq in wild-type and engineered SK-N-DZ cells. Clones with MYC not activated are colored grey while those with activated MYC are colored red and blue in test and validation set, respectively. f, Hi-C data showing an engineered TAD fusion event at the MYC locus between chromosome 8 and chromosome 1 (top) and between chromosome 8 and chromosome 12 (bottom). g, MYC RNA-seq expression in engineered clones shown in panel F. h, H3K27ac ChIP-seq signal over the partner region of the engineered rearrangements shown in panel F and G. i, Receiver operating characteristic (ROC) curves for four models of MYC activation. The area-under-curve (AUC) is also shown for each model. Integrated Enhancer Activity is calculated by summing all enhancers within 3Mb of MYC over the partner region of the engineered translocation.
To analyze the 3D genome structure changes in the rearranged clones, we performed Hi-C experiments in each engineered clone. Using our neural-network classifier, we observed that all cases were identified as TAD fusions (Fig. 3d). RNA-sequencing data showed over 500-fold differences in MYC expression levels between the least (SK-N-DZ chr7 clone #1 and chr7 clone #3) and most expressed clones (chr1 clone #1) (Fig. 3e), similar to the heterogeneity we observed in patient samples (Fig. 2b). We classified six partner regions as “MYC activating” and nine as non-activating by comparing MYC expression in replicate clones from the same partner region with the parental non-rearranged cell line (FDR 5%). MYC is expressed at lower levels in the engineered clones compared to cell lines that harbor endogenous MYC rearrangements. However, the strongest activated clones have MYC expression that is comparable to cell lines with endogenous MYC rearrangements (Extended Data Fig. 5e). The differences in MYC expression between clones cannot be explained by any changes in copy number of the MYC gene (Extended Data Fig. 5f), nor any changes in either copy number or expression of the paralog MYCN gene (Extended Data Fig. 5g, h). Therefore, we explored other possible reasons for the observed heterogeneity in MYC expression in the engineered clones.
We observed engineered rearrangements with markedly different levels of MYC expression showed large differences in the number and strength of distal H3K27ac peaks (Fig. 3f–h), suggesting that the partner region enhancer strength may be related to the heterogeneous effects of TAD fusions on MYC expression. To test if partner region enhancer activity contributed to MYC expression, we used an SK-N-DZ cell line where we introduced an mClover2 reporter into the 3’ end of MYC and engineered a translocation between chromosome 1 and the MYC locus on chromosome 8. As expected, these cells showed high levels of mClover2 expression (Extended Data Fig. 5i). We then deleted the strongest enhancer in the partner region and observed a reduction in mClover2 fluorescence (Extended Data Fig. 5j–l). We next isolated clonal cell lines harboring the enhancer deletion and determined which allele carried the deletion. Clones with the deletion on the MYC-translocated chromosome 1 allele have lower MYC expression than those with deletion on wild type chromosome 1 allele (Extended Data Fig. 5m). While the effects of the enhancer deletion were clear, they are also small, which could be due to either inefficient deletion of the enhancer by the paired gRNAs or due to additive effects of multiple enhancers across the partner region contributing to MYC expression.
ABC models of engineered rearrangements
Given that MYC expression depends on the translocated enhancers, we evaluated whether we could predict MYC activation based on the enhancer patterns in the partner region in the “test” set of engineered clones (Fig. 3e). The distance to the closest enhancer or super enhancer was a poor predictor (Area Under Curve (AUC)=0.25 or 0.182), while integrating the enhancer signal was a good predictor (Fig. 3i. AUC=0.864). Models based on the strongest enhancer performed better (Fig. 3i, AUC=0.932). However, since deleting the strongest enhancer resulted in only a partial reduction in mClover2 (Extended Data Fig. 5j–m), we reason that the strength of the strongest enhancer is not the primary determinant of MYC expression.
In examining our data, one engineered rearrangement where we placed a strong TAD boundary between the breakpoint and the nearest enhancers was potentially illustrative of the limitations of considering only enhancer activity (Fig. 4a). This rearrangement places a potent super enhancer (Fig. 4b) ~430kb downstream from the MYC gene. However, this rearrangement fails to induce MYC expression (Fig. 4c). This suggests that the enhancer strength and how frequently enhancers contact the MYC gene contribute to activation. As a result, we considered “Activity-by-Contact” (ABC) models56, where enhancer activity is integrated across the partner regions but weighted by the interaction frequency of the enhancer with the MYC promoter (Extended Data Fig. 6a). This ABC model showed improved predictability (Fig. 4d AUC=0.977). We also evaluated a TAD delimited version of the ABC model that showed similar results (Extended Data Fig. 6b).
Figure 4. Quantitative models of MYC expression in the context of engineered rearrangements.

a, Hi-C data of an engineered rearrangement between chromosome 8 and 10 where a strong TAD boundary is located immediately downstream from the breakpoint with a strong super-enhancer distal to the TAD boundary. Below the track is the H3K27ac ChIP-seq signal. An asterisk marks the location of the strong super-enhancer. b, Scatter plot of ranked enhancer strength as measured by H3K27ac ChIP-seq. The super-enhancer downstream from the TAD boundary shown in panel A is highlighted in red. c, MYC expression in engineered clones. The light blue “boundary” clone is the event shown in panel A, while the other clones are instances where MYC shows significant upregulation compared to the parent wild-type SK-N-DZ cell line. d, ROC curve for the Activity-By-Contact (ABC) model. e, Scatter plot of the ABC score compared to MYC expression as measured by RNA-seq (reads per kilobase per million reads sequenced – RPKM). f, Predicted (left) and observed (right) contact maps resulting from an engineered translocation between chromosome 6 and 8. g, ROC curve for an ABC model where contacts are replaced by “predicted” contact frequency from the Orca deep learning model. h, Bar plots showing the Area-Under-Curve (AUC) for the test set of engineered rearrangements (top) for different predictive models of MYC activation as well as the classification accuracy of each model on the “validation” set of engineered rearrangements. The score for the “validation” set was chosen as the cut-off from the test set with the highest classification accuracy.
While ABC models are good predictors of MYC activation, these models still have limitations. First, while ABC models can determine whether MYC is activated, they are not strong predictors of the absolute expression level (Figure 4e, Pearson’s correlation = 0.48). A second limitation is that we use experimentally measured Hi-C contact patterns in the rearranged sample. To test whether the ABC models could be predictive without experimental evaluation after the rearrangement, we tested ABC models where the observed Hi-C contact frequency is replaced with genome wide averages (Extended Data Fig. 6c) or with predicted contact frequencies from the deep learning-based tool, Orca57 (Fig. 4f,g). The ABC models based on inferred contact frequencies performed comparable to or better than models considering the experimentally observed contact frequency (Fig. 4d,f,g).
Finally, to test how well these models generalized, we identified the most accurate model score in the “test” set and applied this score to the “validation” set of clones. The ABC models, in particular ones that explicitly account for TAD boundaries, were the most accurate (accuracy 88%) (Fig. 4h). Taken together, these results indicate that MYC expression can be quantitatively predicted using models of enhancer activity in the partner region. Furthermore, these results may explain part of the heterogeneity in MYC expression observed in patient samples and engineered rearrangements.
Identification of ABC responsive genes
Interestingly, no nearby gene besides MYC showed variable expression in response to engineered structural variants (Fig. 5a) despite several neighboring genes having similarly strong variations in ABC scores (Extended Data Fig. 6d,e). This indicates that MYC may be uniquely sensitive to enhancer-promoter rewiring. We reasoned that other genes might also show similar responsiveness or invariance to changes in ABC scores. To identify such genes, we computed correlation coefficients for all protein-coding genes between RNA expression and ABC scores across 30 cell lines where we had Hi-C, H3K27ac ChIP-seq, and RNA-seq data. The Pearson correlations showed a positive shift compared to randomly shuffled controls (Fig. 5b), indicating that some genes show a strong correlation between gene expression and ABC scores, such as the transcriptional factor ISL1 (Fig. 5c, R2 = 0.91). Inspection of chromatin interaction frequencies and H3K27ac near ISL1 showed that both features varied between cells with low (MDA-MB-468) or high (SK-N-DZ) expression and ABC scores (Fig. 5d). Likewise, both “Activity” and “Contact” are globally correlated with gene expression (Extended Data Fig. 6f,g).
Figure 5. Genome wide ABC models across cell lines.

a, RNA-seq for all genes within the TAD at the MYC locus with evidence of expression in at least one clone. Expression is shown for wild-type clones (orange) and engineered clones (blue) (p-value from two-sided Wilcoxon Rank Sum test). b, Pearson correlations between RPKMs and ABC scores for all genes across 30 cancer cell lines compared with randomly shuffled controls. (p-value from two-sided Kruskal-Wallis test). c, RPKM and ABC scores for the gene ISL1. d, Hi-C contact frequency in SK-N-DZ (top right) and MDA-MB-468 (bottom left) near ISL1. H3K27ac ChIP-seq tracks of three cell lines with different expression levels of ISL1 are shown below. e, Gene ontology analysis of 962 genes with significant correlations (FDR 1%) between RPKMs and ABC score. FDR is calculated empirically by randomly shuffling the ABC scores 1000 times. f, Percent of ABC-correlated or background genes upregulated more than 4-fold relative to the mean expression when in the same TAD as a structural variant from the PCAWG dataset (p-value from Fisher’s exact test). g, Gene density within 250 kb of the 962 correlated and non-correlated genes (p-value from two-sided Kruskal-Wallis test). h, Standard deviation of PC1 in the group of 962 correlated genes and the group of the rest of genes (p-value from two-sided Kruskal-Wallis test). i, Empirical cumulative density function curves of the number of compartment switches for correlated and background genes. Genes are assigned a compartment type (A or B) based on the sign of their compartment score (A=positive, B=negative). The number of compartment switches is calculated as the number of cell lines that show an A/B compartment type that is different from the majority compartment type for that gene.
To identify sets of genes with significant correlation between ABC score and gene expression, we randomly shuffled ABC scores to calculate empirical False Discovery Rates. We found 962 genes with a significant correlation between ABC score and gene expression at an FDR 1% threshold (Pearson = 0.5563, Supplementary Table 5). Using ABC scores to predict enhancer-gene linkages, we observed that ABC-correlated genes engage in slightly more enhancer-gene connections than non-correlated genes (Extended Data Fig. 6h, 1.86 enhancers/gene vs. 1.79 enhancers/gene, p=6×10⁻⁵, paired Wilcoxon Test). However, ABC-correlated genes engaged only 3.9% more enhancers per gene. This suggests that association with enhancers is insufficient to distinguish ABC-correlated and non-correlated genes. Instead, ABC-correlated genes may be more “responsive” to changes in their local enhancer landscape.
To determine features that distinguish ABC responsive genes, we performed Gene Ontology (GO) analysis and identified terms related to cellular development, differentiation, migration and communication (Fig. 5e), suggesting that ABC correlated genes may represent specific classes of developmentally regulated genes. Consistent with their potential roles in developmental regulation, ABC-responsive genes were over-represented for transcription factors (Extended Data Fig. 6i)58. ABC responsive genes are also more likely to be classified as “oncogenes” according to the Cosmic cancer gene census (Extended Data Fig. 6j). Further, using gene expression and structural variant data from the PCAWG dataset, we observe that ABC-correlated genes are more likely to be upregulated when in the same TAD as a structural variant compared with non-ABC correlated genes (Fig. 5f), consistent with these genes being more sensitive to changes in their local enhancer landscape. In addition, ABC-correlated genes are in more gene-poor regions of the genome (Fig. 5g) and are more likely to switch A/B compartments between cell types (Fig. 5h, i), suggesting that such genes may have distinct modes of regulation. Taken together, these results revealed distinct sets of genes in the genome that show marked correlations with ABC scores, particularly developmentally regulated genes. Understanding the mechanistic basis for this distinction will be important for future studies.
Discussion
Somatic rearrangements that alter the gene regulatory landscape have long been recognized as potential cancer driver mutations 59. However, as with many “non-coding” somatic mutations, evaluating the functional consequences of any specific event is challenging 60. Previous studies of the impact of structural variants on 3D genome structure and gene expression have shown highly variable effects, from significant differences in expression and phenotypic alterations 61 to minimal differences in gene expression 4,5. This has led to confusion over what role structural variants and alterations to 3D genome structure more generally play in gene regulation.
To address these issues, we have examined structural variants in cell lines and patient samples and identified numerous loci showing evidence of recurrent alterations in 3D genome structure across cancer samples. Despite evidence for recurrence, such sites still show highly variable gene expression patterns. Using CRISPR/Cas9 genome editing to generate engineered structural variants, we find that heterogeneity in expression can be primarily explained by enhancer activity and 3D genome structure of the partner region. Further, predictive models that integrate chromatin contacts and enhancer activity, such as “Activity-by-Contact” models, can predict the likelihood of MYC activation. These results may help explain the differences in the impact of structural variation on gene expression observed in prior studies and help point a path forward to using predictive models to interpret the effects of structural variants in cancer patient samples. In particular, we suggest that ABC models have significant implications for understanding the impact of non-coding somatic mutations. In the future, such models may be used to determine whether a specific genetic event is an oncogenic driver in patient tumor samples.
There are several interesting implications of our engineered rearrangements and activity-by-contact models on the role of super-enhancers in long-range gene regulation. First, we observed that loci with TAD fusion events are more likely to contain super-enhancers, yet in our engineered rearrangements, the presence of a super-enhancer does not lead to a uniform or consistent change in MYC expression. However, in the context of activity-by-contact models, super-enhancers will still play an outsized role. Specifically, contact frequency measured by Hi-C has been shown to decay exponentially as the linear genomic distance between loci increases 62, while super-enhancer elements display exponentially stronger signals than typical enhancers 63. When considered as the product of these two forces in activity-by-contact models, super-enhancers are likely to be the only stand-alone regulatory elements capable of generating strong activating signals at large (>300kb) genomic distances (Extended Data Fig. 6k–m). The use of activity-by-contact models also does not require super-enhancers to be considered as a separate class of regulatory elements distinct from typical enhancers. Instead, what distinguishes super-enhancers, and would contribute to their having an outsized role in long-range gene regulation, is the fact that they display exponentially stronger activity signals than “typical” enhancers.
Finally, we suggest that the predictive power of ABC models is also potentially suggestive of mechanism. In our ABC models, the expression of a gene is related to the sum of the enhancers it contacts weighted by the strength of those contacts. This suggests that genes may “sample” distal enhancers through long-range chromatin contacts and integrate these interactions into final gene expression levels. Such “sampling” is likely to occur through mechanisms such as loop extrusion. For a given gene, whether this integration is linear or non-linear, which has been recently suggested in a study examining the effects of a single enhancer-gene pair 64, is an important issue for future studies. Furthermore, our results also indicate that ABC models are generally predictive of gene expression, but only for a subset of genes. We would note that prior work describing ABC models for predicting enhancer-gene connections found that these models are best suited to predicting enhancer-gene connections of tissue-specific genes56. This suggests that such mechanisms of distal enhancer integration may only apply to specific sets or types of genes, such as developmental or tissue-specific genes, though the mechanistic basis for this distinction remains unclear. Moving forward, it will be critical to determine whether such ABC responsive genes are also like MYC in their susceptibility to enhancer-promoter rewiring, and to further define the features that contribute to this susceptibility. This information will be critical to developing models that predict how somatic structural rearrangements affect oncogene expression.
Methods
Cell Culture and Patient Tumor Samples
The detailed list of cell lines used as part of this study is in tabular form in Supplementary Table 1 and is also detailed here. Cells were routinely tested for Mycoplasma using the Universal Mycoplasma Detection Kit (ATCC 30-1012K) and all tested negative. In addition, all cell lines not directly obtained from a repository were subject to STR profiling (ATCC) to confirm the correct cellular identity.
The following cell lines were cultured in Dulbecco’s Modified Eagle Media (Mediatech 10-013-CV) supplemented with 10% fetal bovine serum (Sigma F0926-500ML) and 100 units/mL of penicillin/streptomycin (Life Technologies 15140122): MDA-MB-468, MDA-MD-231, MDA-MB-436, Caov-3, SW-626, SK-OV-3, A2058, A172, SW-1088, U118-MG, U343. In addition, the following cell lines were cultured in Eagle’s Minimal Essential Media (Quality Biological 112-018-101) supplemented with 10% fetal bovine serum (Sigma F0926-500ML) and 100 units/mL of penicillin/streptomycin (Life Technologies 15140122): HS-578-T, BT-20, U87-MG, MG-63, DU-145, SK-N-SH.
The following cell lines were cultured in RPMI-1640 media (Lonza 12–167F) supplemented with 10% fetal bovine serum (Sigma F0926–500ML) and 100 units/mL of penicillin/streptomycin (Life Technologies 15140122): DU4475, HCC1187, HCC1599, HCC1806, HCC1937, HCC2218, HCC38, HCC70, HCC1569, HCC2157, BT-549, MOLM-13, MV4;11, ML-2, Jeko-1, Granta, Rec-1, Maver-1, Mino, CESS, Jurkat, NCI-H596, NCI-H1437, NCI-H1563, NCI-H1573, NCI-H1975. The following cell lines were cultured in RPMI-1640 media (Lonza 12–167F) supplemented with 15% fetal bovine serum (Sigma F0926–500ML), 100 units/mL of penicillin/streptomycin (Life Technologies 15140122), and 2mM L-glutamine: MOLT-4, RPMI-8402, CCRF-CEM.
SK-N-DZ cells were cultured in Dulbecco’s Modified Eagle Media (Mediatech 10-013-CV) supplemented with 10% fetal bovine serum (Sigma F0926-500ML), 100 units/mL of penicillin/streptomycin (Life Technologies 15140122), and 1X Non-essential amino acids (Life Technologies 11140050). TT cells were cultured in Ham’s F-12K Medium (ThermoFisher 21127022) supplemented with 10% fetal bovine serum (Sigma F0926-500ML) and 100 units/mL of penicillin/streptomycin (Life Technologies 15140122). Capan-1 and HL-60 cell lines were cultured in Iscove’s Modified Dulbecco’s Medium (ThermoFisher 12440053) supplemented with 10% fetal bovine serum (Sigma F0926-500ML) and 100 units/mL of penicillin/streptomycin (Life Technologies 15140122).
The following cell lines were obtained from ATCC: HCC1569 (CRL-2330), MDA-MB-436 (HTB-130), DU4475 (HTB-123), HCC1187 (CRL-2322), HCC1599 (CRL-2331), HCC1937 (CRL-2336), HCC2218 (CRL-2343), HCC38 (CRL-2314), HCC70 (CRL-2315), MDA-MB-468 (HTB-132), HCC2157 (CRL-2340), BT-549 (HTB-122), HS-578-T (HTB-126), BT-20 (HTB-19), HCC1806 (CRL-2335), Caov-3 (HTB-75), SW-626 (HTB-78), SK-OV-3 (HTB-77), A172 (CRL-1620), SW-1088 (HTB-12), U-118 MG (HTB-15), U-87 MG (HTB-14), HL-60 (CCL-240), CESS (TIB-190), NCI-H596 (HTB-178), NCI-H1437 (CRL-5872), NCI-H1563 (CRL-5875), NCI-H1573 (CRL-5877), NCI-H1975 (CRL-5908), SK-N-SH (HTB-11), and SK-N-DZ (CRL-2149). Of note, the U118-MG cell line is known to share genetic origin with a separate Glioma cell line U138-MG. This cell line was purchased directly from ATCC as part of their Glioma cell line panel (TCP-1018). Given that both of these cell lines represent Gliomas and that it is included to be representative for pan-cancer profiling and that we only include the U118-MG cell line, we felt that its inclusion was justified despite its shared origin.
The following cell lines were obtained from Coriell: RPMI-8402 (GM03639), MOLT-4 (GM02219) and CCRF-CEM (GM03671). The following cell lines were a gift from the laboratory of Ani Deshpande: MOLM-13, MV4;11, ML-2, Jeko-1, Granta, Rec-1, Maver-1, and Mino. The following cell lines were a gift from the laboratory of Alan Saghatelian: A2058, Capan-1, U343, MG-63, DU-145, and TT. Jurkat cells were a gift from the laboratory of Bjorn Lillemeier.
Biospecimens were collected by the Moore’s Cancer Center Biorepository and Tissue technology shared resource from consented patients under a University of California, San Diego Human Research Protections Program Institutional Review Board approved protocol (HRPP# 090401). Samples were flash frozen in liquid nitrogen. All research involving human tumor specimens was also reviewed by the Institutional Review Board at the Salk Institute.
Sequencing library generation
Hi-C was performed using the in situ method as previously described 20. To summarize, for assays using cell lines, adherent cells were fixed for 10 minutes at room temperature using 1% formaldehyde. For suspension cells, this was done after resuspending cells in fresh media at a concentration of 1×10⁶ cells per mL. Cells were quenched with 0.2M glycine, pelleted, and washed twice with 1X DPBS. Cells were incubated in ice cold lysis buffer (10mM Tris-HCl pH 8.0, 10mM NaCl, 0.2% Igepal) for 15 minutes on ice and washed twice with 1x NEB Buffer 2. The digestion and further processing of the samples is described below (see paragraph following processing for patient tumor samples).
For patient tumor samples, the tumor was removed from liquid nitrogen storage and weighed while still frozen. Using a mortar and pestle on a bed of dry ice, the samples were pulverized while frozen until they formed a fine powder. The pulverized tissue was transferred to a 15mL tube containing 10mL of 1X DPBS and fixed using 2% formaldehyde for 10 minutes. The samples were quenched with 0.2M glycine for 5 minutes. The tissue was washed twice in 1X DPBS. After removing the supernatant, the pellets were frozen at −80°C until further processing. When ready for Hi-C experiments, the pellets were thawed and resuspended in 3mL of tissue lysis buffer (10mM Tris-HCl pH 8.0, 5mM CaCl2, 3mM MgAc, 2mM EDTA, 0.2mM EGTA, 1mM DTT, 0.1mM PMSF, 1X Complete Protease Inhibitors). The samples were transferred to an M-tube and run through the “Protein M-tube” program on a gentleMACs tissue dissociator (Miltenyi). After the dissociation, an additional 3mL of tissue lysis buffer with 0.4% Triton X-100 was added to the sample and the solution was passed through a 40μM strainer. The tube and cell strainer were washed with an additional 2mL of 0.2% tissue lysis buffer with 0.2% Triton X-100. The sample was centrifuged and washed with an additional 1mL of tissue lysis buffer with 0.2% Triton X-100.
For both cell line and tissue samples processed as described above, the digestion and Hi-C library preparation proceeded similarly based on the in situ Hi-C protocol 20. The pellet was resuspended in 50μL of 0.5% SDS and incubated for 10 minutes at 62°C. 145μL of water and 25μL of 10% Triton X-100 were added to quench the SDS for 15 minutes at 37°C. 25μL of 10x NEB Buffer 2 was added to the samples. Cells were digested with 500U of MboI restriction enzyme (NEB) in NEB Buffer 2. DNA ends were filled in with dNTPs, including biotin-14-dATP (Jena), using Klenow polymerase (NEB). Chromatin ends were ligated using T4 DNA ligase. DNA was then purified and sheared on a Covaris M-series ultrasonicator. Biotinylated fragments were purified using the My T1 Streptavidin coated beads (Life Technologies) and subject to on-bead library preparation as described previously 20. Libraries were sequenced using the Illumina NextSeq 500 as paired-end 42bp reads.
RNA-seq was performed by first harvesting cells in Trizol (Life Technologies) according to the manufacturer’s instructions. RNA was then isolated using the Purelink RNA Mini Kit (Life Technologies) with Purelink on-column DNase I treatment. Stranded mRNA-seq libraries were generated from 1–2μg of RNA using the Illumina Stranded mRNA kit according to the manufacturer’s recommendation. Libraries were pooled and sequenced on NextSeq 500 using paired-end 42bp reads.
CRISPR/Cas9 translocation engineering
Genome engineering was performed by expressing gRNA and Cas9 containing plasmids in SK-N-DZ cells. In our test set experiments, we used two plasmids per experiment, one to express guides in proximity to MYC on chromosome 8 and a second to express guides of the putative partner regions. In our validation set experiments, dual guides were cloned into a single vector. All guides were synthesized by IDT. Cloning of guides was carried out as previously described 65. In our two-plasmid system, all chromosome 8 guides were cloned into the pX458 plasmid (expressing GFP, Addgene #48138, a kind gift from Dr. Feng Zhang), and the partner region guides were cloned into a modified version of pX458 where the GFP was replaced by mCherry (a kind gift from Dr. Andrew Kim). We designed 3–4 guides per locus. These were transfected as pairs, with one guide targeting chromosome 8 and one guide targeting the partner region, for a total of 12 guide pairs (3×4) per locus. In our single plasmid system, the two guides were cloned into the pX458-mCherry plasmid. Transfection was carried by electroporation of 1μg of each plasmid using the Lonza 4D Nucleofection SF kit into 200,000–500,000 SK-N-DZ cells per transfection. We used the DS-150 program for electroporation. Cells were allowed to recover for 10 minutes and then plated in fresh media. After two days, cells expressing both chromosome 8 and partner region guides were isolated. Sorted cells were allowed to recover for 1–2 weeks before plating manually as single cells in 96 well plates. SK-N-DZ cells typically grow as colonies, such that after two weeks, we visually inspected the 96 well plates and excluded wells containing more than one colony.
To screen for engineered clones, we designed PCR primers that flanked the gRNA target sequences in the genome. Specifically, one primer was centromeric to the guides on chromosome 8, while the second guide was telomeric to the guides on the putative partner region. Cells in 96 well plates were split into replicate plates. One plate was then harvested using 20μL of QuickExtract (Lucigen) per well. The samples were incubated in a 96 well T100 thermal cycler (Bio-rad) using the following program: 65°C for 15 minutes, 68°C for 15 minutes, 98°C for 10 minutes. The samples were diluted by adding 30μL of water. PCR was then performed using Taq polymerase (Life technologies) in 20μL volumes using 5μL of QuickExtract DNA per reaction. The PCR products were resolved on 96-well E-gels (Life Technologies). Wells with positive PCR products were propagated on the replicate 96 well plate and all other wells were discarded.
Once a given clone reached sufficient density, we obtained purified genomic DNA using the Qiagen Blood & Tissue DNA Isolation Kit (Qiagen). PCR was repeated using 50ng of DNA. If this confirmatory PCR was also positive, the PCR product was excised from the gel using the Qiagen Gel Extraction kit and subject to Sanger Sequencing (Eton). Only clones with unique breakpoint junctions from Sanger sequencing were further processed to ensure that each clone was distinct and not the product of propagating the daughter cells of the same original rearrangement. Finally, the large-scale rearrangement was validated by chromosome painting using commercially available probes according to the manufacturer’s instructions (Cytocell). If the cells were ultimately positive for the engineered rearrangement by PCR, Sanger sequencing, and chromosome painting, we harvested cells for Hi-C and RNA-seq and generated sequencing libraries for each clone.
mClover2 reporter engineering
We engineered SK-N-DZ cells containing a mClover2 reporter integrated into the 3’ UTR of the MYC gene. To generate the donor plasmid for the mClover2 reporter knock-in, we first PCR amplified ~3 kb fragment near the MYC stop codon (including ~1.5 kb both upstream and downstream) and cloned it into a pCR-Blunt II-TOPO vector (Invitrogen). We then inserted a T2A-mClover2 tag (PCR amplified from dClover2-N1, Addgene #54538, a kind gift from Dr. Michael Davidson) to the 3’ end of MYC, followed by a loxP-PGK-NeoR-loxP fragment (PCR amplified from Oct4-ires-EGFP, Addgene #21547, a kind gift from Dr. Rudolf Jaenisch). Guide RNAs were designed near the MYC stop codon and cloned into pX458 with mCherry. After linearization of the donor plasmid, the donor plasmid and gRNA plasmid (500 ng each) were co-transfected into 1 million SK-N-DZ cells using the Lonza 4D Nucleofection SF kit. After 48 hours, transfected cells were transferred to a 10 cm plate and treated with 1 mg/mL of Geneticin (Gibco) for five days. By the end of Geneticin treatment, half of the cells were harvested for gDNA extraction, followed by a bulk cell PCR testing (using one primer upstream of the MYC stop codon and another inside the insertion) to examine if there was successful integration. Cells were then plated manually as single cells in 96 well plates. After two weeks, we visually inspected the 96 well plates and excluded wells containing more than one colony. Using the same PCR primers for bulk PCR testing, we screened for engineered clones in the same way described above.
Enhancer deletion experiment
Using the SK-N-DZ cells with the MYC-mClover2 reporter, we generated a chromosome 1 to chromosome 8 translocation using CRISPR/Cas9 engineering with the same gRNAs used to generate chr1 clone #1. mClover2+ cells were sorted into 96 well plates using FACS. Clones were screened using the same primers used for chr1 clone #1 to identify clones harboring the t(1;8) translocation. We isolated multiple clonal cell lines and performed flow cell cytometry to verify mClover2 expression, RNA-seq to verify if the expression of MYC is consistent with chr1 clone #1 and #2, and Hi-C to demonstrate the presence of the translocated allele.
In the clone with a chromosome t(1;8) translocation, we performed additional CRISPR/Cas9 engineering to delete the genomic enhancer at chr1:49,045,908– 49,063,390, which contains the strongest H3K27ac peak near the translocated chr1 breakpoint. Bulk cell mClover2 expression level was compared between cells transfected with guides deleting the enhancer and control guides that do not introduce any deletion. We defined the “mClover2 low” population of cells as cells with mClover2 expression greater than one standard deviation below the mean of the mClover2 expression level in cells transfected with control guide RNAs.
To examine clonal RNA-seq expression levels from cells with the deleted enhancer, we plated cells after introducing the deletion gRNAs as single cells in 96 well plates. PCR tests were used to screen for multiple cell lines with deletions. We then determined whether the deletions were on the same allele as the translocation or the non-translocated allele. To accomplish this, we first had to determine which polymorphisms could distinguish the translocated and non-translocated alleles. We started by calling variants from Hi-C sequencing reads using GATK Haplotype caller, including steps of indel realignment and base recalibration66. We then filtered only SNPs with a quality of “PASS” for further processing. We performed haplotype phasing using the Hi-C data as previously described67 using Hapcut268. This generates chromosome length haplotypes that facilitate distinguishing each chromosome into one of two haplotypes, A or B. We examined Hi-C reads within 1Mb of the chr1/chr8 translocation breakpoint to determine which haplotypes were involved in the translocation. We observe that all breakpoint proximal reads supported haplotype B on chromosome 8 being translocated to haplotype A on chromosome 1 (n=332 reads for chr8 haplotype assignment, n=118 for chr1). This unambiguously establishes that the haplotypes involved in the engineered translocation. We identified three SNPs (rs17105425, rs12410172 and rs11581331) within the chr1:49,045,908– 49,063,390 enhancer that allowed us to distinguish whether the wild type or translocated haplotype carried the deletion. To achieve this, we used Sanger sequencing across these polymorphisms in the deleted clones to determine which haplotype the deletion occurred. We then performed RNA-seq for all enhancer deletion engineered clones and compared the MYC expression between the group with deletion on translocated allele with that on wild type allele as a control.
RNA-seq analysis
RNA-seq data was aligned using STAR 69 to the hg38 reference genome. PCR duplicates were removed, and read counts were quantified over GENCODE genes (v25) using HTSeq 70 and subject to RPKM normalization. Fusion genes were identified using STAR-fusion 71. We filtered the initial calls using multiple criteria. First, we removed genes whose expression was less than 1 rpkm as predicted by STAR-fusion. Second, we merged all fusion genes where each predicted break end was within 500kb of another fusion gene from the same cell line. This reduces the number of sites where multiple fusion genes may be called due to alternative transcript isoforms occurring across a single breakpoint. In addition, this also ensures that when evaluating the sensitivity of Hi-C based structural variant calls that we do not consider the same breakpoint more than once. Third, we removed fusion genes that showed recurrent fusions across the samples. None of the samples used for fusion gene analysis carried known high frequency fusion genes (for example, from Chronic Myelogenous Leukemia samples), so this step filtered out a subset of fusion genes that appear to reflect mapping and alignment anomalies.
Hi-C data processing
Hi-C data was aligned to the hg38 reference genome using BWA-MEM 72. Reads were filtered (MAPQ >= 30) and paired using a previously described pipeline 17. PCR duplicate reads were removed using Picard. Contact matrices were generated and normalized using the iterative correction method 73. TADs were identified as previously described 41. To generate the merged TAD call set, we identified boundaries between TADs in five cell lines: hESCs, HCC38, MV411, DLD-1, and NCI-H1437. These boundaries were merged (allowing for a padding of 40kb) and unique boundaries were retained. The intervals between boundaries were then considered as the list of domain calls. Domains over 5Mb were excluded as they typically were the intervening regions near centromeres.
Hi-C structural variant analysis
To identify structural variants in Hi-C data, we used our previously described hic-breakfinder method 17 with default parameters at 10 kb resolution.
For analysis of frequently rearranged chromosomes (related to Extended Data Fig. 2c–e) we developed a simple statistical model for the frequency of intra-chromosomal rearrangements per chromosome. We tested whether a given chromosome in a cell line shows evidence of “clustering” of structural variants. The baseline assumption is that structural variants should be distributed randomly throughout the genome according to the size of each chromosome. Therefore, to test for clustering of structural variants on a given chromosome, we first computed the total number of observed intra-chromosomal rearrangements across all chromosomes in each cell line. To generate the expected number of structural variants for a given chromosome, we divide the total number of intra-chromosomal structural variants in a given cell line by the size of the genome, then multiply this rate by the size of the chromosome that is tested for evidence of clustering (expected value = (total intra-events)x(chromosome size/genome size). We then calculated the p-value for the observed number of intra-chromosomal rearrangements per chromosome for all chromosomes in each sample given this expected rate. The p-value was computed using a Poisson distribution. Chromosomes with evidence of clustering are then called based on Bonferroni corrected p-values.
TAD fusion calling
To identify TAD fusion events in Hi-C data, we developed a neural network based machine learning classifier. For each cell line, we generated a normalized Hi-C matrix, and TADs were called as previously described 41 at the resolution of 40 kilobases. For training the classifier, we randomly selected 10,000 different bins genome-wide at the same 40kb resolution. The 10,000 random bins were then divided into a training set at the size of 7,000 and a cross validation set at the size of 3,000. For each bin, we designated the sample bin as a coordinate of x, and then generated a submatrix at a size of 50 × 50 from the whole genome Hi-C matrix at a square window of [x − 2,000,000] × [x + 2,000,000]. Each submatrix was converted into a 1D vector of size 2,500 which served as the input layer for each sample. We used a fully connected feed forward neural network with one hidden layer with 50 nodes and an output layer with only one node. For training samples, the output nodes were set to zero if the central bin is inside a TAD, or to one if the central bin is outside a TAD (in a boundary region). Matlab scripts were executed to train the neural network with all training samples for 400 iterations, using backpropagation algorithm with sigmoid function as the activation function. The training was performed for each cell line in order to account for sample specific differences in Hi-C data. The trained neural network was then used to predict the output of cross validation samples. Cross validation samples were predicted as inside a TAD if the output node value is < 0.5 and outside a TAD if the value is ≥ 0.5. Prediction results were compared with TAD annotation from the same cell line for all cross-validation samples to generate precision and false discovery rates.
For predicting TAD fusion events, the model was then applied to chromosome rearrangements that we identified from Hi-C. Local rearranged submatrices from fused chromosomes were generated with extension from breakpoint in both directions for two megabases. The input layer was generated the same way while using the bin of breakpoint as the central bin. This data was then used as input for the same neural network. The predictions were made using the same criteria described above.
Identification of recurrent TAD fusion events
To identify domains affected by recurrent TAD fusion events, we quantified the total number of TAD fusion events predicted for each domain using the merged set of TADs. After quantifying the total number of events per domain, we estimated the p-value of observing the given number of events in that domain using a two-sided Poisson test, where the expected value is related to the overall number of TAD fusion events per base pair in the genome and the size of the domain in question. In order to determine the False Discovery Rate at different significance thresholds, we randomly permuted TAD fusion calls per domain and recalculated the observed significance after such random permutations.
Whole genome sequencing structural variant analysis
Somatic rearrangements, somatic copy-number alterations and normalized gene expression data generated by the ICGC/TCGA PCAWG Consortium are described by the lead paper of the PCAWG Consortium 74 and available for download at https://dcc.icgc.org/releases/PCAWG.
We obtained the consensus SV calls and annotations of each variation (deletions, inversions, duplications and complex rearrangements), which can be found at Synapse (https://www.synapse.org/) with accession number syn7596712, normalized gene expression values were obtained from syn5553985 and somatic copy number calls were obtained from syn8042988. For whole genome sequencing defined structural variants generated from the ICGC patient data cohort 50, we first performed minor filtration on the data. Specifically, we counted the frequency of breakpoints throughout the genome in 100bp bins. We removed any SVs whose breakpoints were found in 100bp bins containing rearrangements in more than ten patient samples. This filtration eliminated 0.4% of all SVs in the original dataset. We then filtered for “inter-TAD” structural variants by identifying variants where one end maps within one TAD and a second maps within another TAD.
Patient RNA-seq and survival data were downloaded from the ICGC Data Portal Pan-Cancer Analysis of Whole Genomes repository. Survival analysis was performed using the “survival” package in the R statistical programming language. The differences in survival according to TAD fusion events was estimated using the two-sided likelihood test derived from a Cox Proportional Hazards Model.
ChIP-seq data analysis and super enhancer identification
ChIP-seq data was downloaded from publicly accessible datasets 13,25,75–93. Details of accession numbers and chromatin marks are listed in Supplementary Table 1. ChIP-seq data was aligned to the hg38 genome using BWA 72. Please see Supplementary Table 1 for a list of all public ChIP-seq datasets and their accession numbers that were analyzed as part of this study. Peaks were called using MACS2 94. Enhancers were defined as distal (>2.5kb) H3K27ac peaks. Super-enhancers were determined according to the Rank Ordering of Super Enhancers (ROSE) algorithm 63 using H3K27ac peaks.
END-seq data analysis
END-seq data in MCF7 cells from 40 was downloaded from the GEO database (GEO accession GSE99194). We specifically used the “no treatment” conditions. Reads were aligned to the hg38 genome. The number of END-seq reads per TAD based on MCF7 TAD calls was quantified. We also separated domains into those that contain super enhancers and those that do not based on H3K27ac ChIP-seq data in MCF7 81. Super enhancers were determined according to the ROSE algorithm 63.
Activity-by-contact models
For activity-by-contact models, we calculated the interaction frequency between the MYC promoter and a 3Mb window distal to the site of the engineered breakpoint over the partner region of the genome using 40kb bins. To ensure that activity-by-contact scores were not influenced by differences in sequencing depth, the Hi-C data was first normalized according to the total number of contacts. We use H3K27ac data from wild-type SK-N-DZ cells 90 as the activity metric over the partner region. Peaks were quantified and the total signal present in each peak was normalized by the sample read depth. The activity-by-contact score was then calculated for each engineered clone by summing the enhancer activity multiplied by the promoter-enhancer interaction frequency. A similar strategy was used when calculating the aggregate enhancer activity, except this sum was not weighted by the interaction frequency.
For prediction of MYC expression, partner regions were classified as “activating” or “non-activating” by comparing expression of all replicate clones from a single partner site with the parental SK-N-DZ cells using edgeR (FDR 5%). The “activating” and “non-activating” labels were then predicted using different models. Receiver operating characteristic curves were calculated using the PRROC package in R.
Predicted contact maps resulting from structural variants
In order to predict the consequence of structural variants on 3D genome contact maps in silico, we used the Orca deep learning tool 57. We used the pre-trained models derived from H1 human Embryonic stem cells (H1) and Human Foreskin Fibroblasts (HFF) for these predictions. The coordinates and strand of the breakpoints were derived from the base-pair resolved structural variant breakpoints identified in Sanger sequencing analysis of the engineered rearrangements. The Orca tool generates predictions of contact frequency at different resolutions for different genomic windows surrounding the breakpoint site. We used the 4Mb window with 16kb bin size-based predictions as input for our Orca predicted ABC models. Orca outputs a log-transformed, distance normalized interaction matrix and a distance-expectation interaction matrix. From these we inferred a non-distance normalized interaction matrix by exponentiating the log-transformed prediction and multiplying it by the distance expectation for each bin.
Genome-wide gene expression correlation using Activity-by-contact models
The Hi-C data was first normalized according to the total number of contacts. For every protein-coding gene, we calculated the interaction frequency between the promoter and a 3Mb window locally. Additionally, if there is a translocation within 3Mb of the transcription start site, interactions over the partner region within 3Mb distance were also considered. We applied this procedure on 30 cell lines with published H3K27ac data as the activity metric over the same region. Peaks were quantified and the total signal present in each peak was normalized by the sample read depth. The activity-by-contact score was then calculated for each protein-coding gene in each cell line by summing the enhancer activity multiplied by the promoter-enhancer interaction frequency.
The Pearson correlation between the gene expression RPKMs and activity-by-contact scores was calculated for each protein-coding gene. We randomly shuffled the ABC scores as a control, and the Pearson correlation coefficient of the randomized control was also calculated. We repeated the shuffling of ABC scores in each gene 1000 times to estimate the average false discovery rate at different values of Pearson correlation coefficient. We defined ABC responsive genes by setting Pearson correlation coefficient with FDR cut-off at 1%.
For calculation of enhancer-gene linkages using ABC scores, we computed individual enhancer ABC scores for each gene and divided them by the total ABC score for each gene. We considered enhancer-gene connections with such enhancer-gene fractional ABC scores >= 0.1 based on previously described cut-offs for such enhancer-gene ABC scores56. Gene ontology analysis was applied to the ABC responsive genes using topGO 95. The frequency of ABC correlated or background genes classified as “transcription factors” was determined using annotations of previously published human transcription factors 58. The frequency of ABC correlated or background genes classified as oncogenes was evaluated by comparing the official gene names of each gene with genes classified as “oncogenes” according to the Cosmic cancer gene census. To compare ABC correlated or background genes with expression changes in the PCAWG dataset, we first computed the fold-change relative to the average expression of each gene across all patient samples in the PCAWG dataset. We then calculated the fraction of ABC correlated or background genes that showed greater than or equal to 4-fold change relative to the average in the same TAD as a structural variant.
For compartment analysis, PC1 values at 100 kb resolution were calculated from Hi-C data of each cell line. We defined positive values as A compartment, negative values as B compartment, and the number of compartment switches as the number of cell lines in the minority compartment in each 100 kb genomic bin. For each gene, the number of compartment switches of the genomic bin where the promoter is located was classified into ABC responsive or background and comparison between two groups was carried out.
Extended Data
Extended Data Figure 1. Identification of rearrangements based on Hi-C data.

a, Pie chart showing all 4,543 rearrangements identified and which cell line or patient tumor sample they are derived from. The order in the pie chart starts with A172 cells and proceeds counter-clockwise. b, Resolution of structural variants calls from Hi-C. Calls are first identified at low resolution and then progressively refined. The resolution reported is the highest resolution with which a given structural variant is identified. c, Chromatin interaction maps from mixed lineage leukemia cell lines with known MLL/KMT2A rearrangements. The maps show the presence of translocations on chromosome 4 in MV4;11 cells (left), chromosome 6 in ML2 cells (middle), and chromosome 9 in MOLM13 cells (right). d, Heat maps showing known disease defining translocations from five Mantle Cell lymphoma cell lines (Rec-1, Mino, Maver, Jeko, Granta). e, Heat maps showing known disease defining translocations in two Chronic Lymphocytic Leukemia cell lines (K562 and KBM7).
Extended Data Figure 2. Features associated with TAD fusion events.

a, Pie chart showing the fraction of intra-chromosomal vs. inter-chromosomal structural variant predictions. b, The number of observed intra-chromosomal (blue) or inter-chromosomal (red) rearrangements identified in each cell line. c, -log10 (p-values) for the observed frequency of intra-chromosomal rearrangements for each chromosome in each cell line under the null hypothesis that rearrangements are randomly distributed across chromosomes. The dashed line shows the threshold for significance accounting for multiple testing using a Bonferroni correction (p=2.5×10⁻⁵). d, Example of high-frequency local rearrangements on chromosome 9 in U343 cells. Below the matrix is an arc plot of predicted rearrangements. e, Example of high-frequency local rearrangements along chromosome 15 in SNU-C1 cells (shown in the upper right-hand half of the matrix) in comparison with data from chromosome 15 in LoVo cells (lower left hand) where no rearrangements are observed. Below the matrix is an arc plot of predicted rearrangements. f, Results of cross validation of the neural network. The violin plots show the distribution of the accuracy and false discovery rate (FDR) across all 82 samples. g, Bar plots showing the percentage of domains containing oncogenes (based on the Cosmic Cancer Gene census) in domains identified as being part of fusion TADs (blue) versus those not identified in fusion TADs (grey). P-value is calculated by Fisher’s exact test. h, Bar plots showing the percentage of domains that contain enhancers for domains that contain TAD fusion events (blue) or do not (gray). The domain/enhancer analysis was performed for each domain in each cell type. P-value is calculated by Fisher’s exact test. i, Violin plots showing the distribution of the frequency of enhancers in domains that show TAD fusion events (blue) versus those that do not (gray). P-value is calculated from the two-sided Wilcoxon Rank Sum test. j, Bar plots showing the percentage of domains that contain super enhancers for domains that contain TAD fusion events (blue) or do not (gray). The domain/super-enhancer analysis was performed for each domain in each cell type. P-value is calculated by Fisher’s exact test. k, Violin plots showing the number of END-seq reads per kb for TADs that contain super enhancers (blue) versus those that do not (gray).
Extended Data Figure 3. TAD fusion events at the MYC locus.

a, The number of called domains in each of five cell lines (hESC, HCC38, MV411, NCI-H1437, DLD-1) and the number of domains after merging unique boundaries (Merged). b, Quantile-quantile plot for evaluating the false discovery rate for recurrent TAD fusion identification. The observed p-values (Y-axis) are estimated using a Poisson model accounting for the overall frequency of rearrangements and the size of the domain. Randomized p-values are generated from these expected values (x-axis). This randomization analysis was repeated 1000 times to estimate the FDR at different p-value cut-offs. c, Hi-C data over the MYC locus in five cell types used for generating the merged TAD boundary set. The locations of TAD calls are shown in black bars below each heat map. This includes the TAD calls for each cell type as well as the across-cell merged calls (“Union set”). d, Estimated copy number of the MYC gene for samples with a TAD fusion event at the MYC locus versus those that do not. The copy number is estimated from the total number of Hi-C reads over the 100kb bin surrounding the MYC gene divided by the median read count per 100kb bin in each cell line. e, Circos plot showing the translocation partner region of each predicted TAD fusion event at the MYC locus. f, Examples of identified TAD fusion events at the MYC locus in two cell lines.
Extended Data Figure 4. Inter TAD rearrangements at the MYC locus in human patient tumor samples.

a, Bar plot showing the frequency of patient samples containing inter-TAD rearrangements at the MYC locus by tumor type. b, Fraction of PCAWG samples with SVs at the MYC locus based on copy number. Samples are stratified into low copy (<=2), mid-copy (>2 and <=6), and high-copy (>6). c, Violin plots showing MYC expression for PCAWG samples stratified by copy number and the presence or absence of an SV at the MYC locus. P-values are calculated using Kruskal-Wallis test. d, RNA-seq expression of the MYC gene from patient samples with matched structural variant calls for samples with no high-level copy number alterations at the MYC gene (copy <= 6). Samples are separated into those that contain an inter-TAD rearrangement at the MYC locus (blue) and those that do not (black). P-value is from two-sided Wilcoxon Rank Sum test. e, RNA-seq expression of the MYC gene from patient samples with matched structural variant calls that are copy neutral at the MYC gene (copy <= 2). Samples are separated into those that contain an inter-TAD rearrangement at the MYC locus (blue) and those that do not (black). P-value is from two-sided Wilcoxon Rank Sum test. f, Circos plot of all inter-TAD rearrangements at the MYC locus. The Circos plot is zoomed in on cytoband 8q24.21 to show the MYC locus at a higher resolution. The position of TAD calls (black) and genes (green) are marked below the track.
Extended Data Figure 5. Engineered rearrangements in SK-N-DZ cells.

a, Hi-C heat maps between chromosomes 7 and 8 in SK-N-SH cells (left) and SK-N-DZ cells (right). SK-N-SH cells have an endogenous t(7;8) translocation that creates a TAD fusion event at the locus, while SK-N-DZ cells have no rearrangements at the MYC locus in wild-type cells. b, Schematic for engineering rearrangement strategy. Guide RNAs targeting a locus ~300kb downstream from the MYC gene and Guide RNAs targeting the partner region are cloned into a vector expressing Cas9. Guides are expressed either as single guides on plasmid with different fluorescent proteins or as dual guides on a plasmid with a single fluorescent protein. Cells are sorted and plated as single cells into 96 well plates. These can then be screened by PCR over the potential breakpoint to identify engineered clones. c, Sanger sequencing of PCR products from different engineered clones. The sequences that align to chromosome 7 are highlighted in green, while the sequences that align to chromosome 8 are highlighted in purple. d, Similar to Figure 4b, validation of the engineered t(7;8) translocation by chromosome painting. e, MYC expression in cell lines containing endogenous or engineered rearrangements at the MYC locus including the non-rearranged SK-N-DZ parent cell line (purple), engineered clones classified as “Non-activating” (light blue), engineered clones classified as “MYC-activating” (dark red), Neuroblastoma cell lines with endogenous MYC rearrangements (green), and non-Neuroblastoma cell lines with MYC rearrangements (black). f, Scatter plot showing MYC expression (y-axis) and estimated MYC copy number (x-axis). g, Scatter plot showing MYC expression (y-axis) and estimated MYCN copy number (x-axis). h, Scatter plot showing MYC expression (y-axis) and MYCN expression (x-axis). i, FACS plots of mClover2 fluorescence in SK-N-DZ cells with a T2A-mClover2 reporter knocked into the 3’ end of the MYC gene (pink) and in a line derived from this MYC reporter with an engineered translocation between chromosome 1 and 8 (green). j, Heat map of chromosome 1 translocation to chromosome 8 with box showing H3K27ac ChIP-seq data over the partner region. The small inset box on the ChIP-seq track shows the enhancer targeted for deletion. k, FACS showing mClover2 fluorescence levels in the original chromosome 1 and chromosome 8 MYC reporter translocation (red) and in the same line with the targeted enhancer deletion (blue). The gate shows the region classified as “mClover2 low”. An example of the gating strategy for is also shown, including gating for single-cells and mCherry positive cells (FSC – forward scatter, SSC – side scatter, A – area, W – width). l, Percentage of “mClover2 low” cells in the control (red) and deletion (blue) cells. P-value is using Student’s two-sided T-test. m, MYC RPKM of clones with enhancer deletion on wild type allele and MYC-translocated allele. P-value is using two-sided T-test with equal variance.
Extended Data Figure 6. Models for activation in engineered rearrangements.

a, Example plot showing method for calculating ABC score for MYC with rearranged partner sites. Interaction frequency between the MYC promoter and H3K27ac peaks in the partner region (“contact”) is multiplied by the strength of the H3K27ac signal (“activity”) at each peak across the partner region to obtain a final score for each peak. This signal is then summed across all peaks over the partner region. Of note, this example plot only shows the calculations for the six strongest H3K27ac peaks in the partner region, whereas the actual score is calculated using all H3K27ac peaks. b, Receiver Operating Characteristic (ROC) curve for the TAD delimited ABC model. Shown above the plot is the area under the curve (AUC). c, ROC curve for an ABC model where contacts are measured from genome wide average interaction frequencies. d, Plots showing ABC scores for genes neighboring MYC. Above the plot is the Pearson correlation coefficient for each gene between the genes’ ABC score and expression. e, Heat map of the TAD surrounding MYC as well as the location and relative position of the genes shown in panel D. f, Scatter plot showing ABC scores and summed enhancer activity within 3 Mb for every gene in 30 cancer cell lines. g, Scatter plot showing ABC scores and summed interaction within 3 Mb for every gene in 30 cancer cell lines. h, The number of enhancers per gene linked by the marginal ABC score >= 0.1 for ABC-correlated and non-correlated genes. Gray lines show the paired values for each cell line comparing ABC-correlated and non-correlated genes. P-value is from paired Wilcoxon test. i, Percentage of ABC responsive (blue) and protein-coding genes classified as transcription factors. Protein coding genes are from the Gencode reference annotation. P-value is from Fisher’s Exact test. j, Percentage of ABC responsive (blue) and protein-coding genes classified as oncogenes according to the Cosmic cancer gene census. P-value is from Fisher’s Exact test. k, Normalized interaction frequency as a function of distance for Hi-C interactions at 10kb resolution in SK-N-DZ cells. Interaction frequency decays exponentially as a function of distance. l, Enhancer activity based on H3K27ac ChIP-seq as quantified by the ROSE super enhancer calling activity for all enhancers in SK-N-DZ cells. Enhancers are displayed ranked according to strength. Super-enhancers show exponentially stronger enhancer activity compared with typical enhancers. m, Enhancer activity required to achieve the equivalent activity-by-contact score for the median enhancer at 20kb in SK-N-DZ cells as a function of genomic distance. Shown as a dashed line is the minimal enhancer strength categorized as a “super enhancer” in SK-N-DZ cells by the ROSE algorithm. Due to the exponential decay in interaction frequency. After ~300kb, the only enhancers capable of producing an ABC score equivalent to the median enhancer at 20kb are super enhancers.
Supplementary Material
Acknowledgements
We would like to thank Dr. Alan Saghatelian and Dr. Ani Deshpande for contributing cell lines to this study. We would like to thank Dr. Andrew Kim for sharing the mCherry modified version of the pX458 plasmid. We would like to thank Dr. Tessa Popay for helpful comments on the manuscript. This work was supported by NIH grant DP5OD023071 to J.R.D. and is also supported by the Leona M. and Harry B. Helmsley Charitable Trust grant No. 2017-PG-MED001 to J.R.D. Work in the laboratory of G.M.W. was supported, in part, by the National Institutes of Health/National Cancer Institute (R35 CA197687) and the Breast Cancer Research Foundation (BCRF). This work was also supported by the Flow Cytometry Core Facility of the Salk Institute and the NGS Core Facility of the Salk Institute with funding from NIH-NCI CCSG: P30 014195. We thank UC San Diego Biorepository and Tissue technology shared resource for Biospecimen collection. This work carried out at the UC San Diego Moore’s Cancer Center Comprehensive Biorepository was supported by the National Cancer Institute (NCI P30CA23100).
Footnotes
Declaration of Interests
The authors declare no competing financial interests
Additional Information
Materials generated as part of this study, including engineered rearrangement cell lines, will be made available upon request to the corresponding author, Jesse R. Dixon (jedixon@salk.edu).
Code availability
All code used as part of this study is available through GitHub (https://github.com/dixonlab/).
Data availability
All data generated as part of this study is available through the Gene Expression Omnibus (GEO) database with accession number GSE147123.
References
- 1.Dekker J & Mirny L The 3D Genome as Moderator of Chromosomal Communication. Cell 164, 1110–1121, doi: 10.1016/j.cell.2016.02.007 (2016). [DOI] [PMC free article] [PubMed] [Google Scholar]
- 2.Yu M & Ren B The Three-Dimensional Organization of Mammalian Genomes. Annu Rev Cell Dev Biol 33, 265–289, doi: 10.1146/annurev-cellbio-100616-060531 (2017). [DOI] [PMC free article] [PubMed] [Google Scholar]
- 3.Spielmann M, Lupianez DG & Mundlos S Structural variation in the 3D genome. Nat Rev Genet 19, 453–467, doi: 10.1038/s41576-018-0007-0 (2018). [DOI] [PubMed] [Google Scholar]
- 4.Ghavi-Helm Y et al. Highly rearranged chromosomes reveal uncoupling between genome topology and gene expression. Nat Genet 51, 1272–1282, doi: 10.1038/s41588-019-0462-3 (2019). [DOI] [PMC free article] [PubMed] [Google Scholar]
- 5.Akdemir KC et al. Disruption of chromatin folding domains by somatic genomic rearrangements in human cancer. Nat Genet 52, 294–305, doi: 10.1038/s41588-019-0564-y (2020). [DOI] [PMC free article] [PubMed] [Google Scholar]
- 6.Levine M, Cattoglio C & Tjian R Looping back to leap forward: transcription enters a new era. Cell 157, 13–25, doi: 10.1016/j.cell.2014.02.009 (2014). [DOI] [PMC free article] [PubMed] [Google Scholar]
- 7.Leder P et al. Translocations among antibody genes in human cancer. Science 222, 765–771, doi: 10.1126/science.6356357 (1983). [DOI] [PubMed] [Google Scholar]
- 8.Taub R et al. Translocation of the c-myc gene into the immunoglobulin heavy chain locus in human Burkitt lymphoma and murine plasmacytoma cells. Proc Natl Acad Sci U S A 79, 7837–7841, doi: 10.1073/pnas.79.24.7837 (1982). [DOI] [PMC free article] [PubMed] [Google Scholar]
- 9.Weischenfeldt J et al. Pan-cancer analysis of somatic copy-number alterations implicates IRS4 and IGF2 in enhancer hijacking. Nat Genet 49, 65–74, doi: 10.1038/ng.3722 (2017). [DOI] [PMC free article] [PubMed] [Google Scholar]
- 10.Northcott PA et al. Enhancer hijacking activates GFI1 family oncogenes in medulloblastoma. Nature 511, 428–434, doi: 10.1038/nature13379 (2014). [DOI] [PMC free article] [PubMed] [Google Scholar]
- 11.Peifer M et al. Telomerase activation by genomic rearrangements in high-risk neuroblastoma. Nature 526, 700–704, doi: 10.1038/nature14980 (2015). [DOI] [PMC free article] [PubMed] [Google Scholar]
- 12.Groschel S et al. A single oncogenic enhancer rearrangement causes concomitant EVI1 and GATA2 deregulation in leukemia. Cell 157, 369–381, doi: 10.1016/j.cell.2014.02.019 (2014). [DOI] [PubMed] [Google Scholar]
- 13.Hnisz D et al. Activation of proto-oncogenes by disruption of chromosome neighborhoods. Science 351, 1454–1458, doi: 10.1126/science.aad9024 (2016). [DOI] [PMC free article] [PubMed] [Google Scholar]
- 14.Wang X et al. Genome-wide detection of enhancer-hijacking events from chromatin interaction data in rearranged genomes. Nat Methods 18, 661–668, doi: 10.1038/s41592-021-01164-w (2021). [DOI] [PMC free article] [PubMed] [Google Scholar]
- 15.Flavahan WA et al. Insulator dysfunction and oncogene activation in IDH mutant gliomas. Nature 529, 110–114, doi: 10.1038/nature16490 (2016). [DOI] [PMC free article] [PubMed] [Google Scholar]
- 16.Flavahan WA et al. Altered chromosomal topology drives oncogenic programs in SDH-deficient GISTs. Nature 575, 229–233, doi: 10.1038/s41586-019-1668-3 (2019). [DOI] [PMC free article] [PubMed] [Google Scholar]
- 17.Dixon JR et al. Integrative detection and analysis of structural variation in cancer genomes. Nat Genet 50, 1388–1398, doi: 10.1038/s41588-018-0195-8 (2018). [DOI] [PMC free article] [PubMed] [Google Scholar]
- 18.Barutcu AR et al. RUNX1 contributes to higher-order chromatin organization and gene regulation in breast cancer cells. Biochim Biophys Acta 1859, 1389–1397, doi: 10.1016/j.bbagrm.2016.08.003 (2016). [DOI] [PMC free article] [PubMed] [Google Scholar]
- 19.Harewood L et al. Hi-C as a tool for precise detection and characterisation of chromosomal rearrangements and copy number variation in human tumours. Genome Biol 18, 125, doi: 10.1186/s13059-017-1253-8 (2017). [DOI] [PMC free article] [PubMed] [Google Scholar]
- 20.Rao SS et al. A 3D map of the human genome at kilobase resolution reveals principles of chromatin looping. Cell 159, 1665–1680, doi: 10.1016/j.cell.2014.11.021 (2014). [DOI] [PMC free article] [PubMed] [Google Scholar]
- 21.Wang Z et al. The properties of genome conformation and spatial gene interaction and regulation networks of normal and malignant human cell types. PLoS One 8, e58793, doi: 10.1371/journal.pone.0058793 (2013). [DOI] [PMC free article] [PubMed] [Google Scholar]
- 22.Taberlay PC et al. Three-dimensional disorganization of the cancer genome occurs coincident with long-range genetic and epigenetic alterations. Genome Res 26, 719–731, doi: 10.1101/gr.201517.115 (2016). [DOI] [PMC free article] [PubMed] [Google Scholar]
- 23.Guo Y et al. CRISPR Inversion of CTCF Sites Alters Genome Topology and Enhancer/Promoter Function. Cell 162, 900–910, doi: 10.1016/j.cell.2015.07.038 (2015). [DOI] [PMC free article] [PubMed] [Google Scholar]
- 24.Akdemir KC et al. Process-specific somatic mutation distributions vary with three-dimensional genome structure. bioRxiv, 426080, doi: 10.1101/426080 (2018). [DOI] [Google Scholar]
- 25.Consortium, E. P. An integrated encyclopedia of DNA elements in the human genome. Nature 489, 57–74, doi: 10.1038/nature11247 (2012). [DOI] [PMC free article] [PubMed] [Google Scholar]
- 26.Burton JN et al. Chromosome-scale scaffolding of de novo genome assemblies based on chromatin interactions. Nat Biotechnol 31, 1119–1125, doi: 10.1038/nbt.2727 (2013). [DOI] [PMC free article] [PubMed] [Google Scholar]
- 27.Engreitz JM, Agarwala V & Mirny LA Three-dimensional genome architecture influences partner selection for chromosomal translocations in human disease. PLoS One 7, e44196, doi: 10.1371/journal.pone.0044196 (2012). [DOI] [PMC free article] [PubMed] [Google Scholar]
- 28.Naumova N et al. Organization of the mitotic chromosome. Science 342, 948–953, doi: 10.1126/science.1236083 (2013). [DOI] [PMC free article] [PubMed] [Google Scholar]
- 29.Seaman L et al. Nucleome Analysis Reveals Structure-Function Relationships for Colon Cancer. Mol Cancer Res 15, 821–830, doi: 10.1158/1541-7786.MCR-16-0374 (2017). [DOI] [PMC free article] [PubMed] [Google Scholar]
- 30.Marcotte R et al. Functional Genomic Landscape of Human Breast Cancer Drivers, Vulnerabilities, and Resistance. Cell 164, 293–309, doi: 10.1016/j.cell.2015.11.062 (2016). [DOI] [PMC free article] [PubMed] [Google Scholar]
- 31.Ngoc PCT et al. Identification of novel lncRNAs regulated by the TAL1 complex in T-cell acute lymphoblastic leukemia. Leukemia 32, 2138–2151, doi: 10.1038/s41375-018-0110-4 (2018). [DOI] [PMC free article] [PubMed] [Google Scholar]
- 32.Harenza JL et al. Transcriptomic profiling of 39 commonly-used neuroblastoma cell lines. Sci Data 4, 170033, doi: 10.1038/sdata.2017.33 (2017). [DOI] [PMC free article] [PubMed] [Google Scholar]
- 33.Korbel JO & Campbell PJ Criteria for inference of chromothripsis in cancer genomes. Cell 152, 1226–1236, doi: 10.1016/j.cell.2013.02.023 (2013). [DOI] [PubMed] [Google Scholar]
- 34.Baca SC et al. Punctuated evolution of prostate cancer genomes. Cell 153, 666–677, doi: 10.1016/j.cell.2013.03.021 (2013). [DOI] [PMC free article] [PubMed] [Google Scholar]
- 35.Cortes-Ciriano I et al. Comprehensive analysis of chromothripsis in 2,658 human cancers using whole-genome sequencing. Nat Genet 52, 331–341, doi: 10.1038/s41588-019-0576-7 (2020). [DOI] [PMC free article] [PubMed] [Google Scholar]
- 36.Stephens PJ et al. Massive genomic rearrangement acquired in a single catastrophic event during cancer development. Cell 144, 27–40, doi: 10.1016/j.cell.2010.11.055 (2011). [DOI] [PMC free article] [PubMed] [Google Scholar]
- 37.Forcato M et al. Comparison of computational methods for Hi-C data analysis. Nat Methods 14, 679–685, doi: 10.1038/nmeth.4325 (2017). [DOI] [PMC free article] [PubMed] [Google Scholar]
- 38.Davidson IF & Peters JM Genome folding through loop extrusion by SMC complexes. Nat Rev Mol Cell Biol 22, 445–464, doi: 10.1038/s41580-021-00349-7 (2021). [DOI] [PubMed] [Google Scholar]
- 39.Veloza L, Ribera-Cortada I & Campo E Mantle cell lymphoma pathology update in the 2016 WHO classification. Annals of Lymphoma 3 (2019). [Google Scholar]
- 40.Canela A et al. Genome Organization Drives Chromosome Fragility. Cell 170, 507–521 e518, doi: 10.1016/j.cell.2017.06.034 (2017). [DOI] [PMC free article] [PubMed] [Google Scholar]
- 41.Dixon JR et al. Topological domains in mammalian genomes identified by analysis of chromatin interactions. Nature 485, 376–380, doi: 10.1038/nature11082 (2012). [DOI] [PMC free article] [PubMed] [Google Scholar]
- 42.Nora EP et al. Spatial partitioning of the regulatory landscape of the X-inactivation centre. Nature 485, 381–385, doi: 10.1038/nature11049 (2012). [DOI] [PMC free article] [PubMed] [Google Scholar]
- 43.Zhang Y et al. Transcriptionally active HERV-H retrotransposons demarcate topologically associating domains in human pluripotent stem cells. Nat Genet 51, 1380–1388, doi: 10.1038/s41588-019-0479-7 (2019). [DOI] [PMC free article] [PubMed] [Google Scholar]
- 44.Dixon JR et al. Chromatin architecture reorganization during stem cell differentiation. Nature 518, 331–336, doi: 10.1038/nature14222 (2015). [DOI] [PMC free article] [PubMed] [Google Scholar]
- 45.Schuijers J et al. Transcriptional Dysregulation of MYC Reveals Common Enhancer-Docking Mechanism. Cell Rep 23, 349–360, doi: 10.1016/j.celrep.2018.03.056 (2018). [DOI] [PMC free article] [PubMed] [Google Scholar]
- 46.Shi J et al. Role of SWI/SNF in acute leukemia maintenance and enhancer-mediated Myc regulation. Genes Dev 27, 2648–2662, doi: 10.1101/gad.232710.113 (2013). [DOI] [PMC free article] [PubMed] [Google Scholar]
- 47.Fulco CP et al. Systematic mapping of functional enhancer-promoter connections with CRISPR interference. Science 354, 769–773, doi: 10.1126/science.aag2445 (2016). [DOI] [PMC free article] [PubMed] [Google Scholar]
- 48.Beroukhim R et al. The landscape of somatic copy-number alteration across human cancers. Nature 463, 899–905, doi: 10.1038/nature08822 (2010). [DOI] [PMC free article] [PubMed] [Google Scholar]
- 49.Delgado MD & Leon J Myc roles in hematopoiesis and leukemia. Genes Cancer 1, 605–616, doi: 10.1177/1947601910377495 (2010). [DOI] [PMC free article] [PubMed] [Google Scholar]
- 50.Li Y et al. Patterns of somatic structural variation in human cancer genomes. Nature 578, 112–121, doi: 10.1038/s41586-019-1913-9 (2020). [DOI] [PMC free article] [PubMed] [Google Scholar]
- 51.Zhang Y et al. Spatial organization of the mouse genome and its role in recurrent chromosomal translocations. Cell 148, 908–921, doi: 10.1016/j.cell.2012.02.002 (2012). [DOI] [PMC free article] [PubMed] [Google Scholar]
- 52.Arber DA et al. The 2016 revision to the World Health Organization classification of myeloid neoplasms and acute leukemia. Blood 127, 2391–2405, doi: 10.1182/blood-2016-03-643544 (2016). [DOI] [PubMed] [Google Scholar]
- 53.Doyle LA Sarcoma classification: an update based on the 2013 World Health Organization Classification of Tumors of Soft Tissue and Bone. Cancer 120, 1763–1774, doi: 10.1002/cncr.28657 (2014). [DOI] [PubMed] [Google Scholar]
- 54.Cong L et al. Multiplex genome engineering using CRISPR/Cas systems. Science 339, 819–823, doi: 10.1126/science.1231143 (2013). [DOI] [PMC free article] [PubMed] [Google Scholar]
- 55.Zimmerman MW et al. MYC Drives a Subset of High-Risk Pediatric Neuroblastomas and Is Activated through Mechanisms Including Enhancer Hijacking and Focal Enhancer Amplification. Cancer Discov 8, 320–335, doi: 10.1158/2159-8290.CD-17-0993 (2018). [DOI] [PMC free article] [PubMed] [Google Scholar]
- 56.Fulco CP et al. Activity-by-contact model of enhancer-promoter regulation from thousands of CRISPR perturbations. Nat Genet 51, 1664–1669, doi: 10.1038/s41588-019-0538-0 (2019). [DOI] [PMC free article] [PubMed] [Google Scholar]
- 57.Zhou J Sequence-based modeling of three-dimensional genome architecture from kilobase to chromosome scale. Nat Genet 54, 725–734, doi: 10.1038/s41588-022-01065-4 (2022). [DOI] [PMC free article] [PubMed] [Google Scholar]
- 58.Lambert SA et al. The Human Transcription Factors. Cell 172, 650–665, doi: 10.1016/j.cell.2018.01.029 (2018). [DOI] [PMC free article] [PubMed] [Google Scholar]
- 59.Bradner JE, Hnisz D & Young RA Transcriptional Addiction in Cancer. Cell 168, 629–643, doi: 10.1016/j.cell.2016.12.013 (2017). [DOI] [PMC free article] [PubMed] [Google Scholar]
- 60.Khurana E et al. Role of non-coding sequence variants in cancer. Nat Rev Genet 17, 93–108, doi: 10.1038/nrg.2015.17 (2016). [DOI] [PubMed] [Google Scholar]
- 61.Lupianez DG et al. Disruptions of topological chromatin domains cause pathogenic rewiring of gene-enhancer interactions. Cell 161, 1012–1025, doi: 10.1016/j.cell.2015.04.004 (2015). [DOI] [PMC free article] [PubMed] [Google Scholar]
- 62.Lieberman-Aiden E et al. Comprehensive mapping of long-range interactions reveals folding principles of the human genome. Science 326, 289–293, doi: 10.1126/science.1181369 (2009). [DOI] [PMC free article] [PubMed] [Google Scholar]
- 63.Whyte WA et al. Master transcription factors and mediator establish super-enhancers at key cell identity genes. Cell 153, 307–319, doi: 10.1016/j.cell.2013.03.035 (2013). [DOI] [PMC free article] [PubMed] [Google Scholar]
- 64.Zuin J et al. Nonlinear control of transcription through enhancer-promoter interactions. Nature 604, 571–577, doi: 10.1038/s41586-022-04570-y (2022). [DOI] [PMC free article] [PubMed] [Google Scholar]
Methods References
- 65.Ran FA et al. Genome engineering using the CRISPR-Cas9 system. Nat Protoc 8, 2281–2308, doi: 10.1038/nprot.2013.143 (2013). [DOI] [PMC free article] [PubMed] [Google Scholar]
- 66.DePristo MA et al. A framework for variation discovery and genotyping using next-generation DNA sequencing data. Nat Genet 43, 491–498, doi: 10.1038/ng.806 (2011). [DOI] [PMC free article] [PubMed] [Google Scholar]
- 67.Selvaraj S, J, R. D., Bansal, V. & Ren, B. Whole-genome haplotype reconstruction using proximity-ligation and shotgun sequencing. Nat Biotechnol 31, 1111–1118, doi: 10.1038/nbt.2728 (2013). [DOI] [PMC free article] [PubMed] [Google Scholar]
- 68.Edge P, Bafna V & Bansal V HapCUT2: robust and accurate haplotype assembly for diverse sequencing technologies. Genome Res 27, 801–812, doi: 10.1101/gr.213462.116 (2017). [DOI] [PMC free article] [PubMed] [Google Scholar]
- 69.Dobin A et al. STAR: ultrafast universal RNA-seq aligner. Bioinformatics 29, 15–21, doi: 10.1093/bioinformatics/bts635 (2013). [DOI] [PMC free article] [PubMed] [Google Scholar]
- 70.Anders S, Pyl PT & Huber W HTSeq--a Python framework to work with high-throughput sequencing data. Bioinformatics 31, 166–169, doi: 10.1093/bioinformatics/btu638 (2015). [DOI] [PMC free article] [PubMed] [Google Scholar]
- 71.Haas BJ et al. Accuracy assessment of fusion transcript detection via read-mapping and de novo fusion transcript assembly-based methods. Genome Biol 20, 213, doi: 10.1186/s13059-019-1842-9 (2019). [DOI] [PMC free article] [PubMed] [Google Scholar]
- 72.Li H Aligning sequence reads, clone sequences and assembly contigs with BWA-MEM. arXiv e-prints, arXiv:1303.3997 (2013). <https://ui.adsabs.harvard.edu/abs/2013arXiv1303.3997L>. [Google Scholar]
- 73.Imakaev M et al. Iterative correction of Hi-C data reveals hallmarks of chromosome organization. Nat Methods 9, 999–1003, doi: 10.1038/nmeth.2148 (2012). [DOI] [PMC free article] [PubMed] [Google Scholar]
- 74.Consortium, I. T. P.-C. A. o. W. G. Pan-cancer analysis of whole genomes. Nature 578, 82–93, doi: 10.1038/s41586-020-1969-6 (2020). [DOI] [PMC free article] [PubMed] [Google Scholar]
- 75.Nakamura Y et al. Targeting of super-enhancers and mutant BRAF can suppress growth of BRAF-mutant colon cancer cells via repression of MAPK signaling pathway. Cancer Lett 402, 100–109, doi: 10.1016/j.canlet.2017.05.017 (2017). [DOI] [PubMed] [Google Scholar]
- 76.Diaferia GR et al. Dissection of transcriptional and cis-regulatory control of differentiation in human pancreatic cancer. EMBO J 35, 595–617, doi: 10.15252/embj.201592404 (2016). [DOI] [PMC free article] [PubMed] [Google Scholar]
- 77.Abraham BJ et al. Small genomic insertions form enhancers that misregulate oncogenes. Nat Commun 8, 14385, doi: 10.1038/ncomms14385 (2017). [DOI] [PMC free article] [PubMed] [Google Scholar]
- 78.Kalender Atak Z et al. Identification of cis-regulatory mutations generating de novo edges in personalized cancer gene regulatory networks. Genome Med 9, 80, doi: 10.1186/s13073-017-0464-7 (2017). [DOI] [PMC free article] [PubMed] [Google Scholar]
- 79.Ryan RJ et al. Detection of Enhancer-Associated Rearrangements Reveals Mechanisms of Oncogene Dysregulation in B-cell Lymphoma. Cancer Discov 5, 1058–1071, doi: 10.1158/2159-8290.CD-15-0370 (2015). [DOI] [PMC free article] [PubMed] [Google Scholar]
- 80.Perreault AA, Sprunger DM & Venters BJ Epigenetic and transcriptional profiling of triple negative breast cancer. Sci Data 6, 190033, doi: 10.1038/sdata.2019.33 (2019). [DOI] [PMC free article] [PubMed] [Google Scholar]
- 81.Franco HL et al. Enhancer transcription reveals subtype-specific gene expression programs controlling breast cancer pathogenesis. Genome Res 28, 159–170, doi: 10.1101/gr.226019.117 (2018). [DOI] [PMC free article] [PubMed] [Google Scholar]
- 82.Wang Y et al. CDK7-dependent transcriptional addiction in triple-negative breast cancer. Cell 163, 174–186, doi: 10.1016/j.cell.2015.08.063 (2015). [DOI] [PMC free article] [PubMed] [Google Scholar]
- 83.Feld C et al. Combined cistrome and transcriptome analysis of SKI in AML cells identifies SKI as a co-repressor for RUNX1. Nucleic Acids Res 46, 3412–3428, doi: 10.1093/nar/gky119 (2018). [DOI] [PMC free article] [PubMed] [Google Scholar]
- 84.Singh AA et al. Optimized ChIP-seq method facilitates transcription factor profiling in human tumors. Life Sci Alliance 2, e201800115, doi: 10.26508/lsa.201800115 (2019). [DOI] [PMC free article] [PubMed] [Google Scholar]
- 85.Liu NQ et al. The non-coding variant rs1800734 enhances DCLK3 expression through long-range interaction and promotes colorectal cancer progression. Nat Commun 8, 14418, doi: 10.1038/ncomms14418 (2017). [DOI] [PMC free article] [PubMed] [Google Scholar]
- 86.Wan L et al. ENL links histone acetylation to oncogenic gene expression in acute myeloid leukaemia. Nature 543, 265–269, doi: 10.1038/nature21687 (2017). [DOI] [PMC free article] [PubMed] [Google Scholar]
- 87.Saito S et al. Eradication of Central Nervous System Leukemia of T-Cell Origin with a Brain-Permeable LSD1 Inhibitor. Clin Cancer Res 25, 1601–1611, doi: 10.1158/1078-0432.CCR-18-0919 (2019). [DOI] [PMC free article] [PubMed] [Google Scholar]
- 88.Mansour MR et al. Oncogene regulation. An oncogenic super-enhancer formed through somatic mutation of a noncoding intergenic element. Science 346, 1373–1377, doi: 10.1126/science.1259037 (2014). [DOI] [PMC free article] [PubMed] [Google Scholar]
- 89.Eliades P et al. High MITF Expression Is Associated with Super-Enhancers and Suppressed by CDK7 Inhibition in Melanoma. J Invest Dermatol 138, 1582–1590, doi: 10.1016/j.jid.2017.09.056 (2018). [DOI] [PMC free article] [PubMed] [Google Scholar]
- 90.Boeva V et al. Heterogeneity of neuroblastoma cell identity defined by transcriptional circuitries. Nat Genet 49, 1408–1413, doi: 10.1038/ng.3921 (2017). [DOI] [PubMed] [Google Scholar]
- 91.Cohen AJ et al. Hotspots of aberrant enhancer activity punctuate the colorectal cancer epigenome. Nat Commun 8, 14400, doi: 10.1038/ncomms14400 (2017). [DOI] [PMC free article] [PubMed] [Google Scholar]
- 92.Valenciaga A et al. Transcriptional targeting of oncogene addiction in medullary thyroid cancer. JCI Insight 3, doi: 10.1172/jci.insight.122225 (2018). [DOI] [PMC free article] [PubMed] [Google Scholar]
- 93.Chen P et al. Symbiotic Macrophage-Glioma Cell Interactions Reveal Synthetic Lethality in PTEN-Null Glioma. Cancer Cell 35, 868–884 e866, doi: 10.1016/j.ccell.2019.05.003 (2019). [DOI] [PMC free article] [PubMed] [Google Scholar]
- 94.Zhang Y et al. Model-based analysis of ChIP-Seq (MACS). Genome Biol 9, R137, doi: 10.1186/gb-2008-9-9-r137 (2008). [DOI] [PMC free article] [PubMed] [Google Scholar]
- 95.Adrian Alexa JR topGO: Enrichment Analysis for Gene Ontology. R package version 2.48.0. doi: 10.18129/B9.bioc.topGO (2022). [DOI] [Google Scholar]
Associated Data
This section collects any data citations, data availability statements, or supplementary materials included in this article.
Supplementary Materials
Data Availability Statement
All data generated as part of this study is available through the Gene Expression Omnibus (GEO) database with accession number GSE147123.