Abstract
Background
The literature regarding the seasonal variation in the therapeutic response to warfarin is somewhat contradictory, with several discrepancies. We assessed the influence of seasons on various pharmacodynamic indices of warfarin.
Methods
A retrospective study was carried out in adults receiving warfarin for at least 6 months. Details of their demographic characteristics, duration and dose of warfarin therapy and values of prothrombin time international normalised ratio (PT-INR) were retrieved. Standard definitions were followed for defining various seasons, time in therapeutic range (TTR), log-INR variability and warfarin sensitivity index (WSI). National Institute for Health and Care Excellence (NICE) criteria were used for defining TTR into good (≥65%) and poor (<65%) anticoagulation control.
Results
Two hundred and four patients were recruited. Only a subtle statistically significant difference was observed between the numbers of patients in the various PT-INR categories. However, no significant intra-individual differences were observed in mean TTR. Similarly, the proportion of patients with poor anticoagulation control, high INR variability and high WSI was not significantly different between summer, transition period 1, winter and transition period 2.
Conclusion
No clinically significant seasonal variations were observed in the therapeutic response to warfarin.
Keywords: clinical medicine, anticoagulants, cardiology, pharmacology, thromboembolism
Introduction
Warfarin is a commonly administered oral anticoagulant in patients with thromboembolic disorders or at high risk of such disorders. Prothrombin time international normalised ratio (PT-INR) is used to monitor the therapeutic effect of warfarin, and the recommended PT-INR is between 2.5 and 3.5 for patients with mechanical heart valve replacements and between 2 and 3 for other indications.1 Recently, time spent in therapeutic range (TTR), assessed using a linear interpolation technique, has been recommended as a reliable indicator of anticoagulation status.2 In addition, variability in PT-INR is another index indicating the extent of variation observed in the therapeutic response to warfarin. The warfarin sensitivity index (WSI) indicates the therapeutic response per unit dose of warfarin.3
Several factors have been shown to impact the therapeutic response to warfarin such as age, body weight, smoking status, concomitant medications and genetic factors.4 Another less commonly evaluated factor is the seasonal influence. Contrasting literature exists regarding the influence of seasons on the therapeutic effect of warfarin. A study of 2326 patients found a larger proportion of patients with effective anticoagulation in summer compared with other seasons.5 A European study reported lowest PT-INR values in summer and highest in autumn, with a greater disposition to a subtherapeutic range in summer and supratherapeutic range in autumn.6 Although the exact mechanism for seasonal variations is unknown, several plausible theories that have been put forward include increased consumption of vitamin K-rich vegetables during summer, increased incidence of fever due to infections in autumn and winter that is often associated with concomitant potentially interacting drugs such as acetaminophen, and reduced compliance during summer due to travel impacting therapeutic response.7 8 However, there is no concrete evidence for the seasonal variations in the therapeutic effect of warfarin, so there are no recommendations from guidelines/consensus bodies. The existing studies have several drawbacks, including the fact that TTR, variability in PT-INR and WSI were not evaluated, and published data to date are available only from Western countries. In addition, these studies have assessed the seasonal influence only for one period, so the consistency of the findings is not guaranteed. Further, the seasons in the Middle East Asian sub-continent differ in duration as well as in nature from those of Western nations. High temperature in the Middle East Asia region, particularly during summer, leads to vasodilation predisposing to supratherapeutic PT-INR and consequently bleeding risks.9 In the same population, we have previously evaluated the differences in the pharmacodynamic parameters of warfarin as well as the effect of fasting during religious fasting.10 11 In the present study, we evaluated the impact of various seasons on the therapeutic response to warfarin using several pharmacodynamic indices in our population.
Methods
Study design and ethics
This was a retrospective analysis of patients receiving warfarin in an anticoagulation clinic of a tertiary care hospital. The study was carried out between September 2019 and April 2020 as a part of warfarin pharmacogenomics study after obtaining approval from the Institutional Ethics Committee.
Study procedure
Adult patients (>18 years of age) who had received warfarin for at least 6 months were included in this study. Details of their demographic characteristics (age, body weight and gender), duration and dose of warfarin therapy, and PT-INR values were retrieved. We calculated CHA₂DS₂-VASc, HASBLED and SAMe-TT2R2 scores for each participant. Bahrain has an arid type of climate with two well-defined seasons and two transition periods between the seasons—namely, summer (1 June to 30 September), transition period 1 (1 October to 30 November), winter (1 December to 31 March) and transition period 2 (1 April to 31 May).12 Only those periods were considered where there was at least one PT-INR value for two different months. Statins, proton pump inhibitors and amiodarone were considered as drugs with potential interaction. PT-INR was in the therapeutic range if it was between 2.5 and 3.5 for those who underwent heart valve replacements and between 2 and 3 for others.13 TTR was assessed using the Rosendaal method.2 National Institute for Health and Care Excellence (NICE) guidelines were followed for defining TTR into good (≥65%) and poor (<65%) anticoagulation control.14 Overall anticoagulation control was defined based on the TTR from the initiation of warfarin therapy until the last follow-up. TTR was also estimated for each season. WSI was estimated from the ratio of PT-INR on the last warfarin dose received.3 INR variability was assessed using Fihn’s index and log-INR variability was calculated.15
Statistical analysis
Descriptive statistics were used for representing the demographic variables. Age was categorised as young (<40 years); middle-aged and older adults (40–64 years); and elderly (≥65 years). Transition periods 1 and 2 were only 2 months long while summer and winter consisted of 4 months. Hence, we used congruence transformation of the variables for normalisation, where each value of the variable was divided by the square root of the sum of squares of all the original values. This approach was carried out for comparing the numbers of total, subtherapeutic, therapeutic and supratherapeutic PT-INR values across the seasons. The Kruskal–Wallis H test was used to compare the variables across the seasons, and the Bonferroni correction was applied for correcting multiple statistical testing. Normal distribution curves were plotted for log-INR variability and WSI, with those equal to and above cut-off values of mean+1 SD considered to have high INR variability and high warfarin sensitivity, respectively. A χ2 test for association was used to assess the categorical variables. 95% confidence intervals were estimated for the overall WSI and TTR post hoc. SPSS version 26 (IBM Corp, Armonk, New York, USA) was used for statistical analysis. A p value of ≤0.05 was considered statistically significant.
Results
Demographics
Two hundred and four patients were recruited; their demographic details are summarised in online supplemental table 1. One hundred and eighty-four patients (90.2%) had atrial fibrillation as the indication for receiving warfarin and the remainder had undergone heart valve replacement surgeries. Mean (SD) TTR was 66.8 (15.8)%. Seventy-seven patients (37.6%) had poor anticoagulation control. Mean (SD) WSI among the study participants was 0.7 (0.4).
ejhpharm-2021-002793supp001.pdf (199KB, pdf)
Seasonal variations in the TTR (%)
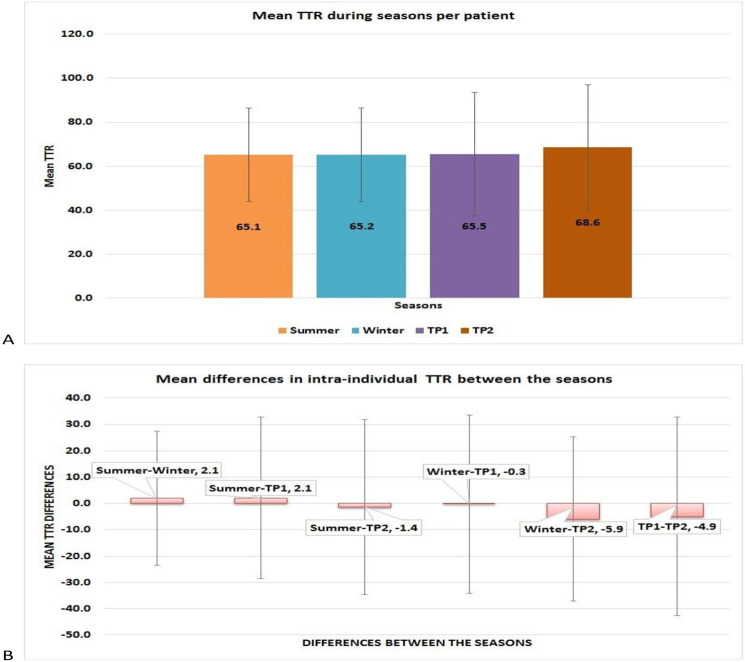
A total of 8157 PT-INR values were available, of which 2764 (33.9%) were carried out during summer, 1292 (15.8%) in transition period 1, 2703 (33.1%) during winter and 1398 (17.2%) in transition period 2. TTR was assessed for 571, 347, 530 and 371 periods in summer, transition period 1, winter and transition period 2, respectively, among the study participants. Table 1 shows the comparisons of TTR, number of times PT-INR was in therapeutic, supratherapeutic and subtherapeutic range and number of times PT-INR was >4 during the various seasons across the study participants. Only subtle differences were observed in the normalised numbers for various categories of PT-INR between the seasons. Two hundred and thirty-four (41%), 141 (40.6%), 245 (46.2%) and 145 (39.1%) periods were observed with poor anticoagulation control as per NICE criteria during summer, transition period 1, winter and transition period 2, respectively, and the proportions were not significantly different. Intra-individual mean TTR was observed to be similar across the seasons to the differences in TTR between the seasons (figure 1), and the differences were not statistically significant. Similarly, mean (SD) intra-individual TTR was 23.2 (13.8)%, 23.8 (14.5)%, 30.8 (22)% and 28.9 (21.1)% during summer, winter, transition period 1 and transition period 2, respectively, which were not significantly different. No significant differences were observed in the TTR during the various seasons between those with the target INR of 2–3 and those with 2.5–3.5 (online supplemental figures 1 and 2). Similarly, no significant differences were observed in the TTR between men and women (66.6 (16.1)% and 67 (15.6)%, respectively).
Table 1.
Comparison of normalised numbers of patients (median (range)) with PT-INR indices during different seasons
| Seasons | PT-INR category | Mean (SD) TTR (%) (95% CI) |
|||
| Subtherapeutic | Therapeutic | Supratherapeutic | >4 | ||
| Summer | 0.03 (2.1) | 0.13 (0.9) | 0.001 (1.6) | 0.00001 (1.9) | 68.2 (29.5) (65.8 to 70.63) |
| Transition period 1 | 0.0001 (1.8) | 0.12 (0.5) | 0.001 (0.7) | 0.00001 (0.2) | 65.2 (36.6) (61.9 to 64) |
| Winter | 0.02 (1.4) | 0.14 (0.7) | 0.001 (1.5) | 0.00001 (1.5) | 64.9 (29.3) (62.4 to 67.4) |
| Transition period 2 | 0.0001 (1) | 0.1 (0) | 0.001 (1) | 0.00001 (1) | 67.5 (36) (63.8 to 71.2) |
| P values | 0.0001*† | 0.09 | 0.0001*‡ | 0.005*§ | 0.03*¶ |
*Statistically significant.
†Comparisons between all the periods except between summer and winter were significantly different in the post hoc test.
‡Comparisons between all the periods were significant except between summer and winter and between transition period 2 and winter.
§Comparisons between winter and summer and between transition periods 1 and 2 were significantly different.
¶Comparison between transition periods 1 and 2 were significantly different.
PT-INR, prothrombin time international normalised ratio; TTR, time in therapeutic range.
Figure 1.
Comparison of intra-individual time in therapeutic range (TTR, %) during seasons and mean differences in TTR between the seasons. (A) Mean TTR across the seasons was similar. (B) Differences in the mean TTR between the seasons were not significantly different.
Seasonal variations in the PT-INR variability
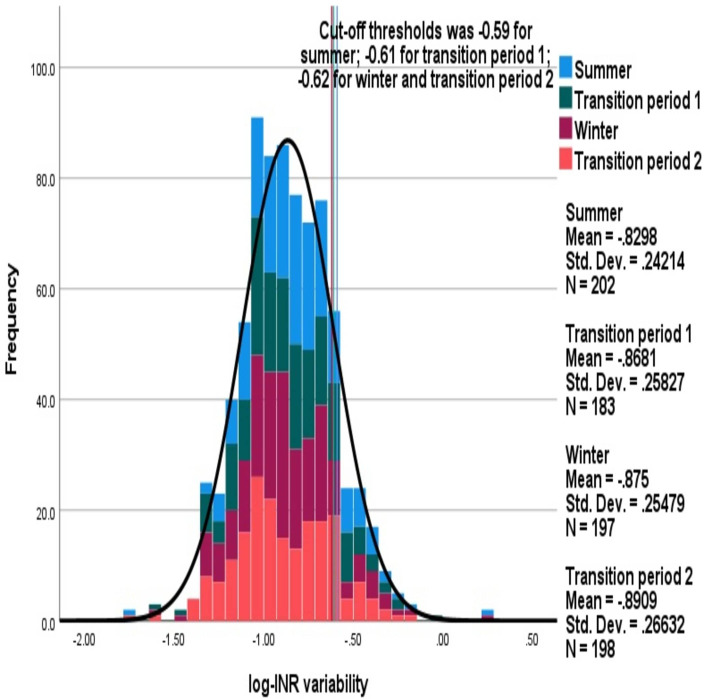
Mean (SD) average log-INR variability in summer, transition period 1, winter and transition period 2 were −0.83 (0.24), –0.87 (0.26), –0.88 (0.25) and −0.9 (0.27), respectively, and were not significantly different. Comparisons of the distributions of average log-INR variability between different seasons are shown in figure 2. The cut-off threshold values for defining individuals with high INR variability was similar across the seasons: 32 (15.8%), 32 (17.5%), 26 (13.2%) and 31 (15.7%) had high INR variability in the summer, transition period 1, winter and transition period 2, respectively, which was not significantly different.
Figure 2.
Comparison of distributions of average log-INR variability between the seasons. The stacked histogram shows the log-INR variability during each season.
Seasonal variations in WSI
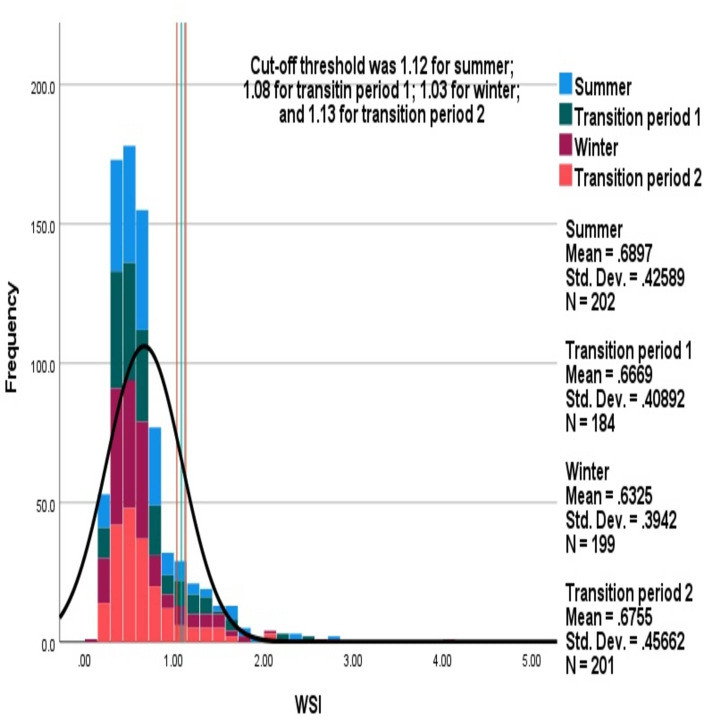
Mean (SD) average WSI in summer, transition period 1, winter and transition period 2 were 0.69 (0.43) (95% CI 0.63 to 0.75), 0.67 (0.41) (95% CI 0.63 to 0.71), 0.63 (0.4) (95% CI 0.59 to 0.67) and 0.68 (0.46) (95% CI 0.64 to 0.73), respectively, which were not significantly different. Comparisons of distributions of average WSI between different seasons are shown in figure 3. Similar cut-off values were observed for defining high WSI between the seasons: 22 (10.9%), 27 (14.7%), 29 (14.6%) and 22 (10.9%) were observed with high WSI during summer, transition period 1, winter and transition period 2, respectively, which was not significantly different.
Figure 3.
Comparison of distributions of average warfarin sensitivity index (WSI) between the seasons. The stacked histogram shows WSI during each season.
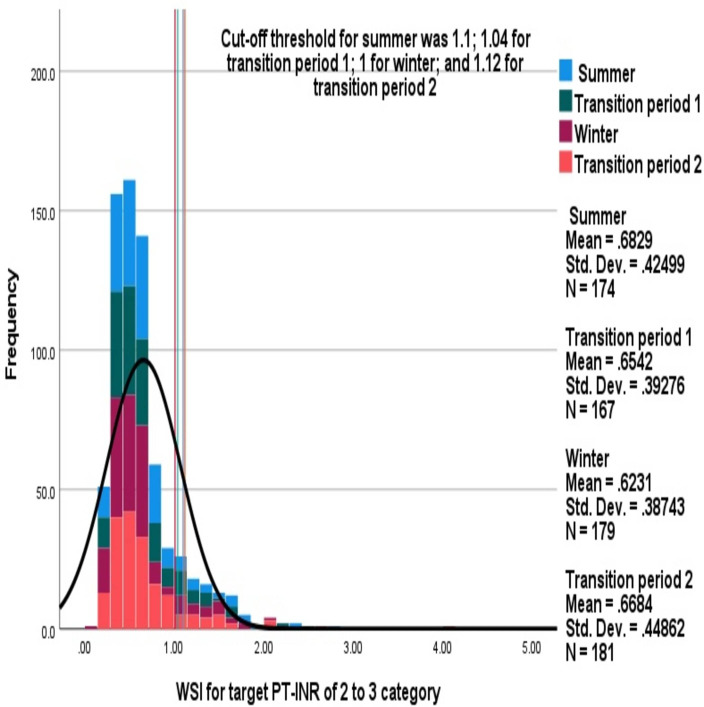
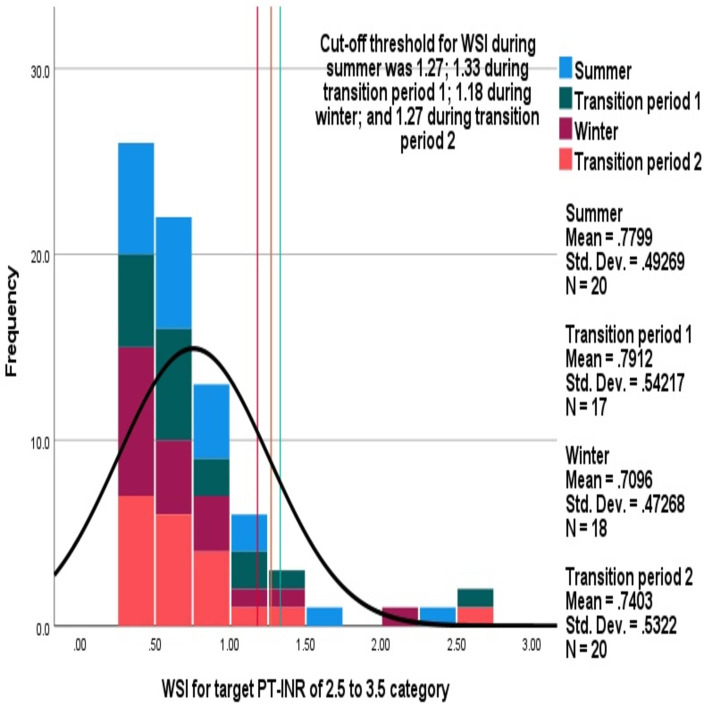
Mean (SD) average WSI for patients with non-valvular atrial fibrillation was 0.66 (0.4) and 0.7 (0.5) for those with heart valve replacement surgery. No significant differences were observed in either of these categories between the various seasons (figures 4 and 5). Men had a significantly lower WSI than women (0.6 (0.4) vs 0.7 (0.4); p=0.04); however, no significant seasonal variations were observed between the sexes (online supplemental figures 3 and 4).
Figure 4.
Comparison of average warfarin sensitivity index (WSI) across the seasons in patients with non-valvular atrial fibrillation. The stacked histogram shows the WSI observed during each season among patients with the target prothrombin time international normalised ratio (PT-INR) of 2–3.
Figure 5.
Comparison of average warfarin sensitivity index (WSI) across the seasons in patients who had undergone heart valve replacement surgery. The stacked histogram shows the WSI observed during each season among patients with the target prothrombin time international normalised ratio (PT-INR) of 2–3.
Discussion
We analysed the differences in seasonal influences on the therapeutic response to warfarin in 204 patients. Only a subtle statistically significant difference was observed between the numbers of patients in the various PT-INR categories. However, no significant intra-individual differences were observed in mean TTR. Similarly, the proportion of patients with poor anticoagulation control, log-INR variability and WSI were not significantly different between summer, transition period 1, winter and transition period 2.
The first study evaluating the seasonal influence of the therapeutic effect of warfarin was from Europe in a large cohort which found a significant difference between summer and autumn seasons but the mean PT-INR was 2.7 and 3.1, respectively.6 Although a recent study in patients who had undergone mechanical heart valve replacement surgery, presented in a conference abstract, observed statistically significant reductions in the PT-INR from summer to winter, the absolute fall in the PT-INR was from 2.8 to 2.6, which was not clinically significant.16 Corroborating this, an increased incidence of cardioembolic events has been reported in patients with atrial fibrillation during winter.17 Another study in patients receiving warfarin showed an increased incidence of bleeding episodes during summer and increased embolic attacks during winter.18 Similarly, Telman et al found that patients with acute ischaemic stroke had the highest mortality during the winter season,19 while Stout and Crawford found that plasma fibrinogen concentrations were 23% higher during the winter season.20 On the other hand, Oberg et al found the incidence of ischaemic stroke to be significantly higher in the summer season in general.21 However, in that study fewer than one-tenth of patients were receiving coumarin anticoagulant. A recent systematic review evaluating the impact of influenza vaccination in winter on the therapeutic response to warfarin was inconclusive and did not indicate any consistent effect.22 In addition to the reasons theorised earlier to explain the seasonal variation in the therapeutic response, exposure of warfarin tablets to high temperature during summer, even for short periods, may reduce the potency of the drug. However, a study from the Caribbean did not find any such difference in warfarin tablets during the summer season,23 but this may not be applicable to our population as the temperature in the Caribbean is around 28°C while, in the Middle East, it is around 50°C. Hence, further in vitro/in vivo studies are needed to confirm or refute the influence of temperature. A recent study in an emergency department which evaluated the bleeding episodes in patients receiving warfarin over 1 year did not find any seasonal variation in the incidence.24 Hence, the current evidence is inconclusive of any adverse changes in the therapeutic effect of warfarin due to seasons, as observed in the present study. We found that women had a higher WSI than men, corroborating the findings of previous studies.25 26
To date, the present study is the only one that has evaluated the seasonal influence on various pharmacodynamic indices of warfarin of significance. Also, we have evaluated the seasonal variation over several periods. However, the study has several limitations: we have considered fixed dates of the years for defining seasons, which may vary between years; and details about thrombotic attacks, bleeding episodes and compliance were not available.
In conclusion, no clinically significant variations were observed in the therapeutic response to warfarin.
What this paper adds.
What is already known
Seasonal variations in the therapeutic response to warfarin have been observed in Western populations.
Studies are limited in not having evaluated all the clinically significant pharmacodynamic parameters.
What this study adds
This is the first study to evaluate the seasonal variations using all the validated pharmacodyamic parameters of warfarin.
Only subtle differences were observed between different seasons in the Bahraini population.
Footnotes
Contributors: Conception of the idea: KS. Data collection: KS, RA, AH. Data analysis and interpretation, and writing the first draft of the manuscript: KS. Revision and final approval of the manuscript: KS, RA, AH.
Funding: The study was a part of the grant AGU RCSI – 02/2019.
Competing interests: None declared.
Provenance and peer review: Not commissioned; internally peer reviewed.
Supplemental material: This content has been supplied by the author(s). It has not been vetted by BMJ Publishing Group Limited (BMJ) and may not have been peer-reviewed. Any opinions or recommendations discussed are solely those of the author(s) and are not endorsed by BMJ. BMJ disclaims all liability and responsibility arising from any reliance placed on the content. Where the content includes any translated material, BMJ does not warrant the accuracy and reliability of the translations (including but not limited to local regulations, clinical guidelines, terminology, drug names and drug dosages), and is not responsible for any error and/or omissions arising from translation and adaptation or otherwise.
Data availability statement
Data are available upon reasonable request. The data will be shared upon a reasonable request.
Ethics statements
Patient consent for publication
Not required.
References
- 1. Kuruvilla M, Gurk-Turner C. A review of warfarin dosing and monitoring. Proc 2001;14:305–6. 10.1080/08998280.2001.11927781 [DOI] [PMC free article] [PubMed] [Google Scholar]
- 2. Rosendaal FR, Cannegieter SC, van der Meer FJ, et al. A method to determine the optimal intensity of oral anticoagulant therapy. Thromb Haemost 1993;69:236–9. 10.1055/s-0038-1651587 [DOI] [PubMed] [Google Scholar]
- 3. Katada Y, Nakagawa S, Nishimura A, et al. Effects of fasting on warfarin sensitivity index in patients undergoing cardiovascular surgery. Eur J Clin Pharmacol 2019;75:561–8. 10.1007/s00228-018-2592-4 [DOI] [PubMed] [Google Scholar]
- 4. Abdel-Aziz MI, Ali MAS, Hassan AKM, et al. Factors influencing warfarin response in hospitalized patients. Saudi Pharm J 2015;23:642–9. 10.1016/j.jsps.2015.02.004 [DOI] [PMC free article] [PubMed] [Google Scholar]
- 5. Golubić K, Angebrandt P, Vranešić II, et al. Seasonal variation in the effectiveness of anticoagulation therapy of adults with atrial fibrillation: is the International normalized ratio value higher in summer time? Cardiol Croat 2017;12:373. 10.15836/ccar2017.373 [DOI] [Google Scholar]
- 6. Salobir B, Sabovic M, Peternel P. Intensity of long-term treatment with warfarin is influenced by seasonal variations. Pathophysiol Haemost Thromb 2002;32:151–4. 10.1159/000070419 [DOI] [PubMed] [Google Scholar]
- 7. Lubetsky A, Dekel-Stern E, Chetrit A, et al. Vitamin K intake and sensitivity to warfarin in patients consuming regular diets. Thromb Haemost 1999;81:396–9. 10.1055/s-0037-1614485 [DOI] [PubMed] [Google Scholar]
- 8. Hylek EM, Heiman H, Skates SJ, et al. Acetaminophen and other risk factors for excessive warfarin anticoagulation. JAMA 1998;279:657–62. 10.1001/jama.279.9.657 [DOI] [PubMed] [Google Scholar]
- 9. Ringwald J, Strobel J, Eckstein R. Travel and oral anticoagulation. J Travel Med 2009;16:276–83. 10.1111/j.1708-8305.2009.00304.x [DOI] [PubMed] [Google Scholar]
- 10. Sridharan K, Al Banna R, Qader AM, et al. Evaluation of inter-patient variability in the pharmacodynamic indices of warfarin. Expert Rev Cardiovasc Ther 2020;18:835–40. 10.1080/14779072.2020.1814144 [DOI] [PubMed] [Google Scholar]
- 11. Sridharan K, Al Banna R, Qader AM, et al. Does fasting during Ramadan influence the therapeutic effect of warfarin? J Clin Pharm Ther 2021;46:86–92. 10.1111/jcpt.13254 [DOI] [PubMed] [Google Scholar]
- 12. Meteorological Directorate . Bahrain climate. Available: http://www.bahrainweather.gov.bh/web/guest/climate [Accessed 17 Jul 2020].
- 13. Brace LD. Current status of the International normalized ratio. Lab Med 2001;32:390–2. 10.1309/2RN7-44HB-WP2R-Q6B3 [DOI] [Google Scholar]
- 14. National Institute for Health and Care Excellence . Atrial fibrillation. Quality statement 4: anticoagulation control. Available: https://www.nice.org.uk/guidance/qs93/chapter/quality-statement-4-anticoagulation-control [Accessed 27 July 2020].
- 15. Fihn SD, Gadisseur AAP, Pasterkamp E, et al. Comparison of control and stability of oral anticoagulant therapy using acenocoumarol versus phenprocoumon. Thromb Haemost 2003;90:260–6. 10.1160/TH02-10-0179 [DOI] [PubMed] [Google Scholar]
- 16. Alshnaikat S, Sirriyeh R, Obeid F, et al. Circannual variations in the International normalized ratio (INR) among mechanical heart valve surgery patients on life-long warfarin. J Saudi Heart Assoc 2018;30:357–8. 10.1016/j.jsha.2018.05.007 [DOI] [Google Scholar]
- 17. Spengos K, Vemmos K, Tsivgoulis G, et al. Diurnal and seasonal variation of stroke incidence in patients with cardioembolic stroke due to atrial fibrillation. Neuroepidemiology 2003;22:204–10. 10.1159/000069897 [DOI] [PubMed] [Google Scholar]
- 18. Narang S, Banerjee A, Satsangi DK, et al. Seasonal variation in thrombogenicity of blood: a word of caution. Asian Cardiovasc Thorac Ann 2009;17:25–8. 10.1177/0218492309102625 [DOI] [PubMed] [Google Scholar]
- 19. Telman G, Fahoum S, Sprecher E. Seasonal, monthly, and weekly variations in admissions, in-hospital mortality, and length of stay in acute ischemic stroke in northern Israel. J Neurol Transl Neurosci 2013;1:1007. [Google Scholar]
- 20. Stout RW, Crawford V. Seasonal variations in fibrinogen concentrations among elderly people. Lancet 1991;338:9–13. 10.1016/0140-6736(91)90004-9 [DOI] [PubMed] [Google Scholar]
- 21. Oberg AL, Ferguson JA, McIntyre LM, et al. Incidence of stroke and season of the year: evidence of an association. Am J Epidemiol 2000;152:558–64. 10.1093/aje/152.6.558 [DOI] [PubMed] [Google Scholar]
- 22. Kuo AM, Brown JN, Clinard V. Effect of influenza vaccination on international normalized ratio during chronic warfarin therapy. J Clin Pharm Ther 2012;37:505–9. 10.1111/j.1365-2710.2012.01341.x [DOI] [PubMed] [Google Scholar]
- 23. Gage BF, Fihn SD, White RH. Seasonal control of warfarin therapy. Am J Med 2001;111:332. 10.1016/S0002-9343(01)00889-0 [DOI] [PubMed] [Google Scholar]
- 24. Ozturk M, Ipekci A, Kiyak SK, et al. Bleeding complications in warfarin-treated patients admitted to the emergency department. J Clin Med Res 2019;11:106–13. 10.14740/jocmr3669 [DOI] [PMC free article] [PubMed] [Google Scholar]
- 25. Khoury G, Sheikh-Taha M. Effect of age and sex on warfarin dosing. Clin Pharmacol 2014;6:103–6. 10.2147/CPAA.S66776 [DOI] [PMC free article] [PubMed] [Google Scholar]
- 26. Liew C-L, Yen J-H, Liu A-B, et al. Sex differences in the effective warfarin dosage in Han and Aboriginal Taiwanese patients with the VKORC1-1639AA genotype. Tzu Chi Med J 2013;25:213–7. 10.1016/j.tcmj.2013.06.005 [DOI] [Google Scholar]
Associated Data
This section collects any data citations, data availability statements, or supplementary materials included in this article.
Supplementary Materials
ejhpharm-2021-002793supp001.pdf (199KB, pdf)
Data Availability Statement
Data are available upon reasonable request. The data will be shared upon a reasonable request.


