

Summary
Mesophyll CO2 conductance (g m) in C3 species responds to short‐term (minutes) changes in environment potentially due to changes in leaf anatomical and biochemical properties and measurement artefacts. Compared with C3 species, there is less information on g m responses to short‐term changes in environmental conditions such as partial pressure of CO2 (pCO2) across diverse C4 species and the potential determinants of these responses.
Using 16 C4 grasses we investigated the response of g m to short‐term changes in pCO2 and its relationship with leaf anatomy and biochemistry.
In general, g m increased as pCO2 decreased (statistically significant increase in 12 species), with percentage increases in g m ranging from +13% to +250%. Greater increase in g m at low pCO2 was observed in species exhibiting relatively thinner mesophyll cell walls along with greater mesophyll surface area exposed to intercellular air spaces, leaf N, photosynthetic capacity and activities of phosphoenolpyruvate carboxylase and Rubisco. Species with greater CO2 responses of g m were also able to maintain their leaf water‐use efficiencies (TEi) under low CO2.
Our study advances understanding of CO2 response of g m in diverse C4 species, identifies the key leaf traits related to this response and has implications for improving C4 photosynthetic models and TEi through modification of g m.
Keywords: C4 photosynthesis, carbonic anhydrase (CA), CO2 response of mesophyll conductance, leaf anatomy, mesophyll cell wall thickness, PEPC affinity for bicarbonate (K m), phosphoenolpyruvate carboxylase (PEPC), water‐use efficiency
Introduction
Mesophyll CO2 conductance (g m) describes the movement of CO2 from substomatal cavities across the intercellular air space, cell walls and membranes to the site of first carboxylation. This carboxylation occurs in the mesophyll chloroplast in species with the C3 photosynthetic pathway and mesophyll cytosol in species with the C4 photosynthetic pathway (Evans & von Caemmerer, 1996). g m varies across plant groups due to variation in leaf anatomy and biochemistry, changes dynamically in response to environmental stimuli and has a significant impact on the plant and ecosystem‐level photosynthetic CO2 uptake and water‐use efficiency (Evans et al., 2009; Flexas et al., 2014; Knauer et al., 2019b; Pathare et al., 2020a). Despite its importance for photosynthetic CO2 uptake and water‐use at both plant and ecosystem levels and its variation across diverse plants groups, g m is only beginning to be explicitly implemented into global models that upscale leaf‐scale photosynthetic processes to canopy and global scales (Rogers et al., 2017; Knauer et al., 2019a,b; von Caemmerer, 2021). The implementation of g m is complicated because there is a lack of detailed information on responses of g m to short and long‐term changes in environmental conditions (e.g. light, precipitation, temperature and CO2 concentration) across diverse plant groups (Rogers et al., 2017; Knauer et al., 2019a,b). Most investigations on the responses of g m to changes in environmental conditions have focussed on C3 species (von Caemmerer & Evans, 2015; Xiong et al., 2015; Carriqui et al., 2018; Shrestha et al., 2018), but there is less information on the response of g m to changing environmental conditions in diverse C4 species (Ubierna et al., 2017, 2018; Kolbe & Cousins, 2018; Sonawane et al., 2021). A better understanding of how C4–g m responds to changing environmental conditions is essential for improving the models of C4 photosynthesis at both the leaf and global scales (Rogers et al., 2017; Knauer et al., 2019a,b; von Caemmerer, 2021) as well as for potentially increasing water‐use efficiency of C4 crops through manipulation of g m (Cousins et al., 2020; Pathare et al., 2020a).
The influence of g m on C3 photosynthesis has been well studied for the past several years and there has been a significant understanding of C3–g m and its responses to changes in long‐term growth conditions and short‐term measurements conditions. In general, g m varies greatly among diverse C3 species and limits C3 photosynthesis as much as stomatal conductance (g sw) (Flexas et al., 2014; Muir et al., 2014; Barbour & Kaiser, 2016; Veromann‐Jürgenson et al., 2017). Variation in C3–g m is influenced by leaf ontogenic and anatomical traits such as leaf development and senescence (Grassi & Magnani, 2005; Barbour et al., 2016), surface area of chloroplasts appressed to intercellular air space (S c) (Tosens et al., 2012; Peguero‐Pina et al., 2016), mesophyll cell wall thickness (T CW) (Veromann‐Jürgenson et al., 2017; Ellsworth et al., 2018; Evans, 2021) and leaf thickness (Flexas et al., 2008; Muir et al., 2014). In terms of responses to long‐term growth conditions, C3–g m is influenced by water stress, elevated CO2, salinity, nutrient supplement and growth latitude (Flexas et al., 2008; Momayyezi & Guy, 2017; Mizokami et al., 2018; Shrestha et al., 2018). Additionally, rapid responses of g m (within minutes) have been observed in response to short‐term changes in leaf temperature, quantity and quality of light, relative humidity and CO2 concentrations (Hassiotou et al., 2009; von Caemmerer & Evans, 2015; Xiong et al., 2015), although not always (Loreto et al., 1992; Tazoe et al., 2009). However, there is no consensus on the exact cause of rapid responses of g m to changes in environmental conditions such as CO2.
Some studies have suggested that rapid changes in g m in C3 plants can be explained by changes in chloroplast position and movement that could lead to short‐term change in S c (Oguchi et al., 2005; Tholen et al., 2008; Terashima et al., 2011). However, mesophyll cell wall thickness (T CW) and composition are considered invariable in the short term (minutes) and may not explain the rapid responses of g m (Evans et al., 2009; Terashima et al., 2011; Carriqui et al., 2018). Alternatively, the rapid responses of C3–g m have also been attributed to changes in activities of key photosynthetic enzymes such as carbonic anhydrase (CA), which catalyses the conversion of CO2 to HCO3 − (Evans et al., 2009; Momayyezi & Guy, 2017) and the facilitation effect of CO2‐permeable aquaporins (Uehlein et al., 2008; Flexas et al., 2012; Kaldenhoff, 2012; Groszmann et al., 2017; but please refer to Kromdijk et al., 2019; Huang et al., 2021). Still, other groups have suggested that the rapid responses of C3–g m could be the result of systematic methodological errors or the use of oversimplified models. These include mathematical dependency of g m on other variables (such as A net and C i) used to calculate it in fluorescence and Δ13C methods, neglecting the contribution of respiratory and photorespiratory CO2 release to the total CO2 pool in the leaf and inaccurate measurement of day respiration or estimates of the Rubisco fractionation factor in the Δ13C method (Tholen & Zhu, 2011; Gu & Sun, 2014; Carriqui et al., 2018; Ubierna et al., 2019). The exact mechanism underlying the CO2 responses of C3–g m therefore remains controversial. However, considerable evidence based on diverse species and methods of estimating g m have suggested that the C3–g m values increase at low partial pressures of CO2 (pCO2).
There has been a recent increase in research on the short‐term and long‐term variability of g m in diverse C4 species and in the leaf traits that could explain this variability (Barbour et al., 2016; Cano et al., 2019; Pathare et al., 2020a,b). Our recent study demonstrated that, as for C3 species, g m varied significantly among diverse C4 grasses and had significant effects on photosynthetic rates and leaf water‐use efficiencies (Pathare et al., 2020a). This variation in C4–g m was correlated with leaf‐level traits such as leaf thickness, stomatal ratio (SR), adaxial stomatal densities and Smes. We also demonstrated that C4 grasses adapted to low precipitation habitats exhibited traits related to greater g m but lower leaf hydraulic conductance compared with grasses from habitats with relatively high precipitation (Pathare et al., 2020b). These studies have advanced our understanding of the variability of g m in C4 grasses, as well as how g m is influenced by leaf‐level traits and is affected by long‐term growth conditions such as precipitation. However, there is still a limited understanding of how g m in diverse C4 grasses responds to short‐term changes in environmental conditions such as CO2. The few previous studies have largely focussed on a few species such as sorghum, maize and Setaria (Osborn et al., 2017; Kolbe & Cousins, 2018; Ubierna et al., 2018; Sonawane & Cousins, 2020). To the best of our knowledge, no studies to date have explored if g m responses to short‐term changes in pCO2 vary among diverse C4 grasses and what potential anatomical and biochemical traits could explain this variation in CO2 response of C4–g m.
The overall objectives of the current study were (1) to investigate the response of g m to short‐term changes in pCO2 in diverse C4 species, (2) identify the anatomical and biochemical traits that may explain the variable CO2 response of C4–g m, and (3) evaluate the impact of varying CO2 responses of g m on changes in photosynthesis and leaf water‐use efficiency. To address the above objectives, we estimated g m under changing pCO2 in 16 diverse C4 grasses (please refer to Pathare et al., 2020a for details), using the most recent method described by Ogee et al. (2018). We also investigated the relationship of leaf anatomical traits, previously known to influence C4–g m, with variable CO2 responses of g m in the 16 C4 grasses. Furthermore, we investigated the impacts of photosynthetic capacity on the CO2 response of g m in these C4 grasses through measurements of maximum photosynthetic rates (A max), leaf nitrogen content (Narea), activities of key enzymes of C4 photosynthetic pathway such as CA, phosphoenolpyruvate carboxylase (PEPC) and ribulose‐1,5‐bisphosphate carboxylase/oxygenase (Rubisco) and PEPC affinity for its substrate HCO3 − (K m). Narea is integral to the proteins of photosynthetic machinery (such as PEPC, Rubisco and CA) that, along with the leaf structure, are responsible for the drawdown of CO2 inside the leaf (Parkhurst, 1994; Wright et al., 2004; Evans et al., 2009; DiMario et al., 2018).
Materials and Methods
Plant growth
Sixteen C4 grasses (Table 1) were selected for this study. In the graphs, each species is identified by four letter word that combines the first letter of the genus and first three letters of the species name. The plants were raised from seeds and grown in 3‐l free drainage pots in a controlled environment growth chamber (model GC‐16; Enconair Ecological Chambers Inc., Winnipeg, MB, Canada). The photoperiod was 14 h including a 2 h ramp at the beginning and end of the light period. Light and dark temperatures were maintained at 26 and 22°C, respectively. Light was provided by 400‐W metal halide and high‐pressure sodium lamps with maximum photosynthetic photon flux density (PPFD) of c. 1000 μmol photons m−2 s−1 at plant height. One individual per species was grown per pot in a Sunshine mix LC‐1 soil (Sun Gro Horticulture, Agawam, MA, USA) with five or six replicate pots per species. The plants were irrigated daily to pot saturation and fertilised twice a week with Peters 20–20–20 (2.5 g l−1). Pots were randomised daily within the growth chamber.
Table 1.
Mean ± SE (n = 3–6) values along with the corresponding letters of post‐hoc Tukey's test for important leaf‐level anatomical and biochemical traits measured for the 16 C4 grasses.
| Species | Species code | T CW (μm) | Smes (μm2 μm−2) | SR (unitless) | SDada (number mm−2) | Leaf thickness (μm) | PEPC activity (μmol m−2 s−1) | Rubisco activity (μmol m−2 s−1) | k CA (μmol m−2 s−1 Pa−1) | K m (μM HCO3 −1) | A max (μmol CO2 m−2 s−1) | Narea (gm−2) |
|---|---|---|---|---|---|---|---|---|---|---|---|---|
| Chloris gayana | cgay | 0.09 ± 0.012 a | 9.3 ± 0.5 bcf | 0.62 ± 0.08 c | 106.2 ± 6.74 fhi | 153 ± 9.4 bc | 112 ± 13 bf | 32 ± 3 bh | 19 ± 1 cdeg | 29 ± 0.8 ad | 35.6 ± 1 abc | 1.81 ± 0.16 abcd |
| Danthoniopsis dinteri | ddin | 0.11 ± 0.005 ab | 18.6 ± 1.3 a | 1.45 ± 0.08 ab | 142.9 ± 4.5 abc | 241 ± 1.7 a | 156 ± 8 bc | 81 ± 4 a | 49 ± 4 ab | 33 ± 1.4 abcd | 42.4 ± 1.1 a | 2.25 ± 0.07 a |
| Digitaria sanguinalis | dsan | 0.11 ± 0.009 abcd | 8.9 ± 0.6 bc | 0.52 ± 0.02 c | 40.4 ± 3.26 de | 155 ± 8.3 bc | 721 ± 33 a | 30 ± 1 b | 13 ± 2 cde | 44 ± 1.6 ef | 33.2 ± 2.8 bcde | 1.5 ± 0.09 bcd |
| Eriachne aristidea | eari | 0.08 ± 0.004 a | 13.1 ± 0.2 de | 2.33 ± 0.11 d | 130 ± 5.53 abf | 216 ± 3.6 ad | 348 ± 46 de | 79 ± 4 ac | 74 ± 6 af | 36 ± 1.1 abceg | 37.7 ± 2.2 abc | 2.22 ± 0.09 a |
| Echinochloa colona | ecol | 0.11 ± 0.006 abc | 10 ± 0.3 bcdef | 0.82 ± 0.02 ce | 68.7 ± 4.17 dg | 168 ± 3.5 bef | 408 ± 11 de | 50 ± 2 de | 72 ± 1 af | 46 ± 2.1 f | 42.5 ± 0.9 a | 1.71 ± 0.03 abcd |
| Eragrostis curvula | ecur | 0.17 ± 0.03 cdef | 10.6 ± 0.6 bcdef | 1.09 ± 0.07 ef | 97.8 ± 7.39 hi | 176 ± 17.9 bdef | 97 ± 14 f | 43 ± 0 dfgh | 35 ± 2 bg | 34 ± 0.7 abcdg | 38 ± 0.7 abc | 2.22 ± 0.22 a |
| Eleusine indica | eind | 0.12 ± 0.006 abcde | 10 ± 0.4 bcdef | 1.41 ± 0.07 abf | 155.8 ± 2.91 ac | 186 ± 1.8 bdef | 149 ± 15 bcf | 41 ± 3 bdfgh | 14 ± 2 cde | 33 ± 1.3 abcd | 41.1 ± 0.5 ab | 2.05 ± 0.14 abc |
| Eriochloa sericea | eser | 0.1 ± 0.001 abc | 11.3 ± 0.4 bcdef | 1.41 ± 0.11 af | 89.8 ± 2.55 gh | 184 ± 2.8 bdef | 496 ± 16 ad | 59 ± 2 ce | 86 ± 2 f | 41 ± 0.9 efg | 35.5 ± 2.8 abc | 2.08 ± 0.1 ac |
| Heteropogon contortus | hcon | 0.18 ± 0.004 ef | 9.9 ± 0.3 bcdf | 0.56 ± 0.02 c | 53.9 ± 2.98 d | 119 ± 8.5 c | 116 ± 21 bf | 36 ± 2 bfgh | 9 ± 1 c | 35 ± 1.2 abcdg | 25.6 ± 2.7 de | 1.24 ± 0.07 d |
| Ischaemum afrum | iafr | 0.1 ± 0.012 a | 12.4 ± 0.3 def | 0.81 ± 0.03 ce | 157.3 ± 10.11 c | 153 ± 5.3 bc | 323 ± 28 de | 48 ± 2 deg | 25 ± 1 deg | 39 ± 0.9 cefg | 33.6 ± 1.6 bcd | 1.43 ± 0.08 d |
| Paspalum dilatatum | pdil | 0.21 ± 0.005 f | 8.5 ± 0.3 b | 0.68 ± 0.05 c | 52 ± 3.62 d | 150 ± 9.7 bc | 185 ± 8 cg | 38 ± 1 bdfgh | 15 ± 3 cde | 31 ± 0.9 abd | 30.6 ± 0.4 cde | 1.39 ± 0.1 d |
| Paspalum macrophyllum | pmac | 0.18 ± 0.022 def | 9.8 ± 0.4 bcdf | 0.12 ± 0.01 g | 12 ± 1.04 e | 159 ± 6.2 bce | 162 ± 8 bc | 30 ± 2 b | 12 ± 1 cd | 37 ± 2.2 bceg | 25.3 ± 1.1 e | 1.47 ± 0.05 bd |
| Panicum maximum | pmax | 0.12 ± 0.005 abcd | 11.9 ± 0.2 cdef | 1.76 ± 0.12 b | 111.8 ± 5.14 fhi | 161 ± 2.4 bce | 155 ± 9 bcf | 44 ± 3 dfg | 69 ± 5 af | 30 ± 2.7 abd | 38.1 ± 0.9 abc | 1.72 ± 0.01 abcd |
| Panicum miliaceum | pmil | 0.11 ± 0.001 abc | 11.8 ± 1.4 cdef | 1.31 ± 0.04 af | 88.6 ± 4.52 gh | 212 ± 11.4 ad | 199 ± 17 cg | 31 ± 2 b | 78 ± 3 f | 30 ± 1.1 abd | 38.6 ± 0.4 abc | 1.77 ± 0.04 abcd |
| Panicum virgatum | pvir | 0.17 ± 0.03 bcdef | 13.6 ± 1.3 e | 1.28 ± 0.04 af | 117.3 ± 7.89 bfi | 210 ± 12.9 adf | 296 ± 38 eg | 62 ± 5 ace | 165 ± 22 h | 29 ± 0.2 d | 36.9 ± 1.5 abc | 2.27 ± 0.22 a |
| Urochloa dictyoneura | udic | 0.08 ± 0.003 a | 9.9 ± 0.6 bcdf | 1.11 ± 0.03 ef | 129 ± 5.08 abf | 201 ± 4.6 adef | 154 ± 8 bcf | 34 ± 2 bfh | 29 ± 2 beg | 46 ± 1.7 f | 37.4 ± 0.6 abc | 1.29 ± 0.05 d |
Species code was created using first letter of the genus and first three letters of the species. Results of one‐way ANOVA are given in Supporting Information Table S2. Information on species biochemical subtypes can be found in Table S3. Values for T CW, Smes, SR, SDada, Leaf thickness, k CA and Narea have been published in Pathare et al. (2020a), whereas values for K m have been published in DiMario et al. (2021). Mesophyll cell wall thickness (T CW), total mesophyll cell surface area exposed to intercellular air space per unit of leaf surface area (Smes), stomatal ratio (SR), adaxial stomatal density (SDada), phosphoenolpyruvate carboxylase activity (PEPC), carbonic anhydrase activity expressed as first‐order rate constant (k CA), PEPC affinity for HCO− 3 (K m), maximum photosynthetic capacity (A max) and leaf N content (Narea).
Gas exchange measurements and estimation of g m
The measurements of net photosynthetic rates (A net, μmol CO2 m−2 s−1), stomatal conductance to water vapour (g sw, mol water m−2 s−1), intercellular CO2 concentrations (C i, Pa) and mesophyll conductance to CO2 (g m, μmol m−2 s−1 Pa−1) were performed at four different CO2 levels inside the chamber or C a (34, 27, 20 and 14 Pa) using an LI‐6400XT infrared gas analyser (Li‐Cor, Lincoln, NE, USA). Intrinsic water‐use efficiency (TEi, μmol CO2 mol−1 water) was calculated as A net/g sw for each CO2 level. Maximum photosynthetic rates (A max, μmol CO2 m−2 s−1) were measured at saturating light of c. 1200 μmol photons m−2 s−1 and pCO2 of c. 1500 μmol mol−1.
Several methods have been used to estimate C4–g m. Pfeffer & Peisker (1998) calculated the g m from the initial slope of a photosynthetic CO2 response curve and assumed no CO2 dependence of g m. However, C4–g m is sensitive to pCO2 (Kolbe & Cousins, 2018; Ubierna et al., 2018) and therefore the initial slope method may be problematic. Using anatomical traits such as Smes for estimating C4–g m could also be subject to errors due to assumptions made for values of T CW, porosity and membrane permeability (Pengelly et al., 2010). The ∆13C in vitro V pmax method (Ubierna et al., 2017) estimates C4–g m by retrofitting models of C4 photosynthesis model (von Caemmerer, 2000) and the ∆13C (Farquhar & Cernusak, 2012) with gas exchange, kinetic constants and in vitro PEPC activities. The ∆13C in vitro V pmax method may also result in inaccurate estimates of C4–g m due to errors associated with the estimation of in vitro PEPC and CA activities and enzyme kinetic parameters. The ∆18O method (Gillon & Yakir, 2000; Barbour et al., 2016; Barbour & Kaiser, 2016) utilises simultaneous measurements of the oxygen isotope composition (δ18O) of transpired H2O and oxygen isotope discrimination (Δ18O) in CO2 to calculate the CO2 concentration at the site of isotope exchange by CA. The Δ18O method assumes full isotopic equilibrium between CO2 and H2O at the site of CA (θ = 1), which may not always be true and therefore g m could be underestimated. In the current study we used the method described by Ogee et al. (2018) that builds upon the Δ18O method (Barbour et al., 2016; Ogee et al., 2018). This method utilises a newly developed model of C4 photosynthetic discrimination that provides an estimate of the isotopic equilibrium between CO2 and H2O inside the leaf and g m and accounts for the physical separation between mesophyll and bundle sheath cells in C4 leaves and the contribution of respiratory fluxes (Ogee et al., 2018). For estimating g m, isotopologs of CO2 and H2O were measured using a LI‐6400XT infrared gas analyser (Li‐Cor) coupled to a tunable diode laser absorption spectroscope (TDLAS, model TGA 200A; Campbell Scientific, Logan, UT, USA) and a cavity‐ring down absorption spectroscope (Picarro, Sunnyvale, CA, USA), as described previously (Ubierna et al., 2017; Kolbe & Cousins, 2018; Pathare et al., 2020a). The entire LI6400XT, the 2 cm × 6 cm leaf chamber (6400‐11; Li‐Cor) and LI‐6400‐18‐RGB light source were placed in a growth cabinet (model EF7, Conviron; Controlled Environments Inc., North Branch, MN, USA) with fluorescence lamps (F48T12/CW/VHO; Sylvania, Wilmington, MA, USA) set at a PPFD of c. 250 μmol photons m−2 s−1 and air temperature was maintained at 25°C. For each species, four‐point CO2 response curve of g m, g sw, A net and TEi was performed. During measurements CO2 sample (CO2S) was set to c. 34, 27, 20 and 14 Pa. At each CO2 level, the leaves were allowed to adjust for at least 30 min or until stable values of A net and g sw were achieved. Data for isotopologs of CO2 and H2O and physiological parameters (A net, g sw, C i, TEi) were collected and averaged over the next 20–30 min for each CO2 level (c. 10–15 cycles of TDLAS) with the Li6400XT set to log data only when the TDLAS analysed the sample line. At each CO2 level, three biological replicates were measured for the species eari and five biological replicates were measured for species' pvir and eser. For the remaining 13 species, measurements were conducted on four biological replicates. After the completion of above measurements, lights were tuned off and the leaves were allowed to stabilise for 15 min before logging the rates of dark respiration (R n, μmol CO2 m−2 s−1). Mesophyll conductance was estimated for each species at each of the four pCO2 levels using the Ogee et al. (2018) method. Key input parameters used in calculation of isotope parameters and estimation of g m are given in Supporting Information Table S1. Further details of equations and calculations of fractionation factors can be found in Ogee et al. (2018); Ubierna et al. (2017). While estimating g m, we assumed that ϕr or the fraction of respired CO2 not produced in the bundle sheath cells of C4 plants = 0.5 (von Caemmerer, 2000) and analysed the impacts of changing ϕr values (0–1) on the calculation of g m (Fig. S1). We also performed a sensitivity analysis of g m to changes in leaf temperature (ranging from 23 to 28°C) (Fig. S2). For C4 plants, photorespiration was assumed to be negligible and therefore not accounted for while estimating g m. While estimating g m at different pCO2 (34, 27, 20 and 14 Pa), it was assumed that the pH of the mesophyll cytosol was constant due to the small micromolar shifts in dissolved CO2 at different pCO2 (DiMario et al., 2018). We assumed that the day respiration (Vr, μmol CO2 m−2 s−1) was equal to the dark respiration (R n) for the C4 species.
Measurement of anatomical traits and habitat mean annual precipitation
Light and electron microscopy techniques were used to measure important structural and anatomical traits such as adaxial stomatal density (SDada, number mm−2), abaxial stomatal density (SDaba, number mm−2), SR (unitless) expressed as ratio of SDada : SDaba, leaf thickness (μm), mesophyll surface area exposed to intercellular air spaces (Smes, μm2 μm−2) and T CW (μm). The details of sample preparation for microscopy and measurements are presented in Pathare et al. (2020a) and in the Methods S1. Values for mean annual precipitation (MAP) for habitats where the C4 grasses commonly occur were obtained as indicated in Pathare et al. (2020b).
Enzyme assays and measurement of leaf nitrogen content
Immediately following gas exchange measurements, leaf samples were taken from the same leaf and frozen in liquid nitrogen for enzyme assays. Measurements of CA, phosphoenolpyruvate carboxylase (PEPC, μmol m−2 s−1) and ribulose‐1,5‐bisphosphate carboxylase/oxygenase (Rubisco, μmol m−2 s−1) activities were performed at 25°C, as described previously (Sharwood et al., 2016; Sonawane & Cousins, 2019; Pathare et al., 2020a). Carbonic anhydrase activities were expressed as the first‐order rate constant (k CA, μmol m−2 s−1 Pa−1). In addition to enzyme activities, PEPC affinity for HCO− 3 (K m, μM HCO3 −1) values were derived using a membrane‐inlet mass spectrometer. K m values have been published in DiMario et al. (2021). For measuring leaf nitrogen content, leaf samples were taken from the same leaf on which gas exchange measurements were performed. Samples were dried in a hot air oven at 60°C for 72 h. Leaf nitrogen content was measured using a Eurovector elemental analyser and expressed on a leaf area basis (Narea, g m−2).
Estimating CO2 responses of physiological traits (g m, g sw, A net and TEi )
Changes in g m in response to decrease in pCO2 (from 34 to 14 Pa) were analysed using two different methods. First, the percentage change in g m in response to a decrease in pCO2 (from 34 to 14 Pa) was calculated for each biological replicate for the 16 species as follows:
Similar to g m, we also calculated percentage change in A net, g sw, C i and TEi in response to the decrease in pCO2 (from 34 to 14 Pa). pCO2 levels of 34 and 14 Pa were chosen, as these two pCO2 levels were the highest and lowest levels, respectively, used in current study. Relationships of percentage change in physiological traits with key leaf anatomical and biochemical traits are given in the Figs S3–S8.
In a second method, we used an equation (y = a × (34/CO2) b ) to model the changes in g m in response to changes in CO2 (here C a). In the equation, y indicates the g m, coefficient a (μmol m−2 s−1 Pa−1) is the value of g m at 34 Pa pCO2, CO2 indicates the pCO2 inside the leaf chamber (C a) and coefficient b (unitless) indicates the sensitivity of g m to changes in C a. For further analysis (Figs 2, 3, 4 please refer to later paragraphs), we considered coefficient b as a proxy for the CO2 response of g m, with a relatively greater value of b indicating a greater increase in g m with a decrease in C a. Mean ± SE values for model coefficients a and b for the 16 C4 grasses are given in Table S3 (please refer to later paragraphs). Average values for three biochemical subtypes (NAD‐ME, NADP‐ME and PCK) are also included in Table S3. Fig. 1 shows the relationship of g m and C a for 16 C4 grasses along with the model line, whereas Fig. S9 shows relationship of g m and C a along with the model line for the three C4 subtypes.
Fig. 2.

Relationship of coefficient b (or sensitivity of g m, unitless) with (a) mesophyll cell wall thickness (T CW), (b) mesophyll surface area exposed to intercellular air spaces (Smes), (c) ratio of T CW : Smes, (d) stomatal ratio (SR), (e) stomatal density adaxial (SDada) and (f) leaf thickness among the 16 C4 grasses measured in current study. Linear models were used for deriving regression coefficients (R 2) in all panels, except panels (a) and (c) for which we used a polynomial model. Significance of R 2: *, P ≤ 0.05; **, P ≤ 0.01; ***, P ≤ 0.001. Each circle represents the mean ± SE value for each species (n = 3–6). Species names are indicated by the codes given in Table 1.
Fig. 3.
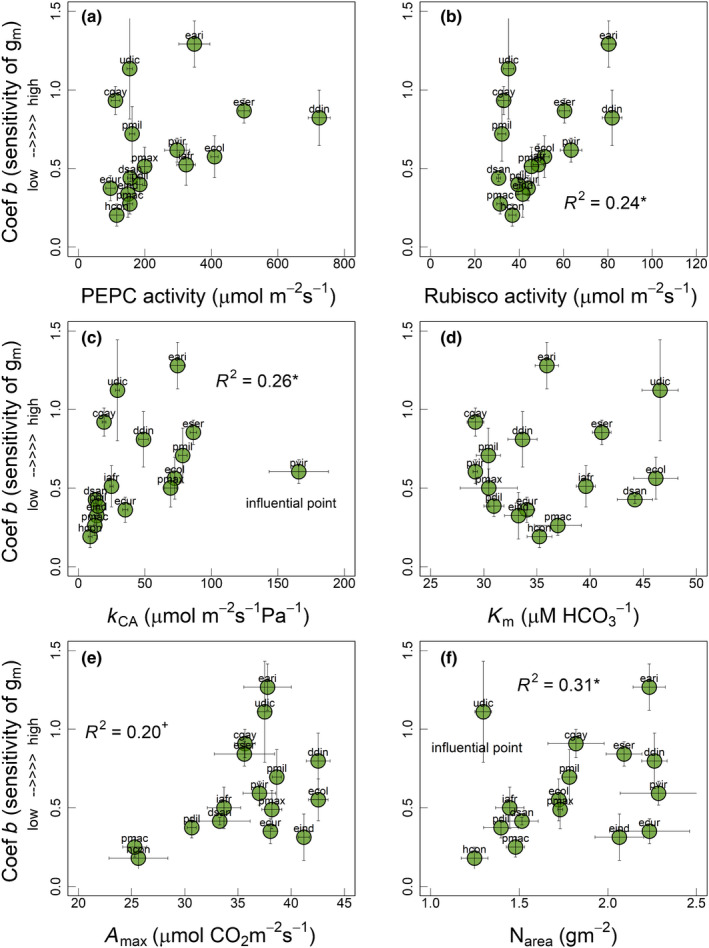
Relationship of coefficient b (or sensitivity of g m, unitless) with (a) phosphoenolpyruvate carboxylase (PEPC) activity, (b) Rubisco activity, (c) carbonic anhydrase (CA) activity expressed as k CA, (d) PEPC affinity for HCO3 − (K m), (e) maximum photosynthetic capacity (A max) and (f) leaf N content (Narea) among the 16 C4 grasses measured in current study. Linear models were used for deriving regression coefficients (R 2) in all panels. In panel (c) R 2 = 0.22+ after removing influential species pvir. Significance of R 2: +, marginally significant; *, P ≤ 0.05. Each circle represents the mean ± SE value for each species (n = 3–6). Species names are indicated by codes given in Table 1.
Fig. 4.

Relationship of coefficient b (or sensitivity of g m, unitless) with ratio of mesophyll cell wall thickness (T CW) to (a) phosphoenolpyruvate carboxylase (PEPC) activity (b) Rubisco activity (c) PEPC affinity for HCO3 − (K m), (d) carbonic anhydrase (CA) activity expressed as k CA, (e) maximum photosynthetic rates (A max) and (f) leaf N content (Narea) among the 16 C4 grasses measured in current study. Polynomial models were used to derive regression coefficients (R 2) in all panels. Significance of R 2: *, P ≤ 0.05; **, P ≤ 0.01; ***, P ≤ 0.001. Each circle represents the mean ± SE value for each species (n = 3–6). Species names are indicated by codes given in Table 1.
Fig. 1.

Response of mesophyll conductance (g m) to changes in the partial pressure of CO2 (pCO2) inside the leaf chamber (C a) in 16 diverse C4 grasses. Data for each of the species are shown separately from panels (a) to (p) along with the CO2 response of g m (black solid line) modelled using the equation, g m = a × (34/C a) b , where coefficient ‘a’ is the value of g m at 34 Pa pCO2 and coefficient ‘b’ is the rate of change in g m with change in C a. Mean ± SE values for the model constants (a and b) for each species are shown in Supporting Information Table S3. Measurements were performed at constant light (photosynthetic photon flux density (PPFD) = 1200 μmol m−2 s−1) and leaf temperature (25°C). Values in each panel represent the mean ± SE (green colour) with n = 3–6. Grey points indicate the replicate values for each species and CO2 level. Response of g m to changes in pCO2 for each species is plotted in separate panel of Fig. 1. Species code has been indicated as the first letter of the genus and first three letters of the species (please refer to Table 1 for full names of species). P‐values from one‐way ANOVA along with Tukey's letters are shown.
Statistical analyses
All statistical analyses were performed using R software (v.4.1.0, R Foundation for Statistical Computing, Vienna, Austria). Normality and equal variances were tested and, when necessary, square root or log transformations were used to improve the data homoscedasticity (Zar, 2007). One‐way ANOVA with post‐hoc Tukey's test was used to examine differences in leaf‐level anatomical and biochemical traits among the 16 diverse C4 grasses. Results for post‐hoc Tukey's test are given in Table 1. Results of one‐way ANOVA for traits used in the current study are given in Table S2. For key physiological traits such as g m, ∆18O, A net, g sw, C i and TEi, two‐way ANOVA was performed with species and pCO2 as the main effects using the aov function in R (R Core Team, 2018). Results of two‐way ANOVA are given in Table 2 and mean values are presented in Figs S1–S6. For the ANOVAs, P‐values ≤ 0.05 were considered as statistically significant. We grouped the species into biochemical subtypes and analysed whether CO2 responses of g m varied among the subtypes (Table S3; Fig. S9).
Table 2.
Summary of two‐way ANOVA P‐values and F‐values along with numerator degree of freedom (df) for the physiological traits measured on 16 diverse C4 grasses at four different pCO2.
| Traits | Species (df = 15) | CO2 (df = 3) | Species × CO2 (df = 45) | |||
|---|---|---|---|---|---|---|
| P‐value | F‐value | P‐value | F‐value | P‐value | F‐value | |
| g m | < 0.001 | 39.18 | < 0.001 | 64.85 | < 0.001 | 2.54 |
| ∆18O | < 0.001 | 5.34 | < 0.001 | 74.92 | 0.04 | 1.46 |
| g sw | < 0.001 | 37.64 | < 0.001 | 228.39 | 0.32 | 1.10 |
| A net | < 0.001 | 63.20 | < 0.001 | 201.63 | 0.96 | 0.64 |
| C i | < 0.001 | 12.44 | < 0.001 | 370.49 | 0.12 | 1.29 |
| TEi | < 0.001 | 22.29 | < 0.001 | 2764.65 | 0.16 | 1.24 |
Mean values for these physiological traits list below are presented in Supporting Information Figs S1–S5. Statistically significant P‐values (≤ 0.05) are highlighted in bold. Mesophyll conductance to CO2 (g m; estimated using the Ogee et al., 2018 method), leaf net C18O16O discrimination (∆18O) to changes in CO2 inside leaf, stomatal conductance to water (g sw), net CO2 assimilation rates (A net), leaf intercellular [CO2] (C i) and leaf‐level water‐use efficiency (TEi = A net/g sw).
Regression analyses were performed to examine the relationship of coefficient b with the key anatomical and biochemical traits such as T CW, Smes, ratio of T CW : Smes, SR, SDada, leaf thickness, PEPC activity, Rubisco activity, k CA, K m, A max and Narea. To account for the combined effect of anatomy and biochemistry on the CO2 responses of g m, we derived ratios of T CW to biochemical traits (activities of PEPC, Rubisco and CA, K m, A max and Narea). We examined the relationship between coefficient b and the ratio of T CW to biochemical traits. Similarly, we also examined the relationships between percentage change in g m and key anatomical and biochemical traits and the ratio of T CW to the biochemical traits mentioned above. Both, coefficient b and percentage change in g m showed similar relationships with anatomical and biochemical traits. In the main text we used coefficient b as a proxy for CO2 response of g m (Figs 2, 3, 4). The relationship of percentage change in physiological traits with key leaf anatomical and biochemical traits are given in Figs S3–S8. For the regression analysis, P‐values ≤ 0.05 were considered as statistically significant. The function outlierTest from the R package car (Fox & Weisberg, 2019) was used to identify any potential influential points in the relationships. Influential data points (with Bonferroni P‐value ≤ 0.05) were removed while deriving regression statistics if required (Figs 3c,f, S3, S5, S7). To complement the regression analysis, we also performed a principal component analysis (PCA; Methods S2; Fig. S8; Table S4) with leaf traits, percentage changes in g m, A net, g sw and TEi and habitat MAP (R package factominer; Le et al., 2008).
Results
CO2 response of physiological traits
The 16 C4 grasses (Table 1) with previously demonstrated variation in leaf‐level anatomical traits and g m (Pathare et al., 2020a,b) were chosen to explore the potential variation in the CO2 response of g m and its relationship with leaf traits and TEi. Responses of g m to changes in C a and C i are given in Figs 1 and S10, respectively. Responses of other physiological traits (∆18O, g sw, A net, C i and TEi) to changes in C a are given in Figs S11–S15. Species differed significantly in the CO2 response of g m (Figs 1, S10) and g sw (Fig. S12). In general, across the 16 C4 grasses, g m increased as C a and C i decreased with percentage increase at lowest C a, ranging from +13% to +250%. The increase in g m was statistically significant in 12 out of 16 species. As with g m, g sw increased with decreasing C a (Fig. S12). However, unlike g m, the magnitude of increase in g sw was lower. Specifically, the percentage increase in g sw ranged from c. 40–80% when C a decreased from 34 to 14 Pa. Alternatively, both A net and TEi decreased with decreases in C a (Figs S13, S15). Particularly, A net decreased by c. 23–40% and TEi decreased by c. 53–64%.
Variation in leaf anatomical and biochemical traits
The results of one‐way ANOVA suggested that the 16 C4 grasses varied significantly (P < 0.001; Table 1) in all the leaf‐level anatomical and biochemical traits. T CW showed a significant 2.6‐fold variation with values ranging from c. 0.08 to 0.21 μm. Smes showed a 2.4‐fold variation with values ranging from c. 8.5 to 19 μm2 μm−2. The C4 grasses measured here also showed a highly significant variation in stomatal traits such as SR and SDada (P < 0.001; Tables 1, S2). SR varied by 4.7‐fold, with values ranging from 0.5 to 2.4, whereas SDada showed a 13‐fold variation with values ranging from 12 to 160 number mm−2. Leaf thickness showed a significant two‐fold variation with values ranging from 120 to 240 μm (P < 0.001; Tables 1, S2). Similar to the variation in anatomical traits mentioned above, the biochemical traits (that is leaf‐level activities of PEPC, Rubisco and k CA) also varied significantly among the 16 C4 grasses included in the current study (P < 0.001; Tables 1, S2). PEPC activities showed a 7.5‐fold variation with values from 96 to 721 μmol m−2 s−1. Rubisco activities showed a 2.6‐fold variation with values from 30 to 80 μmol m−2 s−1. k CA showed an 18‐fold variation with values from 9 to 165 μmol m−2 s−1 Pa−1. PEPC affinity for HCO3 − (K m) showed a 1.6‐fold variation across the 16 C4 grasses with values ranging from c. 29 to 46 μM HCO3 − (P < 0.001; Tables 1, S2). There was a 1.7‐fold variation in maximum photosynthetic rates (A max) with values ranging from c. 25 to 42.5 μmol CO2 m−2 s−1 (P < 0.001; Table 1). Narea also varied significantly among the grasses (P < 0.001; Table 1) with values ranging from 1.24 to 2.26 g m−2.
Relationships of CO2 response of g m with anatomical and biochemical traits
We used two proxies to account for the changes in g m in response to change in C a. First, percentage change in g m in response to decrease in C a (from 34 to 14 Pa) (Figs S3–S8) and second, the coefficient b derived from an equation used to model the changes in g m in response to changes in C a. In the main text, we used coefficient b as a proxy for CO2 response of g m, (Figs 2, 3, 4). Coefficient b showed a strong negative relationship with T CW (R 2 = −0.74, P < 0.001; Fig. 2a) and ratio of T CW : Smes (R 2 = −0.64, P < 0.001; Fig. 2c) and a nonsignificant positive relationship with Smes (R 2 = 0.14, P = 0.11; Fig. 2b). In addition, coefficient b showed a significant positive relationship with SR (R 2 = 0.34, P < 0.05; Fig. 2d), SDada (R 2 = 0.32, P < 0.01; Fig. 2e) and leaf thickness (R 2 = 0.38, P < 0.01; Fig. 2f). Coefficient b also showed a nonsignificant positive relationship with biochemical traits such as PEPC activity (R 2 = 0.19, P = 0.12; Fig. 3a) and A max (R 2 = 0.20, P = 0.08; Fig. 3e) and a significant positive relationship with Rubisco activity (R 2 = 0.24, P < 0.05; Fig. 3b). However, coefficient b did not show a statistically significant relationship with K m (Fig. 3c,d). Coefficient b showed significant positive relationships with k CA (R 2 = 0.26, P < 0.05; Fig. 3c) and Narea (R 2 = 0.31, P < 0.05; Fig. 3f) after removing the influential species (pvir and udic, respectively).
To account for the combined effects of leaf anatomy (specifically T CW that acts as a resistance in series to CO2 diffusion) and biochemistry (that can have a facilitating effect) on CO2 response of C4–g m, we derived the ratio of T CW with PEPC activity, Rubisco activity, k CA, K m, A max and Narea and investigated the relationship between coefficient b and these ratios (Fig. 4). Coefficient b showed a significant negative relationship with T CW/PEPC (R 2 = −0.44, P < 0.01; Fig. 4a), T CW/Rubisco (R 2 = −0.57, P < 0.01; Fig. 4b), T CW/K m (R 2 = −0.47, P < 0.01; Fig. 4c), T CW/k CA (R 2 = −0.47, P < 0.05; Fig. 4d), T CW/A max (R 2 = −0.62, P < 0.001; Fig. 4e) and T CW/Narea (R 2 = −0.75, P < 0.001; Fig. 4f). In summary, C4 grasses with thinner cell walls combined with greater Smes, Narea, A max and activities of key enzymes were able to achieve greater increases in g m at lower C a. Similar results were observed when we plotted percentage change in g m against key anatomical and biochemical traits mentioned above (Figs S3–S8).
Relationship of CO2 response of g m with CO2 response of TEi , g sw and A net
We investigated the impacts of changes in g m with C a on corresponding changes in TEi, g sw and A net (Fig. S7). For this we used percentage change in the trait's value when C a decreased from 34 to 14 Pa. As g m and g sw increase with decreases in C a, percentage change for both conductances is reported in the manuscript as percentage increase. Alternatively, A net and TEi decrease with decreases in CO2S, therefore the percentage change for these two traits have been reported in the manuscript as percentage decrease. Percentage change in TEi showed a strong negative correlation with percentage change in g m (R 2 = −0.54, P < 0.001; Fig. S7a). Particularly, C4 grasses that were able to achieve a greater increase in g m at lower C a showed a lesser decrease in TEi (indicated by a less negative value for TEi in Fig. S11a). In addition, percentage change in g sw showed a negative relationship with percentage change in g m (R 2 = −0.28, P < 0.05; Fig. S7b), that is species that showed a greater increase in g m at lower C a also showed a lesser increase in g sw. A significant relationship was not observed between percentage change in g m and A net (Fig. S7c).
CO2 response of g m in the C4 biochemical subtypes
We also analysed the CO2 responses of g m among the subtypes (Table S3; Fig. S9). NADP‐ME (coefficient b = 0.618) and PCK (coefficient b = 0.0.73) subtypes showed 20% and 43% greater sensitivity of g m to C a respectively compared with NAD‐ME (coefficient b = 0.512). However, there were no statistically significant differences in coefficient b among the subtypes (Fig. S9e), which could be due to the low replication. With only seven NADP‐ME, five PCK and four NAD‐ME replicate species our study does not provide the statistical power to discuss subtype effects. Therefore, here we focus on species‐level differences.
Discussion
In general C3–g m increases under short‐term decreases in pCO2 (Flexas et al., 2007; Bunce, 2010; Douthe et al., 2011), although not always (von Caemmerer & Evans, 1991; Loreto et al., 1992; Tazoe et al., 2009). The main candidates suggested to affect the CO2 response of C3–g m include chloroplast movement and therefore changes in S c, changes in activities of CA (Evans et al., 2009; Momayyezi & Guy, 2017) and the facilitation effect of CO2‐permeable aquaporins (Uehlein et al., 2008; Flexas et al., 2012; Kaldenhoff, 2012). However, the C3–g m response to pCO2 may also result from systematic errors associated with the use of methods such as gas exchange, chlorophyll fluorescence and discrimination against 13C or the use of oversimplified models (Pons et al., 2009; Yin & Struik, 2009; Tholen & Zhu, 2011; Gu & Sun, 2014). For instance, the apparent response of C3–g m to short‐term changes in pCO2 has partly been attributed to changes in photorespiratory and nonphotorespiratory release of CO2 (or day respiration) to the total CO2 pool in the leaf, particularly under low pCO2. Ignoring these CO2 pools while estimating C3–g m also overlooks the effects of spatial distribution of mitochondria and chloroplast on pathlength of CO2 movement. Inaccurate measurements of day respiration or estimates of the Rubisco fractionation factor in the ∆13C method and measurements conducted at low [O2] have also been suggested as potential sources of artefacts in determining the C3–g m response to pCO2 (Pons et al., 2009; Gu & Sun, 2014).
Alternatively, in C4 species, the photorespiratory release of CO2 is relatively low and may not contribute significantly to estimates of g m, even at low pCO2 (Cousins et al., 2020). Also, in current study we estimated g m in diverse C4 grasses by using a method based on modelling of ∆18O that considers the contribution of respiratory fluxes (Ogee et al., 2018). Despite some uncertainties associated with the day respiration or water isotope gradient between mesophyll and bundle sheath cells, the Ogee et al. (2018) method provides robust estimates of C4–g m. Also, comparing many diverse C4 species, as done in the current study, using a method that is not subject to the same limitations as those previously used for C3 species is a reasonable approach to identify the CO2 responses of C4–g m. Here, we discuss the CO2 response of g m for 16 diverse C4 grasses and its relationships with leaf anatomical and biochemical traits.
CO2 response of g m varied among diverse C4 grasses
Very few studies investigating the CO2 response of C4–g m, primarily maize and Setaria viridis (Osborn et al., 2017; Kolbe & Cousins, 2018; Ubierna et al., 2018), have reported an increase in C4–g m with a decrease in pCO2. Similarly, we demonstrated that g m increases with a decrease in pCO2 across the 16 diverse C4 grasses. However, the magnitude of the increase in g m varied greatly across the 16 C4 grasses (+13% to +250%; Fig. 1). In the following sections we discuss the potential factors that could explain this variability in the CO2 response of C4–g m.
CO2 response of C4 –g m is related with T CW, Smes and photosynthetic capacity
g m in C3 and C4 species is constrained by several anatomical and biochemical parameters such as T CW, Smes, Sc, CA activities and aquaporins (Cousins et al., 2020; Evans, 2021). However, the potential implication of leaf anatomy and biochemistry for the CO2 response of g m has not been studied for C4 species. Most of the anatomical parameters remain unchanged under short‐term changes in environmental conditions such as pCO2 (Evans et al., 2009; Terashima et al., 2011). Therefore, the only anatomical trait suggested to influence the CO2 response of g m is chloroplast movement that can affect g m by changing Sc (Terashima et al., 2006; Tholen et al., 2008; Carriqui et al., 2018). However, chloroplast movement is unlikely to explain the variability of the CO2 response of C4–g m observed in the current study, because Smes and not Sc is a more accurate determinant of C4–g m, in which a greater Smes results in greater g m in C4 species (Barbour et al., 2016; Pathare et al., 2020a). In contrast with Sc, Smes should remain unchanged under short‐term changes in pCO2. Therefore, although we observed a nonsignificant positive relationship between the CO2 response of C4–g m and Smes (Fig. 2b), Smes may provide only a partial explanation for this variable response.
T CW could account for > 50% of the total resistance to CO2 diffusion inside leaves (Evans et al., 2009). Therefore, we further investigated the influence of T CW on the variability of the CO2 response of C4–g m. In general, C3 species with relatively lower T CW showed greater g m (Onoda et al., 2017; Veromann‐Jürgenson et al., 2017; Evans, 2021). We did not observe a strong relationship between g m and T CW for the C4 grasses under ambient CO2 levels (34 Pa) (Pathare et al., 2020a). However, in the current study, the CO2 response of C4–g m was related to T CW (Fig. 2a). The CO2 response of C4–g m also showed a strong relationship with T CW after accounting for Smes (as T CW/Smes; Fig. 2c). Particularly, C4 grasses with relatively lower T CW and greater Smes, showed a greater increase in g m at low pCO2. It is unclear why the g m of C4 grasses with lower T CW is more responsive to changes in pCO2. As for Smes, T CW is unlikely to change under short‐term changes in pCO2 and may not be the sole reason for the observed variable CO2 response of C4–g m. However, T CW may still provide a partial explanation for variability in the CO2 response of C4–g m. Resistances to CO2 diffusion through the liquid phase (comprised of apoplastic and cellular components from mesophyll cell wall to site of carboxylation) are greater compared with the gaseous phase (Evans et al., 2009; Flexas et al., 2021). CO2 must dissolve in the water‐filled pores of the mesophyll cell walls and then diffuse to the plasma membrane and eventually to the site of CO2 fixation. Because cell walls represent a significant proportion of liquid phase resistance, C4 species with a lower T CW may have the potential to achieve a greater change in g m in response to changing pCO2. However, the influence of lower T CW on the CO2 response of C4–g m may have also been augmented by greater Smes, the facilitation effect of CO2 transporting aquaporins and leaf N content and proteins of photosynthetic machinery that determine drawdown and fixation of CO2 and therefore photosynthetic capacity (Parkhurst, 1994; Wright et al., 2004; Evans et al., 2009; Xiong & Flexas, 2021).
The role of CO2‐permeable aquaporins in enhancing g m has been well characterised in C3 species (Uehlein et al., 2008). Only recently, it has been demonstrated that overexpressing a CO2‐permeable aquaporin in plasma membranes of Setaria viridis (C4 grass) can enhance C4–g m (Ermakova et al., 2021). We did not investigate the role of aquaporins in affecting the CO2 response of C4–g m. However, we observed a greater CO2 response of g m in C4 grasses with relatively lower T CW. This indicates that g m in plants with lower T CW may be more influenced by aquaporins (Evans, 2021). There is still a need to further investigate the role of aquaporins in the variable CO2 response of C4–g m.
Here, we investigated the relationship between the CO2 response of C4–g m and photosynthetic capacity as indicated by A max, Narea and activities of key C4 photosynthetic enzymes (PEPC, CA and Rubisco). C4 species with a greater CO2 response of C4–g m tended to show greater activities of PEPC and Rubisco and greater A max and Narea. Also, the CO2 response of C4–g m was strongly related to the ratio of T CW/photosynthetic capacity traits (Fig. 4), in which a greater CO2 response of C4–g m was evident in species with lower T CW and greater photosynthetic capacity. This suggests that lower T CW may have decreased the resistance to the movement of CO2 into the mesophyll cells (Evans, 2021; Flexas et al., 2021), whereas the greater photosynthetic capacity may have increased the demand for CO2, resulting in greater drawdown of CO2 and the necessity of maintaining a greater CO2 supply through an increase in g m at low pCO2 (Wright et al., 2004; Evans et al., 2009). Furthermore, the enzyme CA catalyses the conversion of CO2/HCO3 − in the cytosol and ensures sufficient HCO3 − substrate supply to PEPC (Studer et al., 2014; DiMario et al., 2018). Because CO2 diffuses much faster in liquid phase in HCO3 − form, greater CA activities in combination with lower T CW could have maintained a rapid supply of HCO3 − substrate to PEPC and further enhanced g m at low pCO2 in some C4 grasses (Fig. 4d).
We also investigated the relationship between the CO2 response of C4–g m and K m, a kinetic constant indicating PEPC affinity for HCO3 − (DiMario et al., 2021). In general, lower K m values (or high affinity of PEPC for HCO3 −) are expected to provide a selective advantage by maintaining high rates of C4 photosynthesis, particularly under conditions such as drought when CO2 availability is low due to restricted stomatal conductance. Here, we observed that K m alone did not show a strong relationship with CO2 response of C4–g m (Fig. 3d). However, after accounting for T CW, we observed that T CW/K m showed a significant negative relationship with the CO2 response of C4–g m (Fig. 4c), in which species with relatively lower T CW and higher K m (or lower affinity of PEPC for HCO3 −) exhibited a greater CO2 response of g m. This contrasts with the general expectation and could be explained by the lower T CW leading to higher g m and with the corresponding greater CA activities leading to higher HCO3 − in mesophyll cells under low C i conditions. The higher HCO3 − concentration in the mesophyll cells of species with lower T CW and greater CA can reduce the selective pressure on PEPC for lower K m values.
Relationship of CO2 response of g m with CO2 response of g sw and TEi
Previously, we demonstrated that C4–g m is positively related to TEi under ambient pCO2 (Pathare et al., 2020a). Our current study further suggests that, for C4 grasses, g m may also influence TEi under short‐term changes in pCO2. In general, both g m and gsw increased (Figs 1, S12) and TEi decreased at low pCO2 (Fig. S15). However, the magnitude of increase in g m at low pCO2 was greater (values from 13% to 250%) compared with the increase in g sw (values from 40% to 80%). Also, C4 grasses showing greatest increase in g m at low pCO2 also showed the lowest increase in g sw (Fig. S7b). Consequently, although TEi decreased at low pCO2, the decrease was less in the species showing the greater CO2 response of g m (Fig. S7a). These types of species with greater CO2 response of g m may benefit in terms of maintaining TEi under low CO2 conditions, such as drought, compared with species whose g m was less responsive to changes in pCO2. Also, the PCA (Fig. S8) suggests that a greater CO2 response of g m is generally observed in C4 grasses adapted to habitats with relatively low MAP.
Conclusions
We demonstrated that C4–g m increases with decreases in pCO2 and the magnitude of this increase in g m varies greatly among the 16 diverse C4 grasses. Also, CO2 responses of C4–g m is a composite trait that seems to be influenced by many leaf anatomical and biochemical parameters. The greatest increase in g m at low pCO2 was observed in C4 grasses with lower T CW along with greater Smes and photosynthetic capacities. These C4 grasses with a greater CO2 response of g m were also able to maintain their TEi under low pCO2, which may be advantageous under low CO2 conditions such as drought. Our study advances the understanding of the CO2 response of g m in diverse C4 species and identifies the key leaf anatomical and biochemical traits related to this response. This understanding is essential for improving C4 photosynthetic models (von Caemmerer, 2021) that ultimately feed the larger Earth system models (Rogers et al., 2017; Knauer et al., 2019a,b) and in attempts to improve water‐use efficiency of C4 crops through modification of g m (von Caemmerer & Furbank, 2016).
Competing interests
None declared.
Author contributions
VSP and ABC designed the experiment. VSP, RJD and NK performed the measurements and analysed the data. VSP interpreted the data and led the writing with constructive inputs from RJD, NK and ABC.
Supporting information
Fig. S1 Sensitivity of mesophyll conductance (g m; estimated by Ogee et al., 2018 method) to changes in fraction of CO2 not produced in bundle sheath cells (ϕr).
Fig. S2 Sensitivity of mesophyll conductance (g m; estimated by Ogee et al., 2018 method) to changes in leaf temperature (T leaf).
Fig. S3 Relationship of model coefficient a (indicating value of g m at 34 Pa pCO2) with coefficient b (sensitivity of g m to C a; relatively lower b values indicate lower rate of change in g m with C a) and relationship between coefficient b and percentage change in g m.
Fig. S4 Relationship of percent increase in g m with mesophyll cell wall thickness (T CW) mesophyll surface area exposed to intercellular air spaces (Smes) ratio of T CW : Smes, stomatal ratio (SR), stomatal density adaxial (SDada) and leaf thickness among the 16 C4 grasses measured in current study.
Fig. S5 Relationship of percent increase in g m with PEPC activity Rubisco activity CA activity expressed as k CA, PEPC affinity for HCO3 − (K m), maximum photosynthetic capacity (A max) and leaf N content (Narea) among the 16 C4 grasses measured in current study.
Fig. S6 Relationship of percent increase in g m with ratio of mesophyll cell wall thickness (T CW) to PEPC activity Rubisco activity PEPC affinity for HCO3 − (K m), CA activity expressed as k CA, maximum photosynthetic rates (A max) and leaf N content (Narea) among the 16 C4 grasses measured in current study.
Fig. S7 Relationship of percent increase in g m with percent decrease in leaf‐level water‐use efficiency (TEi) expressed as A net/g sw (higher negative value indicates greater decrease in TEi), percent increase in stomatal conductance to water (g sw) and percent decrease in net photosynthetic rates (A net) (higher negative value indicates greater decrease in A net) for the 16 C4 grasses measured in current study.
Fig. S8 PCA biplot showing major axes of variation in important leaf‐level anatomical and biochemical traits and percent change (increase or decrease) in response to CO2 in physiological traits such as g m, A net, g sw and TEi for the 16 diverse C4 grasses measured in current study.
Fig. S9 Response of mesophyll conductance (g m) to changes in pCO2 inside leaf chamber (C a) in three C4 biochemical subtypes (NAD‐ME, NADP‐ME, PCK).
Fig. S10 Response of mesophyll conductance to CO2 (g m) to changes in intercellular CO2 (C i) in 16 diverse C4 grasses measured in current study.
Fig. S11 Response of leaf net C18O16O discrimination (∆18O) to changes in pCO2 inside leaf chamber (C a) in 16 diverse C4 grasses measured in current study.
Fig. S12 Response of stomatal conductance to water (g sw) to changes in pCO2 inside leaf chamber (C a) 16 diverse C4 grasses measured in current study.
Fig. S13 Response of net CO2 assimilation rates (A net) to changes in pCO2 inside leaf chamber (C a) in 16 diverse C4 grasses measured in current study.
Fig. S14 Response of leaf intercellular CO2 concentration (C i) to changes in pCO2 inside leaf chamber (C a) in 16 diverse C4 grasses measured in current study.
Fig. S15 Response of leaf‐level water‐use efficiency (TEi = A net/g sw) to changes in pCO2 inside leaf chamber (C a) in 16 diverse C4 grasses measured in current study.
Methods S1 Measurement of anatomical traits.
Methods S2 Principal component analysis.
Table S1 Key input parameters used in calculation of isotope parameters and estimation of mesophyll conductance (g m) for the 16 C4 grasses at four pCO2 levels (34, 27, 20 and 14 Pa) and a temperature of 25°C.
Table S2 Results of one‐way ANOVA with species as main effects for all the leaf‐level anatomical and biochemical traits measured for 16 C4 grasses in current study.
Table S3 C4 grasses used in current study along with their biochemical subtype and mean ± SE values for the equation (g m = a × (34/C a) b ) constants derived for the CO2 response of g m in the 16 C4 grasses.
Table S4 Component loadings for important leaf‐level traits determined on 16 C4 grasses.
Please note: Wiley Blackwell are not responsible for the content or functionality of any Supporting Information supplied by the authors. Any queries (other than missing material) should be directed to the New Phytologist Central Office.
Acknowledgements
This work was supported by the Division of Chemical Sciences, Geosciences and Biosciences, Office of Basic Energy Sciences, Department of Energy (grant no. DE‐SC0001685), Office of Biological and Environmental Research in the DOE Office of Science (DE‐SC0018277) and the National Science Foundation (Major Research Instrumentation grant no. 0923562). We would like to thank the three anonymous reviewers whose valuable suggestions helped us improve our manuscript. We are grateful to Dr Nerea Ubierna, Joseph Crawford and Dr Balasaheb Sonawane for their valuable inputs on methods of estimation of mesophyll conductance in C4 species. We are also grateful to the Core Facility Center ‘Cell and Molecular Technologies in Plant Science’ of Komarov Botanical Institute (St Petersburg, Russia) and Franceschi Microscopy and Imaging Center at Washington State University (Pullman, USA) for the use of its facilities and staff assistance. We would also like to thank Charles A. Cody for help in plant growth management.
Data availability
Data available on request from the authors.
References
- Barbour MM, Evans JR, Simonin KA, von Caemmerer S. 2016. Online CO2 and H2O oxygen isotope fractionation allows estimation of mesophyll conductance in C4 plants, and reveals that mesophyll conductance decreases as leaves age in both C4 and C3 plants. New Phytologist 210: 875–889. [DOI] [PubMed] [Google Scholar]
- Barbour MM, Kaiser BN. 2016. The response of mesophyll conductance to nitrogen and water availability differs between wheat genotypes. Plant Science 251: 119–127. [DOI] [PubMed] [Google Scholar]
- Bunce JA. 2010. Variable responses of mesophyll conductance to substomatal carbon dioxide concentration in common bean and soybean. Photosynthetica 48: 507–512. [Google Scholar]
- von Caemmerer S. 2000. Biochemical models of leaf photosynthesis. Collingwood, Vic., Australia: CSIRO. [Google Scholar]
- von Caemmerer S. 2021. Updating the steady‐state model of C4 photosynthesis. Journal of Experimental Botany 72: 6003–6017. [DOI] [PMC free article] [PubMed] [Google Scholar]
- von Caemmerer S, Evans JR. 1991. Determination of the average partial pressure of CO2 in chloroplasts from leaves of several C3 plants. Functional Plant Biology 18: 287–305. [Google Scholar]
- von Caemmerer S, Evans JR. 2015. Temperature responses of mesophyll conductance differ greatly between species. Plant, Cell & Environment 38: 629–637. [DOI] [PubMed] [Google Scholar]
- von Caemmerer S, Furbank RT. 2016. Strategies for improving C4 photosynthesis. Current Opinion in Plant Biology 31: 125–134. [DOI] [PubMed] [Google Scholar]
- Cano FJ, Sharwood RE, Cousins AB, Ghannoum O. 2019. The role of leaf width and conductances to CO2 in determining water use efficiency in C4 grasses. New Phytologist 223: 1280–1295. [DOI] [PubMed] [Google Scholar]
- Carriqui M, Douthe C, Molins A, Flexas J. 2018. Leaf anatomy does not explain apparent short‐term responses of mesophyll conductance to light and CO2 in tobacco. Physiologia Plantaram 165: 604–618. [DOI] [PubMed] [Google Scholar]
- Cousins AB, Mullendore DL, Sonawane BV. 2020. Recent developments in mesophyll conductance in C3, C4, and crassulacean acid metabolism plants. The Plant Journal 101: 816–830. [DOI] [PubMed] [Google Scholar]
- DiMario RJ, Kophs AN, Pathare VS, Schnable JC, Cousins AB. 2021. Kinetic variation in grass phosphoenolpyruvate carboxylases provides opportunity to enhance C4 photosynthetic efficiency. The Plant Journal 105: 1677–1688. [DOI] [PubMed] [Google Scholar]
- DiMario RJ, Machingura MC, Waldrop GL, Moroney JV. 2018. The many types of carbonic anhydrases in photosynthetic organisms. Plant Science 268: 11–17. [DOI] [PubMed] [Google Scholar]
- Douthe C, Dreyer E, Epron D, Warren CR. 2011. Mesophyll conductance to CO2, assessed from online TDL‐AS records of 13CO2 discrimination, displays small but significant short‐term responses to CO2 and irradiance in Eucalyptus seedlings. Journal of Experimental Botany 62: 5335–5346. [DOI] [PMC free article] [PubMed] [Google Scholar]
- Ellsworth PV, Ellsworth PZ, Koteyeva NK, Cousins AB. 2018. Cell wall properties in Oryza sativa influence mesophyll CO2 conductance. New Phytologist 219: 66–76. [DOI] [PubMed] [Google Scholar]
- Ermakova M, Osborn H, Groszmann M, Bala S, McGaughey S, Byrt C, Alonso‐Cantabrana H, Tyerman S, Furbank RT, Sharwood RE et al. 2021. Expression of a CO2‐permeable aquaporin enhances mesophyll conductance in the C4 species Setaria viridis . bioRxiv. doi: 10.1101/2021.04.28.441895. [DOI] [PMC free article] [PubMed]
- Evans JR. 2021. Mesophyll conductance: walls, membranes and spatial complexity. New Phytologist 229: 1864–1876. [DOI] [PubMed] [Google Scholar]
- Evans JR, Kaldenhoff R, Genty B, Terashima I. 2009. Resistances along the CO2 diffusion pathway inside leaves. Journal of Experimental Botany 60: 2235–2248. [DOI] [PubMed] [Google Scholar]
- Evans JR, von Caemmerer S. 1996. carbon dioxide diffusion inside leaves. Plant Physiology 110: 339–346. [DOI] [PMC free article] [PubMed] [Google Scholar]
- Farquhar GD, Cernusak LA. 2012. Ternary effects on the gas exchange of isotopologues of carbon dioxide. Plant, Cell & Environment 35: 1221–1231. [DOI] [PubMed] [Google Scholar]
- Fox J, Weisberg S. 2019. An R companion to applied regression, 3rd edn . Thousand Oaks, CA, USA: Sage. [Google Scholar]
- Flexas J, Barbour MM, Brendel O, Cabrera HM, Carriquí M, Díaz‐Espejo A, Douthe C, Dreyer E, Ferrio JP, Gago J et al. 2012. Mesophyll diffusion conductance to CO2: an unappreciated central player in photosynthesis. Plant Science 193‐194: 70–84. [DOI] [PubMed] [Google Scholar]
- Flexas J, Carriquí M, Coopman RE, Gago J, Galmés J, Martorell S, Morales F, Diaz‐Espejo A. 2014. Stomatal and mesophyll conductances to CO2 in different plant groups: underrated factors for predicting leaf photosynthesis responses to climate change? Plant Science 226: 41–48. [DOI] [PubMed] [Google Scholar]
- Flexas J, Clemente‐Moreno MJ, Bota J, Brodribb TJ, Gago J, Mizokami Y, Nadal M, Perera‐Castro AV, Roig‐Oliver M, Sugiura D et al. 2021. Cell wall thickness and composition are involved in photosynthetic limitation. Journal of Experimental Botany 72: 3971–3986. [DOI] [PubMed] [Google Scholar]
- Flexas J, Diaz‐Espejo A, GalmÉS J, Kaldenhoff R, Medrano H, Ribas‐Carbo M. 2007. Rapid variations of mesophyll conductance in response to changes in CO2 concentration around leaves. Plant, Cell & Environment 30: 1284–1298. [DOI] [PubMed] [Google Scholar]
- Flexas J, Ribas‐CarbÓ M, Diaz‐Espejo A, GalmÉS J, Medrano H. 2008. Mesophyll conductance to CO2: current knowledge and future prospects. Plant, Cell & Environment 31: 602–621. [DOI] [PubMed] [Google Scholar]
- Gillon JS, Yakir D. 2000. Internal conductance to CO2 diffusion and C18OO discrimination in C3 leaves. Plant Physiology 123: 201–214. [DOI] [PMC free article] [PubMed] [Google Scholar]
- Grassi G, Magnani F. 2005. Stomatal, mesophyll conductance and biochemical limitations to photosynthesis as affected by drought and leaf ontogeny in ash and oak trees. Plant, Cell & Environment 28: 834–849. [Google Scholar]
- Groszmann M, Osborn HL, Evans JR. 2017. Carbon dioxide and water transport through plant aquaporins. Plant, Cell & Environment 40: 938–961. [DOI] [PubMed] [Google Scholar]
- Gu L, Sun Y. 2014. Artefactual responses of mesophyll conductance to CO2 and irradiance estimated with the variable J and online isotope discrimination methods. Plant, Cell & Environment 37: 1231–1249. [DOI] [PubMed] [Google Scholar]
- Hassiotou F, Ludwig M, Renton M, Veneklaas EJ, Evans JR. 2009. Influence of leaf dry mass per area, CO2, and irradiance on mesophyll conductance in sclerophylls. Journal of Experimental Botany 60: 2303–2314. [DOI] [PubMed] [Google Scholar]
- Huang X, Wang Z, Huang J, Peng S, Xiong D. 2021. Mesophyll conductance variability of rice aquaporin knockout lines at different growth stages and growing environments. The Plant Journal 107: 1503–1512. [DOI] [PubMed] [Google Scholar]
- Kaldenhoff R. 2012. Mechanisms underlying CO2 diffusion in leaves. Current Opinion in Plant Biology 15: 276–281. [DOI] [PubMed] [Google Scholar]
- Knauer J, Zaehle S, De Kauwe MG, Bahar NHA, Evans JR, Medlyn BE, Reichstein M, Werner C. 2019a. Effects of mesophyll conductance on vegetation responses to elevated CO2 concentrations in a land surface model. Global Change Biology 25: 1820–1838. [DOI] [PMC free article] [PubMed] [Google Scholar]
- Knauer J, Zaehle S, De Kauwe MG, Haverd V, Reichstein M, Sun Y. 2019b. Mesophyll conductance in land surface models: effects on photosynthesis and transpiration. The Plant Journal 101: 858–873. [DOI] [PubMed] [Google Scholar]
- Kolbe AR, Cousins AB. 2018. Mesophyll conductance in Zea mays responds transiently to CO2 availability: implications for transpiration efficiency in C4 crops. New Phytologist 217: 1463–1474. [DOI] [PubMed] [Google Scholar]
- Kromdijk J, Głowacka K, Long SP. 2019. Photosynthetic efficiency and mesophyll conductance are unaffected in Arabidopsis thaliana aquaporin knock‐out lines. Journal of Experimental Botany 71: 318–329. [DOI] [PubMed] [Google Scholar]
- Le S, Josse J, Husson F. 2008. factominer: an R package for multivariate analysis. Journal of Statistical Software 25: 1–18. [Google Scholar]
- Loreto F, Harley PC, Di Marco G, Sharkey TD. 1992. Estimation of mesophyll conductance to CO2 flux by three different methods. Plant Physiology 98: 1437–1443. [DOI] [PMC free article] [PubMed] [Google Scholar]
- Mizokami Y, Noguchi K, Kojima M, Sakakibara H, Terashima I. 2018. Effects of instantaneous and growth CO2 levels and abscisic acid on stomatal and mesophyll conductances. Plant, Cell & Environment 42: 1257–1269. [DOI] [PubMed] [Google Scholar]
- Momayyezi M, Guy RD. 2017. Substantial role for carbonic anhydrase in latitudinal variation in mesophyll conductance of Populus trichocarpa Torr. & Gray. Plant, Cell & Environment 40: 138–149. [DOI] [PubMed] [Google Scholar]
- Muir CD, Hangarter RP, Moyle LC, Davis PA. 2014. Morphological and anatomical determinants of mesophyll conductance in wild relatives of tomato (Solanum sect. Lycopersicon, sect. Lycopersicoides; Solanaceae). Plant, Cell & Environment 37: 1415–1426. [DOI] [PubMed] [Google Scholar]
- Ogee J, Wingate L, Genty B. 2018. Mesophyll conductance from measurements of C18OO photosynthetic discrimination and carbonic anhydrase activity. Plant Physiology 178: 728–752. [DOI] [PMC free article] [PubMed] [Google Scholar]
- Oguchi R, Hikosaka K, Hirose T. 2005. Leaf anatomy as a constraint for photosynthetic acclimation: differential responses in leaf anatomy to increasing growth irradiance among three deciduous trees. Plant, Cell & Environment 28: 916–927. [Google Scholar]
- Onoda Y, Wright IJ, Evans JR, Hikosaka K, Kitajima K, Niinemets Ü, Poorter H, Tosens T, Westoby M. 2017. Physiological and structural tradeoffs underlying the leaf economics spectrum. New Phytologist 214: 1447–1463. [DOI] [PubMed] [Google Scholar]
- Osborn HL, Alonso‐Cantabrana H, Sharwood RE, Covshoff S, Evans JR, Furbank RT, von Caemmerer S. 2017. Effects of reduced carbonic anhydrase activity on CO2 assimilation rates in Setaria viridis: a transgenic analysis. Journal of Experimental Botany 68: 299–310. [DOI] [PMC free article] [PubMed] [Google Scholar]
- Parkhurst DF. 1994. Diffusion of CO2 and other gases inside leaves. New Phytologist 126: 449–479. [DOI] [PubMed] [Google Scholar]
- Pathare VS, Koteyeva N, Cousins AB. 2020a. Increased adaxial stomatal density is associated with greater mesophyll surface area exposed to intercellular air spaces and mesophyll conductance in diverse C4 grasses. New Phytologist 225: 169–182. [DOI] [PubMed] [Google Scholar]
- Pathare VS, Sonawane BV, Koteyeva N, Cousins AB. 2020b. C4 grasses adapted to low precipitation habitats show traits related to greater mesophyll conductance and lower leaf hydraulic conductance. Plant, Cell & Environment 43: 1897–1910. [DOI] [PubMed] [Google Scholar]
- Peguero‐Pina JJ, Sancho‐Knapik D, Flexas J, Galmes J, Niinemets U, Gil‐Pelegrin E. 2016. Light acclimation of photosynthesis in two closely related firs (Abies pinsapo Boiss. and Abies alba Mill.): the role of leaf anatomy and mesophyll conductance to CO2 . Tree Physiology 36: 300–310. [DOI] [PMC free article] [PubMed] [Google Scholar]
- Pengelly JJ, Sirault XR, Tazoe Y, Evans JR, Furbank RT, von Caemmerer S. 2010. Growth of the C4 dicot Flaveria bidentis: photosynthetic acclimation to low light through shifts in leaf anatomy and biochemistry. Journal of Experimental Botany 61: 4109–4122. [DOI] [PMC free article] [PubMed] [Google Scholar]
- Pfeffer M, Peisker M. 1998. CO2 gas exchange and phosphoenolpyruvate carboxylase activity in leaves of Zea mays L. Photosynthesis Research 58: 281–291. [Google Scholar]
- Pons TL, Flexas J, von Caemmerer S, Evans JR, Genty B, Ribas‐Carbo M, Brugnoli E. 2009. Estimating mesophyll conductance to CO2: methodology, potential errors, and recommendations. Journal of Experimental Botany 60: 2217–2234. [DOI] [PubMed] [Google Scholar]
- R Core Team . 2018. R: a language and environment for statistical computing. Vienna, Austria: R Foundation for Statistical Computing. [Google Scholar]
- Rogers A, Medlyn BE, Dukes JS, Bonan G, von Caemmerer S, Dietze MC, Kattge J, Leakey ADB, Mercado LM, Niinemets Ü et al. 2017. A roadmap for improving the representation of photosynthesis in Earth system models. New Phytologist 213: 22–42. [DOI] [PubMed] [Google Scholar]
- Sharwood RE, Ghannoum O, Kapralov MV, Gunn LH, Whitney SM. 2016. Temperature responses of Rubisco from Paniceae grasses provide opportunities for improving C3 photosynthesis. Nature Plants 2: 16186. [DOI] [PubMed] [Google Scholar]
- Shrestha A, Buckley TN, Lockhart EL, Barbour MM. 2018. The response of mesophyll conductance to short‐ and long‐term environmental conditions in chickpea genotypes. AoB Plants 11: ply073. [DOI] [PMC free article] [PubMed] [Google Scholar]
- Sonawane BV, Cousins AB. 2019. Uncertainties and limitations of using carbon‐13 and oxygen‐18 leaf isotope exchange to estimate the temperature response of mesophyll CO2 conductance in C3 plants. New Phytologist 222: 122–131. [DOI] [PubMed] [Google Scholar]
- Sonawane BV, Cousins AB. 2020. Mesophyll CO2 conductance and leakiness are not responsive to short‐ and long‐term soil water limitations in the C4 plant Sorghum bicolor . The Plant Journal 103: 1590–1602. [DOI] [PubMed] [Google Scholar]
- Sonawane BV, Koteyeva NK, Johnson DM, Cousins AB. 2021. Differences in leaf anatomy determines temperature response of leaf hydraulic and mesophyll CO2 conductance in phylogenetically related C4 and C3 grass species. New Phytologist 230: 1802–1814. [DOI] [PubMed] [Google Scholar]
- Studer AJ, Gandin A, Kolbe AR, Wang L, Cousins AB, Brutnell TP. 2014. A limited role for carbonic anhydrase in C4 photosynthesis as revealed by a ca1ca2 double mutant in maize. Plant Physiology 165: 608–617. [DOI] [PMC free article] [PubMed] [Google Scholar]
- Tazoe Y, von Caemmerer S, Badger MR, Evans JR. 2009. Light and CO2 do not affect the mesophyll conductance to CO2 diffusion in wheat leaves. Journal of Experimental Botany 60: 2291–2301. [DOI] [PubMed] [Google Scholar]
- Terashima I, Hanba YT, Tazoe Y, Vyas P, Yano S. 2006. Irradiance and phenotype: comparative eco‐development of sun and shade leaves in relation to photosynthetic CO2 diffusion. Journal of Experimental Botany 57: 343–354. [DOI] [PubMed] [Google Scholar]
- Terashima I, Hanba YT, Tholen D, Niinemets Ü. 2011. Leaf functional anatomy in relation to photosynthesis. Plant Physiology 155: 108–116. [DOI] [PMC free article] [PubMed] [Google Scholar]
- Tholen D, Boom C, Noguchi K, Ueda S, Katase T, Terashima I. 2008. The chloroplast avoidance response decreases internal conductance to CO2 diffusion in Arabidopsis thaliana leaves. Plant, Cell & Environment 31: 1688–1700. [DOI] [PubMed] [Google Scholar]
- Tholen D, Zhu X‐G. 2011. The mechanistic basis of internal conductance: a theoretical analysis of mesophyll cell photosynthesis and CO2 diffusion. Plant Physiology 156: 90–105. [DOI] [PMC free article] [PubMed] [Google Scholar]
- Tosens T, Niinemets Ü, Westoby M, Wright IJ. 2012. Anatomical basis of variation in mesophyll resistance in eastern Australian sclerophylls: news of a long and winding path. Journal of Experimental Botany 63: 5105–5119. [DOI] [PMC free article] [PubMed] [Google Scholar]
- Ubierna N, Cernusak LA, Holloway‐Phillips M, Busch FA, Cousins AB, Farquhar GD. 2019. Critical review: incorporating the arrangement of mitochondria and chloroplasts into models of photosynthesis and carbon isotope discrimination. Photosynthesis Research 141: 5–31. [DOI] [PubMed] [Google Scholar]
- Ubierna N, Gandin A, Boyd RA, Cousins AB. 2017. Temperature response of mesophyll conductance in three C4 species calculated with two methods: 18O discrimination and in vitro V pmax . New Phytologist 214: 66–80. [DOI] [PubMed] [Google Scholar]
- Ubierna N, Gandin A, Cousins AB. 2018. The response of mesophyll conductance to short‐term variation in CO2 in the C4 plants Setaria viridis and Zea mays . Journal of Experimental Botany 69: 1159–1170. [DOI] [PMC free article] [PubMed] [Google Scholar]
- Uehlein N, Otto B, Hanson DT, Fischer M, McDowell N, Kaldenhoff R. 2008. Function of Nicotiana tabacum aquaporins as chloroplast gas pores challenges the concept of membrane CO2 permeability. Plant Cell 20: 648–657. [DOI] [PMC free article] [PubMed] [Google Scholar]
- Veromann‐Jürgenson L‐L, Tosens T, Laanisto L, Niinemets Ü. 2017. Extremely thick cell walls and low mesophyll conductance: welcome to the world of ancient living! Journal of Experimental Botany 68: 1639–1653. [DOI] [PMC free article] [PubMed] [Google Scholar]
- Wright IJ, Reich PB, Westoby M, Ackerly DD, Baruch Z, Bongers F, Cavender‐Bares J, Chapin T, Cornelissen JHC, Diemer M et al. 2004. The worldwide leaf economics spectrum. Nature 428: 821–827. [DOI] [PubMed] [Google Scholar]
- Xiong D, Flexas J. 2021. Leaf anatomical characteristics are less important than leaf chemical properties in determining photosynthesis responses to top‐dress N. Journal of Experimental Botany 72: 5709–5720. [DOI] [PubMed] [Google Scholar]
- Xiong D, Liu X, Liu L, Douthe C, Li Y, Peng S, Huang J. 2015. Rapid responses of mesophyll conductance to changes of CO2 concentration, temperature and irradiance are affected by N supplements in rice. Plant, Cell & Environment 38: 2541–2550. [DOI] [PubMed] [Google Scholar]
- Yin X, Struik PC. 2009. Theoretical reconsiderations when estimating the mesophyll conductance to CO2 diffusion in leaves of C3 plants by analysis of combined gas exchange and chlorophyll fluorescence measurements. Plant, Cell & Environment 32: 1513–1524. [DOI] [PubMed] [Google Scholar]
- Zar JH. 2007. Biostatistical analysis, 5th edn . Upper Saddle River, NJ, USA: Prentice-Hall. [Google Scholar]
Associated Data
This section collects any data citations, data availability statements, or supplementary materials included in this article.
Supplementary Materials
Fig. S1 Sensitivity of mesophyll conductance (g m; estimated by Ogee et al., 2018 method) to changes in fraction of CO2 not produced in bundle sheath cells (ϕr).
Fig. S2 Sensitivity of mesophyll conductance (g m; estimated by Ogee et al., 2018 method) to changes in leaf temperature (T leaf).
Fig. S3 Relationship of model coefficient a (indicating value of g m at 34 Pa pCO2) with coefficient b (sensitivity of g m to C a; relatively lower b values indicate lower rate of change in g m with C a) and relationship between coefficient b and percentage change in g m.
Fig. S4 Relationship of percent increase in g m with mesophyll cell wall thickness (T CW) mesophyll surface area exposed to intercellular air spaces (Smes) ratio of T CW : Smes, stomatal ratio (SR), stomatal density adaxial (SDada) and leaf thickness among the 16 C4 grasses measured in current study.
Fig. S5 Relationship of percent increase in g m with PEPC activity Rubisco activity CA activity expressed as k CA, PEPC affinity for HCO3 − (K m), maximum photosynthetic capacity (A max) and leaf N content (Narea) among the 16 C4 grasses measured in current study.
Fig. S6 Relationship of percent increase in g m with ratio of mesophyll cell wall thickness (T CW) to PEPC activity Rubisco activity PEPC affinity for HCO3 − (K m), CA activity expressed as k CA, maximum photosynthetic rates (A max) and leaf N content (Narea) among the 16 C4 grasses measured in current study.
Fig. S7 Relationship of percent increase in g m with percent decrease in leaf‐level water‐use efficiency (TEi) expressed as A net/g sw (higher negative value indicates greater decrease in TEi), percent increase in stomatal conductance to water (g sw) and percent decrease in net photosynthetic rates (A net) (higher negative value indicates greater decrease in A net) for the 16 C4 grasses measured in current study.
Fig. S8 PCA biplot showing major axes of variation in important leaf‐level anatomical and biochemical traits and percent change (increase or decrease) in response to CO2 in physiological traits such as g m, A net, g sw and TEi for the 16 diverse C4 grasses measured in current study.
Fig. S9 Response of mesophyll conductance (g m) to changes in pCO2 inside leaf chamber (C a) in three C4 biochemical subtypes (NAD‐ME, NADP‐ME, PCK).
Fig. S10 Response of mesophyll conductance to CO2 (g m) to changes in intercellular CO2 (C i) in 16 diverse C4 grasses measured in current study.
Fig. S11 Response of leaf net C18O16O discrimination (∆18O) to changes in pCO2 inside leaf chamber (C a) in 16 diverse C4 grasses measured in current study.
Fig. S12 Response of stomatal conductance to water (g sw) to changes in pCO2 inside leaf chamber (C a) 16 diverse C4 grasses measured in current study.
Fig. S13 Response of net CO2 assimilation rates (A net) to changes in pCO2 inside leaf chamber (C a) in 16 diverse C4 grasses measured in current study.
Fig. S14 Response of leaf intercellular CO2 concentration (C i) to changes in pCO2 inside leaf chamber (C a) in 16 diverse C4 grasses measured in current study.
Fig. S15 Response of leaf‐level water‐use efficiency (TEi = A net/g sw) to changes in pCO2 inside leaf chamber (C a) in 16 diverse C4 grasses measured in current study.
Methods S1 Measurement of anatomical traits.
Methods S2 Principal component analysis.
Table S1 Key input parameters used in calculation of isotope parameters and estimation of mesophyll conductance (g m) for the 16 C4 grasses at four pCO2 levels (34, 27, 20 and 14 Pa) and a temperature of 25°C.
Table S2 Results of one‐way ANOVA with species as main effects for all the leaf‐level anatomical and biochemical traits measured for 16 C4 grasses in current study.
Table S3 C4 grasses used in current study along with their biochemical subtype and mean ± SE values for the equation (g m = a × (34/C a) b ) constants derived for the CO2 response of g m in the 16 C4 grasses.
Table S4 Component loadings for important leaf‐level traits determined on 16 C4 grasses.
Please note: Wiley Blackwell are not responsible for the content or functionality of any Supporting Information supplied by the authors. Any queries (other than missing material) should be directed to the New Phytologist Central Office.
Data Availability Statement
Data available on request from the authors.