

Abstract
Introduction
Extracellular matrix turnover, a ubiquitous dynamic biological process, can be diverted to fibrosis. The latter can affect the intestine as a serious complication of Inflammatory Bowel Diseases (IBD) and is resistant to current pharmacological interventions. It embosses the need for out-of-the-box approaches to identify and target molecular mechanisms of fibrosis.
Methods and results
In this study, a novel mRNA sequencing dataset of 22 pairs of intestinal biopsies from the terminal ileum (TI) and the sigmoid of 7 patients with Crohn’s disease, 6 with ulcerative colitis and 9 control individuals (CI) served as a validation cohort of a core fibrotic transcriptomic signature (FIBSig), This signature, which was identified in publicly available data (839 samples from patients and healthy individuals) of 5 fibrotic disorders affecting different organs (GI tract, lung, skin, liver, kidney), encompasses 241 genes and the functional pathways which derive from their interactome. These genes were used in further bioinformatics co-expression analyses to elucidate the site-specific molecular background of intestinal fibrosis highlighting their involvement, particularly in the terminal ileum. We also confirmed different transcriptomic profiles of the sigmoid and terminal ileum in our validation cohort. Combining the results of these analyses we highlight 21 core hub genes within a larger single co-expression module, highly enriched in the terminal ileum of CD patients. Further pathway analysis revealed known and novel inflammation-regulated, fibrogenic pathways operating in the TI, such as IL-13 signaling and pyroptosis, respectively.
Discussion
These findings provide a rationale for the increased incidence of fibrosis at the terminal ileum of CD patients and highlight operating pathways in intestinal fibrosis for future evaluation with mechanistic and translational studies.
Keywords: fibrosis, IBD, co-expression, tissue localization, transcriptomics
1. Introduction
Intestinal fibrosis is a feature of complicated Inflammatory Bowel Diseases (IBD), with Crohn’s Disease (CD) significantly more affected compared to Ulcerative Colitis (UC). This can be attributed to fibrosis in CD being a transmural process, while in UC, limited to the lamina propria (1). Nonetheless, fibrosis is a serious manifestation for both diseases, as it may lead to motility disorders and intestinal obstruction. There is no medical treatment for intestinal fibrosis yet (2).
In physiology, a trauma on mucosal surface induces inflammation. As inflammation fades, mesenchymal cells, the main extracellular matrix (ECM) producers, are recruited to promote wound healing (3). In IBD pathophysiology, the dynamic balance between secreted extracellular matrix (ECM) components and enzymes dissolving it, is disturbed towards fibrogenesis (4).
In this process, various pro-fibrotic signaling pathways are involved, all of them leading to either the upregulation of secretion of ECM components, such as distinct types of collagens and fibronectin, or the imbalanced expression between metalloproteinases (MMPs), which degrade ECM, and tissue inhibitors of metalloproteinases (TIMPs), which counteract MMPs’ activity (5). The most well-known profibrotic signaling pathway is that of TGF-β, acting either through canonical signaling that involves the activation of Smads, or through two Smad-independent signaling pathways: mitogen-activated protein kinases (MAPK) and phosphatidylinositol 3-kinases (PI3K). Other significant pathways include Wnt/β-Catenin, Sonic hedgehog (Shh), Notch and Integrin-linked kinases, all of which lead to upregulated expression of ECM and, ultimately, result in fibrogenesis (5).
Apart from IBD, fibrosis is a common complication of various diseases, such as Idiopathic Pulmonary Fibrosis (IPF) (6), Chronic Kidney Disease (CKD) (7), Systemic Sclerosis (SSc) (8) and Chronic Liver Diseases (CLD) (9) and in all cases, a successful anti-fibrotic treatment is yet to be found. Regarding intestinal fibrosis, it is most commonly symptomatic in CD rather than in UC, and in some cases, its occurrence may lead to intestinal strictures, which are amenable only to excision (2). Around 10% of patients with CD develop a stricturing phenotype (10), out of which 40-70% will require surgical intervention at least once, often due to stricture (11). Although strictures can occur in any part of the gastrointestinal tract, the most commonly affected segment is the small bowel and more specifically, the terminal ileum (12). Around 40-55% of de novo strictures occur in the terminal ileum, while a lower prevalence has been reported for other parts of the gastrointestinal tract (13). Despite clinical awareness, there are still a few studies attempting to shed light to implicated pathogenetic mechanisms in the terminal ileum, where stenoses will be most likely to be symptomatic (14–22).
The first aim of this study was to demonstrate an in silico methodology for the identification of genes and pathways involved in profibrotic mechanisms common between different fibrotic disorders of different organs as well as their site-specific occurrence. For this purpose, publicly available data for 5 such diseases were used to assemble a core fibrotic transcriptomic signature (FIBSig). The second aim was to validate FIBSig with wet-lab experiments. In more detail, we carried out mRNA sequencing of paired intestinal biopsies from the sigmoid and the terminal ileum of CD, UC, and control individuals (CI). We expanded on pathways involved and focused on ileum-specific ones, as this may reflect modalities of greater clinical impact and of interest in therapeutics.
2. Materials and methods
2.1. Public data
2.1.1. Common fibrotic signature via differential gene expression
To identify genes which are commonly dysregulated between CD, IPF, CKD, SSc and CLD, we used publicly available gene expression data from NCBI’s Gene Expression Omnibus (GEO) (23). In total 9 CD [GSE3365 (24), GSE6731 (25), GSE9686 (26), GSE16879 (27), GSE20881 (28), GSE59071 (29), GSE75214 (30), GSE94648 (31), GSE97012 (32)], 2 IPF [GSE93606 (33), GSE110147 (34)], 1 CKD [GSE66494 (35)], 1 CLD [GSE17548 (36)] and 1 SSc [GSE76807 (37)] datasets were retrieved from GEO. All datasets fulfill the following criteria: only human subjects, each dataset with both patients and controls and only created by microarray experiments. Only samples of interest, preferably prior to therapeutic interventions, were utilized making a total of n=839.
Differential gene expression of patients versus controls was calculated with the GEO2R tool in each dataset, to decrease experimental bias. Genes of perturbed expression, statistically significant by the linear models for microarray data (limma) method (38) at the p < 0.05 level, were extracted for each individual dataset.
To identify commonalities among these gene lists, a multiset intersection approach was adopted using the R package SuperExactTest v1.1.0 (39). Initially, the 9 gene lists derived from CD datasets were intersected among themselves. The gene lists from the other 4 fibrotic disorders were separately intersected. Constructing two separate gene lists (CD, the other 4 fibrotic diseases) aimed to provide higher precision while maintaining a broader point of view on common differentially expressed genes. The first list consisted of genes of at least 7 out of 9 CD gene lists, which includes C(9,7)=36 combinations, C(9,8)=9 combinations and C(9,9)=1 combination, making a total of 46 combinations (GeneSet1). Similarly for the rest (5) gene lists of the other 4 fibrotic conditions the combined gene set was created by all combinations of at least 4 out of 5 gene lists, which includes C(5,4)=5 combinations and C(5,5)=1 combination, making a total 6 combinations (GeneSet2). This approach allows for all datasets to be utilized without losing information which does not fit on strict comparisons. The last step was to intersect GeneSet1 and GeneSet2 and aggregate all the common genes to a gene list, hereafter called fibrotic signature (FIBSig).
2.1.2. Literature-based tissue-specific co-expression analysis
To study how the FIBSig genes are co-expressed in the sigmoid and the terminal ileum we used them as input for the gene co-expression network analysis module of the online platform NetworkAnalyst v3.0 (40). This module is based on data from the iNetModels (41) database and provides users with information on how specific genes are co-expressed in various tissues. Co-expression analysis identifies clusters of genes (functional gene modules) which follow similar expression patterns across samples, identifying associations with specific factors (42).
2.1.3. Pathway enrichment analysis
All functional analyses of this work were performed in R using the clusterProfiler v4.0.5 (43) package using knowledge from the following databases: Reactome (44), Gene Ontology:Biological Process (GO:BP) (45), Gene Ontology: Molecular Function (GO:MF) (45) and Kyoto Encyclopedia of Genes and Genomes (KEGG) (46). Enrichment p-values were adjusted using the Benjamini-Hochberg method. Based on the literature these databases provide some overlap but also unique insights into gene contribution on biological functions (47, 48).
2.2. RNA-SEQ from collected intestinal biopsies
2.2.1. Patients
Paired intestinal biopsies from the sigmoid and the terminal ileum were obtained with endoscopy from 9 individuals without autoimmune disease, malignancy or acute infection, who underwent screening colonoscopy and had no abnormal findings (control individuals- CI), 7 patients with CD and 6 with UC. Endoscopies were performed at the Endoscopy Department, University Hospital of Alexandroupolis, Greece. The local Research Ethics Committee approved this study (Protocol Number: Θ9/Δ.Σ37/21.12.2018), and patients gave their informed written consent prior to participation. Upon retrieval, biopsies were immediately submerged in RNAlater (Sigma-Aldrich, St. Louis, Missouri, United States) and stored at -80oC until further processing. Table 1 summarizes the metadata of the 44 samples.
Table 1.
Demographic characteristics of included samples.
| SAMPLE NAME | PATIENT ID | TISSUE | CONDITION | SEX | AGE |
|---|---|---|---|---|---|
| 1HI | B1_B2 | ILEAL | HI | F | 61 |
| 2HI | SIGMOID | ||||
| 13UC | B13_B14 | ILEAL | UC | F | 52 |
| 14UC | SIGMOID | ||||
| 15UC | B15_B16 | ILEAL | UC | F | 53 |
| 16UC | SIGMOID | ||||
| 17UC | B17_B18 | ILEAL | UC | M | 27 |
| 18UC | SIGMOID | ||||
| 19UC | B19_B20 | ILEAL | UC | M | 33 |
| 20UC | SIGMOID | ||||
| 21UC | B21_22 | ILEAL | UC | M | 67 |
| 22UC | SIGMOID | ||||
| 23UC | B23_B24 | ILEAL | UC | F | 61 |
| 24UC | SIGMOID | ||||
| 3CD | B3_B4 | ILEAL | CD | F | 52 |
| 4CD | SIGMOID | ||||
| 31CD | B31_B32 | ILEAL | CD | F | 29 |
| 32CD | SIGMOID | ||||
| 33CD | B33_B34 | ILEAL | CD | M | 51 |
| 34CD | SIGMOID | ||||
| 35CD | B35_B36 | ILEAL | CD | F | 60 |
| 36CD | SIGMOID | ||||
| 41HI | B41_B42 | ILEAL | HI | F | 62 |
| 42HI | SIGMOID | ||||
| 43HI | B43_B44 | ILEAL | HI | F | 54 |
| 44HI | SIGMOID | ||||
| 45HI | B45_B46 | ILEAL | HI | M | 57 |
| 46HI | SIGMOID | ||||
| 47HI | B47_B48 | ILEAL | HI | M | 69 |
| 48HI | SIGMOID | ||||
| 49HI | B49_B50 | ILEAL | HI | M | 58 |
| 50HI | SIGMOID | ||||
| 5CD | B5_B6 | ILEAL | CD | M | 44 |
| 6CD | SIGMOID | ||||
| 51HI | B51_B52 | ILEAL | HI | F | 72 |
| 52HI | SIGMOID | ||||
| 53HI | B53_B54 | ILEAL | HI | M | 74 |
| 54HI | SIGMOID | ||||
| 55HI | B55_B56 | ILEAL | HI | M | 55 |
| 56HI | SIGMOID | ||||
| 7CD | B7_B8 | ILEAL | CD | M | 28 |
| 8CD | SIGMOID | ||||
| 10CD | B9_B10 | SIGMOID | CD | F | 35 |
| 9CD | ILEAL |
2.2.2. Total RNA extraction and purification
Total RNA from tissue biopsies was extracted and purified from DNA traces using the Nucleospin RNA Plus XS kit (MACHEREY-NAGEL, Düren, Germany) according to the manufacturer’s instructions. Briefly, tissues were first lysed and homogenized and DNA was removed by passing the lysate through DNA-removal columns. The purified lysate was then loaded onto RNA-extraction columns, washed 3 times and finally total RNA was eluted using Rnase-free H2O. The concentration and purity of total RNA was measured in a Q5000 UV-Vis spectrophotometer (Quawell, San Jose, California, United States).
2.2.3. RNA sequencing, alignment and PCA
Next Generation Sequencing (NGS) libraries from the total RNA samples were prepared using a QuantSeq 3′ mRNA-Seq Library Prep Kit FWD according to the manufacturer’s instructions. Sequencing was carried out on a IonTorrent S5 sequencer (Thermo Fisher Scientific Inc,Waltham, Massachusetts, USA). Output averaged ~3-4 million quality-controlled reads per sample with a median read length of 140bp.
Alignment of sequences was performed using Salmon v.1.6.0 (49) on the GRCh38 Human Transcriptome reference. Salmon’s output was imported into R using tximport v1.20.0 (50) as a DESEQ2 v1.32.0 (51) object. Principal Component Analysis (PCA) was performed on the transformed (normTransform function) DESEQ2 object using the plotPCA function.
2.2.4. RNA-seq Co-expression Gene set enrichment analysis
The normalized counts of the FIBSig genes only were used as input to CEMiTool v1.16.0 (52) in R to perform automatic analysis and discovery of co-expression modules across our specified conditions (CD, UC, and HI) and intestinal site (sigmoid and terminal ileum). In addition, a protein-protein interaction (PPI) network constructed via STRING-db (53), by the genes identified by CEMiTool as co-expressed, was fed back as additional input to CEMiTool which, in turn, highlighted several hub genes involved via network centrality analysis.
3. Results
3.1. In silico data
3.1.1. Fibrotic signature genes
We first utilized public data to identify and explore a common signature in various fibrotic disorders. Figure 1 depicts the methodology used and the resulting gene sets arising from the multiset intersections of differentially expressed genes (DEG). The complete DEG sets from each individual analysis can be found in the Supplementary File . Seven genes (CXCL1, ICAM1, PHLPP2, ZKSCAN1, ATP9A, NCF4, CACNA2D1) were common in all CD datasets. In total, gene expression of 672 genes was found commonly perturbed in the CD datasets and 5271 genes in the other 4 disorders. Their intersection, hereafter referred to as fibrotic signature (FIBSig), includes 241 genes ( Figure 2A ; Table 2 ). Many of these genes were involved in immunology and inflammation pathways, which are upstream of fibrosis end-products. This was promising and prompted us to further investigation of their synergies and contribution to pathophysiology mechanisms.
Figure 1.

Visual representation of the differential expression analysis pipeline employed to identify fibrosis-related genes from public datasets of 5 fibrotic disorders (Crohn’s Disease, Idiopathic Pulmonary Fibrosis, Chronic Kidney Disease, Systemic Sclerosis and Chronic Liver Disease) using the GEO2R online tool. In total, 46 combinations of the Crohn’s Disease datasets yielded 672 differentially expressed genes and 6 combinations of the datasets from other fibrotic disorder highlighted 5271 differentially expressed genes. Multiset comparisons of combinations were conducted using the SuperExactTest R package.
Figure 2.
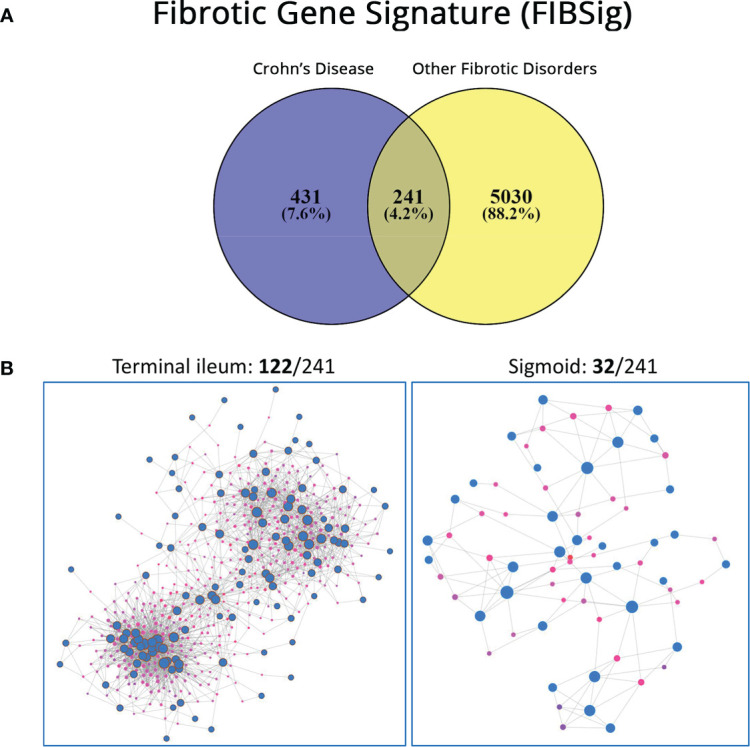
(A) Venn diagram reporting on genes expressed in Crohn’s Disease, in other fibrotic diseases and their intersection (FIBSig). (B) Tissue-specific expression with the NetworkAnalyst online platform and information form the iNetModels database; significantly more FIBSig genes were co-expressed in the terminal ileum versus the sigmoid.
Table 2.
Transcriptomic signature of 241 genes commonly dysregulated in all fibrotic disorders under study.
| ICAM1 | VCP | SLC16A5 | TRAM2 | HSP90B1 | OGFR | AP3D1 | CDKN2B |
| ZKSCAN1 | TGM2 | SSR1 | RAB17 | RPS6KA2 | HNRNPU | PDS5A | SPRYD7 |
| ATP9A | RECQL | IRF1 | ABCA5 | TPK1 | SMARCA2 | CCND1 | SASH1 |
| NAMPT | IL1RAP | CEBPB | CXCL5 | AVIL | SLC9A6 | ROCK2 | RAMP3 |
| S100A11 | STAT1 | PSME1 | TPM4 | HADHA | CDC6 | UBXN4 | OCRL |
| SUPT4H1 | PTPN21 | HDLBP | LETM1 | MMP1 | MELTF | TAOK3 | SLC4A7 |
| ASPH | PPM1A | AQP9 | CLEC7A | PDLIM2 | TCF12 | STRN | TNC |
| ACSL1 | GM2A | PLCB1 | FBXW7 | TMEM38B | HNRNPH3 | GATAD1 | SS18L1 |
| DRAM1 | TMEM41B | EIF4EBP2 | CCL2 | HSPA13 | CALM3 | MUT | RABGAP1 |
| VNN1 | ATP2C1 | IL7R | TRIM22 | NUCB2 | RAP1A | RMND5A | CCNT2 |
| C1QA | SYNGR2 | PYHIN1 | SCD | SERPING1 | ENDOD1 | DST | EIF4G3 |
| HNF4A | CFB | TRABD | TMEM184B | ARMCX3 | QKI | KIAA1109 | DCAF4 |
| SOCS3 | CADM1 | PATJ | IFITM2 | HLA-DQB1 | TNFRSF1B | NDUFA5 | CALD1 |
| XPO1 | SNX13 | RANBP9 | TUBB6 | NOL7 | LRPPRC | RYBP | DYRK2 |
| MYCBP2 | ARF6 | PFKFB3 | MBNL3 | SMC3 | LTN1 | SOCS1 | NDUFAF3 |
| PRRC2C | DEF8 | MLLT10 | ADAM9 | PHACTR2 | PAPSS2 | ARHGEF10 | SORL1 |
| NUP210 | GPCPD1 | BMPR1A | BAG2 | PGLYRP1 | MEST | DLD | SPAG9 |
| ATRX | DDAH2 | NEDD4L | HEXIM1 | KAT6B | RRAS2 | CHMP2B | CDC5L |
| LIMK1 | CASP1 | TUSC2 | SLC7A11 | CD58 | ZNF292 | NRP2 | SERHL2 |
| NDUFA6 | FBXL20 | SYF2 | BHLHE40 | ATM | ZNF43 | PPP6C | FLT3 |
| ETS1 | MRPS25 | SETX | OSBPL3 | PHF3 | KYNU | CREBL2 | TFPI2 |
| ADAMTS2 | CLDN1 | PHF21A | RRM2 | DLG1 | RHOQ | API5 | PLA2R1 |
| SPON1 | MIEN1 | STX11 | IGFBP7 | FOXN3 | SERBP1 | GMFB | KIAA0930 |
| PEX1 | CASP4 | CBFA2T2 | COL4A1 | REL | OAZ1 | SEMA3F | BRD3 |
| ZEB2 | DAAM1 | GIGYF2 | RARRES3 | ITGA6 | SCAMP3 | CD3E | TNPO2 |
| RNF14 | ARHGAP1 | ANXA3 | HIF1A | PRKD3 | SBF1 | SKIL | MECOM |
| APPBP2 | ESR1 | PHTF1 | ARMC8 | ARHGAP5 | BCAT1 | RNF6 | KBTBD11 |
| PAFAH1B1 | COBLL1 | EDN2 | THEMIS2 | MGAT5 | MMP14 | GSR | CDC14B |
| PAX8 | ATP6V1C1 | TAF4 | THRA | FGFR1 | NDUFB8 | FEZ2 | UBE4A |
| PHLDA1 | ZNF81 | TRIB1 | PGM3 | NIPAL3 | NFYC | CNBP | OLFM1 |
| MTDH |
This gene set was named FIBSig.
3.1.2. Intestinal site-specific genes
Keeping in mind that ileal fibrosis is far more common and debilitating than colonic fibrosis, we focused on finding if FIBSig was involved. When FIBSig was used as input to NetworkAnalyst’s co-expression analysis module, it revealed that 122 of these 241 genes were co-expressed in the terminal ileum and 32 of the 241 genes in the sigmoid ( Figure 2B ), revealing a higher involvement of the FIBSig in the terminal ileum. 20 genes (ARHGEF10, QKI, ETS1, IFITM2, GPCPD1, ZEB2, OSBPL3, SOCS3, CCL2, CADM1, DDAH2, CEBPB, ACSL1, NAMPT, TFPI2, HIF1A, ADAMTS2, SCD, TRAM2, PFKFB3) were common in both tissues, defining a shared co-expression module. The complete gene sets can be found in the Supplementary File .
3.1.3. Biological pathway analysis of FIBSig
Functional analysis of the FIBSig genes was conducted using literature and experimental information provided by the databases described in the methodology.
Reactome revealed their high involvement in significant inflammatory and fibrogenic pathways, like modifying TGF-β, SMAD 2/3/4 heterotrimer and RHO GTPase. Enrichment of cytokine pathways, including interferons and interleukins verified that immune signaling precedes and parallels fibrosis. The combined pathway of T helper (Th)2 interleukins (IL-) 4 and 13, along with interferon (IFN) gamma further supported their role in fibrogenesis. Pyroptosis, a type of cell death caused by inflammation, was also identified by Reactome, indicating that cell death is related to fibrosis. A complete list of involved pathways can be reviewed in Figure 3A .
Figure 3.

Pathway enrichment analysis on the FIBSig genes (performed with R and the clusterProfiler package) using (A) Reactome, (B) Kyoto Encyclopedia of Genes and Genomes (KEGG), (C) Gene Ontology: Biological Process (GO:BP) and (D) Gene Ontology: Molecular Function (GO:MF). Top to bottom: most to least FIBSIg genes as a ratio of the pathway’s total number of genes.
By design, KEGG features pathways which point to alternative disorders of similar molecular mechanisms. As seen in Figure 3B , results such as pertussis, rheumatoid arthritis, atherosclerosis, leukemia, viral myocarditis, influenza A, Yersinia infection and tuberculosis can be viewed in regard to mechanisms controlling their onset and progression. Several other pathways, like prolactin signaling and hematopoietic cell lineage, appear to be off-target results or of unknown importance. However, the fact that TNF, IL-17 and T helper (Th)17 differentiation pathways were enriched, also emphasized the crucial role of innate and adaptive immunity in the pathogenesis of fibrosis. Furthermore, involvement of the tight junction pathway stressed the importance of the integrity of the epithelial barrier to prevent profibrotic signaling in the lamina propria.
Results from the two Gene Ontology ( Figures 3C, D ) databases further broke down the grouped pathways of the previous analyses into more specific biological processes. For instance, IFN signaling was broken down to IFN-γ, cellular response to IFN-γ and IFN-γ-mediated signaling pathways. Similarly, the cell cycle pathway of KEGG was further divided into the G2/M phase transition, G2 DNA damage checkpoint, mitotic G2/M transition checkpoint, G2/M transition of mitotic cell cycle, positive regulation of signal transduction by p53 and negative regulation of cell cycle process pathways. In addition, the results of GO:MF brought up to the foreground that enzymes and receptors are also involved in fibrosis.
3.2. Validation
3.2.1. mRNA sequencing
To generate independent data for validation of the aforementioned in silico findings, we performed mRNA sequencing on our own paired (terminal ileum, sigmoid) intestinal CD, UC, CI biopsies. PCA analysis ( Figure 4A ) of this sequencing effort pointed to the intestinal segment of origin having the largest effect on transcriptomic profiles compared to other factors, namely disease. In other words, most samples were well separated by intestinal segment of origin with the first PCA axis explaining a surprisingly substantial portion (45%) of the variance. Distinct transcriptomic profiles by intestinal segment held promise of this separation being maintained after subsetting the genes involved to include only those related to profibrotic signaling.
Figure 4.

(A) PCA plot of our mRNA sequencing data colored according to biopsy location. Biopsy location explains a very large part of the variance. (B) Gene set enrichment analysis (GSEA) plot, generated with CEMiTool, showing the correlation of the co-expression module to specific disease and intestinal segment combinations. Red and blue colors denote over- or under-expression, respectively. Size depicts the strength of the correlations.
3.2.2. Localization
To test this hypothesis, we focused on genes differentially expressed both in our mRNA sequencing effort and in FIBSig. Co-expression analysis was performed on the read counts of the FIBSig genes in our samples and, indeed, provided a single strong module (M1) of co-expression. The M1 module contained 112 genes ( Table 3 ) of the 241 used as input (FIBSig).
Table 3.
Genes comprising the M1 co-expression module.
| ICAM1 | ADAMTS2 | CASP1 | SETX | IFITM2 | PGM3 | TNFRSF1B | CDKN2B |
| ZKSCAN1 | ZEB2 | MRPS25 | PHF21A | TUBB6 | HSP90B1 | LTN1 | SPRYD7 |
| ATP9A | PHLDA1 | CASP4 | STX11 | MBNL3 | RPS6KA2 | PAPSS2 | RAMP3 |
| NAMPT | VCP | ESR1 | ANXA3 | ADAM9 | MMP1 | KYNU | OCRL |
| S100A11 | TGM2 | ATP6V1C1 | PHTF1 | BAG2 | HSPA13 | RHOQ | TNC |
| ACSL1 | RECQL | SSR1 | TRIB1 | SLC7A11 | NUCB2 | BCAT1 | RABGAP1 |
| DRAM1 | IL1RAP | IRF1 | TRAM2 | BHLHE40 | SERPING1 | MMP14 | CALD1 |
| HNF4A | STAT1 | CEBPB | CXCL5 | OSBPL3 | ARMCX3 | CCND1 | DYRK2 |
| SOCS3 | PTPN21 | PSME1 | TPM4 | RRM2 | HLA-DQB1 | RYBP | SORL1 |
| MYCBP2 | GM2A | AQP9 | LETM1 | IGFBP7 | ATM | SOCS1 | FLT3 |
| PRRC2C | CFB | EIF4EBP2 | CLEC7A | COL4A1 | DLG1 | NRP2 | TFPI2 |
| NUP210 | CADM1 | IL7R | FBXW7 | HIF1A | PRKD3 | CD3E | KIAA0930 |
| ATRX | DEF8 | PFKFB3 | CCL2 | THEMIS2 | FGFR1 | SKIL | OLFM1 |
| ETS1 | GPCPD1 | NEDD4L | TRIM22 | THRA | QKI | CNBP | MTDH |
To check if genes of M1 kept the ileal localization the originating pool (FIBSig) had, we proceeded to gene set enrichment analysis (GSEA) and found that the M1 module had a strong positive correlation with the terminal ileum samples of CD but was poorly correlated with the sigmoid in UC and was inversely correlated to all CI samples ( Figure 4B ). Positive Normalized Enrichment Score (NES) values in this case pointed to over-expressed genes that are co-expressed, while negative NES points to under-expression based on the way CEMiTool ranks the genes.
3.2.3. Hub genes
To narrow down the genes of the M1 module that hold more important roles than others in profibrotic pathways, a PPI network of the M1 module was constructed (full interactions provided in the Supplementary File ). Twenty-one hub genes were identified as high degree nodes (ATM, FGFR1, FBXW7, ESR1, CCND1, HIF1A, CEBPB, NAMPT, KYNU, IRF1, SOCS1, ICAM1, ETS1, IL7R, MMP1, HNF4A, CCL2, CASP1, STAT1, SOCS3, HSP90B1). The importance of these hub genes in a biological network lies in their strong crosstalk with their gene neighbors via physical or signaling interactions ( Figure 5 ).
Figure 5.

Protein-Protein Interaction (PPI) network of the 112 genes in the co-expression module M1. Twenty-one hub genes are labeled. The PPI was built with the STRING database based on known interactions between the provided genes. Hubs were defined as genes with a high degree centrality score, which signifies higher interconnectivity with other genes and importance for the stability of the network.
3.2.4. Profibrotic pathways
Lastly, the 112 genes of module M1 were used as input for pathway analysis, similar to what was performed for the FIBSig. The aim, again, was to further deduce fibrosis-related inflammatory pathways. Reactome ( Figure 6A ), highlighted immune-related pathways relevant to cytokine signaling, including IL-4, IL-13, IFN-α, IFN-β, IFN-γ, regulation of signaling, such as that of IFN-α, all of which have been already implicated in fibrogenesis. However, we report for the first time the correlation of growth hormone receptors, CSF3 (G-CSF) signaling and pyroptosis with intestinal fibrosis.
Figure 6.

Pathway enrichment analysis on the M1 co-expression module genes (performed with R and the clusterProfiler package) using (A) Reactome, (B) Kyoto Encyclopedia of Genes and Genomes (KEGG), (C) Gene Ontology: Biological Process (GO:BP) and (D) Gene Ontology: Molecular Function (GO:MF). Top to bottom: most to least FIBSIg genes as a ratio of the pathway’s total number of genes.
Similarly, the investigation of the M1 module with the KEGG database also revealed disease-related pathways, such as those of rheumatoid arthritis, human T-cell leukemia virus 1 infection, AGE-RACE signaling pathway in diabetic complications, influenza A, pertussis, human papillomavirus infection, viral myocarditis, and central carbon metabolism in cancer, perhaps due to commonalities in pathogenic mechanisms ( Figure 6B ). In addition, KEGG reported more pathways, seemingly unrelated to fibrogenesis, like those of prolactin, thyroid hormones, hematopoietic cell lineage, c-type lectin receptor signaling and adipocytokines, as well as, cell cycle associated pathways, such as those of p53 and FoxO. Nonetheless, it also highlighted several immune-related pathways that have been associated with both inflammation and fibrosis, such as those of TNF, IL-17, Th17 differentiation, JAK-STAT kinases, and NOD-like receptors.
GO:BP analysis revealed some immune- and cell cycle-related pathways, already reported by the previous tools, such as those of signaling and cellular response to IFN-γ, epithelial cell proliferation, cell cycle G1/S phase transition and cell number homeostasis ( Figure 6C ). Likewise, GO:MF database highlighted several receptors, molecules and enzymes involved in many of the aforementioned signaling pathways ( Figure 6D ).
4. Discussion
In this study, we identified mRNA expression data meeting minimum quality requirements for a wide spectrum of fibrotic diseases, including CD. We then combined the pool of genes differentially expressed in CD with the pool of genes differentially expressed in the rest of the fibrotic diseases. Most of the 241 genes belonging to both pools (FIBSig) were ileum-specific, which is the intestinal segment where fibrosis is most common and most clinically detrimental in CD. Genes were then assembled into pathways and, interestingly, many of them were actually upstream of fibrosis.
We validated the aforementioned in silico findings by sequencing mRNA both in the terminal ileum and the colon of CD, UC and controls and cross-sectioned findings with the FIBSig genes ending up to new module of 112 genes (M1). Indeed, localization of most of the M1 genes was again ileal. Starting from this new pool of genes, we employed PPI network analysis to identify 21 pivotal hub genes, that may be of great pharmacologic value. Interestingly, there has been some research on these genes in relation to fibrosis, but no research for any of them relevant to intestinal fibrosis ( Table 4 ). Of note, currently there is no effective treatment for fibrotic CD. Lastly, genes of the M1 module were also relevant to a wide range of pathways, not necessarily the ones directly producing extracellular matrix components. This confirms that genes of the M1 module are indeed promising therapeutic targets for preventing fibrosis.
Table 4.
The role of the 21 hub genes in fibrogenesis.
| GENE | ROLE | ROLE IN FIBROSIS |
|---|---|---|
| ATM | Kinase Regulates cell cycle upon DNA damage Initiates cell cycle arrest either for DNA repairing or apoptosis depending on the extent of DNA damage (54) |
Loss of ATM attenuates cardiac fibrosis (55) |
| FGFR1 | Receptor tyrosine kinase Fibroblast Growth Factor Receptor family (56) |
Inhibition of FGFR1 reduces skin and pulmonary fibrosis (57, 58) |
| FBXW7 | F-box protein family Component of the Skp1-Cdc53/Cullin-F-box-protein complex: ubiquitination and protein degradation of various oncoproteins (59) |
Overexpression of FBXW7 reduces hepatic and pulmonary fibrogenesis (60–62) |
| ESR1 | Receptor α to estrogen |
ESR1 is overexpressed in pulmonary fibrosis (63) Its activation decreases epithelial-to-mesenchymal transition (64) |
| CCND1 | G1 phase cell cycle regulator (65) |
Overexpression of CCND1 has been associated with renal fibrosis (66) |
| HIF1A | Nuclear transcription factor Regulates oxygen homeostasis (67) |
HIF1A is overexpressed in early stages of renal fibrosis Its inhibition leads to the improvement of fibrosis (68) |
| CEBPB | Leucine zipper transcription factor (69) |
CEBPB promotes TGF-β/SMAD3 signalling Its loss of expression reduces pulmonary fibrosis (70, 71) |
| NAMPT | Nicotinamide phosphoribosyltransferase | Overexpression of NAMPT attenuates hepatic fibrosis (72) Contradicting results in an animal model of radiation-induced pulmonary fibrosis: the neutralization of NAMPT leads to the amelioration of fibrosis (73) |
| KYNU | Kynureninase – an enzyme involved in the biosynthesis of nicotinamide adenosine dinucleotide cofactors from tryptophan (74) |
Unknown |
| IRF1 | Regulates immune responses Suppresses tumour development (75) |
Overexpression of IRF1 results in renal fibrosis (76) |
| SOCS1 | Member of the suppressor of cytokine signalling family JAK/STAT pathway inhibitor (77) |
Loss of expression of SOCS1 aggravates hepatic fibrosis (78) |
| ICAM1 | Intercellular adhesion molecule | Inhibition of ICAM1 reduces cardiac fibrosis (79) |
| ETS1 | Transcriptional factor (80) |
Inhibition of ETS1 reduces cardiac fibrosis (81) |
| IL7R | Receptor of IL-7 | High expression levels of IL7R have been reported in HBV-induced hepatic fibrosis (82) |
| MMP1 | Matrix metalloproteinase 1 Degrades ECM components |
Inhibition of MMP1 improves pulmonary fibrosis (83) |
| HNF4A | Transcription factor Regulates several liver-specific genes (84) |
Protective against hepatic fibrosis (85) |
| CCL2 | Chemokine |
CCL2 has been implicated in cardiac fibrosis (86) |
| CASP1 | Caspase involved in apoptosis |
CASP1 has been implicated in hepatic fibrosis (87) |
| STAT1 | Transcription factor | Contradictory results: Overexpression inhibits pulmonary fibrosis Upregulation exacerbates pulmonary fibrosis (88, 89) |
| SOCS3 | Member of the suppressor of cytokine signalling family JAK/STAT pathway inhibitor (77) |
Downregulation of SOCS3 expression results in enhanced diabetic cardiac fibrosis (90) |
| HSP90B1 | Heat shock protein with vital role in protein folding and regulation (91) |
HSP90B1 has been found elevated in hepatic fibrosis (92) |
Similar to this study, co-expression gene analysis has been recently used to identify functional gene modules, to shed light on specific interactions and to unmask biological processes involved in pathophysiological mechanisms. It has been employed to identify complex mechanisms behind neurological and psychiatric disorders (93–95), immunological and cancer-related responses (96–99), metabolic disorders (100–102) and several biological processes, like fibrosis (103–105) and inflammation (106–108). Tissue-specific (109, 110) and single-cell (111, 112) co-expression studies have provided invaluable insights into the functional interactome of health and disease. The methodological approaches may vary, especially as to the utilization of different bioinformatics tools, but the core concept of co-expression networks, as means to better understand molecular interactions, is invariably valid. In addition, the concept of using networks and network metrics in studying biological processes is nowadays an established practice in biology, medicine, and pharmacology (113–116). Network centrality metrics, such as degree and closeness centralities revealing hub and bottleneck genes, have contributed to further understanding the importance of specific genes in IBD (117, 118) and other disorders (119, 120) and provide novel therapeutic targets (121–123).
Identification of hub genes widened the spectrum of potential therapeutic targets for stenosing CD. We can make informed assumptions and infer the involvement of specific cell types which do play an active role in tissue-specific co-expression networks (124). ATM is mainly found in endothelial and epithelial cells (125, 126), FGFR1 in fibroblasts and epithelial cells (57, 58), FBXW7 in hepatic stellate mesenchymal, mononuclear and pulmonary epithelial stem cells (60–62), ESR1 in myofibroblasts and epithelial cells (63, 64), CCND1 in renal glomerular mesangial and hepatic stellate cells (66, 127), HIF1A in renal epithelial cells and cardiac fibroblasts (68, 128), CEBPB in hematopoietic and renal epithelial cells (70, 71), NAMPT in hepatic stellate and renal glomerular mesangial cells (72, 129), IRF1 in renal epithelial cells (76), SOCS1 in hepatocytes and macrophages (78), SOCS3 in cardiac fibroblasts (90), ICAM1 in endothelial cells (79), ETS1 in hepatic stellate and renal epithelial cells (130, 131), IL7R in hepatic stellate cells (82), MMP1 in fibroblasts (83, 132), HNF4A in hepatocytes (85), CCL2 in fibroblasts (86, 133), CASP1 in hepatic endothelial cells (87) and STAT1 in macrophages (88, 89). HSP90B1, although it has been recently reported to be implicated in fibrosis (92), the specific cell type expressing it, still, remains undetermined.
Pathway databases can identify both broad biological processes and more specific pathways. Different databases provide similar pathway information but annotate them in a completely unique way based on their intended purpose. For this reason, tools like MetaScape (134) and Enrichr (135) provide scientists with a multitude of information from different databases so that they can decide which information better represents their data. As evident in our own analysis too, KEGG is more suitable for discovering common molecular backgrounds among diseases, while GO can provide lower-level information on the cellular mechanisms involved in each pathway. Reactome on the other hand appears to provide a more balanced approach offering several levels of detail which in a case-by-case scenario can either be more or less informative.
For example, in our results IL-13 has been associated with fibrosis in both the FIBSig and the M1 module, and indeed, it is already known to play a pivotal role in various fibrotic diseases, such as SSc, IPF and liver fibrosis (136–138). Another wide group includes pathways of IFN- α, β and γ signaling and regulation. IFN-α has anti-fibrotic effects by inhibiting TGF-β signaling (139). IFN -β and -γ have also been recognized as anti-fibrotic cytokines in various organs, such the liver, the lungs, and the kidneys (140–144). Various TGF-β signaling pathways also stood out in our study, including the transcriptional activity of SMAD2/SMAD3/SMAD4 heterodimer, the signaling by TGF-β receptor complex, the signaling by TGF-β family member and the RHO GTPase cycle pathways. TGF-β is one of the most well-known pro-fibrotic cytokines and its signal transduction may occur either through the canonical pathway that stratifies SMADs, or through non-canonical, such as the RHO GTPase pathway (145).
The TNF signaling pathway was also highlighted in both the FIBSig and the M1 module analyzed with the KEGG database. TNF-α is a well-known pro-inflammatory cytokine with a role in both inflammation and fibrosis, and many studies have shown that it promotes pulmonary and intestinal fibrosis, through different mechanisms, such as the activation of fibroblasts (146, 147). IL-17 signaling and differentiation of T cells to Th17 pathways were also highlighted in both the FIBSig and M1 module pathway analysis performed with the KEGG database. Again, both these pathways have been long known for their implication in inflammation and fibrosis. In an animal model of intestinal fibrosis, IL-17 was found elevated in serum and its neutralization resulted in the amelioration of fibrosis (148). Nonetheless, there is a controversy around IL-17 as, apart from its fibrogenic role, it also protects from inflammation (149).
We also highlighted pro-fibrotic pathways that had never before been associated with intestinal fibrosis. Specifically, growth hormone receptor signaling was enriched in the M1 fibrotic module. Growth hormones have been associated with liver and pulmonary fibrosis, with most studies concluding that it may have a protective role during fibrogenesis (150–153). CSF3 probably counteracts fibrosis, as high expression levels have been correlated with reduced ECM deposition in the liver, and its administration in bleomycin-affected mice resulted in the amelioration of pulmonary fibrosis (154, 155). Thus, the inactivation of CSF3 (G-CSF) signaling pathway, may suggest, for the first time, the involvement of this pathway in intestinal fibrosis. Additionally, pyroptosis, a form of programmed cellular death related to inflammation, can be triggered by infectious and non-infectious stimuli (156) and has been linked to fibrosis development in other organs (157–160), but for the first time we demonstrate its implication in intestinal fibrosis. The KEGG database also highlighted JAK-STAT signaling, well-known in inflammation, but with no established role in fibrosis yet. STAT3, a member of the same signaling pathway, has been shown to promote hepatic fibrosis (161), while STAT1 was found to counteract STAT3 and inhibit hepatic fibrosis (162). We also reported NOD-like receptor signaling and this is in line with previous studies on hepatic fibrosis showing that its inhibition improves both inflammation and fibrosis (163, 164). NODs in intestinal epithelial cells are intracellular sensors of pathogen-associated molecular patterns and, interestingly, we have shown that gut microbiota differ in stenotic CD (165).
As mentioned, this study capitalizes on previous knowledge from scattered public data and introduces a novel dataset of paired biopsies to identify how fibrosis can be dysregulated in a tissue-specific way during IBD. It also points to therapeutic targets of potential value. Limitations of this study include experimental biases introduced by working with public data obtained under variable conditions in different experimental settings. Further, co-expression analyses rely heavily on sample size, which provides higher statistical power, making it difficult to apply on hard-to-obtain clinical samples
In conclusion, this study, for the first time, highlights novel molecular insights into fibrosis across multiple disorders of different immune pathologies. Composing a new cohort of paired-tissue biopsy samples from the same patients has provided the necessary platform for studying fibrosis in tandem on the terminal ileum and the sigmoid. Enlisting current knowledge along with new data and leveraging state-of-the-art bioinformatics we attempt to go beyond previous works, which focus on known mechanisms of fibrosis (166), and identify new pathways associated with site-specific predisposition towards scarring during IBD. CD strictures in the ileum are far more frequent than in the colon (124). This study provides a molecular level explanation for this dominant phenotype as revealed in the M1 module’s GSEA analysis. Thus, we have shown how co-expression differences can help bring to the foreground localized variations of a ubiquitous phenomenon.
Data availability statement
The dataset generated by this study containing the RNA-seq data of paired-tissue biopsies can be found under SRA/ENA Project Accession PRJEB56386/ERP141320. The data can also be accessed here: https://www.ebi.ac.uk/ena/browser/view/PRJEB56386.
Ethics statement
The studies involving human participants were reviewed and approved by Research Ethics Committee University Hospital of Alexandroupolis, Greece (Protocol Number: Q9/D.S37/21.12.2018). The patients/participants provided their written informed consent to participate in this study.
Author contributions
Conceptualization, ND and EF. Methodology, ND, EF, VV, KA, ID, GB and GK. Validation, ND, EF, VV, VM and GK. Investigation, ND, EF, IK, GT, LK and MS. Resources, GK, GKOK, SV and GB. Writing—original draft preparation, ND, and EF. Writing—review and editing, VP, VM, VV and GK. Visualization, ND and EF. Supervision, GK. Funding acquisition, VP, VM and GK. All authors contributed to the article and approved the submitted version.
Funding
This study was supported by the project IMPReS (MIS 5047189), financially supported by the Program “Competitiveness, Entrepreneurship and Innovation” (NSRF 2014–2020), co-financed by Greece and the European Union (European Regional Development Fund), and by Tithon Biotech, Inc., a Delaware corporation. The funder had no involvement in the study design, analysis, interpretation of data, the writing of this article or the decision to submit it for publication.
Conflict of interest
Author VP was employed by company Tithon Biotech Inc.
The remaining authors declare that the research was conducted in the absence of any commercial or financial relationships that could be construed as a potential conflict of interest.
Publisher’s note
All claims expressed in this article are solely those of the authors and do not necessarily represent those of their affiliated organizations, or those of the publisher, the editors and the reviewers. Any product that may be evaluated in this article, or claim that may be made by its manufacturer, is not guaranteed or endorsed by the publisher.
Supplementary material
The Supplementary Material for this article can be found online at: https://www.frontiersin.org/articles/10.3389/fimmu.2022.1058237/full#supplementary-material
References
- 1. D’Alessio S, Ungaro F, Noviello D, Lovisa S, Peyrin-Biroulet L, Danese S. Revisiting fibrosis in inflammatory bowel disease: The gut thickens. Nat Rev Gastroenterol Hepatol (2022) 19(3):169–84. doi: 10.1038/s41575-021-00543-0 [DOI] [PubMed] [Google Scholar]
- 2. Santacroce G, Lenti MV, Di Sabatino A. Therapeutic targeting of intestinal fibrosis in crohn's disease. Cells (2022) 11(3):429. doi: 10.3390/cells11030429 [DOI] [PMC free article] [PubMed] [Google Scholar]
- 3. Xue M, Jackson CJ. Extracellular matrix reorganization during wound healing and its impact on abnormal scarring. Adv Wound Care (New Rochelle) (2015) 4(3):119–36. doi: 10.1089/wound.2013.0485 [DOI] [PMC free article] [PubMed] [Google Scholar]
- 4. Wang Y, Huang B, Jin T, Ocansey DKW, Jiang J, Mao F. Intestinal fibrosis in inflammatory bowel disease and the prospects of mesenchymal stem cell therapy. Front Immunol (2022) 13:835005. doi: 10.3389/fimmu.2022.835005 [DOI] [PMC free article] [PubMed] [Google Scholar]
- 5. He W, Dai C. Key fibrogenic signaling. Curr Pathobiol Rep (2015) 3(2):183–92. doi: 10.1007/s40139-015-0077-z [DOI] [PMC free article] [PubMed] [Google Scholar]
- 6. Confalonieri P, Volpe MC, Jacob J, Maiocchi S, Salton F, Ruaro B, et al. Regeneration or repair? the role of alveolar epithelial cells in the pathogenesis of idiopathic pulmonary fibrosis (IPF). Cells (2022) 11(13):2095. doi: 10.3390/cells11132095 [DOI] [PMC free article] [PubMed] [Google Scholar]
- 7. Li L, Fu H, Liu Y. The fibrogenic niche in kidney fibrosis: Components and mechanisms. Nat Rev Nephrol (2022) 18(9):545–57. doi: 10.1038/s41581-022-00590-z [DOI] [PubMed] [Google Scholar]
- 8. Melissaropoulos K, Iliopoulos G, Sakkas LI, Daoussis D. Pathogenetic aspects of systemic sclerosis: A view through the prism of b cells. Front Immunol (2022) 13:925741. doi: 10.3389/fimmu.2022.925741 [DOI] [PMC free article] [PubMed] [Google Scholar]
- 9. Yao L, Hu X, Dai K, Yuan M, Liu P, Zhang Q, et al. Mesenchymal stromal cells: promising treatment for liver cirrhosis. Stem Cell Res Ther (2022) 13(1):308. doi: 10.1186/s13287-022-03001-z [DOI] [PMC free article] [PubMed] [Google Scholar]
- 10. Louis E, Collard A, Oger AF, Degroote E, Aboul Nasr El Yafi FA, Belaiche J. Behaviour of crohn's disease according to the Vienna classification: changing pattern over the course of the disease. Gut (2001) 49(6):777–82. doi: 10.1136/gut.49.6.777 [DOI] [PMC free article] [PubMed] [Google Scholar]
- 11. Rieder F, Zimmermann EM, Remzi FH, Sandborn WJ. Crohn's disease complicated by strictures: A systematic review. Gut (2013) 62(7):1072–84. doi: 10.1136/gutjnl-2012-304353 [DOI] [PMC free article] [PubMed] [Google Scholar]
- 12. El Ouali S, Click B, Holubar SD, Rieder F. Natural history, diagnosis and treatment approach to fibrostenosing crohn's disease. United Eur Gastroenterol J (2020) 8(3):263–70. doi: 10.1177/2050640620901960 [DOI] [PMC free article] [PubMed] [Google Scholar]
- 13. Crespi M, Dulbecco P, De Ceglie A, Conio M. Strictures in crohn's disease: From pathophysiology to treatment. Digest Dis Sci (2020) 65(7):1904–16. doi: 10.1007/s10620-020-06227-0 [DOI] [PubMed] [Google Scholar]
- 14. de Bruyn JR, van den Brink GR, Steenkamer J, Buskens CJ, Bemelman WA, Meisner S, et al. Fibrostenotic phenotype of myofibroblasts in crohn's disease is dependent on tissue stiffness and reversed by LOX inhibition. J Crohn's colitis (2018) 12(7):849–59. doi: 10.1093/ecco-jcc/jjy036 [DOI] [PubMed] [Google Scholar]
- 15. Burke JP, Cunningham MF, Sweeney C, Docherty NG. O'Connell PR. n-cadherin is overexpressed in crohn's stricture fibroblasts and promotes intestinal fibroblast migration. Inflamm Bowel Dis (2011) 17(8):1665–73. [DOI] [PubMed] [Google Scholar]
- 16. Cunningham MF, Docherty NG, Burke JP, O'Connell PR. S100A4 expression is increased in stricture fibroblasts from patients with fibrostenosing crohn's disease and promotes intestinal fibroblast migration. Am J Physiol Gastrointest Liver Physiol (2010) 299(2):G457–66. doi: 10.1152/ajpgi.00351.2009 [DOI] [PubMed] [Google Scholar]
- 17. Haberman Y, Minar P, Karns R, Dexheimer PJ, Ghandikota S, Tegge S, et al. Mucosal inflammatory and wound healing gene programs reveal targets for stricturing behavior in pediatric crohn's disease. J Crohn's colitis (2020) 15(2):273–86. [DOI] [PMC free article] [PubMed] [Google Scholar]
- 18. Li C, Grider JR, Murthy KS, Bohl J, Rivet E, Wieghard N, et al. Endoplasmic reticulum stress in subepithelial myofibroblasts increases the TGF-β1 activity that regulates fibrosis in crohn's disease. Inflamm Bowel Dis (2020) 26(6):809–19. doi: 10.1093/ibd/izaa015 [DOI] [PMC free article] [PubMed] [Google Scholar]
- 19. Li Yim AYF, de Bruyn JR, Duijvis NW, Sharp C, Ferrero E, de Jonge WJ, et al. A distinct epigenetic profile distinguishes stenotic from non-inflamed fibroblasts in the ileal mucosa of crohn's disease patients. PloS One (2018) 13(12):e0209656. [DOI] [PMC free article] [PubMed] [Google Scholar]
- 20. Lippert E, Gunckel M, Brenmoehl J, Bataille F, Falk W, Scholmerich J, et al. Regulation of galectin-3 function in mucosal fibroblasts: Potential role in mucosal inflammation. Clin Exp Immunol (2008) 152(2):285–97. doi: 10.1111/j.1365-2249.2008.03618.x [DOI] [PMC free article] [PubMed] [Google Scholar]
- 21. Masterson JC, Capocelli KE, Hosford L, Biette K, McNamee EN, de Zoeten EF, et al. Eosinophils and IL-33 perpetuate chronic inflammation and fibrosis in a pediatric population with stricturing crohn's ileitis. Inflamm Bowel Dis (2015) 21(10):2429–40. [DOI] [PMC free article] [PubMed] [Google Scholar]
- 22. Vieujean S, Hu S, Bequet E, Salee C, Massot C, Bletard N, et al. Potential role of epithelial endoplasmic reticulum stress and anterior gradient protein 2 homologue in crohn's disease fibrosis. J Crohn's colitis (2021) 15(10):1737–50. doi: 10.1093/ecco-jcc/jjab061 [DOI] [PMC free article] [PubMed] [Google Scholar]
- 23. Barrett T, Wilhite SE, Ledoux P, Evangelista C, Kim IF, Tomashevsky M, et al. NCBI GEO: Archive for functional genomics data sets–update. Nucleic Acid Res (2012) 41(D1):D991–D5. doi: 10.1093/nar/gks1193 [DOI] [PMC free article] [PubMed] [Google Scholar]
- 24. Burczynski ME, Peterson RL, Twine NC, Zuberek KA, Brodeur BJ, Casciotti L, et al. Molecular classification of crohn's disease and ulcerative colitis patients using transcriptional profiles in peripheral blood mononuclear cells. the journal of molecular diagnostics. JMD (2006) 8(1):51–61. doi: 10.2353/jmoldx.2006.050079 [DOI] [PMC free article] [PubMed] [Google Scholar]
- 25. Wu F, Dassopoulos T, Cope L, Maitra A, Brant SR, Harris ML, et al. Genome-wide gene expression differences in crohn's disease and ulcerative colitis from endoscopic pinch biopsies: Insights into distinctive pathogenesis. Inflammation Bowel Dis (2007) 13(7):807–21. doi: 10.1002/ibd.20110 [DOI] [PubMed] [Google Scholar]
- 26. Carey R, Jurickova I, Ballard E, Bonkowski E, Han X, Xu H, et al. Activation of an IL-6:STAT3-dependent transcriptome in pediatric-onset inflammatory bowel disease. Inflammation Bowel Dis (2008) 14(4):446–57. doi: 10.1002/ibd.20342 [DOI] [PMC free article] [PubMed] [Google Scholar]
- 27. Arijs I, De Hertogh G, Lemaire K, Quintens R, Van Lommel L, Van Steen K, et al. Mucosal gene expression of antimicrobial peptides in inflammatory bowel disease before and after first infliximab treatment. PloS One (2009) 4(11):e7984. doi: 10.1371/journal.pone.0007984 [DOI] [PMC free article] [PubMed] [Google Scholar]
- 28. Noble CL, Abbas AR, Lees CW, Cornelius J, Toy K, Modrusan Z, et al. Characterization of intestinal gene expression profiles in crohn's disease by genome-wide microarray analysis. Inflamm Bowel Dis (2010) 16(10):1717–28. doi: 10.1002/ibd.21263 [DOI] [PubMed] [Google Scholar]
- 29. Vanhove W, Peeters PM, Staelens D, Schraenen A, van der Goten J, Cleynen I, et al. Strong upregulation of AIM2 and IFI16 inflammasomes in the mucosa of patients with active inflammatory bowel disease. Inflammation Bowel Dis (2015) 21(11):2673–82. doi: 10.1097/MIB.0000000000000535 [DOI] [PubMed] [Google Scholar]
- 30. Vancamelbeke M, Vanuytsel T, Farré R, Verstockt S, Ferrante M, Van Assche G, et al. Genetic and transcriptomic bases of intestinal epithelial barrier dysfunction in inflammatory bowel disease. Inflammation Bowel Dis (2017) 23(10):1718–29. doi: 10.1097/MIB.0000000000001246 [DOI] [PMC free article] [PubMed] [Google Scholar]
- 31. Planell N, Masamunt MC, Leal RF, Rodríguez L, Esteller M, Lozano JJ, et al. Usefulness of transcriptional blood biomarkers as a non-invasive surrogate marker of mucosal healing and endoscopic response in ulcerative colitis. J Crohns Colitis (2017) 11(11):1335–46. doi: 10.1093/ecco-jcc/jjx091 [DOI] [PMC free article] [PubMed] [Google Scholar]
- 32. Tang MS, Bowcutt R, Leung JM, Wolff MJ, Gundra UM, Hudesman D, et al. Integrated analysis of biopsies from inflammatory bowel disease patients identifies SAA1 as a link between mucosal microbes with TH17 and TH22 cells. Inflamm Bowel Dis (2017) 23(9):1544–54. doi: 10.1097/MIB.0000000000001208 [DOI] [PMC free article] [PubMed] [Google Scholar]
- 33. Molyneaux PL, Willis-Owen SAG, Cox MJ, James P, Cowman S, Loebinger M, et al. Host-microbial interactions in idiopathic pulmonary fibrosis. Am J Respir Crit Care Med (2017) 195(12):1640–50. doi: 10.1164/rccm.201607-1408OC [DOI] [PMC free article] [PubMed] [Google Scholar]
- 34. Cecchini MJ, Hosein K, Howlett CJ, Joseph M, Mura M. Comprehensive gene expression profiling identifies distinct and overlapping transcriptional profiles in non-specific interstitial pneumonia and idiopathic pulmonary fibrosis. Respir Res (2018) 19(1):153. doi: 10.1186/s12931-018-0857-1 [DOI] [PMC free article] [PubMed] [Google Scholar]
- 35. Nakagawa S, Nishihara K, Miyata H, Shinke H, Tomita E, Kajiwara M, et al. Molecular markers of tubulointerstitial fibrosis and tubular cell damage in patients with chronic kidney disease. PloS One (2015) 10(8):e0136994. doi: 10.1371/journal.pone.0136994 [DOI] [PMC free article] [PubMed] [Google Scholar]
- 36. Yildiz G, Arslan-Ergul A, Bagislar S, Konu O, Yuzugullu H, Gursoy-Yuzugullu O, et al. Genome-wide transcriptional reorganization associated with senescence-to-immortality switch during human hepatocellular carcinogenesis. PloS One (2013) 8(5):e64016. doi: 10.1371/journal.pone.0064016 [DOI] [PMC free article] [PubMed] [Google Scholar]
- 37. Taroni JN, Greene CS, Martyanov V, Wood TA, Christmann RB, Farber HW, et al. A novel multi-network approach reveals tissue-specific cellular modulators of fibrosis in systemic sclerosis. Genome Med (2017) 9(1):27. doi: 10.1186/s13073-017-0417-1 [DOI] [PMC free article] [PubMed] [Google Scholar]
- 38. Smyth GK. Limma: linear models for microarray data. bioinformatics and computational biology solutions using r and bioconductor. Springer; (2005) p:397–420. doi: 10.1007/0-387-29362-0_23 [DOI] [Google Scholar]
- 39. Wang M, Zhao Y, Zhang B. Efficient test and visualization of multi-set intersections. Sci Rep (2015) 5:16923. doi: 10.1038/srep16923 [DOI] [PMC free article] [PubMed] [Google Scholar]
- 40. Xia J, Gill EE, Hancock RE. NetworkAnalyst for statistical, visual and network-based meta-analysis of gene expression data. Nat Protoc (2015) 10(6):823. doi: 10.1038/nprot.2015.052 [DOI] [PubMed] [Google Scholar]
- 41. Arif M, Zhang C, Li X, Güngör C, Çakmak B, Arslantürk M, et al. iNetModels 2.0: An interactive visualization and database of multi-omics data. Nucleic Acids Res (2021) 49(W1):W271–W276, 662502. doi: 10.1093/nar/gkab254 [DOI] [PMC free article] [PubMed] [Google Scholar]
- 42. van Dam S, Võsa U, van der Graaf A, Franke L, de Magalhães JP. Gene co-expression analysis for functional classification and gene-disease predictions. Brief Bioinform (2018) 19(4):575–92. [DOI] [PMC free article] [PubMed] [Google Scholar]
- 43. Wu T, Hu E, Xu S, Chen M, Guo P, Dai Z, et al. clusterProfiler 4.0: A universal enrichment tool for interpreting omics data. Innovation (Cambridge (Mass)) (2021) 2(3):100141. [DOI] [PMC free article] [PubMed] [Google Scholar]
- 44. Joshi-Tope G, Gillespie M, Vastrik I, D'Eustachio P, Schmidt E, de Bono B, et al. Reactome: a knowledgebase of biological pathways. Nucleic Acid Res (2005) 33(suppl_1):D428–D32. [DOI] [PMC free article] [PubMed] [Google Scholar]
- 45. Ashburner M, Ball CA, Blake JA, Botstein D, Butler H, Cherry JM, et al. Gene ontology: tool for the unification of biology. Nat Genet (2000) 25(1):25–9. doi: 10.1038/75556 [DOI] [PMC free article] [PubMed] [Google Scholar]
- 46. Kanehisa M, Goto S. KEGG: Kyoto encyclopedia of genes and genomes. Nucleic Acid Res (2000) 28(1):27–30. doi: 10.1093/nar/28.1.27 [DOI] [PMC free article] [PubMed] [Google Scholar]
- 47. Chowdhury S, Sarkar RR. Comparison of human cell signaling pathway databases–evolution, drawbacks and challenges. Database (2015) 2015. doi: 10.1093/database/bau126 [DOI] [PMC free article] [PubMed] [Google Scholar]
- 48. Mubeen S, Hoyt CT, Gemünd A, Hofmann-Apitius M, Fröhlich H, Domingo-Fernández D. The impact of pathway database choice on statistical enrichment analysis and predictive modeling. Front Genet (2019) 10:1203. doi: 10.3389/fgene.2019.01203 [DOI] [PMC free article] [PubMed] [Google Scholar]
- 49. Patro R, Duggal G, Love MI, Irizarry RA, Kingsford C. Salmon provides fast and bias-aware quantification of transcript expression. Nat Methods (2017) 14(4):417. doi: 10.1038/nmeth.4197 [DOI] [PMC free article] [PubMed] [Google Scholar]
- 50. Soneson C, Love MI, Robinson MD. Differential analyses for RNA-seq: transcript-level estimates improve gene-level inferences. F1000Res (2015) 4:1521. doi: 10.12688/f1000research.7563.1 [DOI] [PMC free article] [PubMed] [Google Scholar]
- 51. Love MI, Huber W, Anders S. Moderated estimation of fold change and dispersion for RNA-seq data with DESeq2. Genome Biol (2014) 15(12):550. doi: 10.1186/s13059-014-0550-8 [DOI] [PMC free article] [PubMed] [Google Scholar]
- 52. Russo PST, Ferreira GR, Cardozo LE, Bürger MC, Arias-Carrasco R, Maruyama SR, et al. CEMiTool: A bioconductor package for performing comprehensive modular co-expression analyses. BMC Bioinf (2018) 19(1):56. doi: 10.1186/s12859-018-2053-1 [DOI] [PMC free article] [PubMed] [Google Scholar]
- 53. Szklarczyk D, Morris JH, Cook H, Kuhn M, Wyder S, Simonovic M, et al. The STRING database in 2017: quality-controlled protein–protein association networks, made broadly accessible. Nucleic Acid Res (2017) 45(D1):D362–D8. doi: 10.1093/nar/gkw937 [DOI] [PMC free article] [PubMed] [Google Scholar]
- 54. Guo Z, Kozlov S, Lavin MF, Person MD, Paull TT. ATM Activation by oxidative stress. Science (2010) 330(6003):517–21. doi: 10.1126/science.1192912 [DOI] [PubMed] [Google Scholar]
- 55. Chiang MH, Liang CJ, Lin LC, Yang YF, Huang CC, Chen YH, et al. miR-26a attenuates cardiac apoptosis and fibrosis by targeting ataxia-telangiectasia mutated in myocardial infarction. J Cell Physiol (2020) 235(9):6085–102. doi: 10.1002/jcp.29537 [DOI] [PubMed] [Google Scholar]
- 56. Lu M, Wang K, Ji W, Yu Y, Li Z, Xia W, et al. FGFR1 promotes tumor immune evasion via YAP-mediated PD-L1 expression upregulation in lung squamous cell carcinoma. Cell Immunol (2022) 379:104577. doi: 10.1016/j.cellimm.2022.104577 [DOI] [PubMed] [Google Scholar]
- 57. Chen B, Li C, Chang G, Wang H. Dihydroartemisinin targets fibroblast growth factor receptor 1 (FGFR1) to inhibit interleukin 17A (IL-17A)-induced hyperproliferation and inflammation of keratinocytes. Bioengineered (2022) 13(1):1530–40. doi: 10.1080/21655979.2021.2021701 [DOI] [PMC free article] [PubMed] [Google Scholar] [Retracted]
- 58. Wu Q, Han L, Gui W, Wang F, Yan W, Jiang H. MiR-503 suppresses fibroblast activation and myofibroblast differentiation by targeting VEGFA and FGFR1 in silica-induced pulmonary fibrosis. J Cell Mol Med (2020) 24(24):14339–48. doi: 10.1111/jcmm.16051 [DOI] [PMC free article] [PubMed] [Google Scholar]
- 59. Fan J, Bellon M, Ju M, Zhao L, Wei M, Fu L, et al. Clinical significance of FBXW7 loss of function in human cancers. Mol Cancer (2022) 21(1):87. doi: 10.1186/s12943-022-01548-2 [DOI] [PMC free article] [PubMed] [Google Scholar]
- 60. Chen X, Li HD, Bu FT, Li XF, Chen Y, Zhu S, et al. Circular RNA circFBXW4 suppresses hepatic fibrosis via targeting the miR-18b-3p/FBXW7 axis. Theranostics (2020) 10(11):4851–70. doi: 10.7150/thno.42423 [DOI] [PMC free article] [PubMed] [Google Scholar]
- 61. He J, Du Y, Li G, Xiao P, Sun X, Song W, et al. Myeloid Fbxw7 prevents pulmonary fibrosis by suppressing TGF-β production. Front Immunol (2021) 12:760138. doi: 10.3389/fimmu.2021.760138 [DOI] [PMC free article] [PubMed] [Google Scholar]
- 62. Wang L, Chen R, Li G, Wang Z, Liu J, Liang Y, et al. FBW7 mediates senescence and pulmonary fibrosis through telomere uncapping. Cell Metab (2020) 32(5):860–77.e9. doi: 10.1016/j.cmet.2020.10.004 [DOI] [PubMed] [Google Scholar]
- 63. Elliot S, Periera-Simon S, Xia X, Catanuto P, Rubio G, Shahzeidi S, et al. MicroRNA let-7 downregulates ligand-independent estrogen receptor-mediated Male-predominant pulmonary fibrosis. Am J Respir Crit Care Med (2019) 200(10):1246–57. doi: 10.1164/rccm.201903-0508OC [DOI] [PMC free article] [PubMed] [Google Scholar]
- 64. Smith LC, Moreno S, Robertson L, Robinson S, Gant K, Bryant AJ, et al. Transforming growth factor beta1 targets estrogen receptor signaling in bronchial epithelial cells. Respir Res (2018) 19(1):160. doi: 10.1186/s12931-018-0861-5 [DOI] [PMC free article] [PubMed] [Google Scholar]
- 65. Malumbres M, Barbacid M. To cycle or not to cycle: a critical decision in cancer. Nat Rev Cancer (2001) 1(3):222–31. doi: 10.1038/35106065 [DOI] [PubMed] [Google Scholar]
- 66. Ma H, Li X, Yu S, Hu Y, Yin M, Zhu F, et al. Deletion of the miR-25/93/106b cluster induces glomerular deposition of immune complexes and renal fibrosis in mice. J Cell Mol Med (2021) 25(16):7922–34. doi: 10.1111/jcmm.16721 [DOI] [PMC free article] [PubMed] [Google Scholar]
- 67. Choudhry H, Harris AL. Advances in hypoxia-inducible factor biology. Cell Metab (2018) 27(2):281–98. doi: 10.1016/j.cmet.2017.10.005 [DOI] [PubMed] [Google Scholar]
- 68. Liu D, Sun H, Li K, Zhao Z, Liu Z, Zhang G, et al. HIF-1α mediates renal fibrosis by regulating metabolic remodeling of renal tubule epithelial cells. Biochem Biophys Res Commun (2022) 618:15–23. doi: 10.1016/j.bbrc.2022.06.008 [DOI] [PubMed] [Google Scholar]
- 69. Zahnow CA. CCAAT/enhancer-binding protein beta: its role in breast cancer and associations with receptor tyrosine kinases. Expert Rev Mol Med (2009) 11:e12. [DOI] [PMC free article] [PubMed] [Google Scholar]
- 70. Satoh T, Nakagawa K, Sugihara F, Kuwahara R, Ashihara M, Yamane F, et al. Identification of an atypical monocyte and committed progenitor involved in fibrosis. Nature (2017) 541(7635):96–101. doi: 10.1038/nature20611 [DOI] [PubMed] [Google Scholar]
- 71. Yan X, Peng R, Ni Y, Chen L, He Q, Li Q, et al. Tetratricopeptide repeat domain 36 deficiency mitigates renal tubular injury by inhibiting TGF-β1-induced epithelial-mesenchymal transition in a mouse model of chronic kidney disease. Genes Dis (2022) 9(6):1716–26. doi: 10.1016/j.gendis.2021.04.005 [DOI] [PMC free article] [PubMed] [Google Scholar]
- 72. Xu L, Yang C, Ma J, Zhang X, Wang Q, Xiong X. NAMPT-mediated NAD(+) biosynthesis suppresses activation of hepatic stellate cells and protects against CCl(4)-induced liver fibrosis in mice. Hum Exp Toxicol (2021) 40(12_suppl):S666–s75. [DOI] [PubMed] [Google Scholar]
- 73. Garcia AN, Casanova NG, Kempf CL, Bermudez T, Valera DG, Song JH, et al. eNAMPT is a novel damage-associated molecular pattern protein that contributes to the severity of radiation-induced lung fibrosis. Am J Respir Cell Mol Biol (2022) 66(5):497–509. doi: 10.1165/rcmb.2021-0357OC [DOI] [PMC free article] [PubMed] [Google Scholar]
- 74. Soda K, Tanizawa K. Kynureninases: enzymological properties and regulation mechanism. Adv Enzymol Relat Areas Mol Biol (1979) 49:1–40. doi: 10.1002/9780470122945.ch1 [DOI] [PubMed] [Google Scholar]
- 75. Kröger A, Köster M, Schroeder K, Hauser H, Mueller PP. Review: Activities of IRF-1. J Interferon Cytokine Res (2002) 22(1):5–14. doi: 10.1089/107999002753452610 [DOI] [PubMed] [Google Scholar]
- 76. Li Y, Liu Y, Huang Y, Yang K, Xiao T, Xiong J, et al. IRF-1 promotes renal fibrosis by downregulation of klotho. FASEB J (2020) 34(3):4415–29. doi: 10.1096/fj.201902446R [DOI] [PubMed] [Google Scholar]
- 77. Yoshimura A, Ito M, Chikuma S, Akanuma T, Nakatsukasa H. Negative regulation of cytokine signaling in immunity. Cold Spring Harb Perspect Biol (2018) 10(7):a028571. doi: 10.1101/cshperspect.a028571 [DOI] [PMC free article] [PubMed] [Google Scholar]
- 78. Mafanda EK, Kandhi R, Bobbala D, Khan MGM, Nandi M, Menendez A, et al. Essential role of suppressor of cytokine signaling 1 (SOCS1) in hepatocytes and macrophages in the regulation of liver fibrosis. Cytokine (2019) 124:154501. doi: 10.1016/j.cyto.2018.07.032 [DOI] [PubMed] [Google Scholar]
- 79. Lin QY, Lang PP, Zhang YL, Yang XL, Xia YL, Bai J, et al. Pharmacological blockage of ICAM-1 improves angiotensin II-induced cardiac remodeling by inhibiting adhesion of LFA-1(+) monocytes. Am J Physiol Heart Circ Physiol (2019) 317(6):H1301–h11. doi: 10.1152/ajpheart.00566.2019 [DOI] [PubMed] [Google Scholar]
- 80. Russell L, Garrett-Sinha LA. Transcription factor ets-1 in cytokine and chemokine gene regulation. Cytokine (2010) 51(3):217–26. doi: 10.1016/j.cyto.2010.03.006 [DOI] [PubMed] [Google Scholar]
- 81. Wang WK, Wang B, Cao XH, Liu YS. Spironolactone alleviates myocardial fibrosis via inhibition of ets-1 in mice with experimental autoimmune myocarditis. Exp Ther Med (2022) 23(6):369. doi: 10.3892/etm.2022.11296 [DOI] [PMC free article] [PubMed] [Google Scholar]
- 82. Li B, Li Y, Li S, Li H, Liu L, Yu H. Circ_MTM1 knockdown inhibits the progression of HBV-related liver fibrosis via regulating IL7R expression through targeting miR-122-5p. Am J Transl Res (2022) 14(4):2199–211. [PMC free article] [PubMed] [Google Scholar]
- 83. Peng Z, Konai MM, Avila-Cobian LF, Wang M, Mobashery S, Chang M. MMP-1 and ADAM10 as targets for therapeutic intervention in idiopathic pulmonary fibrosis. ACS Pharmacol Transl Sci (2022) 5(8):548–54. doi: 10.1021/acsptsci.2c00050 [DOI] [PMC free article] [PubMed] [Google Scholar]
- 84. Pan X, Zhang Y. Hepatocyte nuclear factor 4α in the pathogenesis of non-alcoholic fatty liver disease. Chin Med J (Engl) (2022) 135(10):1172–81. doi: 10.1097/CM9.0000000000002092 [DOI] [PMC free article] [PubMed] [Google Scholar]
- 85. Yang T, Poenisch M, Khanal R, Hu Q, Dai Z, Li R, et al. Therapeutic HNF4A mRNA attenuates liver fibrosis in a preclinical model. J Hepatol (2021) 75(6):1420–33. doi: 10.1016/j.jhep.2021.08.011 [DOI] [PubMed] [Google Scholar]
- 86. Luo Y, Zhang H, Yu J, Wei L, Li M, Xu W. Stem cell factor/mast cell/CCL2/monocyte/macrophage axis promotes coxsackievirus B3 myocarditis and cardiac fibrosis by increasing Ly6C(high) monocyte influx and fibrogenic mediators production. Immunology (2022) 167(4):590–605. doi: 10.1111/imm.13556 [DOI] [PubMed] [Google Scholar]
- 87. Dixon LJ, Berk M, Thapaliya S, Papouchado BG, Feldstein AE. Caspase-1-mediated regulation of fibrogenesis in diet-induced steatohepatitis. Lab Invest (2012) 92(5):713–23. doi: 10.1038/labinvest.2012.45 [DOI] [PMC free article] [PubMed] [Google Scholar]
- 88. Qian Q, Ma Q, Wang B, Qian Q, Zhao C, Feng F, et al. Downregulated miR-129-5p expression inhibits rat pulmonary fibrosis by upregulating STAT1 gene expression in macrophages. Int Immunopharmacol (2022) 109:108880. doi: 10.1016/j.intimp.2022.108880 [DOI] [PubMed] [Google Scholar]
- 89. Layoun H, Hajal J, Saliba Y, Smayra V, Habr B, Fares N. Pirfenidone mitigates TGF-β1-mediated fibrosis in an idiopathic inflammatory myositis-associated interstitial lung disease model. Cytokine (2022) 154:155899. doi: 10.1016/j.cyto.2022.155899 [DOI] [PubMed] [Google Scholar]
- 90. Tao H, Shi P, Zhao XD, Xuan HY, Gong WH, Ding XS. DNMT1 deregulation of SOCS3 axis drives cardiac fibroblast activation in diabetic cardiac fibrosis. J Cell Physiol (2021) 236(5):3481–94. doi: 10.1002/jcp.30078 [DOI] [PubMed] [Google Scholar]
- 91. Zuehlke A, Johnson JL. Hsp90 and co-chaperones twist the functions of diverse client proteins. Biopolymers (2010) 93(3):211–7. doi: 10.1002/bip.21292 [DOI] [PMC free article] [PubMed] [Google Scholar]
- 92. Husain H, Waseem M, Ahmad R. Proteomic and molecular evidences of Il1rl2, Ric8a, Krt18 and Hsp90b1 modulation during experimental hepatic fibrosis and pomegranate supplementation. Int J Biol Macromol (2021) 185:696–707. doi: 10.1016/j.ijbiomac.2021.06.091 [DOI] [PubMed] [Google Scholar]
- 93. Gaiteri C, Ding Y, French B, Tseng GC, Sibille E. Beyond modules and hubs: the potential of gene coexpression networks for investigating molecular mechanisms of complex brain disorders. Genes Bbrain Behavior (2014) 13(1):13–24. doi: 10.1111/gbb.12106 [DOI] [PMC free article] [PubMed] [Google Scholar]
- 94. Gerring ZF, Gamazon ER, Derks EM. A gene co-expression network-based analysis of multiple brain tissues reveals novel genes and molecular pathways underlying major depression. PloS Genet (2019) 15(7):e1008245. doi: 10.1371/journal.pgen.1008245 [DOI] [PMC free article] [PubMed] [Google Scholar]
- 95. Chen C, Meng Q. The transcription factor POU3F2 regulates a gene coexpression network in brain tissue from patients with psychiatric disorders. Sci Transl Med (2018) 10(472):eaat8178. doi: 10.1126/scitranslmed.aat8178 [DOI] [PMC free article] [PubMed] [Google Scholar]
- 96. Kong Y, Feng ZC, Zhang YL, Liu XF, Ma Y, Zhao ZM, et al. Identification of immune-related genes contributing to the development of glioblastoma using weighted gene Co-expression network analysis. Front Immunol (2020) 11:1281. doi: 10.3389/fimmu.2020.01281 [DOI] [PMC free article] [PubMed] [Google Scholar]
- 97. Niemira M, Collin F, Szalkowska A, Bielska A, Chwialkowska K, Reszec J, et al. Molecular signature of subtypes of non-Small-Cell lung cancer by Large-scale transcriptional profiling: Identification of key modules and genes by weighted gene Co-expression network analysis (WGCNA). Cancers (2019) 12(1):37. doi: 10.3390/cancers12010037 [DOI] [PMC free article] [PubMed] [Google Scholar]
- 98. Zhang Y, Ma W, Fan W, Ren C, Xu J, Zeng F, et al. Comprehensive transcriptomic characterization reveals core genes and module associated with immunological changes via 1619 samples of brain glioma. Cell Death Dis (2021) 12(12):1140. doi: 10.1038/s41419-021-04427-8 [DOI] [PMC free article] [PubMed] [Google Scholar]
- 99. Sudhakar P, Verstockt B, Cremer J, Verstockt S, Sabino J, Ferrante M, et al. Understanding the molecular drivers of disease heterogeneity in crohn's disease using multi-omic data integration and network analysis. Inflamm Bowel Dis (2021) 27(6):870–86. doi: 10.1093/ibd/izaa281 [DOI] [PMC free article] [PubMed] [Google Scholar]
- 100. Galán-Vásquez E, Perez-Rueda E. Identification of modules with similar gene regulation and metabolic functions based on Co-expression data. Front Mol Biosci (2019) 6:139. doi: 10.3389/fmolb.2019.00139 [DOI] [PMC free article] [PubMed] [Google Scholar]
- 101. Li H, Wang X, Lu X, Zhu H, Li S, Duan S, et al. Co-Expression network analysis identified hub genes critical to triglyceride and free fatty acid metabolism as key regulators of age-related vascular dysfunction in mice. Aging (Albany NY). (2019) 11(18):7620–38. doi: 10.18632/aging.102275 [DOI] [PMC free article] [PubMed] [Google Scholar]
- 102. Shang J, Wang S, Jiang Y, Duan Y, Cheng G, Liu D, et al. Identification of key lncRNAs contributing to diabetic nephropathy by gene co-expression network analysis. Sci Rep (2019) 9(1):3328. doi: 10.1038/s41598-019-39298-9 [DOI] [PMC free article] [PubMed] [Google Scholar]
- 103. Wang M, Gong Q, Zhang J, Chen L, Zhang Z, Lu L, et al. Characterization of gene expression profiles in HBV-related liver fibrosis patients and identification of ITGBL1 as a key regulator of fibrogenesis. Sci Rep (2017) 7:43446. doi: 10.1038/srep43446 [DOI] [PMC free article] [PubMed] [Google Scholar]
- 104. Modena BD, Kurian SM, Gaber LW, Waalen J, Su AI, Gelbart T, et al. Gene expression in biopsies of acute rejection and interstitial Fibrosis/Tubular atrophy reveals highly shared mechanisms that correlate with worse long-term outcomes. Am J Transplant (2016) 16(7):1982–98. doi: 10.1111/ajt.13728 [DOI] [PMC free article] [PubMed] [Google Scholar]
- 105. Wan H, Huang X, Cong P, He M, Chen A, Wu T, et al. Identification of hub genes and pathways associated with idiopathic pulmonary fibrosis via bioinformatics analysis. Front Mol Biosci (2021) 8:711239. doi: 10.3389/fmolb.2021.711239 [DOI] [PMC free article] [PubMed] [Google Scholar]
- 106. Fatima A, Connaughton RM, Weiser A, Murphy AM, O'Grada C, Ryan M, et al. Weighted gene Co-expression network analysis identifies gender specific modules and hub genes related to metabolism and inflammation in response to an acute lipid challenge. Mol Nutr Food Res (2018) 62(2). doi: 10.1002/mnfr.201700388 [DOI] [PubMed] [Google Scholar]
- 107. Durocher M, Ander BP, Jickling G, Hamade F, Hull H, Knepp B, et al. Inflammatory, regulatory, and autophagy co-expression modules and hub genes underlie the peripheral immune response to human intracerebral hemorrhage. J Neuroinflammation (2019) 16(1):56. doi: 10.1186/s12974-019-1433-4 [DOI] [PMC free article] [PubMed] [Google Scholar]
- 108. Broadbent J, Sampson D, Sabapathy S. Gene networks in skeletal muscle following endurance exercise are coexpressed in blood neutrophils and linked with blood inflammation markers. Appl Physiol (2017) 122(4):752–66. doi: 10.1152/japplphysiol.00114.2016 [DOI] [PubMed] [Google Scholar]
- 109. Saha A, Kim Y, Gewirtz ADH, Jo B, Gao C, McDowell IC, et al. Co-Expression networks reveal the tissue-specific regulation of transcription and splicing. Genome Res (2017) 27(11):1843–58. doi: 10.1101/gr.216721.116 [DOI] [PMC free article] [PubMed] [Google Scholar]
- 110. Voigt A, Nowick K, Almaas E. A composite network of conserved and tissue specific gene interactions reveals possible genetic interactions in glioma. PLoS Comput Biol (2017) 13(9):. doi: 10.1371/journal.pcbi.1005739 [DOI] [PMC free article] [PubMed] [Google Scholar]
- 111. Chen X, Hu L, Wang Y, Sun W, Yang C. Single cell gene Co-expression network reveals FECH/CROT signature as a prognostic marker. Cells (2019) 8(7):698. doi: 10.3390/cells8070698 [DOI] [PMC free article] [PubMed] [Google Scholar]
- 112. Zhang H, Kang Z, Gong H, Xu D, Wang J, Li Z, et al. Digestive system is a potential route of COVID-19: An analysis of single-cell coexpression pattern of key proteins in viral entry process. Gut (2020) 69(6):1010–8. doi: 10.1136/gutjnl-2020-320953 [DOI] [Google Scholar]
- 113. Santolini M, Barabási AL. Predicting perturbation patterns from the topology of biological networks. Proc Natl Acad Sci U S A (2018) 115(27):E6375–e83. doi: 10.1073/pnas.1720589115 [DOI] [PMC free article] [PubMed] [Google Scholar]
- 114. Sonawane AR, Weiss ST, Glass K, Sharma A. Network medicine in the age of biomedical big data. Front Genet (2019) 10:294. doi: 10.3389/fgene.2019.00294 [DOI] [PMC free article] [PubMed] [Google Scholar]
- 115. Ivanov PC, Liu KKL, Bartsch RP. Focus on the emerging new fields of network physiology and network medicine. New J Phys (2016) 18. doi: 10.1088/1367-2630/18/10/100201 [DOI] [PMC free article] [PubMed] [Google Scholar]
- 116. Muhammad J, Khan A, Ali A, Fang L, Yanjing W, Xu Q, et al. Network pharmacology: Exploring the resources and methodologies. Curr Top Med Chem (2018) 18(12):949–64. doi: 10.2174/1568026618666180330141351 [DOI] [PubMed] [Google Scholar]
- 117. Gazouli M, Dovrolis N, Franke A, Spyrou GM, Sechi LA, Kolios G. Differential genetic and functional background in inflammatory bowel disease phenotypes of a Greek population: A systems bioinformatics approach. GUT Pathog (2019) 11:31. doi: 10.1186/s13099-019-0312-y [DOI] [PMC free article] [PubMed] [Google Scholar]
- 118. Hassouneh SA, Loftus M, Yooseph S. Linking inflammatory bowel disease symptoms to changes in the gut microbiome structure and function. Front Microbiol (2021) 12:673632. doi: 10.3389/fmicb.2021.673632 [DOI] [PMC free article] [PubMed] [Google Scholar]
- 119. Sadria M, Karimi S, Layton AT. Network centrality analysis of eye-gaze data in autism spectrum disorder. Comput Biol Med (2019) 111:103332. doi: 10.1016/j.compbiomed.2019.103332 [DOI] [PubMed] [Google Scholar]
- 120. Mosca E, Bersanelli M, Matteuzzi T, Di Nanni N, Castellani G, Milanesi L, et al. Characterization and comparison of gene-centered human interactomes. Brief Bioinform (2021) 22(6):bbab153. doi: 10.1093/bib/bbab153 [DOI] [PMC free article] [PubMed] [Google Scholar]
- 121. Xiao Y, Zhang B, Cloyd JM, Alaimo L. Novel drug candidate prediction for intrahepatic cholangiocarcinoma via hub gene network analysis and connectivity mapping. Cancers (2022) 14(13):3284. doi: 10.3390/cancers14133284 [DOI] [PMC free article] [PubMed] [Google Scholar]
- 122. Prasad K, Khatoon F, Rashid S, Ali N, AlAsmari AF, Ahmed MZ, et al. Targeting hub genes and pathways of innate immune response in COVID-19: A network biology perspective. Int J Biol macromol (2020) 163:1–8. doi: 10.1016/j.ijbiomac.2020.06.228 [DOI] [PMC free article] [PubMed] [Google Scholar]
- 123. Wang W, Pan F, Lin X, Yuan J, Tao C, Wang R. Ferroptosis-related hub genes in hepatocellular carcinoma: Prognostic signature, immune-related, and drug resistance analysis. Front Genet (2022) 13:907331. doi: 10.3389/fgene.2022.907331 [DOI] [PMC free article] [PubMed] [Google Scholar]
- 124. Rieder F. Managing intestinal fibrosis in patients with inflammatory bowel disease. Gastroenterol hepatol (2018) 14(2):120–2. [PMC free article] [PubMed] [Google Scholar]
- 125. Bouten RM, Dalgard CL, Soltis AR, Slaven JE, Day RM. Transcriptomic profiling and pathway analysis of cultured human lung microvascular endothelial cells following ionizing radiation exposure. Sci Rep (2021) 11(1):24214. doi: 10.1038/s41598-021-03636-7 [DOI] [PMC free article] [PubMed] [Google Scholar]
- 126. Overstreet JM, Samarakoon R, Cardona-Grau D, Goldschmeding R, Higgins PJ. Tumor suppressor ataxia telangiectasia mutated functions downstream of TGF-β1 in orchestrating profibrotic responses. FASEB J (2015) 29(4):1258–68. doi: 10.1096/fj.14-262527 [DOI] [PMC free article] [PubMed] [Google Scholar]
- 127. Zheng D, Jiang Y, Qu C, Yuan H, Hu K, He L, et al. Pyruvate kinase M2 tetramerization protects against hepatic stellate cell activation and liver fibrosis. Am J Pathol (2020) 190(11):2267–81. doi: 10.1016/j.ajpath.2020.08.002 [DOI] [PMC free article] [PubMed] [Google Scholar]
- 128. Janbandhu V, Tallapragada V, Patrick R, Li Y, Abeygunawardena D, Humphreys DT, et al. Hif-1a suppresses ROS-induced proliferation of cardiac fibroblasts following myocardial infarction. Cell Stem Cell (2022) 29(2):281–97.e12. doi: 10.1016/j.stem.2021.10.009 [DOI] [PMC free article] [PubMed] [Google Scholar]
- 129. Chen Y, Liang Y, Hu T, Wei R, Cai C, Wang P, et al. Endogenous nampt upregulation is associated with diabetic nephropathy inflammatory-fibrosis through the NF-κB p65 and Sirt1 pathway; NMN alleviates diabetic nephropathy inflammatory-fibrosis by inhibiting endogenous nampt. Exp Ther Med (2017) 14(5):4181–93. [DOI] [PMC free article] [PubMed] [Google Scholar]
- 130. Li J, Zhang J, Zhang B, Chen L, Chen G, Zhu D, et al. rSjP40 inhibited the activity of collagen type I promoter via ets-1 in HSCs. Front Cell Dev Biol (2021) 9:765616. doi: 10.3389/fcell.2021.765616 [DOI] [PMC free article] [PubMed] [Google Scholar]
- 131. Yin X, Ma F, Fan X, Zhao Q, Liu X, Yang Y. Knockdown of AMPKα2 impairs epithelial−mesenchymal transition in rat renal tubular epithelial cells by downregulating ETS1 and RPS6KA1. Mol Med Rep (2020) 22(6):4619–28. doi: 10.3892/mmr.2020.11556 [DOI] [PMC free article] [PubMed] [Google Scholar]
- 132. Filidou E, Valatas V, Drygiannakis I, Arvanitidis K, Vradelis S, Kouklakis G, et al. Cytokine receptor profiling in human colonic subepithelial myofibroblasts: a differential effect of Th polarization associated cytokines in intestinal fibrosis. InflammBowel Dis (2018) 24(10):2224–2241. doi: 10.1093/ibd/izy204 [DOI] [PubMed] [Google Scholar]
- 133. Filidou E, Kandilogiannakis L, Tarapatzi G, Spathakis M, Steiropoulos P, Mikroulis D, et al. Anti-inflammatory and anti-fibrotic effect of immortalized mesenchymal-Stem-Cell-Derived conditioned medium on human lung myofibroblasts and epithelial cells. Int J Mol Sci (2022) 23(9):4570. doi: 10.3390/ijms23094570 [DOI] [PMC free article] [PubMed] [Google Scholar]
- 134. Zhou Y, Zhou B, Pache L, Chang M, Khodabakhshi AH, Tanaseichuk O, et al. Metascape provides a biologist-oriented resource for the analysis of systems-level datasets. Nat Commun (2019) 10(1):1–10. doi: 10.1038/s41467-019-09234-6 [DOI] [PMC free article] [PubMed] [Google Scholar]
- 135. Chen EY, Tan CM, Kou Y, Duan Q, Wang Z, Meirelles GV, et al. Enrichr: interactive and collaborative HTML5 gene list enrichment analysis tool. BMC Bioinf (2013) 14(1):128. doi: 10.1186/1471-2105-14-128 [DOI] [PMC free article] [PubMed] [Google Scholar]
- 136. Liu T, Jin H, Ullenbruch M, Hu B, Hashimoto N, Moore B, et al. Regulation of found in inflammatory zone 1 expression in bleomycin-induced lung fibrosis: role of IL-4/IL-13 and mediation via STAT-6. J Immunol (2004) 173(5):3425–31. doi: 10.4049/jimmunol.173.5.3425 [DOI] [PubMed] [Google Scholar]
- 137. Nguyen JK, Austin E, Huang A, Mamalis A, Jagdeo J. The IL-4/IL-13 axis in skin fibrosis and scarring: mechanistic concepts and therapeutic targets. Arch Dermatol Res (2020) 312(2):81–92. doi: 10.1007/s00403-019-01972-3 [DOI] [PMC free article] [PubMed] [Google Scholar]
- 138. Su S, Zhao Q, He C, Huang D, Liu J, Chen F, et al. miR-142-5p and miR-130a-3p are regulated by IL-4 and IL-13 and control profibrogenic macrophage program. Nat Commun (2015) 6:8523. doi: 10.1038/ncomms9523 [DOI] [PMC free article] [PubMed] [Google Scholar]
- 139. Liu Z, Chen H, Fan Z, Dai J, Sun Y, Yan L, et al. IFN-α-2b inhibits the proliferation and migration of fibroblasts via the TGFβ/Smad signaling pathway to reduce postoperative epidural fibrosis. J Interferon Cytokine Res (2021) 41(8):271–82. doi: 10.1089/jir.2020.0231 [DOI] [PubMed] [Google Scholar]
- 140. Bansal R, Prakash J, De Ruiter M, Poelstra K. Interferon gamma peptidomimetic targeted to hepatic stellate cells ameliorates acute and chronic liver fibrosis in vivo . J Controlled Release (2014) 179:18–24. doi: 10.1016/j.jconrel.2014.01.022 [DOI] [PubMed] [Google Scholar]
- 141. Oldroyd SD, Thomas GL, Gabbiani G, El Nahas AM. Interferon-γ inhibits experimental renal fibrosis. Kidney Int (1999) 56(6):2116–27. doi: 10.1046/j.1523-1755.1999.00775.x [DOI] [PubMed] [Google Scholar]
- 142. Bouros D, Antoniou KM, Tzouvelekis A, Siafakas NM. Interferon-γ1b for the treatment of idiopathic pulmonary fibrosis. Expert Opin Biol Ther (2006) 6(10):1051–60. doi: 10.1517/14712598.6.10.1051 [DOI] [PubMed] [Google Scholar]
- 143. Azuma A, Li YJ, Abe S, Usuki J, Matsuda K, Henmi S, et al. Interferon-{beta} inhibits bleomycin-induced lung fibrosis by decreasing transforming growth factor-{beta} and thrombospondin. Am J Respir Cell Mol Biol (2005) 32(2):93–8. doi: 10.1165/rcmb.2003-0374OC [DOI] [PubMed] [Google Scholar]
- 144. Shimozono R, Nishimura K, Akiyama H, Funamoto S, Izawa A, Sai T, et al. Interferon-β mediates signaling pathways uniquely regulated in hepatic stellate cells and attenuates the progression of hepatic fibrosis in a dietary mouse model. J Interferon Cytokine Res (2015) 35(6):464–73. doi: 10.1089/jir.2014.0096 [DOI] [PMC free article] [PubMed] [Google Scholar]
- 145. Zhang YE. Non-smad pathways in TGF-β signaling. Cell Res (2009) 19(1):128–39. doi: 10.1038/cr.2008.328 [DOI] [PMC free article] [PubMed] [Google Scholar]
- 146. Bolourani S, Brenner M, Wang P. The interplay of DAMPs, TLR4, and proinflammatory cytokines in pulmonary fibrosis. J Mol Med (Berl) (2021) 99(10):1373–84. doi: 10.1007/s00109-021-02113-y [DOI] [PMC free article] [PubMed] [Google Scholar]
- 147. Theiss AL, Simmons JG, Jobin C, Lund PK. Tumor necrosis factor (TNF) alpha increases collagen accumulation and proliferation in intestinal myofibroblasts via TNF receptor 2. J Biol Chem (2005) 280(43):36099–109. doi: 10.1074/jbc.M505291200 [DOI] [PubMed] [Google Scholar]
- 148. Li J, Liu L, Zhao Q, Chen M. Role of interleukin-17 in pathogenesis of intestinal fibrosis in mice. Digest Dis Sci (2020) 65(7):1971–9. doi: 10.1007/s10620-019-05969-w [DOI] [PubMed] [Google Scholar]
- 149. Latella G, Viscido A. Controversial contribution of Th17/IL-17 toward the immune response in intestinal fibrosis. Digest Dis Sci (2020) 65(5):1299–306. doi: 10.1007/s10620-020-06161-1 [DOI] [PubMed] [Google Scholar]
- 150. Chen S, Wang HT, Yang B, Fu YR, Ou QJ. Protective effects of recombinant human growth hormone on cirrhotic rats. World J Gastroenterol (2004) 10(19):2894–7. doi: 10.3748/wjg.v10.i19.2894 [DOI] [PMC free article] [PubMed] [Google Scholar]
- 151. Fan Y, Fang X, Tajima A, Geng X, Ranganathan S, Dong H, et al. Evolution of hepatic steatosis to fibrosis and adenoma formation in liver-specific growth hormone receptor knockout mice. Front Endocrinol (Lausanne) (2014) 5:218. doi: 10.3389/fendo.2014.00218 [DOI] [PMC free article] [PubMed] [Google Scholar]
- 152. Householder LA, Comisford R, Duran-Ortiz S, Lee K, Troike K, Wilson C, et al. Increased fibrosis: A novel means by which GH influences white adipose tissue function. Growth Horm IGF Res (2018) 39:45–53. doi: 10.1016/j.ghir.2017.12.010 [DOI] [PMC free article] [PubMed] [Google Scholar]
- 153. Xie T, Kulur V, Liu N, Deng N, Wang Y, Rowan SC, et al. Mesenchymal growth hormone receptor deficiency leads to failure of alveolar progenitor cell function and severe pulmonary fibrosis. Sci Adv (2021) 7(24):eabg6005. doi: 10.1126/sciadv.abg6005 [DOI] [PMC free article] [PubMed] [Google Scholar]
- 154. Choi JS, Han S, Ryu HA, Kim SW. Directly induced hepatogenic cells derived from human fibroblast ameliorate liver fibrosis. J Tissue Eng Regener Med (2020) 14(8):1028–36. doi: 10.1002/term.3073 [DOI] [PubMed] [Google Scholar]
- 155. Zhang F, Zhang L, Jiang HS, Chen XY, Zhang Y, Li HP, et al. Mobilization of bone marrow cells by CSF3 protects mice from bleomycin-induced lung injury. Respiration (2011) 82(4):358–68. doi: 10.1159/000328762 [DOI] [PubMed] [Google Scholar]
- 156. Yu P, Zhang X, Liu N, Tang L, Peng C, Chen X. Pyroptosis: mechanisms and diseases. Signal Transduct Target Ther (2021) 6(1):128. doi: 10.1038/s41392-021-00507-5 [DOI] [PMC free article] [PubMed] [Google Scholar]
- 157. Chai R, Xue W, Shi S, Zhou Y, Du Y, Li Y, et al. Cardiac remodeling in heart failure: Role of pyroptosis and its therapeutic implications. Front Cardiovasc Med (2022) 9:870924. doi: 10.3389/fcvm.2022.870924 [DOI] [PMC free article] [PubMed] [Google Scholar]
- 158. Gan C, Cai Q, Tang C, Gao J. Inflammasomes and pyroptosis of liver cells in liver fibrosis. Front Immunol (2022) 13:896473. doi: 10.3389/fimmu.2022.896473 [DOI] [PMC free article] [PubMed] [Google Scholar]
- 159. Lin C, Jiang Z, Cao L, Zou H, Zhu X. Role of NLRP3 inflammasome in systemic sclerosis. Arthritis Res Ther (2022) 24(1):196. doi: 10.1186/s13075-022-02889-5 [DOI] [PMC free article] [PubMed] [Google Scholar]
- 160. Song Z, Gong Q, Guo J. Pyroptosis: Mechanisms and links with fibrosis. Cells (2021) 10(12):3509. doi: 10.3390/cells10123509 [DOI] [PMC free article] [PubMed] [Google Scholar]
- 161. Zhao J, Qi YF, Yu YR. STAT3: A key regulator in liver fibrosis. Ann Hepatol (2021) 21:100224. doi: 10.1016/j.aohep.2020.06.010 [DOI] [PubMed] [Google Scholar]
- 162. Martí-Rodrigo A, Alegre F, Moragrega ÁB, García-García F, Martí-Rodrigo P, Fernández-Iglesias A, et al. Rilpivirine attenuates liver fibrosis through selective STAT1-mediated apoptosis in hepatic stellate cells. Gut (2020) 69(5):920–32. doi: 10.1136/gutjnl-2019-318372 [DOI] [PubMed] [Google Scholar]
- 163. Mridha AR, Wree A, Robertson AAB, Yeh MM, Johnson CD, Van Rooyen DM, et al. NLRP3 inflammasome blockade reduces liver inflammation and fibrosis in experimental NASH in mice. J Hepatol (2017) 66(5):1037–46. doi: 10.1016/j.jhep.2017.01.022 [DOI] [PMC free article] [PubMed] [Google Scholar]
- 164. Calcagno DM, Chu A, Gaul S, Taghdiri N, Toomu A, Leszczynska A, et al. NOD-like receptor protein 3 activation causes spontaneous inflammation and fibrosis that mimics human NASH. Hepatology (2022) 76(3):727–41. doi: 10.1002/hep.32320 [DOI] [PMC free article] [PubMed] [Google Scholar]
- 165. Dovrolis N, Drygiannakis I, Filidou E, Kandilogiannakis L, Arvanitidis K, Tentes I, et al. Gut microbial signatures underline complicated crohn's disease but vary between cohorts; an in silico approach. Inflamm Bowel Dis (2019) 25(2):217–25. doi: 10.1093/ibd/izy328 [DOI] [PubMed] [Google Scholar]
- 166. Distler JHW, Györfi AH. Shared and distinct mechanisms of fibrosis. Nat Rev Rheumatol (2019) 15(12):705–30. doi: 10.1038/s41584-019-0322-7 [DOI] [PubMed] [Google Scholar]
Associated Data
This section collects any data citations, data availability statements, or supplementary materials included in this article.
Supplementary Materials
Data Availability Statement
The dataset generated by this study containing the RNA-seq data of paired-tissue biopsies can be found under SRA/ENA Project Accession PRJEB56386/ERP141320. The data can also be accessed here: https://www.ebi.ac.uk/ena/browser/view/PRJEB56386.