Abstract
Spinal cord injury (SCI) can cause long‐lasting disability in mammals due to the lack of axonal regrowth together with the inability to reinitiate spinal neurogenesis at the injury site. Deciphering the mechanisms that regulate the proliferation and differentiation of neural progenitor cells is critical for understanding spinal neurogenesis after injury. Compared with mammals, zebrafish show a remarkable capability of spinal cord regeneration. Here, we show that Rassf7a, a member of the Ras‐association domain family, promotes spinal cord regeneration after injury. Zebrafish larvae harboring a rassf7a mutation show spinal cord regeneration and spinal neurogenesis defects. Live imaging shows abnormal asymmetric neurogenic divisions and spindle orientation defects in mutant neural progenitor cells. In line with this, the expression of rassf7a is enriched in neural progenitor cells. Subcellular analysis shows that Rassf7a localizes to the centrosome and is essential for cell cycle progression. Our data indicate a role for Rassf7a in modulating spindle orientation and the proliferation of neural progenitor cells after spinal cord injury.
Keywords: asymmetric neurogenic division, Rassf7a, regeneration, spinal cord injury, spindle orientation
Subject Categories: Cell Cycle, Neuroscience, Stem Cells & Regenerative Medicine
Rassf7a locates to the spindle pole and controls spindle rotation during neural progenitor cell divisions. Rassf7a deficiency results in spindle orientation defects characterized by increased rotation angles and decreased asymmetric cell divisions after spinal cord injury.

Introduction
Spinal cord injury (SCI) is one of the devastating neurological injuries and can cause long‐lasting disability. Injury to the spinal cord often results in permanent loss of motor and/or sensory function below the injured site because the sensory information ascending to the brain and the motor information descending to the body cannot go past that point (Schwab & Bartholdi, 1996; Ahuja et al, 2017). In mammals, the recovering abilities of the central nervous system (CNS) after injury are extremely limited, mainly due to the lack of axonal regeneration. A significant barrier to mammalian axonal regeneration during SCI is astrocyte reactive gliosis at the injury site, which invariably blocks regeneration by forming glial scars. In the central core of the lesion site, interactions between fibroblasts, inflammatory immune cells, and extracellular matrix contributes to the formation of the fibrotic scar, which is further surrounded by the astrocytes‐enriched glial scars in the periphery to separate the injured area from uninjured tissues (Silver & Miller, 2004; O'Shea et al, 2017; Bradbury & Burnside, 2019). By contrast, spinal cord regeneration is an innate ability of axolotl (salamander) and teleost fish (zebrafish). It is supposed that these organisms may have specific mechanisms regulating glial scar formation and the following proliferation and growth process of axons (Tazaki et al, 2017; Ghosh & Hui, 2018).
Understanding the cellular mechanisms underlying axonal regeneration is fundamental to promote spinal cord repair after injury. Adult zebrafish have a remarkable capability of axonal regeneration following spinal cord injuries, that is, fishes can fully regenerate the spinal cord at the lesion site within 4–6 weeks (Becker et al, 2004; Dias et al, 2012). It has been suggested that the composition and response of glial cells of zebrafish are different from those of mammals, especially for the epithelial‐to‐mesenchymal transition (EMT) gene program (Klatt Shaw et al, 2021). More specifically, there is a clear absence of astrogliosis in the adult zebrafish CNS regenerating from SCI (Ghosh & Hui, 2018) and there is no permanent glial scar formation. By contrast, GFAP expressing cells elongate and form a permissive glial bridge so that the regenerating axons can actively cross the lesion site and reinnervate those regions caudal to injury site (Goldshmit et al, 2012; Mokalled et al, 2016). Larvae fish exhibited a faster recovery capacity after SCI than adult fish. For instance, zebrafish larvae can recover their touch‐stimulate swimming behavior within two days when spinal cord injury was performed at 3 or 5 days postfertilization (dpf; Briona & Dorsky, 2014; Ohnmacht et al, 2016). Similar to adults, glial cells also participate in spinal cord regeneration in the larvae (Briona & Dorsky, 2014).
Multiple signaling pathways have been reported to regulate axonal regeneration after SCI in zebrafish. For example, Wnt/β‐catenin signals are activated in spinal radial glia cells after SCI, and overexpression of Dkk1b, a negative regulator of Wnt signaling, prevents glial bridge formation, as well as axonal regeneration (Briona et al, 2015; Strand et al, 2016). Interestingly, inhibition of Wnt signaling specifically in the glial cells does not impair axonal regeneration, suggesting that Wnt/β‐catenin signals may regulate axonal regeneration via nonglial cells. Indeed, the fibroblast‐like cells accumulated in the lesion site are able to express and deposit Collagen XII upon Wnt signaling activation, which is essential for axonal regeneration and functional recovery after SCI (Wehner et al, 2017). A recent study showed that the extracellular matrix components were partially regulated by a specific type of Pdgfrb+ cells recruited to the lesion site (Tsata et al, 2021). FGF signals are also critical for axonal regeneration. After SCI, glial cells proliferate and change their morphology to form the glial bridge in favor of axonal regeneration as a response to these signals (Goldshmit et al, 2012). Of note, different Fgfs play distinct roles in regulating neurogenesis after SCI, with Fgf2 and Fgf8 being more effective in facilitating neurite outgrowth (Goldshmit et al, 2018). Similarly, activated FGF2 signaling also promotes axonal regeneration after SCI in mice and humans (Goldshmit et al, 2014; Ko et al, 2018).
In anamniotes, newborn neurons are generated rapidly after SCI to promote axonal regeneration as well as developing other cell types of neurons that are essential for recovering a fully functional spinal cord. These newly formed neurons are mainly differentiated from a specific type of neural progenitor cells, an astroglia‐like radial glia localized to the central canal (Becker & Becker, 2015; Becker et al, 2018). These radial glial cells form part of the ependymal layer and have radial processes extending from the central canal toward the pial surface. Several stem cell markers, including Sox2 and Pou5f1, are expressed in these progenitor cells, which are essential for neurogenesis after SCI (Fei et al, 2014; Ogai et al, 2014; Hui et al, 2015). During neurogenesis, radial glia cells can either divide symmetrically to expand the pool of neural precursors or undergo an asymmetric neurogenic division that produces another radial glia and a newborn neuron(Becker & Becker, 2015; Shohayeb et al, 2021). During symmetric proliferative division, the cleavage plane is usually perpendicular to the apical membrane resulting in equal distribution of proteins between daughters. The cleavage plane is prone to be horizontal or oblique when the radial glia undergoes an asymmetric division, in which neurons are mostly generated from the more apical daughter cell (Konno et al, 2008; Alexandre et al, 2010; Postiglione et al, 2011; Shao et al, 2020). Asymmetric division of radial glia cell is also observed in adult zebrafish after spinal cord injury (Reimer et al, 2008; Hui et al, 2010).
The Ras‐association domain family (RASSF) proteins contain 10 members, all of which are characterized by the presence of a Ras‐association (RA) domain. Depending on the position of the RA domain, RASSF proteins can be classified as C‐terminal (classical) RASSFs (RASSF1‐6) or N‐terminal RASSFs (RASSF7‐10). The RA domain interacts with the RAS GTPase family of proteins to regulate many cellular processes, including membrane trafficking, apoptosis and proliferation (Kitagawa et al, 2006; Richter et al, 2009; Underhill‐Day et al, 2011). The classical RASSF family members are generally considered as tumor suppressors and have been reported to participate in many biological processes, such as microtubule stability, cell cycle control and apoptosis, whereas N‐RASSF proteins, which have been less studied, seem to play diverse roles during cell growth, apoptosis and embryonic development (Underhill‐Day et al, 2011). RASSF7 has been suggested to play a role during mitosis through regulating microtubule dynamics (Sherwood et al, 2008; Recino et al, 2010; Gulsen et al, 2016). RASSF7 can promote cell proliferation through MEK1/2‐ERK1/2 signaling pathway activation (Wang et al, 2016; Zhang et al, 2018a). In vitro studies have also showed that, through interaction with N‐RAS, RASSF7 inhibits mitogen‐activated protein kinase kinase (MKK) 7 phosphorylation to negatively regulate pro‐apoptotic JNK signaling under stress‐induced conditions (Takahashi et al, 2011).
Here, we reported the role of Rassf7 during spinal cord regeneration in zebrafish. Zebrafish rassf7a mutants displayed significant regeneration defects after spinal cord injury, which were mainly due to the restricted cell proliferation of the neural progenitor cells. We further provided data to show that rassf7a encodes a centrosomal protein and regulates spindle orientation during radial glia proliferation. These results suggested an important role of Rassf7a in spinal cord regeneration of zebrafish larvae after injury, which may help us to understand the reasons for the failure of axonal regeneration in mammals.
Results
Tissue‐specific expression of rassf7a and rassf7b during early embryogenesis
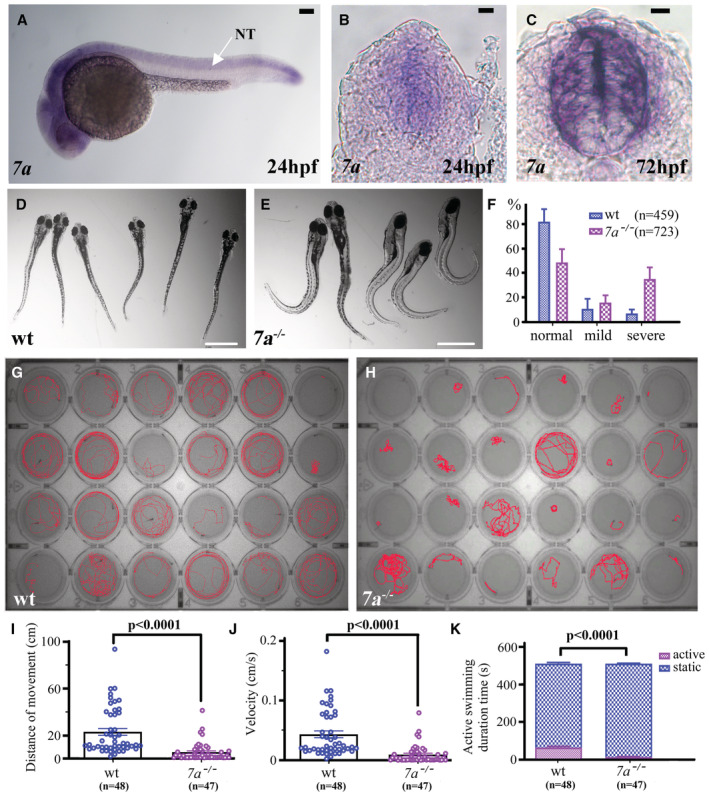
When searching for cilia‐related genes via whole‐mount in situ hybridization assay, we identified two rassf7 homologous genes, rassf7a and rassf7b, in zebrafish. Zygotic rassf7a was first detected in the dorsal forerunner cells (DFCs), at around 90% epiboly stage (Appendix Fig S1A). At 14‐somite stage, rassf7a expression was initially enriched in the third and fifth rhombomeres, as suggested by double in situ staining with krox20, a well‐known hindbrain marker (Appendix Fig S1B). At 18‐somite stage, rassf7a started to be expressed in the neural tube, and showed abundant expression in the whole central nervous systems at 24 h postfertilization (hpf; Fig 1A, Appendix Fig S1C). Transverse sections through the trunk suggested that rassf7a was expressed in the whole neural tube with high enrichment in the central canal at both 24 and 72 hpf (Fig 1B and C). Similarly, rassf7b was also expressed in the DFCs, starting at 75% epiboly stage (Appendix Fig S1D). At 10‐somite stage, expression of rassf7b was observed mainly in the Kupffer's vesicle (KV; Appendix Fig S1E). At 24 hpf, rassf7b expression was selectively enriched in the pronephric duct, olfactory placode, otic vesicle and posterior notochord (Appendix Fig S1F).
Figure 1. Locomotion defects of rassf7a mutants after SCI.
-
AWhole mount in situ hybridization results showing expression of rassf7a at 24 hpf.
-
B, CCross sections through the trunk region showing the expression of rassf7a in the spinal cord of 24 and 72 hpf zebrafish larvae.
-
D, EExternal phenotypes of wild‐type (D) and rassf7a mutant (E) larvae at 6 dpi.
-
FBar graph showing the percentages of larvae with normal, mild and severe body axis defects in wild‐type (n = 459) or rassf7a mutants (n = 723) at 6 dpi.
-
G, HLocomotion tracking of each individual larva of wild‐type (G) or rassf7a mutants (H) at 6 dpi in 24‐well plates.
-
IDot plots showing the swimming distance of each larva at a duration of 500 s.
-
JDot plots showing the swimming velocity of wild‐type and mutant larvae as indicated.
-
KBar graph showing active swimming time in wild‐type and mutant larvae at a duration of 500 s.
Data information: In panels I and J, each dot represents an individual larva. P values for unpaired Mann–Whitney test (I, J) and Two‐way ANOVA with Bonferroni's multiple comparisons test (K) are indicated. Data are shown as mean ± S.E.M. Scale bars: 100 μm in (A–C) and 1 mm in (D and E).
Generation of rassf7 zebrafish mutants
The expression pattern of rassf7b is similar to those of genes involved in cilia development (Song et al, 2016; Han et al, 2018; Zhang et al, 2018b), promoting us to first investigate the role of Rassf7b during ciliogenesis. We generated zebrafish rassf7b mutants using the TALEN system and identified a mutant line carrying a 7‐bp deletion in the target site (Appendix Fig S2A). We further confirmed this deletion through Sanger sequencing of the mutant transcripts, which suggested that this deletion caused a frameshift during messenger RNA (mRNA) translation, resulting in the disruption of the Ras‐association domain of Rassf7b protein (Appendix Fig S2A and B). The expression level of the mutant transcripts was also decreased due to nonsense‐mediated decay (Appendix Fig S2C and D). Surprisingly, zebrafish rassf7b mutants were viable and fertile. Whole‐mount immunohistochemistry with an anti‐acetylated tubulin antibody suggested that cilia were grossly normal in rassf7b mutants (Appendix Fig S2E–I).
Considering that Rassf7a may play a redundant role in rassf7b mutants, we further generated rassf7a mutants carrying a 4‐bp deletion in the target area (Appendix Fig S2A and B). The expression level of mutant mRNA was also substantially decreased in the mutants (Appendix Fig S2C and D). We further generated rassf7a;rassf7b double mutants (7a −/− ;7b −/− ). Strikingly, double homozygous mutants were also viable and fertile. Of a total of 263 adults crossed from double heterozygote mutants, we identified 15 double homozygous mutants, including seven females and eight males, which suggest that Rassf7 proteins are dispensable for the growth of zebrafish. In addition, cilia were also grossly normal in the double mutants (Appendix Fig S2E–I). Being derived from DFCs, Kupffer's vesicle is an essential organ for the establishment of left–right asymmetry (Essner et al, 2005). Although both rassf7 genes were expressed at a high level in the DFCs, there were no laterality defects in the double mutants, as indicated by the expression of lefty‐2, an asymmetry marker expressed in the lateral plate mesoderm of early zebrafish larvae (Appendix Fig S2J; Zhao & Malicki, 2007). Moreover, the number and length of cilia in the Kupffer's vesicle was comparable between control and mutant embryos (Appendix Fig S2E–G). These data suggested that Rassf7 proteins were neither essential for ciliary development, nor for left–right asymmetry determination.
Locomotion defects of rassf7a mutants after SCI
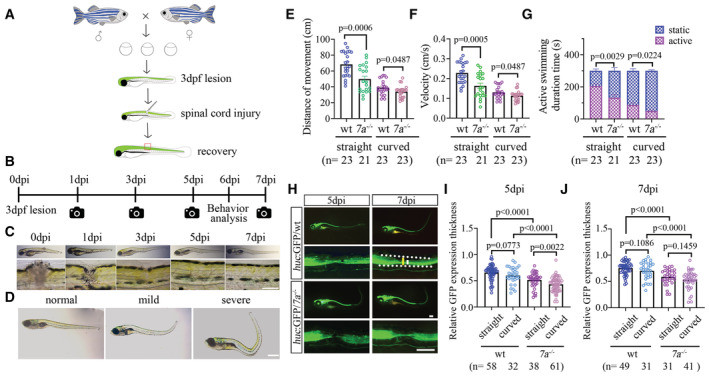
Although rassf7a showed abundant expression in the central nervous systems, the development of spinal cords was grossly normal in rassf7a mutants as suggested by the normal thickness visualized via Tg(huc:GFP) or Tg(foxj1a:HA‐tdTomato) transgenic lines (Appendix Fig S3A–E). We further asked whether mutant spinal cord will exhibit developmental defects in stress‐induced conditions. Considering the high expression of rassf7a in the central nervous systems (Fig 1A–C), we evaluated the regeneration efficiency of spinal cord after injury. For this, we transected the spinal cord with a beveled microinjection pipette at 3 days postfertilization and investigated the regeneration efficiency at different time points after injury (Fig EV1A and B). Similar to previously report, the wound sites were gradually closed at around 48 h post‐injury (hpi; Ohnmacht et al, 2016). Spinal cord was fully regenerated at around 7 days after transection (Fig EV1C). After regeneration, most larvae displayed a straight body axis, while some exhibited dorsal bending at varying degrees (Fig EV1D). Surprisingly, we found a significant increase in the percentage of embryos exhibiting dorsal bending phenotype in rassf7a mutants after SCI (16% in wild‐type, n = 459 vs 60% in the mutants, n = 723; Fig 1D–F). In most cases, regenerated larvae with severe dorsal bending failed to swim straight and could not react properly to touch stimulus (Movies EV1 and EV2).
Figure EV1. Strategies of examining spinal cord regeneration after SCI.
-
ADiagram showing that transgenic zebrafish larva was injured at the trunk spinal cord at 3 dpf and recovered later during development.
-
BTimeline of imaging and behavior analysis of zebrafish larvae after SCI at 3 dpf.
-
CRepresentative images showing the recovery of a wild‐type zebrafish larva injured at 3 dpf. Bottom images showing the enlarged views of the lesion sites.
-
DRepresentative images showing the external phenotypes of three categories of larvae at 6 dpi.
-
EDot plots showing the swimming distance of each larva in different groups as indicated at a duration of 300 s.
-
FDot plots showing the swimming velocity of wild‐type and mutant larvae as indicated.
-
GBar graph showing active swimming time in wild‐type and mutant larvae in different groups as indicated at a duration of 300 s.
-
HRepresentative images showing GFP expression in wild‐type or rassf7a mutants carrying Tg(huc:GFP) transgene at different time points after SCI. Bottom rows show the magnified views near the lesion sites. The white dashed border represents the entire spinal cord near the lesion sites. Long line in yellow indicates measurement of spinal cord thickness. Short line in white indicates the measurement of GFP fluorescence thickness.
-
I, JDot plots showing relative thickness of GFP fluorescence at the lesion sites of wild‐type or mutant larvae at 5 dpi (I) and 7 dpi (J) in different groups as indicated.
Data information: P values for unpaired Student's t‐test (E‐F, J), unpaired Mann–Whitney test (I) and Two‐way ANOVA with Bonferroni's multiple comparisons test (G) are indicated. Data are shown as mean ± S.E.M. Each data point represents an individual fish. Scale bars: 500 μm in (C, D), 250 μm in (H).
To further analyze locomotion, we monitored the behavior of zebrafish larvae at 6 days post‐injury (dpi) using EthoVision XT11, a professional behavior tracking software (Fig 1G and H). Under the tapping stimulus condition, the motion distance and velocity decreased significantly in the mutant larvae (Fig 1G–J). Moreover, mutant larvae static state lasted longer than that of control zebrafish (Fig 1K). We further compared the motion capability of wild‐type and mutant larvae with straight and curved body axis at 6 dpi. Clearly, the movement of larvae with dorsal bending was significantly weaker than those of the straight larvae in both wild‐type and mutant groups (Fig EV1E and F). Strikingly, wild‐type larve with straight body axis were also more active than those of mutant larvae with straight body axis (Fig EV1G).These data suggested that rassf7a mutant embryos exhibited locomotion defects at 6 days after spinal cord injury.
Axonal regeneration defects in rassf7a mutants after SCI
To clarify the reason of locomotion defects in mutants, we generated rassf7a homozygotic mutants carrying either the Tg(gfap:GFP) or Tg(huc:GFP) transgene, which labels neural glial and neuronal cells respectively. These transgenes allow for the gap in the lesion sites to be easily visualized after injury (Fig 2A). In wild‐type larvae, both HuC and GFAP expressing cells started to accumulate at the injury site rather quickly between 1 and 3 days after injury (Fig 2A–C). Till 7 dpi, the fluorescence gaps were almost completely recovered for both wild‐type transgenes (Fig 2A). Interestingly, we found no difference in the areas of GFP expression in the glial cells at the lesion sites between wild‐type and rassf7a mutants (Fig 2B). By contrast, the recovery of fluorescence signals in the Tg(huc:GFP) transgene were significantly delayed in the mutants (Fig 2C). We further measured the thickness of GFP fluorescence signals in both straight and curved larvae at 5 and 7 dpi. As shown in Fig EV1, the regenerated HuC+ fascicles were significantly thinner in both straight and curved larvae of the mutants (Fig EV1H–J).
Figure 2. Recovery of neural and glial cells in rassf7a mutants after injury.
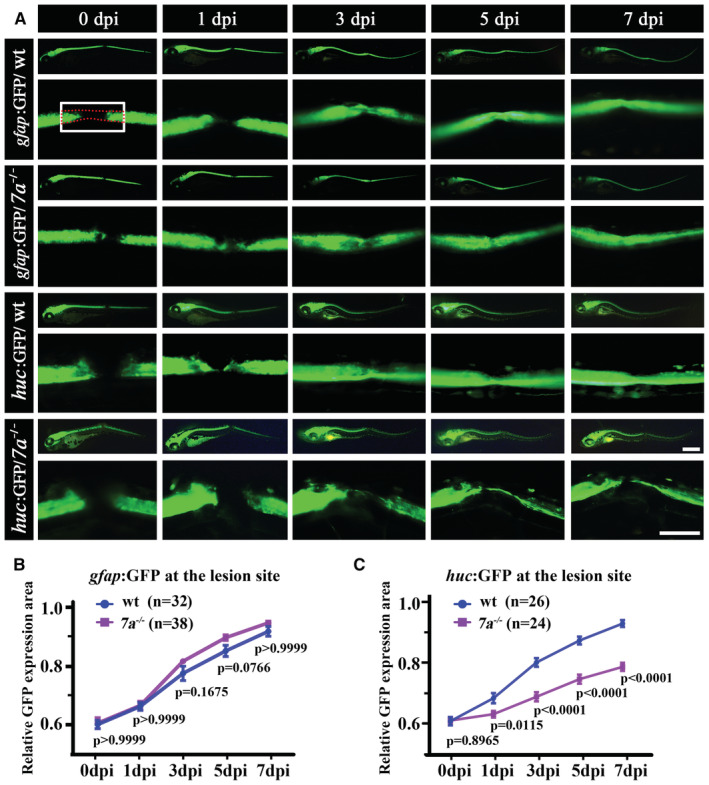
- Representative images showing GFP expression in wild‐type or rassf7a mutants carrying Tg(gfap:GFP) or Tg(huc:GFP) transgene at different time points as indicated. Bottom rows showing the magnified views near the lesion sites.
- Line plots showing relative expression level of GFP fluorescence at the lesion sites in wild‐type and rassf7a mutants at different time points as indicated.
- Statistical results showing relative expression area of GFP fluorescence at the lesion sites of Tg(huc:GFP) transgenic larvae.
Data information: In panel (A), the white rectangle and red dashed box indicate the fixed size for GFP fluorescence measurement and the neural tube respectively. Relative GFP expression area was calculated by the ratio of the GFP expression area in the white rectangle to the size of the neural tube (see methods for the details). P values for Two‐way ANOVA with Bonferroni's multiple comparisons test (B, C) are indicated. Data are shown as mean ± S.E.M. N = 7 biological replicates per group. Each data point represents an average of each group as indicated. Scale bars: 500 μm.
We further employed rassf7a‐targeted vivo morpholinos (MOs) to knockdown rassf7a expression in wild‐type embryos. The knockdown efficiency of this MO was first validated via coninjection with a reporter construct at one cell stage, which showed that this MO can reduce the expression of GFP to the background level (Appendix Fig S4A–C). Next, we injected rassf7a or control MOs into the Tg(huc:GFP) transgenic embryos at the lesion sites immediately after injury and found that rassf7a knockdown significantly obstructed the recovery of GFP fluorescence (Appendix Fig S4D and E). Meanwhile, we overexpressed Rassf7a protein in the mutants by injecting rassf7a under a heat shock inducible promoter. After heat shock, the GFP fluorescence signals improved significantly, while overexpression of tdTomato alone failed to prevent the regeneration defects in the mutants (Appendix Fig S4F). Of note, ectopic expression of Rassf7a also slightly increased the recovery of GFP fluorescence in wild‐type larvae (Appendix Fig S4G).
Axonal regrowth is necessary for the functional recovery of spinal cord in larval zebrafish (Bhatt et al, 2004; Ohnmacht et al, 2016), we further analyzed axonal regrowth and glial bridge formation in the mutants through a combination of immunohistochemical (anti‐acetylated alpha tubulin staining) and transgenic marker (gfap:GFP) labeling. Similar to previous report (Wehner et al, 2017), the majority of fascicles (65%, n = 58 fasicles) that entered the lesion sites were composed of axonal‐only processes at 1 dpi in wild‐type larvae (Fig EV2A and B). The glial‐only and mixed processes were also detectable (Fig EV2B). Noticeably, the proportion of these fascicles were similar between mutant and control larvae (Fig EV2A and B). The percentages of larvae with axonal or glial processes were comparable, and the axonal bridges were also of similar length between mutant and control larvae at 1 dpi (Fig EV2C and D). By contrast, the thickness of these axonal bundles was significantly reduced in both straight and curved groups of the mutant larvae at 5 dpi (Fig EV2E and F). These data revealed that the initial formation of axonal and glial bridge was not affected, while axonal regeneration during later stages were inhibited in the absence of Rassf7a.
Figure EV2. Axonal regeneration in rassf7a mutants after SCI.
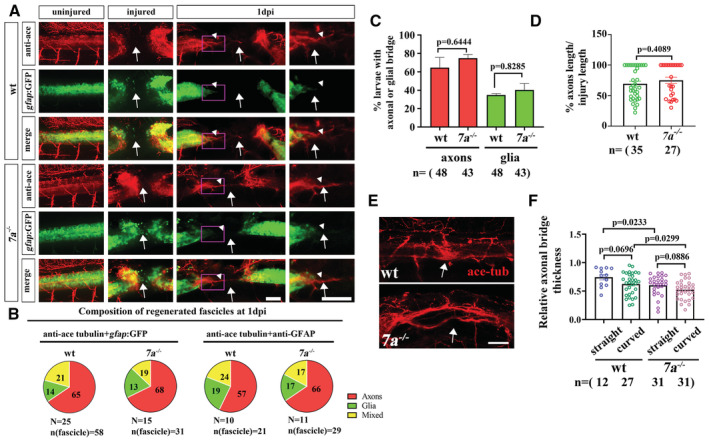
- Representative confocal images showing the regrowth of axons (anti‐acetylated Tubulin) and astroglia‐like processes (gfap:GFP) at 1 dpi. These images show examples of axonal‐only fascicles (arrowheads). Arrows indicate injury sites. High magnification images of boxed areas are shown on the right.
- Quantification of fascicle composition at 1 dpi of wild‐type and mutant larvae. The glial processes were visualized with either GFP transgene or GFAP antibody staining.
- Bar graph showing the percentages of wild‐type and rassf7a mutant larvae with axonal or glial processes at 1 dpi.
- Relative axonal bridge length of wild‐type and rassf7a mutants at 1 dpi.
- Representative images showing axonal bridges at 5 dpi in wild‐type and rassf7a mutants visualized with anti‐acetylated Tubulin antibody.
- Dot plots showing relative axonal bridge thickness at the lesion sites of wild‐type or mutant larvae at 5 dpi in different groups as indicated.
Data information: P values for a Fisher's Exact test (C), unpaired Mann–Whitney test (D) and unpaired Student's t‐test (F) are indicated. Data are shown as mean ± S.E.M. Each data point represents an individual fish. Scale bars: 50 μm in (A, E).
Mutation of Rassf7a affected the neuronal differentiation of newborn cells
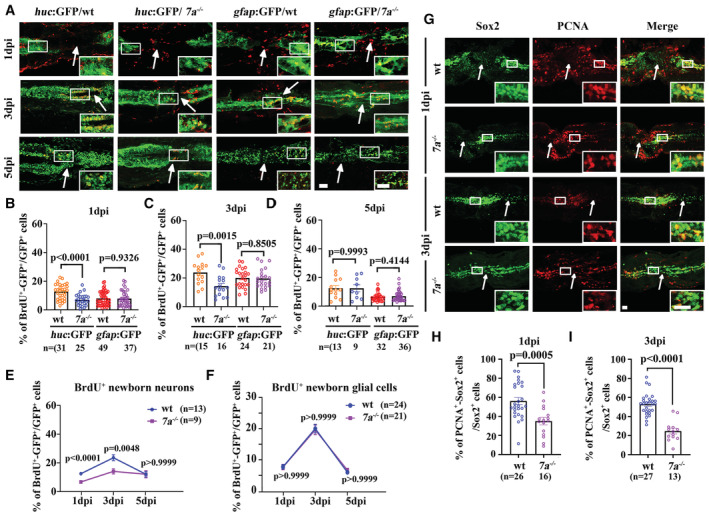
The later‐onset axonal regeneration defects in the mutants may due to the deficiencies of the production of neuronal cells at the lesion sites. To test this, we evaluated the numbers of newborn neurons via BrdU labeling. Starting at 1 day after injury, multiple BrdU+ cells accumulated at the lesion sites (Fig 3A). These BrdU+ cells include differentiated neuronal cells (huc:GFP), glial cells (gfap:GFP), together with cells involved in immune response and dermal and myogenic repair as previously reported (Suzuki et al, 2005). Noticeably, we observed a higher number of BrdU+ neurons or glial cells in the wounded region at 3 dpi, while the number of these BrdU+ cells decreased at 5 dpi with the recovery of spinal cord (Figs 3A–F and EV3). Next, we compared the number of BrdU+ neurons between wild‐type and mutant larvae. As shown in Fig 3, the number of BrdU+ neurons decreased significantly in rassf7a mutants (Fig 3B–E). By contrast, there was no significant difference in the number of BrdU+ glial cells between wild‐type and mutant larvae (Fig 3B–D and F). These results implied that Rassf7a loss mainly affected the neuronal differentiation of newborn cells.
Figure 3. Neuronal differentiation defects in rassf7a mutants after SCI.
-
AConfocal images showing localization of BrdU positive cells (red) near the lesion sites in wild‐type and rassf7a mutants carrying different transgenes. Inserted images are magnified views.
-
B–DDot plots showing the percentages of BrdU/GFP double labeled cells in wild‐type and rassf7a mutants at different time points as indicated.
-
EStatistical plot showing percentages of BrdU labeling neuronal cells at different time points.
-
FStatistical plot showing percentages of BrdU labeling neural glia cells at different time points after SCI.
-
GConfocal images showing proliferating neural progenitor cells visualized with anti‐Sox2 (green) and anti‐PCNA (red) antibodies in wild‐type and rassf7a mutants after SCI.
-
H, IDot graphs showing percentages of proliferating Sox2 positive cells in wild‐type and rassf7a mutants at one day (H) and three days (I) after spinal cord injury.
Data information: Arrows in (A, G) represent lesion sites. Individual channels of panel (A) were shown in Fig EV3. P values for unpaired Student's t‐test (huc:GFP group in B and D, C, H, I), unpaired Mann–Whitney test (gfap:GFP group in B and D) and two‐way ANOVA with Bonferroni's multiple comparisons test (E, F) are indicated. Data are shown as mean ± S.E.M. N = 3–5 biological replicates per group in (A–F), N = 3 biological replicates per group in (G–I). Each data point represents an individual fish in (B–D) and (H and I), and averages of each group were indicated in (E, F). Scale bars: 20 μm in (A, G).
Figure EV3. Neuronal differentiation defects in rassf7a mutants after SCI.
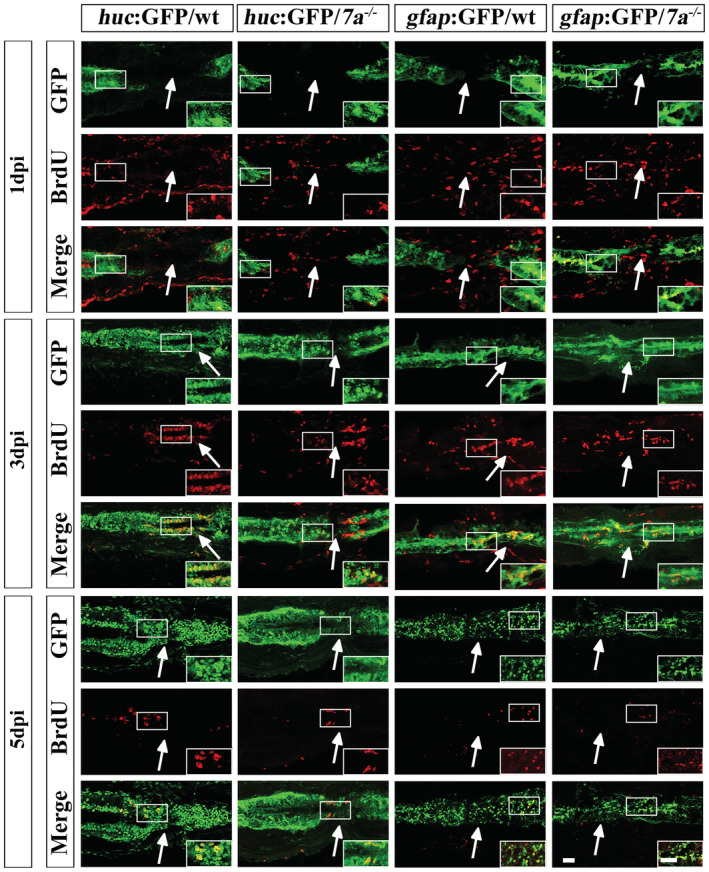
Individual channels of Fig 3A showing the localization of BrdU+ cells (red) near the lesion sites in wild‐type and rassf7a mutants carrying different transgenes. Arrows represent lesion sites. Scale bars: 20 μm.
During neurogenesis in zebrafish larvae, neurons are mainly differentiated from neural progenitor cells (NPCs). The reduced number of BrdU+ neuronal cells promoted us to further investigate whether Rassf7a malfunction can cause proliferation defects of the neural progenitors. Sox2 is one of the earliest transcription factors expressed in neural stem and progenitor cells (Graham et al, 2003). We further analyzed the proliferating ability of Sox2 expressing cells after spinal cord injury by co‐immunostaining anti‐Sox2 antibody with antiproliferating cell nuclear antigen (PCNA) antibody, a marker of cell proliferation (Fig 3G). In the spinal cord, Sox2 is mainly expressed in the radial glial progenitor cells near the central canal. High number of proliferating cells (Sox2+/PCNA+) can be easily identified at the lesion sites in wild‐type larvae (Fig 3G–I). By contrast, the number of Sox2+/PCNA+ cells was significantly decreased in rassf7a mutants (Fig 3G–I). Altogether, these data suggested that Rassf7a regulates the proliferation of neural progenitor cells and the neuronal differentiation of newborn cells after SCI.
rassf7a is mainly expressed in neural progenitor cells
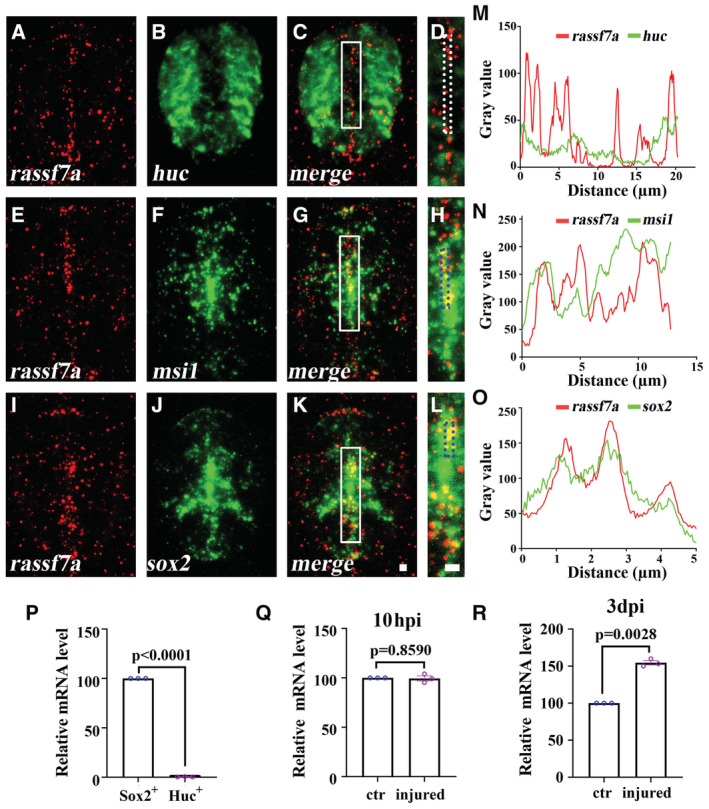
The proliferation defects of neural progenitors suggested that Rassf7a may regulate the differentiation of these cells directly. Next, we asked whether rassf7a was expressed in these progenitor cells. First, we performed fluorescence in situ hybridization (FISH) to check the colocalization between rassf7a and several markers of different neural cell types, including neuronal cells (huc) and neural progenitors (msi1 and sox2). At 24 hpf, rassf7a expression was distributed throughout the neural tube (Fig 1A–C, Appendix Fig S5). While we did not find colocalization between rassf7a and huc, part of rassf7a was colocalized with msi1 and sox2 expression (Appendix Fig S5A–I). Noticeably, both msi1 and sox2 were widely expressed in the neural tube at this stage, suggesting a broad distribution of neural progenitors at early stages (Appendix Fig S5E and H). The expression level of rassf7a decreased substantially in the mutants, further confirmed the specificity of these fluorescent signals as well as NMD effects of the mutants (Appendix Fig S5A′–I′). At 3 dpf, the expression of rassf7a was mainly accumulated in the central canal, where the neural progenitor cells were dispersed as indicated by sox2 and msi1 staining. We detected strong overlap signals between rassf7a and msi1, sox2 near the central canals, where the staining of huc was absent (Fig 4A–O).
Figure 4. Expression of rassf7a is enriched in Sox2+ neural progenitor cells.
-
A–LDouble fluorescence in situ hybridization results showing the localization of rassf7a (A, E, I) and huc (B), msi1 (F) or sox2 (J) on the cross sections of spinal cord of 72 hpf zebrafish larvae. Panels (D), (H) and (L) are magnified views of the boxes indicated in panels (C), (G) and (K).
-
M–OLine profile plots showing the pixel intensities of green and red channels along the dotted rectangles as indicated in panels (D), (H) and (L).
-
PqRT‐PCR results showing the relative expression level of rassf7a in Sox2+ or Huc+ cells as indicated.
-
Q, RqRT‐PCR results showing the relative expression level of rassf7a in Sox2+ cells between control and injured larvae at 10 hpi (Q) and 3 dpi (R) as indicated.
Data information: P values for unpaired Student's t‐test with Welch's correction (P–R) are indicated. Data are shown as mean ± S.E.M. N = 10–12 biological replicates per group in (A–L). N = 3 biological replicates per group in (P–R). Each data point in (P–R) represents a biological replicate. Scale bars: 10 μm in (A–L).
Next, we performed fluorescence‐activated cell sorting (FACS) experiment to confirm the co‐location between rassf7a and sox2. First, we sorted Huc+ cells and Sox2+ cells from Tg(huc:GFP) or Tg(sox2:sox2‐2a‐sfGFP) transgenic larvae at 3 dpf. Quantitative real‐time PCR (qPCR) results showed that rassf7a was mainly present in the Sox2+ cells with lower detectable levels in Huc+ cells (Fig 4P). In addition, the expression level of rassf7a in the Sox2+ cells was comparable between control (uninjured) and injured larvae at 10 hpi, while the expression of rassf7a increased significantly at 3 days after injury (Fig 4Q and R). Furthermore, we plotted the rassf7a‐expressing cells from two published single‐cell transcriptomes (Cavone et al, 2021; Scott et al, 2021). The expression of rassf7a is mainly enriched in those neural progenitor clusteres expressing GFAP and Sox2 (Fig EV4A–D). Altogher, these data suggested that the expression of rassf7a was highly enriched in the neural progenitor cells at larvae stage.
Figure EV4. Expression of rassf7a is enriched in the neural progenitor cells.
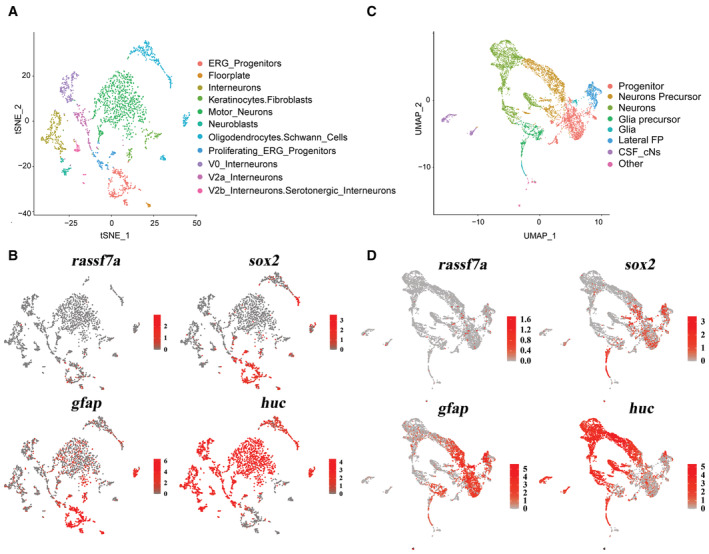
- A t‐distributed Stochastic Neighbor Embedding (tSNE) plot of scRNA‐seq dataset (Accession number: SAMEA8658904) from 4 dpf Tg(her4.3:GFP) zebrafish larvae.
- Gene expression patterns of rassf7a, sox2, gfap and huc on plot from (A). Color codes indicate normalized expression levels from low (gray) to high (red).
- Unsupervised UMAP of integrated scRNA‐seq dataset (Accession number: GSE173350) from olig2:EGFP spinal cord cells obtained from 24 hpf Tg (olig2:EGFP) embryos.
- Gene expression patterns projected onto UMAP plot (from (C)) of rassf7a, sox2, gfap and huc.
Rassf7a regulates mitotic spindle orientation in NPCs
We next sought to characterize the cellular basis of cell proliferation defects in NPCs by performing time‐lapse analysis using a Tg(sox2:sox2‐2a‐sfGFP) knock‐in transgenic line (Shin et al, 2014). In wild‐type larvae, the dividing GFP+ NPCs can be detected near the lesion sites. Noticeably, we observed slightly rotation of the longer dividing axis during metaphase to anaphase transition (Movie EV3, Fig 5A and B), reminiscent of the mitotic‐spindle rotations occurred in a variety of controlled cell divisions (Kaltschmidt et al, 2000; Haydar et al, 2003; Fededa et al, 2016). We measured the rotation angles of the spindle axes between their initial position at the metaphase and final dividing position at the anaphase (Fig 5B). In wild‐type larvae, the spindle rotation of these NPCs was mainly restricted to a small field, ranging from 0° to 45° (average = 31.07° ± 5.446°, mean ± S.E.M.; Fig 5C). By contrast, cell divisions were relatively less common in rassf7a mutants. The spindle rotation angles were significantly increased to a great extent in the mutants with an average of 55.76° ± 8.989° (mean ± S.E.M.; Fig 5C–E, Movie EV4). Such abnormal mitotic spindle rotation of NPCs was also present in the rassf7a morphants (Fig EV5A–D). In some case, we could see cell rotates nearly 360° (Movie EV5). Moreover, the rotation defects also delayed the mitosis process as demonstrated by the elongated cell division time (Figs 5F and EV5E).
Figure 5. Abnormal mitotic spindle rotation of NPCs in rassf7a mutants after SCI.
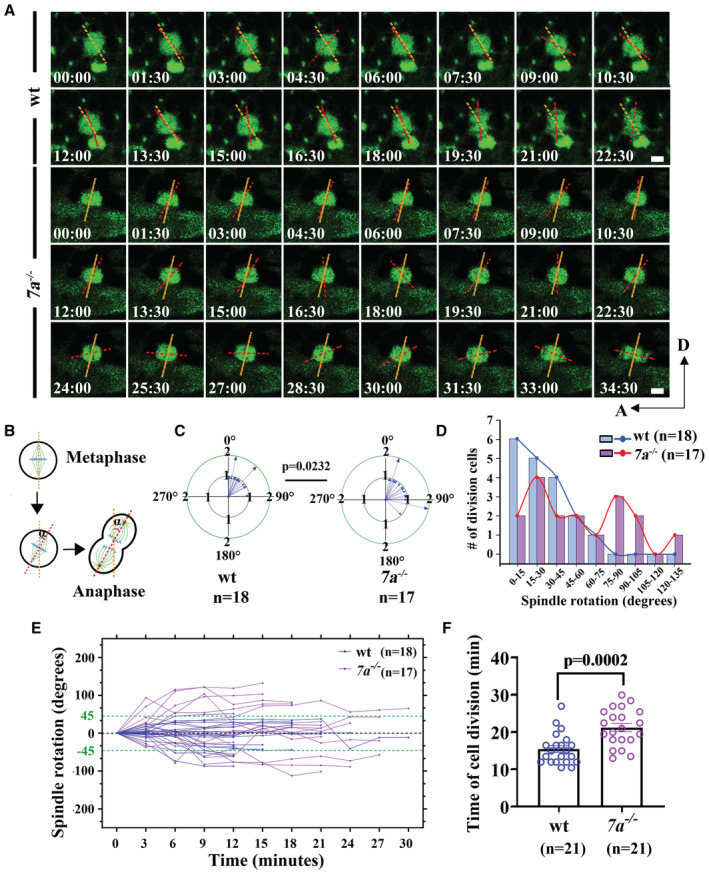
- Sequences of time‐lapse photographs to illustrate mitotic rotation of a single neural progenitor cell in wild‐type or rassf7a mutants expressing Sox2+‐GFP transgene. Anterior is to the left, dorsal is to the up. Time is in min:sec.
- Diagram showing the rotation angles of the spindle axis during metaphase (orange dashed line) to anaphase (red dashed line) transition.
- Statistical analysis of angles of mitotic spindle rotation in wild‐type or rassf7a mutants. The outer circle indicates the same rotation angles occurred in two individual cells. The number of NPCs counted is shown in the bottom.
- Statistical plot showing the distribution of dividing cells with different rotation angles in wild‐type and rassf7a mutants.
- History plots of mitotic spindle orientation in wild‐type and rassf7a mutants at different time points. Green dashed lines indicate 45° spindle rotation.
- Bar graph showing the time of NPCs division in wild‐type and rassf7a mutants.
Data information: P values for unpaired Student's t‐test (C) and Mann–Whitney test (F) are indicated. Data are shown as mean ± S.E.M. Each data point represents a cell. Scale bars: 5 μm.
Figure EV5. Abnormal mitotic spindle rotation of NPCs in rassf7a morphants.
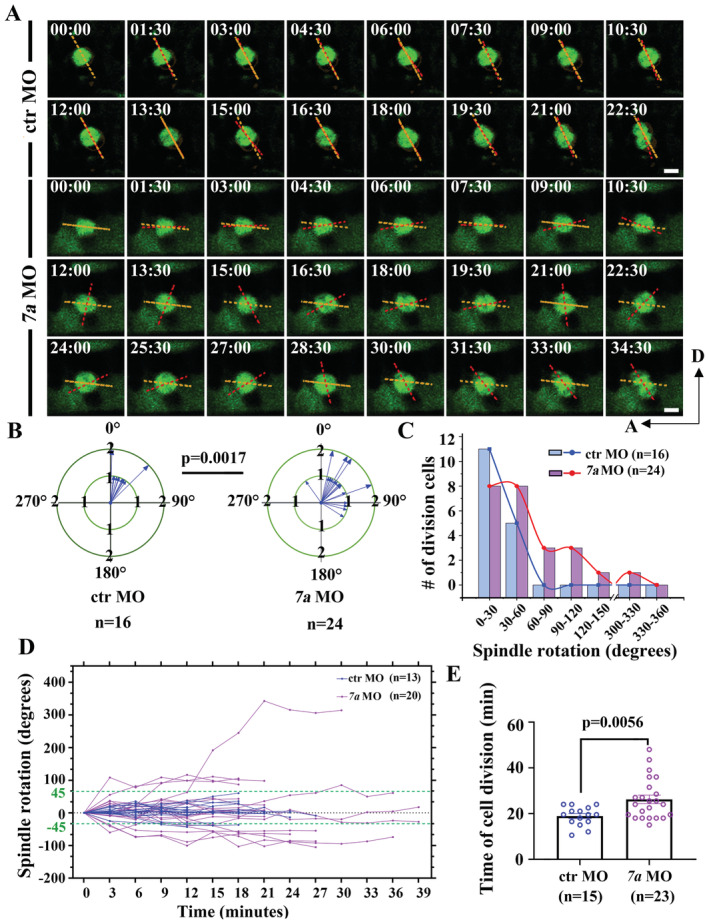
-
ASequences of time‐lapse photographs to illustrate mitotic rotations of a single neural progenitor cell in control or rassf7a morphants expressing Sox2+‐GFP transgene. Anterior is to the left, dorsal is to the up.
-
B, CStatistical analysis of angles of mitotic spindle rotation in control or rassf7a morphants.
-
DHistory plots of mitotic spindle orientation in control or rassf7a morphants at different time points. Green dashed line indicated 45° spindle rotation.
-
EBar graph showing the time of cell division in control or rassf7a morphants.
Data information: P values for unpaired Mann–Whitney test (B) and unpaired Student's t‐test (E) are indicated. Data are shown as mean ± S.E.M. Each data point represents a dividing cell. Scale bars: 5 μm in (A).
Cell divisions of the NPCs can be either symmetric or asymmetric. The symmetric division expands the pool of progenitor cells, while asymmetric division produces another daughter progenitor cell and, most importantly, a second daughter cell that can be further differentiated into neurons (Alexandre et al, 2010). The generation of symmetric or asymmetric cell division is mainly regulated by spindle orientation of the NPCs. During neurogenesis, several studies have showed that neurons are prone to be generated from the more apical daughter cells during the asymmetric perpendicular division (the cleavage plane is close to parallel to the apical surface; Bultje et al, 2009; Alexandre et al, 2010; Dong et al, 2012). Similarly, by microinjecting H2B‐GFP mRNA into the Tg(huc:Gal4;uas‐mCherry) double transgenic embryos, we observed the expression of mCherry in the daughter cells from three out of eight cells undergoing perpendicular division (Movie EV6). In one case, we also found that mCherry proteins are expressed in both daughter cells differentiated from a vertically divided cell (Movie EV7). By contrast, we did not find any red fluorescence signals in the daughter cells from planar symmetric division of the NPCs (n = 8; Movie EV8). These data suggested that perpendicular division of NPCs is critical for the generation of neurons.
Next, we further explored the final orientation of cell divisions by measuring the angles between cell division axis and the anterior–posterior axis (Fig 6A and B). In wild‐type larvae, more than 50% of the progenitor divisions were within 45° of the dorsal‐ventral axis with the maximum occurring in the 75–90° sector, which probably would undergo an asymmetric division to generate differentiating neurons (Fig 6B and C). In rassf7a mutants, over 63% of cell divisions were within 30° of the anterior–posterior axis with the maximum occurring in the 0–15° sector, which were prone to undergo planar division and generate two daughter progenitor cells (Fig 6C). These results were further confirmed via rassf7a morpholino (Fig 6A and D). Together, these time‐lapse results showed that both cell proliferation and spindle orientation of the proliferating NPCs were affected in the absence of Rassf7a.
Figure 6. Spindle orientation defects in rassf7a mutants.
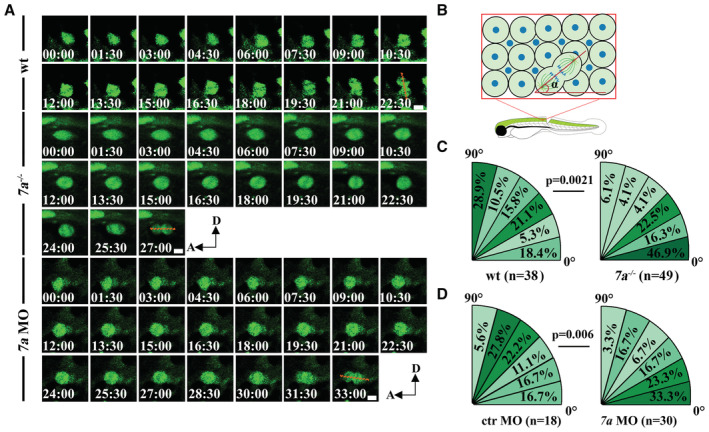
- Time‐lapse images showing representative NPCs undergoing perpendicular (wt) or horizontal (mutant and morphant) cell division. The red dashed lines indicate spindle orientation at anaphase.
- Diagram illustrating how the spindle angle was measured between axes defined by the anaphase spindle and anterior–posterior.
- Distribution of dividing NPCs with different spindle angles in wild‐type and rassf7a mutants.
- Spindle orientation in control and rassf7a morphants. The percentages of progenitor cells with different spindle angles are shown within six 15° sectors. n represents the number of NPCs. Time is in min:sec. Anterior is to the left, dorsal is to the up.
Data information: P values for Fisher's exact test (C, D) are indicated. Scale bars: 5 μm.
RASSF7 is essential for mitosis in cultured cells
The proliferation defects of the NPCs in the mutants suggested a role of Rasssf7 during cell division, which promoted us to further characterize the subcellular localization profile of Rassf7 during mitosis. First, we generated stable cell line expressing Flag‐tagged RASSF7 in hTERT‐RPE‐1 cells and determined the protein localization during mitosis using anti‐Flag antibody. Immunofluorescence showed that RASSF7 localized to the cytoplasm with enrichment in the centrosome during interphase, as demonstrated by the colocalization analysis with γ‐tubulin and PCM1, two centrosomal markers (Fig 7A and B). During mitotic process, RASSF7 was mainly present at the spindle pole regions where centrosomes localize (Fig 7C). We further overexpressed GFP‐tagged Rassf7a into zebrafish embryos and found similar colocalization between Rassf7a and centrosome proteins, γ‐tubulin and Centrin (Appendix Fig S6, Movie EV9). Next, we performed knockdown analysis through siRNA approach. The knockdown efficiency was first evaluated by quantitative real‐time PCR (Fig 7D). Similar to the NPCs in rassf7a mutants, the percentages of proliferating cells were significantly decreased in RASSF7 knockdown cells, as indicated by Ki67 or phospho‐Histone H3 (pH3) antibody staining (Fig 7E–H). Further time‐lapse imaging showed that the average cell division time was substantially delayed in the knockdown cells (Fig 7I and J, Movies EV10 and EV11). What's more, the percentages of dividing cells was also decreased when RASSF7 was depleted (Fig 7K). Thus, both in vitro and in vivo data suggested that RASSF7 played a critical role during cell proliferation.
Figure 7. Knocking down of RASSF7 resulted in cell proliferation defects.
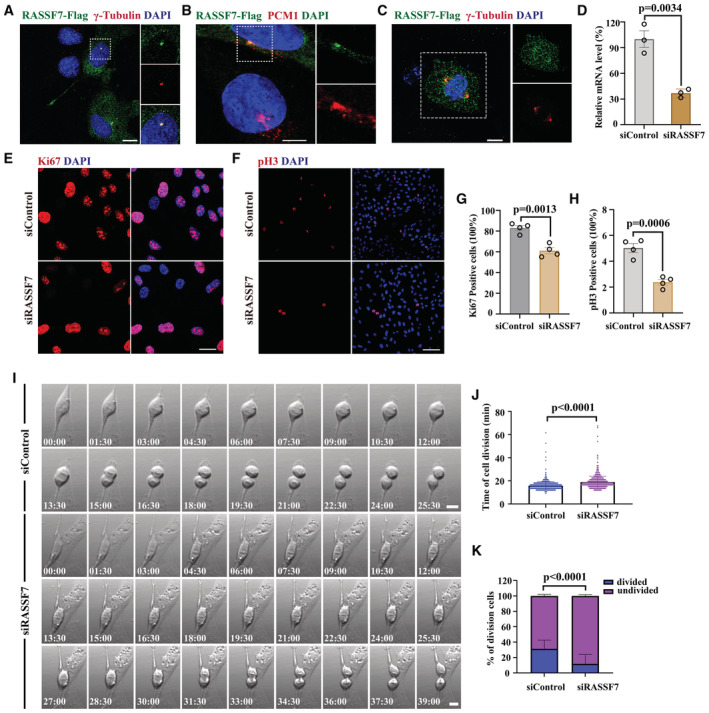
-
A, BSubcellular localization of RASSF7 in hTERT‐RPE‐1 cells. The distribution of RASSF7 was visualized with anti‐Flag antibody (green). The centrosome was stained by anti‐γ‐tubulin (red, A) and anti‐PCM1 (pericentriolar material 1) antibody (red, B), nuclei were labeled with DAPI (blue). N = 3–6 biological replicates per group.
-
CDuring mitosis, localization of RASSF7 was enriched in the spindle poles (green), together with γ‐tubulin (red). N = 6 biological replicates.
-
DqRT‐PCR results showing the relative expression level of RASSF7 in control or siRNA‐treated cells N = 3 biological replicates per group. Each data point represents a biological replicate.
-
E, FRepresentative staining results for Ki67 (red, E) and pH3 (red, F) positive cells in siRNA treated hTERT‐RPE‐1 cells.
-
G, HQuantitative results of the percentages of Ki67 (G) and pH3 (H) positive cells in control or RASSF7 siRNA‐treated cells. N = 4 biological replicates per group. Each data point in (G, H) represents a biological replicate.
-
ISequences of time‐lapse photographs to illustrate mitotic divisions in control or RASSF7 siRNA‐treated hTERT‐RPE‐1cells.
-
JBar graph showing the time of cell division in control or RASSF7 siRNA treated cells. N = 6 biological replicates per group. Each data point represents a cell.
-
KBar graph showing percentages of divided cells in control or RASSF7 siRNA treated groups. N = 6 biological replicates per group.
Data information: P values for unpaired Student's t‐test (D, G, H), Mann–Whitney test (J) and Fisher's Exact test (K) are indicated. Data are shown as mean ± S.E.M. Scale bars: 20 μm in (A, E), 8 μm in (B), 7.5 μm in (C), 100 μm in (F), 10 μm in (I).
Transcriptome analysis showed gene expression changes in rassf7a mutants after SCI
Next, we performed RNA transcriptome analysis on the injury sites of wild‐type and rassf7a mutants at 3 days after injury. In wild‐type larvae, we found about 1,288 differentially expressed genes (DEGs) at this time point of the regeneration process. By contrast, a total of 7,709 DEGs were found between the control and injured mutant groups, clearly suggesting that the whole gene regulatory network was significantly changed in the mutants (Appendix Fig S7A–C). Interestingly, we found many genes involved in cell cycle regulation were upregulated in wild‐type larvae, but remained unchanged in the mutants, and some even showed decreased expression (Appendix Fig S7D). Similarly, we found the expression of genes involved in axon elongation or spindle polarity, such as vangl2, pard3, remain unchanged in the mutants, while the expression of these genes got increased after SCI in control siblings (Appendix Fig S7E and F). Thus, the RNA transcriptome analysis results further demonstrated expression changes of genes involved in cell proliferation and polarity regulation in the absence of Rassf7a after spinal cord injury.
Discussion
Spinal cord injury is a devastating trauma suffered by many people in the world. Unfortunately, neuron regeneration within the injured spinal cord is still unfeasible in mammals and the underlying mechanisms remain poorly understood. By contrast, zebrafish exhibit high regeneration capacity after SCI, providing a powerful model to decode the mechanisms of spinal cord regeneration. Here, we showed that Rassf7a, a member of the Ras‐association domain protein family, regulated spinal cord neurogenesis after SCI. Expression of rassf7a was restricted in the central nervous systems, with higher enrichment in the neural progenitor cells (Figs 1 and 4). Subcellular localization analysis suggested that Rassf7a was a centrosomal protein localized to the spindle pole during cell division. In agreement with this, Rassf7a deficiency resulted in spindle orientation defects during asymmetric division of NPCs. In zebrafish, as well as in mammals, the asymmetric division of NPCs gives rise to one neuronal cell and another NPC, which is the major pathway for newborn neuron development during neurogenesis. In the absence of Rassf7a, the asymmetric division characterized by the presence of cleavage planes perpendicular to the apical‐basal axis of the radial‐glial cells was significantly prohibited, thus less neurons could be generated. By contrast, NPCs were prone to undergo symmetric division in the mutants. Thus, the balance between symmetric and asymmetric division was disrupted in the mutants (Fig 8). In addition to that, the proliferation of NPCs was also prevented in the mutants as demonstrated from both live imaging and PCNA labeling assay. In such case, fewer neurons were generated in the mutants, leading to final regeneration defects.
Figure 8. Model illustrating the role of Rassf7a during cell division of NPCs.
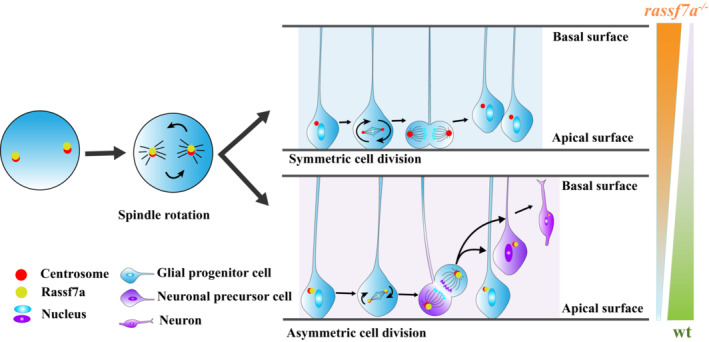
Rassf7a locates to the spindle pole and orchestrates spindle rotation during cell division of neural progenitor cells. Rassf7a deficiency results in spindle orientation defects characterized by increased rotation angles and decreased perpendicular (asymmetric) cell divisions (See Discussion).
How does Rassf7a influence spindle orientation? Spindle orientation is usually regulated by the astral microtubules through interaction with cell cortex. Interestingly, human RASSF7 protein was shown earlier to regulate cellular microtubule dynamics (Recino et al, 2010; Takahashi et al, 2011; Wang et al, 2016). Rassf7a may regulate spindle orientation through mediating the pulling forces generated on the astral microtubules. The detailed regulatory mechanisms are still unknown. Rassf7 has been shown earlier to regulate FGF/MEK/ERK signaling through binding to RAS proteins (Wang et al, 2016; Zhang et al, 2018a). Remarkably, the RAS‐regulated ERK signaling is also vital for the spindle orientation during lung tube development, suggesting a similar role of FGF during spindle polarity establishment (Tang et al, 2011). It is conceivable that Rassf7a may function downstream of FGF signals to activate ERK signaling, which further influences centrosomal components of the mitotic spindle to organize spindle orientation.
Although Rassf7a was strongly expressed in the central nervous systems, CNS development is grossly normal in rassf7a mutant larvae (Appendix Fig S3A–E). Even in the absence of both Rassf7a and Rassf7b proteins, zebrafish mutants could still develop normally in larvae stage. It is possible that other RASSF proteins compensate for the loss of Rassf7 proteins, especially considering the highly conserved protein structures in this family (Richter et al, 2009; Underhill‐Day et al, 2011). After acute spinal cord injury, neural progenitor cells undergo rapid cell proliferation, which may require a high level of Rassf7 proteins to promote neurogenesis as suggested in Fig 4R. The gene regulation systems may fail to fully compensate for the loss of Rassf7a proteins which, eventually, leads to proliferation defects of neural progenitor cells, resulting in delayed axonal regeneration after SCI.
In summary, our data demonstrated the role of Rassf7a during the proliferation of neural progenitor cells after SCI. During spinal cord regeneration, neural progenitor cells represent one of the major resources for the generation of newborn neurons. Recently, transplantation of neural progenitor cells, or other stem cells, has shown promising therapeutic effects both in SCI animal models and human patients (Antonic et al, 2013; Chen et al, 2017). Our data provided a novel function of Rassf7a during the proliferation of neural progenitor cells in an animal model with high spinal cord regeneration capacity. Further in‐depth studies on neuron differentiation mechanisms may help us find better ways to improve axonal regeneration and motor function in SCI patients.
Materials and Methods
Ethics statement
All zebrafish study was conducted according standard animal guidelines and approved by the Animal Care Committee of Ocean University of China (Animal protocol number: OUC2012316).
Animals
All zebrafish strains were maintained at 28°C on a 14‐h (h) light/10‐h dark cycle. Embryos were raised at 28.5°C in E3 medium (5 mM NaCl, 0.17 mM KCl, 0.39 mM CaCl2, 0.67 mM MgSO4) following standard protocols. CRISPR/Cas9 technology was used to generate zebrafish rassf7a mutants with the following target site for single guide (sg) RNA (5′‐AGTCCAAGCAGGGTTTACCT‐3′). The rassf7b mutant strain was constructed using the TALEN system with the following binding sequences: 5′‐TATGTTCTCATCCAGAAAC‐3′ and 5′‐GGCAGCTTATGGCCAATGA‐3′. The sgRNA synthesis and TALEN plasmids constructions were similar to previously described (Zhang et al, 2018b). The primer sequences used for mutant detection were listed in Appendix Table S1. The Tg(huc:GFP) and Tg(gfap:GFP) transgenes were gifts from Dr. Jiulin Du (Institute of Neuroscience, Shanghai), the Tg(sox2:sox2‐2a‐sfGFP) was a gift from Dr. Lilianna Solnica‐Krezel. The Tg(foxj1a:HA‐tdTomato) was generated using Multisite Gateway recombination with the following constructs: pDEST vector, p5e‐foxj1a, pDONR221‐HA‐tdTomato and p3e‐polyA. Multisite gateway cloning was performed according to the standard protocol from Invitrogen (Life Technologies).
In situ hybridization
Full length or partial cDNA fragments were PCR amplified from a 24 hpf wild‐type zebrafish cDNA library and cloned into pGEM‐T vector. The primer sequences used for PCR amplification were listed in Appendix Table S1. Probe preparation and whole mount in situ hybridization were carried out following standard protocols. For fluorescence in situ hybridization, zebrafish embryos were first incubated with digoxigenin‐ and fluorescein‐labeled RNA probes, then followed by sequential detection using POD labeled anti‐Digoxigenin and POD labeled anti‐Fluorescein antibodies. Briefly, embryos were first incubated with probes for hybridization, then serially washed with 50% formamide/2 × SSCT, 2 × SSCT, 0.2 × SSCT, MABT (100 mM Maleic acid, 150 mM NaCl, 1‰ Tween‐20) and PBST. After that, embryos were refixed in 4% PFA for 4 h at room temperature (RT), cryoprotected in 30% sucrose at 4°C overnight, then further processed for cryosectioning. After briefly washing with PBST and MABT, slides were blocked in blocking solution for 30 min at RT, then incubated with POD labeled anti‐Digoxigenin antibody at 4°C overnight. Next day, the digoxigenin‐labeled probe was first detected with TSA Plus Cy3 Solution (Perkin Elmer). After signal quenching steps, the slides were incubated again with POD labeled anti‐Fluorescein antibody at 4°C overnight. Finally, the slides were washed and detected with TSA Plus Fluorescein solution (Perkin Elmer). The staining images were captured with Leica SP8 confocal microscope.
Spinal cord injury
Three dpf zebrafish larvae were first anesthetized with 0.01% Tricaine in E3 water, then placed on another Petri dish to remove excess medium. The spinal cord was transected with a beveled microinjection pipette at the dorsal site above the end of the yolk extension, and the notochord and major blood vessels should be intact to ensure a > 95% survival rate at 5 dpi for both mutant and control larvae. After injury, the larvae were placed in a 96‐well plate with fresh E3‐water to recover for 2 h. Then, the dead larvae were removed and survived larvae were changed with fresh E3 water, and cultured for further analysis (Fig EV1A and B).
Locomotion behavior assessment
Individual zebrafish larva was transferred into 24‐well plate with fresh E3 medium at 6 days after injury. Then, the plate was placed inside the Daniovision (Noldus) observation chamber for further behavior analysis. Video‐tracking of swimming activity, tapping stimulation experiments and further statistical analysis were performed using the EthoVision™ XT10 software. Behavioral data were shown as total swim distance (cm), average velocity (cm/s) and cumulative duration time (s) at a duration for 500 s or 300 s.
BrdU labeling and immunohistochemistry
For BrdU labeling assay, 10–15 embryos were first transferred into 48‐well plate shortly after injury, or at 2 and 4 days after injury, then incubated with 10 mM BrdU (Invitrogen) in E3 culture medium for 1 h at 28.5°C. After that, the culture medium was replaced with fresh E3 medium for 24 h, then the treated larvae were fixed with 4% PFA overnight at 4°C. After briefly wash with PBST, the fixed larvae were cryoprotected in 30% sucrose overnight. Approximately 800 μm fragments located proximal to the damaged site from both sides of the lesion were collected and embedded in OCT medium. Coronal sections were collected from dorsal to ventral at 14 μm thickness on a Leica CM1850 cryostat. Sections were further incubated in 2 N HCl for 90 min at room temperature, then proceeded for immunostaining. For PCNA antibodies immunofluorescence staining, embryos were fixed in 4% PFA at 4°C overnight, then embryos were further proceeded for cryosectioning. Antigen retrieval was performed on sections by incubating with 10 mM sodium citrate for 30 min at 65°C, followed by regular immunostaining protocol. Immunohistochemistry on whole‐mount larvae and cryosections were performed as previously described (Leventea et al, 2016). The following antibodies were used: rabbit anti‐acetylated α Tubulin (1:500, Cell Signaling Technology), rabbit anti‐Sox2 (1:500, Abcam), mouse anti‐BrdU (1:500, Invitrogen), mouse anti‐PCNA (1:500, Sigma), rabbit anti‐γ‐Tubulin (1:2,000, Sigma‐Aldrich), mouse anti‐Flag (1:200, Sigma‐Aldrich), rabbit anti‐PCM1 (1:1,000, Cell Signaling Technology), rabbit anti‐Ki67 (1:300, Abcam), rabbit anti‐pH3 (1:500, Bethyl Laboratories).
Overexpression and knockdown experiments
For rescue experiments, full‐length rassf7a gene was first cloned into pDONR221 Gateway entry vector, then final construct was made by Multisite Gateway technology with the following vectors: p5e‐hsp70l, pDONR221‐rassf7a, p2rp3‐HA‐tdTomato and pDestTol2. For control experiments, the pDONR221‐rassf7a, p2rp3‐HA‐tdTomato was replaced by pDONR221‐HA‐tdTomato, p3e‐polyA respectively. Both rassf7a and control plasmids were microinjected into single‐cell stage embryos at a concentration of 40 ng/μl, together with 50 ng/μl transposase mRNA. The injected embryos were first heat induced at 24 hpf for 4 h at 37°C, then fluorescent embryos were collected and further transferred into a new Petri dish containing fresh E3 medium. These embryos were further maintained at 28.5°C. At 3 dpf, embryos were heat induced at 37°C for 4 h, then followed by spinal cord injury. After that, embryos were maintained at 28.5°C and heat induced every day for 2 h periodically until further analysis.
To knockdown the expression of rassf7a in wild‐type larvae, 1 μl of rassf7a vivo morpholino (5′‐AGCTCCATCAGAGGCACCAAGCACA‐3′) was injected at both sides of the lesion site at a concentration of 0.25 mM immediately after SCI. A standard control vivo morpholino (5′‐CCTCTTACCTCAGTTACAATTTATA‐3′) was injected similarly. The injected larvae were collected at different time points after injury for further analysis. To verify the efficiency of rassf7a morpholino, we first cloned the exon of rassf7a containing the translation start site and morpholino binding site, and then fused in frame to the N‐terminus of GFP driven by a CMV promoter. The report construct was injected together with rassf7a or control morpholinos to test the expression of GFP. The primer sequences used for generating the constructs were listed in Appendix Table S1.
Fluorescence‐activated cell sorting (FACS)
To isolated single cells expressing Huc or Sox2, about one hundred 3 dpf zebrafish larvae carrying Tg(huc:GFP) or Tg(sox2:sox2‐2a‐sfGFP) transgene were first anesthetized and decapitated with tweezers. The trunk containing the whole spinal cord was transferred into 1.5 ml microcentrifuge tubes (50 larvae per tube), then washed with Dulbecco's Phosphate Buffered Saline (D‐PBS) without calcium and magnesium (Sangon Biotech, # E607009). After briefly dissociated with 1 ml pepet tips, 60 μl 0.25% trypsin was added to the tube and incubated at 37°C for 20 min. After that, the digestion reaction was stopped by adding 600 μl DMEM containing 30% FBS for 5 min, then centrifuged at 700 g for 5 min. After briefly wash with D‐PBS, the cell suspension was filtered with 40 μm nylon mesh (Sangon Biotech, # F613461). The GFP‐positive cells were collected using WOLF G2 (NanoCellect) or BD FACSAria II (BD Biosciences). Total RNA from 1 × 10⁶ sorting cells was extracted with the RNAqueous™‐Micro Total RNA Isolation Kit (ThermoFisher, # AM1931).
Quantitative RT‐PCR
Reverse transcription of RNA was performed with HiScript III RT SuperMix for qPCR kit (Vazyme, # R323‐01). qRT‐PCR was set up using the Eva‐Green Master Mix (ABM) and performed on the StepOne real‐time PCR system (Thermo Scientific). The amplification condition parameters were 95°C for 15 s, followed by 40 cycles of 95°C for 5 s, 60°C for 15 s, and 72°C for 35 s. Each samples had triplicate reactions. Relative gene expression levels were quantified using the comparative C T method (2−ΔΔCT method) on the basis of C T values for target genes and zebrafish β‐actin. Primer were designed to span an exon–exon junction using Oligo 7 software. Primer sequences are listed in Appendix Table S1.
RNA‐seq transcriptome analysis
The trunk regions covering the injury sites were collected from 50 larvae at 3 dpi and immediately transferred into Trizol solution (Takara). Total RNAs were isolated from these samples in triplicate. Bulk RNA sequencing was performed by Novogene using Illumina HiSeq X Ten (Novogene Bioinformatics Technology Co., Ltd., Tianjin, China). Data processing was similar to previously described (Xie et al, 2020).
Cell culture and knockdown analysis
The hTERT‐RPE‐1 cells were grown in DMEM/F12 (Gibco) media supplemented with 10% fetal bovine serum (FBS; Gibco, Grand Island, NY, USA) and 100 IU/ml of penicillin/streptomycin (Gibco), and maintained at 37°C in a humidified incubator supplied with 5% CO2. The expression vector RASSF7‐Flag plasmid was transfected with plasmids psPAX2 and pMD2.G (Addgene) into HEK293T cells following previously described protocols (Luo et al, 2021). The supernatant containing virus was filtered through a 0.45‐μm membrane and then was added to RPE‐1 cells with 6 μg/ml of polybrene (sc‐134220; Santa Cruz). Forty‐eight hours later, fresh medium containing 8 μg/ml puromycin was added to replace the virus‐containing medium. Puromycin selection lasted for 2 weeks. The stable line was then used for subcellular localization analysis. For knockdown assay, the transfections of siRNAs were performed using Lipofectamine RNAiMAX (13778; Invitrogen). The final concentrations of siRNAs were 30 nM. Control siRNA and RASSF7 siRNA were obtained from Dharmacon, the siRNA sequence of RASSF7 was: 5′‐UAAUUCGUGCCAGCCUCCCUGUAAA‐3′, a general sequence of 5′‐UUCUCCGAACGUGUCACGU‐3′ was used as a negative control.
For live‐cell time‐lapse study, cells treated with RASSF7 siRNA (siRASSF7) or control siRNA (siControl) for 48 h, and then maintained at 37°C in fresh medium (Invitrogen) and monitored with a spinning disk confocal microscopy (Lecia) equipped with a temperature‐controlled apparatus. DIC (Differential Interference Contrast) still time‐lapse images were acquired with 20×/0.55 objective in multi‐position mode, at 1 μm spacing and 1,024 × 1,024‐pixel resolution every 90 s for 12 h using Andor Dragonfly 200 high speed confocal platform system and Andor IXON‐L‐888 EMCCD camera controlled by Andor Fusion software. The movies were generated using the Image J software (NIH Image, Bethesda, MD, USA).
Time‐lapse imaging and spindle orientation analysis
The Tg(sox2:sox2‐2a‐sfGFP) knockin transgenic larvae were microinjected with control or rassf7a vivo morpholino immediately after spinal cord injury. At 1 dpi, the larvae were anesthetized with 0.16 mg/ml Tricaine (Sigma), mounted in 1% low melting‐point agarose (Sigma) in glass‐bottom dishes (FD35‐100, WPI), then covered with E3 water containing 0.04 mg/ml Tricaine. Time‐lapse images were collected with IXON‐L‐888 EMCCD camera equipped on Dragonfly 200 Spinning Disk Confocal Microscope using a 40×/1.10 water objective. Z‐stack images were collected every 90 s for a duration of 12 h. Images were further analyzed with Fusion or ImageJ software.
To quantify spindle rotation, the angles were calculated between the longer axis of metaphase and anaphase stages (Fig 5B). For spindle orientation analysis, we drew a line across the spindle poles at mitosis telophase stage, and considered the angle between this line and antero‐posterior axis as a criterion for spindle orientation (Fig 6B). Spindle orientation in control and rassf7a mutant or morphant cells were quantified using ImageJ software.
To trace the symmetric and asymmetric division of neural progenitor cells, zebrafish embryos carrying Tg(huc:Gal4;uas‐mcherry) transgene were microinjected with H2B‐GFP mRNA at one cell stage. At 24 hpf, the embryos were anesthetized with 0.16 mg/ml Tricaine, mounted in 1% low melting‐point agarose (Sigma) in glass‐bottom dishes (FD35‐100, WPI), then covered with E3 water containing 0.04 mg/ml Tricaine. Time‐lapse images were collected with IXON‐L‐888 EMCCD camera equipped on Dragonfly 200 Spinning Disk Confocal Microscope using a 40×/1.10 water objective. Z‐stack images were collected every 90 s for a duration of 8–12 h. Images were further analyzed with Fusion or ImageJ software.
Quantifications and statistical analysis
To measure GFP expression level at the lesion sites, we first took both bright field and fluorescence images using Leica M165FC stereomicroscope with the same magnification. Then, a 837 μm × 417 μm area covering the entire lesion site of each zebrafish larva was selected to measure the green fluorescence area (Fig 2A).The areas of GFP expression and entire neural tube (red dased box in Fig 2A) were measured from each fluorescence and bright field image using ImageJ software, and the ratios were used to evaluate the regeneration efficiency of each zebrafish larva.
For cell proliferation assay, we selected a grid (200 μm2) next to the injury sites (within 300 μm) on the coronal sections of the spinal cord. Within each grid, the number of cells that were labeled with both BrdU (or PCNA) and GFP was counted using Adobe Photoshop CS6. The ratio of these double labeled cells to single GFP‐positive cells within the selected area was calculated for each larva to evaluate cell proliferating levels.
The quantification of axonal and glial fascicle was performed following previous studies (Wehner et al, 2017). Briefly, fascicles were identified as fluorescent protrusions that projected into the injury site for at least 20 μm or completely through the injury site. The fascicles containing both glial and neuronal fluorescence expression were classified as “mixed,” otherwise were classified as purely “axonal” or “glial”.
All experiments were performed at least three times. The quantitative data were tested for normality and analyzed with parametric and non‐parametric tests as appropriate. Analysis of the data were not randomized or blinded. All the statistical methods used were indicated in each figure legend and summarized in Appendix Table S2. Differences were considered statistically significant at P values below 0.05. Variance for all groups data is presented as ± standard error of the mean (S.E.M.). Graphs were generated using GraphPad Prism 8.0.2 and SPSS Statistics 23.0.
Author contributions
Panpan Zhu: Data curation; software; formal analysis; validation; investigation; visualization; methodology; writing – original draft. Pengfei Zheng: Data curation; software; formal analysis; validation; visualization; methodology. Xinlong Kong: Validation; visualization; methodology. Shuo Wang: Software; investigation; visualization; methodology. Muqing Cao: Funding acquisition; methodology; writing – original draft; writing – review and editing. Chengtian Zhao: Conceptualization; supervision; funding acquisition; writing – original draft; project administration; writing – review and editing.
Disclosure and competing interests statement
The authors declare that they have no conflict of interest.
Supporting information
Appendix
Expanded View Figures PDF
Movie EV1
Movie EV2
Movie EV3
Movie EV4
Movie EV5
Movie EV6
Movie EV7
Movie EV8
Movie EV9
Movie EV10
Movie EV11
PDF+
Acknowledgements
The authors thank Dr. Lilianna Solnica‐Krezel for providing the Tg(sox2:sox2‐2a‐sfGFP) knockin transgenic line, Dr. Jiulin Du for providing the Tg(huc:GFP) and Tg(gfap:GFP) zebrafish lines, and Dr. Brian Ciruna and Dr. Seok‐Yong for providing the p5E‐ foxj1a plasmid. We also thanks Dr. Hongyan Li for the excellent support of the rassf7b TALEN experiments, and Dr. Linjia Jiang, Dr. Dong Liu, Dr. Jifeng Fei and Dr. Wei Wang for their kind help on the preparation of this manuscript. This work was supported by the National Natural Science Foundation of China (Nos. 31991194, 32125015) to CZ and the National Key Research and Development Program of China (2021YFC2700800), the National Natural Science Foundation of China (91954123 and 31972887), Shanghai Science and Technology Commission (20JC1410100), and Innovative research team of high‐level local universities in Shanghai (SHSMU‐ZDCX20211800) to MC.
EMBO Reports (2023) 24: e54984.
Contributor Information
Muqing Cao, Email: muqingcao@sjtu.edu.cn.
Chengtian Zhao, Email: chengtian_zhao@ouc.edu.cn.
Data availability
Bulk RNA‐seq data has been deposited to the Sequence Read Archive (SRA) database under accession numbers PRJNA876641 (https://www.ncbi.nlm.nih.gov/bioproject/PRJNA876641). The single‐cell RNA sequencing datasets used in Fig EV4 were from two published single‐cell transcriptomes (accession number: E-MTAB-10390: https://www.ebi.ac.uk/biostudies/arrayexpress/studies/E-MTAB-10390 and GSE173350: https://www.ncbi.nlm.nih.gov/geo/query/acc.cgi?acc=GSE173350).
References
- Ahuja CS, Wilson JR, Nori S, Kotter MRN, Druschel C, Curt A, Fehlings MG (2017) Traumatic spinal cord injury. Nat Rev Dis Primers 3: 17018 [DOI] [PubMed] [Google Scholar]
- Alexandre P, Reugels AM, Barker D, Blanc E, Clarke JD (2010) Neurons derive from the more apical daughter in asymmetric divisions in the zebrafish neural tube. Nat Neurosci 13: 673–679 [DOI] [PubMed] [Google Scholar]
- Antonic A, Sena ES, Lees JS, Wills TE, Skeers P, Batchelor PE, Macleod MR, Howells DW (2013) Stem cell transplantation in traumatic spinal cord injury: a systematic review and meta‐analysis of animal studies. PLoS Biol 11: e1001738 [DOI] [PMC free article] [PubMed] [Google Scholar]
- Becker CG, Becker T (2015) Neuronal regeneration from ependymo‐radial glial cells: cook, little pot, cook! Dev Cell 32: 516–527 [DOI] [PubMed] [Google Scholar]
- Becker CG, Lieberoth BC, Morellini F, Feldner J, Becker T, Schachner M (2004) L1.1 is involved in spinal cord regeneration in adult zebrafish. J Neurosci 24: 7837–7842 [DOI] [PMC free article] [PubMed] [Google Scholar]
- Becker CG, Becker T, Hugnot JP (2018) The spinal ependymal zone as a source of endogenous repair cells across vertebrates. Prog Neurobiol 170: 67–80 [DOI] [PubMed] [Google Scholar]
- Bhatt DH, Otto SJ, Depoister B, Fetcho JR (2004) Cyclic AMP‐induced repair of zebrafish spinal circuits. Science 305: 254–258 [DOI] [PubMed] [Google Scholar]
- Bradbury EJ, Burnside ER (2019) Moving beyond the glial scar for spinal cord repair. Nat Commun 10: 3879 [DOI] [PMC free article] [PubMed] [Google Scholar]
- Briona LK, Dorsky RI (2014) Radial glial progenitors repair the zebrafish spinal cord following transection. Exp Neurol 256: 81–92 [DOI] [PMC free article] [PubMed] [Google Scholar]
- Briona LK, Poulain FE, Mosimann C, Dorsky RI (2015) Wnt/ss‐catenin signaling is required for radial glial neurogenesis following spinal cord injury. Dev Biol 403: 15–21 [DOI] [PMC free article] [PubMed] [Google Scholar]
- Bultje RS, Castaneda‐Castellanos DR, Jan LY, Jan YN, Kriegstein AR, Shi SH (2009) Mammalian Par3 regulates progenitor cell asymmetric division via notch signaling in the developing neocortex. Neuron 63: 189–202 [DOI] [PMC free article] [PubMed] [Google Scholar]
- Cavone L, McCann T, Drake LK, Aguzzi EA, Oprisoreanu AM, Pedersen E, Sandi S, Selvarajah J, Tsarouchas TM, Wehner D et al (2021) A unique macrophage subpopulation signals directly to progenitor cells to promote regenerative neurogenesis in the zebrafish spinal cord. Dev Cell 56: 1617–1630 [DOI] [PubMed] [Google Scholar]
- Chen B, Xiao Z, Zhao Y, Dai J (2017) Functional biomaterial‐based regenerative microenvironment for spinal cord injury repair. Natl Sci Rev 4: 530–532 [Google Scholar]
- Dias TB, Yang YJ, Ogai K, Becker T, Becker CG (2012) Notch signaling controls generation of motor neurons in the lesioned spinal cord of adult zebrafish. J Neurosci 32: 3245–3252 [DOI] [PMC free article] [PubMed] [Google Scholar]
- Dong Z, Yang N, Yeo SY, Chitnis A, Guo S (2012) Intralineage directional notch signaling regulates self‐renewal and differentiation of asymmetrically dividing radial glia. Neuron 74: 65–78 [DOI] [PMC free article] [PubMed] [Google Scholar]
- Essner JJ, Amack JD, Nyholm MK, Harris EB, Yost HJ (2005) Kupffer's vesicle is a ciliated organ of asymmetry in the zebrafish embryo that initiates left‐right development of the brain, heart and gut. Development 132: 1247–1260 [DOI] [PubMed] [Google Scholar]
- Fededa JP, Esk C, Mierzwa B, Stanyte R, Yuan S, Zheng H, Ebnet K, Yan W, Knoblich JA, Gerlich DW (2016) MicroRNA‐34/449 controls mitotic spindle orientation during mammalian cortex development. EMBO J 35: 2386–2398 [DOI] [PMC free article] [PubMed] [Google Scholar]
- Fei JF, Schuez M, Tazaki A, Taniguchi Y, Roensch K, Tanaka EM (2014) CRISPR‐mediated genomic deletion of Sox2 in the axolotl shows a requirement in spinal cord neural stem cell amplification during tail regeneration. Stem Cell Reports 3: 444–459 [DOI] [PMC free article] [PubMed] [Google Scholar]
- Ghosh S, Hui SP (2018) Axonal regeneration in zebrafish spinal cord. Regeneration (Oxf) 5: 43–60 [DOI] [PMC free article] [PubMed] [Google Scholar]
- Goldshmit Y, Sztal TE, Jusuf PR, Hall TE, Nguyen‐Chi M, Currie PD (2012) Fgf‐dependent glial cell bridges facilitate spinal cord regeneration in zebrafish. J Neurosci 32: 7477–7492 [DOI] [PMC free article] [PubMed] [Google Scholar]
- Goldshmit Y, Frisca F, Pinto AR, Pebay A, Tang JK, Siegel AL, Kaslin J, Currie PD (2014) Fgf2 improves functional recovery‐decreasing gliosis and increasing radial glia and neural progenitor cells after spinal cord injury. Brain Behav 4: 187–200 [DOI] [PMC free article] [PubMed] [Google Scholar]
- Goldshmit Y, Tang J, Siegel AL, Nguyen PD, Kaslin J, Currie PD, Jusuf PR (2018) Different Fgfs have distinct roles in regulating neurogenesis after spinal cord injury in zebrafish. Neural Dev 13: 24 [DOI] [PMC free article] [PubMed] [Google Scholar]
- Graham V, Khudyakov J, Ellis P, Pevny L (2003) SOX2 functions to maintain neural progenitor identity. Neuron 39: 749–765 [DOI] [PubMed] [Google Scholar]
- Gulsen T, Hadjicosti I, Li Y, Zhang X, Whitley PR, Chalmers AD (2016) Truncated RASSF7 promotes centrosomal defects and cell death. Dev Biol 409: 502–517 [DOI] [PubMed] [Google Scholar]
- Han X, Xie H, Wang Y, Zhao C (2018) Radial spoke proteins regulate otolith formation during early zebrafish development. FASEB J 32: 3984–3992 [DOI] [PubMed] [Google Scholar]
- Haydar TF, Ang E Jr, Rakic P (2003) Mitotic spindle rotation and mode of cell division in the developing telencephalon. Proc Natl Acad Sci U S A 100: 2890–2895 [DOI] [PMC free article] [PubMed] [Google Scholar]
- Hui SP, Dutta A, Ghosh S (2010) Cellular response after crush injury in adult zebrafish spinal cord. Dev Dyn 239: 2962–2979 [DOI] [PubMed] [Google Scholar]
- Hui SP, Nag TC, Ghosh S (2015) Characterization of proliferating neural progenitors after spinal cord injury in adult zebrafish. PLoS One 10: e0143595 [DOI] [PMC free article] [PubMed] [Google Scholar]
- Kaltschmidt JA, Davidson CM, Brown NH, Brand AH (2000) Rotation and asymmetry of the mitotic spindle direct asymmetric cell division in the developing central nervous system. Nat Cell Biol 2: 7–12 [DOI] [PubMed] [Google Scholar]
- Kitagawa D, Kajiho H, Negishi T, Ura S, Watanabe T, Wada T, Ichijo H, Katada T, Nishina H (2006) Release of RASSF1C from the nucleus by Daxx degradation links DNA damage and SAPK/JNK activation. EMBO J 25: 3286–3297 [DOI] [PMC free article] [PubMed] [Google Scholar]
- Klatt Shaw D, Saraswathy VM, Zhou L, McAdow AR, Burris B, Butka E, Morris SA, Dietmann S, Mokalled MH (2021) Localized EMT reprograms glial progenitors to promote spinal cord repair. Dev Cell 56: 613–626 [DOI] [PMC free article] [PubMed] [Google Scholar]
- Ko CC, Tu TH, Wu JC, Huang WC, Tsai YA, Huang SF, Huang HC, Cheng H (2018) Functional improvement in chronic human spinal cord injury: four years after acidic fibroblast growth factor. Sci Rep 8: 12691 [DOI] [PMC free article] [PubMed] [Google Scholar]
- Konno D, Shioi G, Shitamukai A, Mori A, Kiyonari H, Miyata T, Matsuzaki F (2008) Neuroepithelial progenitors undergo LGN‐dependent planar divisions to maintain self‐renewability during mammalian neurogenesis. Nat Cell Biol 10: 93–101 [DOI] [PubMed] [Google Scholar]
- Leventea E, Hazime K, Zhao C, Malicki J (2016) Analysis of cilia structure and function in zebrafish. Methods Cell Biol 133: 179–227 [DOI] [PubMed] [Google Scholar]
- Luo M, Lin Z, Zhu T, Jin M, Meng D, He R, Cao Z, Shen Y, Lu C, Cai R et al (2021) Disrupted intraflagellar transport due to IFT74 variants causes Joubert syndrome. Genet Med 23: 1041–1049 [DOI] [PubMed] [Google Scholar]
- Mokalled MH, Patra C, Dickson AL, Endo T, Stainier DY, Poss KD (2016) Injury‐induced ctgfa directs glial bridging and spinal cord regeneration in zebrafish. Science 354: 630–634 [DOI] [PMC free article] [PubMed] [Google Scholar]
- Ogai K, Nakatani K, Hisano S, Sugitani K, Koriyama Y, Kato S (2014) Function of Sox2 in ependymal cells of lesioned spinal cords in adult zebrafish. Neurosci Res 88: 84–87 [DOI] [PubMed] [Google Scholar]
- Ohnmacht J, Yang Y, Maurer GW, Barreiro‐Iglesias A, Tsarouchas TM, Wehner D, Sieger D, Becker CG, Becker T (2016) Spinal motor neurons are regenerated after mechanical lesion and genetic ablation in larval zebrafish. Development 143: 1464–1474 [DOI] [PMC free article] [PubMed] [Google Scholar]
- O'Shea TM, Burda JE, Sofroniew MV (2017) Cell biology of spinal cord injury and repair. J Clin Invest 127: 3259–3270 [DOI] [PMC free article] [PubMed] [Google Scholar]
- Postiglione MP, Juschke C, Xie Y, Haas GA, Charalambous C, Knoblich JA (2011) Mouse inscuteable induces apical‐basal spindle orientation to facilitate intermediate progenitor generation in the developing neocortex. Neuron 72: 269–284 [DOI] [PMC free article] [PubMed] [Google Scholar]
- Recino A, Sherwood V, Flaxman A, Cooper WN, Latif F, Ward A, Chalmers AD (2010) Human RASSF7 regulates the microtubule cytoskeleton and is required for spindle formation, Aurora B activation and chromosomal congression during mitosis. Biochem J 430: 207–213 [DOI] [PMC free article] [PubMed] [Google Scholar]
- Reimer MM, Sorensen I, Kuscha V, Frank RE, Liu C, Becker CG, Becker T (2008) Motor neuron regeneration in adult zebrafish. J Neurosci 28: 8510–8516 [DOI] [PMC free article] [PubMed] [Google Scholar]
- Richter AM, Pfeifer GP, Dammann RH (2009) The RASSF proteins in cancer; from epigenetic silencing to functional characterization. Biochim Biophys Acta 1796: 114–128 [DOI] [PubMed] [Google Scholar]
- Schwab ME, Bartholdi D (1996) Degeneration and regeneration of axons in the lesioned spinal cord. Physiol Rev 76: 319–370 [DOI] [PubMed] [Google Scholar]
- Scott K, O'Rourke R, Winkler CC, Kearns CA, Appel B (2021) Temporal single‐cell transcriptomes of zebrafish spinal cord pMN progenitors reveal distinct neuronal and glial progenitor populations. Dev Biol 479: 37–50 [DOI] [PMC free article] [PubMed] [Google Scholar]
- Shao W, Yang J, He M, Yu XY, Lee CH, Yang Z, Joyner AL, Anderson KV, Zhang J, Tsou MB et al (2020) Centrosome anchoring regulates progenitor properties and cortical formation. Nature 580: 106–112 [DOI] [PMC free article] [PubMed] [Google Scholar]
- Sherwood V, Manbodh R, Sheppard C, Chalmers AD (2008) RASSF7 is a member of a new family of RAS association domain‐containing proteins and is required for completing mitosis. Mol Biol Cell 19: 1772–1782 [DOI] [PMC free article] [PubMed] [Google Scholar]
- Shin J, Chen J, Solnica‐Krezel L (2014) Efficient homologous recombination‐mediated genome engineering in zebrafish using TALE nucleases. Development 141: 3807–3818 [DOI] [PMC free article] [PubMed] [Google Scholar]
- Shohayeb B, Muzar Z, Cooper HM (2021) Conservation of neural progenitor identity and the emergence of neocortical neuronal diversity. Semin Cell Dev Biol 118: 4–13 [DOI] [PubMed] [Google Scholar]
- Silver J, Miller JH (2004) Regeneration beyond the glial scar. Nat Rev Neurosci 5: 146–156 [DOI] [PubMed] [Google Scholar]
- Song Z, Zhang X, Jia S, Yelick PC, Zhao C (2016) Zebrafish as a model for human ciliopathies. J Genet Genomics 43: 107–120 [DOI] [PubMed] [Google Scholar]
- Strand NS, Hoi KK, Phan TMT, Ray CA, Berndt JD, Moon RT (2016) Wnt/beta‐catenin signaling promotes regeneration after adult zebrafish spinal cord injury. Biochem Biophys Res Commun 477: 952–956 [DOI] [PubMed] [Google Scholar]
- Suzuki M, Satoh A, Ide H, Tamura K (2005) Nerve‐dependent and ‐independent events in blastema formation during xenopus froglet limb regeneration. Dev Biol 286: 361–375 [DOI] [PubMed] [Google Scholar]
- Takahashi S, Ebihara A, Kajiho H, Kontani K, Nishina H, Katada T (2011) RASSF7 negatively regulates pro‐apoptotic JNK signaling by inhibiting the activity of phosphorylated‐MKK7. Cell Death Differ 18: 645–655 [DOI] [PMC free article] [PubMed] [Google Scholar]
- Tang N, Marshall WF, McMahon M, Metzger RJ, Martin GR (2011) Control of mitotic spindle angle by the RAS‐regulated ERK1/2 pathway determines lung tube shape. Science 333: 342–345 [DOI] [PMC free article] [PubMed] [Google Scholar]
- Tazaki A, Tanaka EM, Fei JF (2017) Salamander spinal cord regeneration: the ultimate positive control in vertebrate spinal cord regeneration. Dev Biol 432: 63–71 [DOI] [PubMed] [Google Scholar]
- Tsata V, Mollmert S, Schweitzer C, Kolb J, Mockel C, Bohm B, Rosso G, Lange C, Lesche M, Hammer J et al (2021) A switch in pdgfrb(+) cell‐derived ECM composition prevents inhibitory scarring and promotes axon regeneration in the zebrafish spinal cord. Dev Cell 56: 509–524 [DOI] [PubMed] [Google Scholar]
- Underhill‐Day N, Hill V, Latif F (2011) N‐terminal RASSF family (RASSF7‐RASSF10) a mini review. Epigenetics 6: 284–292 [DOI] [PMC free article] [PubMed] [Google Scholar]
- Wang SK, Liang QL, Qiao HM, Li H, Shen TJ, Ji F, Jiao JW (2016) DISC1 regulates astrogenesis in the embryonic brain via modulation of RAS/MEK/ERK signaling through RASSF7. Development 143: 2732–2740 [DOI] [PubMed] [Google Scholar]
- Wehner D, Tsarouchas TM, Michael A, Haase C, Weidinger G, Reimer MM, Becker T, Becker CG (2017) Wnt signaling controls pro‐regenerative collagen XII in functional spinal cord regeneration in zebrafish. Nat Commun 8: 126 [DOI] [PMC free article] [PubMed] [Google Scholar]
- Xie H, Kang Y, Wang S, Zheng P, Chen Z, Roy S, Zhao C (2020) E2f5 is a versatile transcriptional activator required for spermatogenesis and multiciliated cell differentiation in zebrafish. PLoS Genet 16: e1008655 [DOI] [PMC free article] [PubMed] [Google Scholar]
- Zhang M, Li Q, Zhang L, Wang Y, Wang L, Li Q, He T, Wan B, Wang X (2018a) RASSF7 promotes cell proliferation through activating MEK1/2‐ERK1/2 signaling pathway in hepatocellular carcinoma. Cell Mol Biol (Noisy‐le‐Grand) 64: 73–79 [PubMed] [Google Scholar]
- Zhang X, Jia S, Chen Z, Chong YL, Xie H, Feng D, Wu X, Song DZ, Roy S, Zhao C (2018b) Cilia‐driven cerebrospinal fluid flow directs expression of urotensin neuropeptides to straighten the vertebrate body axis. Nat Genet 50: 1666–1673 [DOI] [PubMed] [Google Scholar]
- Zhao CT, Malicki J (2007) Genetic defects of pronephric cilia in zebrafish. Mech Dev 124: 605–616 [DOI] [PubMed] [Google Scholar]


