

Abstract
All cavefishes, living exclusively in caves across the globe, exhibit similar phenotypic traits, including the characteristic loss of eyes. To understand whether such phenotypic convergence shares similar genomic bases, here we investigated genome‐wide evolutionary signatures of cavefish phenotypes by comparing whole‐genome sequences of three pairs of cavefishes and their surface fish relatives. Notably, we newly sequenced and generated a whole‐genome assembly of the Chinese cavefish Triplophysa rosa. Our comparative analyses revealed several shared features of cavefish genome evolution. Cavefishes had lower mutation rates than their surface fish relatives. In contrast, the ratio of nonsynonymous to synonymous substitutions (ω) was significantly elevated in cavefishes compared to in surface fishes, consistent with the relaxation of purifying selection. In addition, cavefish genomes had an increased mutational load, including mutations that alter protein hydrophobicity profiles, which were considered harmful. Interestingly, however, we found no overlap in positively selected genes among different cavefish lineages, indicating that the phenotypic convergence in cavefishes was not caused by positive selection of the same sets of genes. Analyses of previously identified candidate genes associated with cave phenotypes supported this conclusion. Genes belonging to the lipid metabolism functional ontology were under relaxed purifying selection in all cavefish genomes, which may be associated with the nutrient‐poor habitat of cavefishes. Our work reveals previously uncharacterized patterns of cavefish genome evolution and provides comparative insights into the evolution of cave‐associated phenotypic traits.
Keywords: cavefish, evolutionary rate, mutation, phenotypic evolution, relaxed selection
1. INTRODUCTION
Cavefishes live in dark and barren underground caves. They are found on all continents except Antarctica and are distributed in 10 orders and 22 families (Behrmann‐Godel et al., 2017; Soares & Niemiller, 2013). Despite their broad distribution and phylogenetic diversity, all cavefishes share common morphological traits, including visual degradation (degradation of eyes, optic nerve and optic tectum), disappearance of skin pigments and reduced metabolic rates compared to those of their surface relatives (Jeffery, 2001; Retaux & Casane, 2013). These recurring evolutionary features have long been of interest to evolutionary biologists. Indeed, Charles Darwin discusses cavefish phenotypes in the Origin of Species.
A dark environment such as a cave may enable the accumulation of mutations in genes related to vision, leading to visual degradation (Espinasa & Espinasa, 2008; Retaux & Casane, 2013). Some shared phenotypic traits in cave animals may represent convergent evolution in similar environmental features, such as extremely limited light levels (Fang et al., 2014; Nevo, 1979). Consistent with these ideas, in cave mammals, similar sets of genes (including vision‐related genes) tend to show accelerated molecular evolution (Davies et al., 2018; Partha et al., 2017). In cavefishes, epigenetic differences (Gore et al., 2018), as well as mutations in regulatory elements (Ma et al., 2020), of eye‐related genes have previously been reported. Interestingly, a recent comparative study revealed relatively few loss‐of‐function mutations in eye‐related gene sets in several cavefishes (Policarpo et al., 2021), suggesting that genetic changes in eye‐related genes are not as prevalent in cavefishes as in cave mammals.
Cave environments are characterized by a general scarcity of food. The consistent darkness and relatively isolated underground environment of caves force cavefish to rely on irregular and small amounts of food from outside to survive (Culver & Pipan, 2009). This compels cavefish to consume as much food as possible and store energy at times when food is available (Aspiras et al., 2015). However, hunger is a persistent state for species living in such environments, and other strategies that can help cavefish survive in the caves are also observed, including altered metabolism and reduced metabolic rates (Aspiras et al., 2015; Hervant et al., 1998, 1999, 2001; Hüppop, 1988; Moran et al., 2015; Riddle et al., 2018; Shi et al., 2018). Changes in metabolism can influence genome evolution (Bromham et al., 1996; Davies et al., 2004; Martin & Palumbi, 1993), which could offer another perspective on the evolutionary mechanisms of phenotypic traits in cavefishes.
Comparative genomic studies of different cavefishes should provide insights into the phenotypic evolution in extreme environmental conditions. However, genomic data in cavefishes are limited. Currently, transcriptome data of some cavefish species (Gross et al., 2013; Hinaux et al., 2013; Huang et al., 2019; McGowan et al., 2019; Meng et al., 2013; Stahl & Gross, 2017) and genome assemblies of two species (Astyanax mexicanus, Mexican tetra cavefish [McGaugh et al., 2014], and Sinocyclocheilus anshuiensis [Yang et al., 2016]) are available. A comparison of A. mexicanus with S. anshuiensis, however, may be confounded by the effect of genomic polyploidization, as the latter is an allotetraploid species (Cypriniformes) (Xu et al., 2019; Yang et al., 2016), while the former is a diploid (Characiformes) (McGaugh et al., 2014). Therefore, genomic data from an additional cavefish can prove critical for advancing our understanding of cavefish genome evolution.
The cavefish Triplophysa rosa belongs to the speciose loach, which are generally small bottom‐dwelling omnivorous fish. They belong to the family Nemacheilidae in the order Cypriniformes (Liu et al., 2012). Triplophysa is one of the largest genera of these loaches, with nearly 160 species discovered to date (http://researcharchive.calacademy.org/research/ichthyology/catalog/fishcatmain.asp), including 34 cavefishes (Chen et al., 2021). Triplophysa species are found worldwide but mainly inhabit the Tibetan Plateau and its surrounding areas, including karst areas in southwestern China. In particular, T. rosa is found only in underground karst caves in Wulong, Chongqing and southwestern China. In addition to degradation of the visual apparatus and the disappearance of skin pigmentation, T. rosa cavefish exhibit other features associated with adaptation to cave environments, including reduced metabolic rate (Shi et al., 2018), small brain volume and small optic tectum (Huang, 2012). We previously proposed that protein‐coding sequences of T. rosa evolved rapidly despite their low rate of nucleic acid evolution (Zhao et al., 2020).
To investigate genomic features associated with cave living, we sequenced and generated a high‐quality chromosomal‐level assembly of T. rosa. Using de novo, homology and transcript prediction methods, we obtained 26,027 high‐confidence protein‐coding sequences of the T. rosa genome. In addition, we determined the subgenome gene sets of the cavefish S. anshuiensis and surface fish S. grahami based on a study by Xu et al. (2019). Utilizing these novel genomic resources, we compiled data on three pairs of cavefish and surface fish relatives for comparative analyses. Our work identified several shared features of cavefish genome evolution, including lower rates of nucleic acid evolution and higher rates of amino acid evolution, as well as genome‐wide relaxation of purifying selection. Concordantly, we show that potentially harmful nonsynonymous mutations have accumulated in cavefish genomes. Together, our results demonstrate pervasive relaxation of natural selection and accumulation of mutations associated with the evolution of genomes in cavefishes.
2. MATERIALS AND METHODS
2.1. Ethics statement
All zoological experiments were carried out according to the recommendations of the Animal Care and Use Committee of Southwest University (Chongqing, China). Triplophysa rosa was euthanized in MS222 (Chongqing Saipu Nasi Biochemical) solution before tissue collection.
2.2. Genome sequencing and assembly
The details of DNA extraction and genome sequencing are described in the Appendix S1. The genome assembly was divided into the following four steps. (i) Illumina short‐read sequences (Illumina HiSeq 4000 sequencer for paired‐end reads and Illumina HiSeq 2500 sequencer for mate paired‐end reads) were assembled into contigs using allpaths‐lg software (Gnerre et al., 2011) with the parameter HAPLOIDIFY = TRUE and other parameters set to default. Next, sspace version 3.0 (Boetzer et al., 2011) was used to connect the contigs to the scaffold, and the gaps were filled with gapcloser (parameter: ‐l 151, ‐p 31) (Luo et al., 2012). (ii) pbjelly version 15.8.24 software (English et al., 2012), which uses error‐corrected PacBio data (corrected using lordec software with the parameter ‐v 0.5 ‐k 21 ‐s 3; Salmela & Rivals, 2014), was used for further gap‐filling and scaffolding processes. (iii) We used bwa version 0.7.10‐r789 software (Li & Durbin, 2009) to align Hi‐C sequencing data to the reference genome. hic‐pro software (Servant et al., 2015) was used to evaluate Hi‐C sequencing data, and the effective Hi‐C data were screened out for further analysis. (iv) Finally, genome scaffolds were grouped, sorted and oriented using lachesis software (Burton et al., 2013). The assembly results were evaluated by using the following parameters: CLUSTER_MIN_RE_SITES = 57; CLUSTER_MAX_LINK_DENSITY = 2; CLUSTER_NONINFORMATIVE_RATIO = 2; ORDER_MIN_N_RES_IN_TRUN = 28; ORDER_MIN_N_RES_IN_SHREDS = 34. Other parameters were set to default.
2.3. Gene prediction and annotation
Protein‐coding genes of T. rosa were predicted based on three different strategies using de novo, homologous protein and UniGene prediction. First, de novo prediction was performed using augustus version 3.1.2 (Hoff et al., 2016), genscan (Burge & Karlin, 1997), glimmerhmm version 3.0.3 (Majoros et al., 2004), snap (Korf, 2004) and geneid version 1.2 (Blanco et al., 2007). Of these, gene model parameters for augustus were trained from conserved genes in zebrafish using cegma, and 4360 completed genes were selected from the orthologue alignment. The glimmerhmm algorithm was trained using a human gene data set. Second, homologous protein‐based predictions were processed using gemoma (Korf, 2004). Third, transcriptome sequence‐based prediction was processed using pasa version 2.3.3 (Keilwagen et al., 2016) based on UniGenes generated from the trinity version 2.5.0 assembly, in which sequencing data were obtained from Zhao et al. (2020). Finally, we used the evm software (Haas et al., 2008) to integrate the results from the above three methods.
2.4. Analysis of whole‐genome alignment
Whole‐genome alignments based on nine teleost fish genomes were generated. The zebrafish (Danio rerio), Mexican tetra surface fish (Astyanax mexicanus), and German mirror carp (Cyprinus carpio mirror) genomes were used as reference genomes; only the chromosome sequences were used for alignment. Pairwise alignment was carried out using the last‐train tool (Hamada et al., 2017) with the following parameters: lastdb ‐P0 ‐uMAM4 ‐R01; last‐train ‐P0 ‐‐gapsym–E0.05–C2 ‐‐revsym ‐‐matsym; lastal ‐P 8 ‐E0.05 ‐C2 ‐p; and last‐split ‐m1. After completing pairwise alignments, simple repeat sequences in the alignments were masked using the last‐postmask (Frith, 2011) script. We used roast (Blanchette et al., 2004) to integrate pairwise alignments into multispecies alignments with the tree topology “(CypCar (SinGra SinAns)), (Danio (TriTib TRosa)) and (PygNat (AstMexC AstMexS)).” Since the genomic sequences of Pygocentrus nattereri were not fully assembled at the chromosome level, we selected the surface fish A. mexicanus as a reference because it offered the highest quality chromosomal‐level assembly at the moment. Next, fourfold degenerate sites (referred to as “4D sites” henceforth) were extracted from multiple sequence alignments for each gene or whole genome based on the reference genome and annotations. For 4D site analysis, we added additional filters for homology >80% and lengths >150 bp. The numbers of substitutions were obtained using the PhyloFit algorithm in the rphast package (Hubisz et al., 2011).
2.5. Identification of homologous gene between common carp and Sinocyclocheilus
The common carp and Sinocyclocheilus are tetraploid species, whereas A. mexicanus and T. rosa are diploids, preventing the use of genomic data from all of these species for comparative analysis. The heterotetraploid carp shares a common origin of whole‐genome duplication with Sinocyclocheilus (Xu et al., 2019). To eliminate this problem as much as possible, we split the gene set from Sinocyclocheilus anshuiensis and S. grahami at the subgenome level based on research on the origin and evolution of the heterotetraploid carp genome (Xu et al., 2019). First, we performed a reciprocal best hits (RBH) blast search (Moreno‐Hagelsieb & Latimer, 2008) between the gene set of German mirror carp (set as the reference genome) and gene sets of S. anshuiensis. Second, the same approach was also applied to the gene set of German mirror carp and S. grahami. Finally, by combining the results of RBH blast and subgenomic information of the German mirror carp, the S. anshuiensis and S. grahami gene set was distinguished at the subgenome level. Consistent with the German mirror carp, the B subgenome (from S. anshuiensis or S. grahami) was homologous to diploid Barbinae species, and the other was the A subgenome (from S. anshuiensis or S. grahami) gene set. These gene sets are available on GitHub (https://github.com/zqingyuan/Comparative‐genomics‐on‐the‐adaptive‐evolution‐of‐cavefish.git).
2.6. Gene family determination and orthologue assignment
We performed gene family analysis based on 33 genomes (or subgenomes) (Table S1). The longest coding or protein sequence of each gene was selected in the case of alternative transcripts. The orthomcl pipeline (Li et al., 2003) was used for gene family cluster analysis with the following specific parameters: orthomclFilterFaster: 10 20, blastp: Evalue 1e‐5, coverage 50%, and mcl: ‐l 1.5. We then used the upho pipeline (Ballesteros & Hormiga, 2016) to delineate orthologues from each gene family with multiple paralogues, and used raxml (8.2.12 raxmlHPC‐PTHREADS‐AVX) (Stamatakis, 2014) to build a maximum‐likelihood tree for each family independently. In total, we delineated 19,627 orthologous groups (containing at least 10 species) across the 33 genomes. Among them, we found that 17,194 orthogroups contained no more than one gene from each cavefish and its closely related surface fish. A total of 13,328, 8566, 10,215 and 14,623 genes in the cavefish and surface fish of A. mexicanus, the A and B subgenomes of Sinocyclocheilus, and Triplophysa, respectively, were selected for subsequent comparative analysis. Next, all protein‐coding sequences in each orthogroup were extracted and aligned using translatorx 1.1 (Abascal et al., 2010), which internally runs prank version 140110 (Loytynoja, 2014) for alignments and gblocks 0.91b (Castresana, 2000) to eliminate unreliable regions.
2.7. Phylogenomic analysis
Based on the results of the above analysis, we screened 229 high‐confidence single‐copy orthologous genes from the orthomcl results. These alignments were concatenated and used to generate a phylogenetic tree with raxml using the maximum‐likelihood method and GTRGAMMA model. We used five soft‐bound calibration time points (zebrafish–electric eel: ~130–174 million years ago [Ma]; stickleback–Takifugu: ~99–127 Ma; cod–stickleback: ~141–166 Ma; zebrafish–Asian bonytongue: ~231–287 Ma; zebrafish–spotted gar: 295–334 Ma), which were supported by fossils based on the TimeTree website (http://www.timetree.org/). We used the MCMCTree in paml (version 4.9e) package (Yang, 2007) to calculate the divergence time between genomes.
2.8. Evolutionary rate analysis and identification of positively selected genes
To estimate evolutionary rates of genes in each cavefish and its corresponding surface fish, dN, dS and dN/dS (rates of nonsynonymous and synonymous substitutions) values in each branch were calculated using codeml in the paml program (version 4.9e) with the free ratio model and default parameters based on the tree with all 33 genomes (or subgenomes). Next, we analysed gene selection pressure. For all subsequent analyses, phylogenetic trees for each gene were pruned from the 33‐genome phylogenetic tree for 229 high‐confidence single‐copy orthologous genes. We used the likelihood ratio test (LRT) to compare the one‐ratio model (m = 0) with the two‐ratio model (m = 2). To identify genes subject to positive selection, we performed LRTs by comparing the branch site null model (model = 2, NSsites = 2, fix_omega = 1, omega = 1) and its alternative model (model = 2, NSsites = 2, fix_omega = 0) to determine whether the foreground branch underwent significant positive selection.
2.9. Test for relaxation of selection
We used the parameter k, which was calculated by the relax program (Wertheim et al., 2015), to further test the relaxation of natural selection. The k parameter is related to the value of ω as (ω background) k = (ω foreground) (Wertheim et al., 2015). We used relax for LRT analysis by comparing the model with k = 1 to the model with k < 1 (or k > 1). All cavefish and their closely related surface fish were set as foreground branches for testing, while the respective surface fish (or cavefish) were set as background branches. The initial tree topologies used are as follows: A. mexicanus (eight species), (EleEle ((PygNat (AstMexC AstMexS)) ((PanHyp IctPun) (TacFul BagYar)))); T. rosa and T. tibetana (eight species), (ChaCha ((Trosa TriTib) ((Danio DanTra) (Cidel (MegAmb AnaGra))))); Sinocyclocheilus, (10 species or subgenomes), (((((CypCarA SinGraA) CypCarA) ((SinAnsB SinGraB) CypCarB)) ((MegAmb AnaGra) Cidel)) Danio). If k < 1, p < .05 indicated that the test branch was under significantly relaxed selection, and if k > 1, p < .05 indicated that the test branch was under significantly intensified selection. Finally, gene ontology (GO) enrichment analysis and visualization was performed using omicshare web software (https://www.omicshare.com/tools). A q‐value ≤ .05 (false discovery rate [FDR]‐adjusted p‐value) indicated that the GO category was significantly enriched. Redundant terms in significantly enriched GO categories were removed using revigo (Supek et al., 2011).
2.10. Assessment of the potential harmfulness of amino acid sequence mutations
We evaluated the potential harmfulness of nonsynonymous mutations (or amino acid substitutions) by analysing changes in the hydrophilicity and hydrophobicity of the amino acid site substitutions. We applied codeml (aaml) to predict each internal node ancestor sequence with the RateAncestor parameters set to 1. We then scored the changes in hydrophobicity according to a scoring matrix of hydrophobicity (Riek et al., 1995) via the transitions from ancestral to replacement amino acids. Finally, score differences between cavefishes and surface fishes were compared and analysed. Significant differences were determined using the generalized linear mixed model of lme4 version 1.1–23 (Bates et al., 2015), Wilcoxon rank‐sum test, Student's t test and Kolmogorov–Smirnov test in the r package (version 3.63).
2.11. Calculating protein correlations with the cave environment
From the protein sequence alignments of the 33 genomes described earlier, we selected those with alignments present in at least two cavefish species for this analysis. We used the “aaml” program in paml packages to estimate branch lengths based on the topological structure of the phylogenetic tree generated by raxml. Branch lengths were estimated using an empirical model of amino acid substitution rates, with rate variability between sites modelled as a gamma distribution approximated with four discrete classes (for computational efficiency) and an additional class for invariable sites (aaml model, “Empirical+F”) (Whelan & Goldman, 2001; Yang, 1996). Subsequently, relative evolutionary rates of cavefish were calculated using rerconverge (https://github.com/nclark‐lab/RERconverge). We used the readTrees function from rerconverge to convert trees for R analysis. The relative evolutionary rates were corrected using the function getAllResiduals with weight = T and scale = T. The char2Paths function was used to generate a phenotype vector of each gene tree based on the phenotype tree with the cavefish branches set to 1 and all others set to 0. Next, the relative evolutionary rate associated with cavefish adaptation was estimated by the getAllCor function with method = “p” min.pos = 0 and winsorizeRER = 3. Finally, permutation analysis was conducted to obtain a permuted p‐value based on binary permutation functions (getPermsBinary and permpvalcor) involved in rerconverge (https://github.com/nclark‐lab/RERconverge).
2.12. Analysis of candidate gene sets for cave phenotypes
We examined vision‐related, clock‐related and pigment‐related gene sets derived from a study by Policarpo et al. (2021), following their methods. Specifically, we used blast to determine the location of genes in the genomes of T. rosa and T. tibetana. Next, samtools was used to identify matching regions, and the exonerate (Slater & Birney, 2005) was used to predict coding sequences using protein sequences from zebrafish.
3. RESULTS
3.1. New genome assembly and annotation of Chinese cavefishes and phylogenetic resources
We obtained a total of 141 Gb (coverage: ~207×) of Illumina whole‐genome sequencing data (Table S2; Appendix S1), which were assembled using the allpaths‐lg program (Gnerre et al., 2011). Next, we integrated PacBio (11.6 Gb; coverage: ~17×; Tables S3 and S4) and Hi‐C (111 Gb; coverage: ~165×; Table S5) sequencing data and assembled the genome of Triplophysa rosa at the chromosome level (Appendix S1, Figure S1). Briefly, 94.52% of the nucleotide sequence was assigned to 25 chromosomes (with a total length of 691.71 Mb, scaffold N50 24.84 Mb, N90 16.00 Mb; Tables S6 and S7; Figures S2 and S3), containing 324.63 Mb of repetitive sequence (Appendix S1). The evaluation results based on merqury (Rhie et al., 2020) indicated a genome assembly integrity of 93.33% (Appendix S1).
We obtained 26,027 protein‐coding genes (including 1481 motifs and 13,178 domains; Tables S8 and S9) and 6834 noncoding genes (Table S10, Appendix S1); 95.27% of the protein‐coding genes were obtained from annotations based on databases such as the NR database (Table S11). In addition, we employed the Benchmarking Universal Single‐Copy Orthologs (busco) software (Simao et al., 2015) using the actinopterygii_odb9 database to assess the gene set of T. rosa. The protein mode results indicated that 98.2% of all 4584 BUSCOs were assembled, with a complete or partial assembly of 95.3% and 2.9% of all BUSCOs, respectively. These results suggest a high quality for de novo assembly and gene prediction (Table S12; Appendix S1).
The phylogenetic relationships among the study species and other teleosts were determined using a genome‐wide set of 229 high‐confidence one‐to‐one orthologous genes across 33 genomes (Figure 1a). The resulting phylogenetic tree is consistent with previous studies (e.g., Hughes et al., 2018). Using the mcmctree program in paml, T. rosa cavefish and T. tibetana surface fish were estimated to have diverged ~25.5 Ma. The divergence time between the cavefish and surface fish of Astyanax mexicanus was ~5.8 Ma. The differentiation time between Sinocyclocheilus anshuiensis and S. grahami was ~14–17 Ma, similar to the results of previous studies (Yang et al., 2016). Our comprehensive phylogenomic framework provides a unique and powerful opportunity to examine genome‐wide changes in closely related, moderately diverged and more distantly diverged pairs of cavefishes and surface fishes. We used the psmc software (Nadachowska‐Brzyska et al., 2016) to estimate the effective population sizes (N e) of T. rosa and T. tibetana (Appendix S1). This analysis suggested that the current N e of the two species might have begun to decrease millions of years ago (Figure S4).
FIGURE 1.
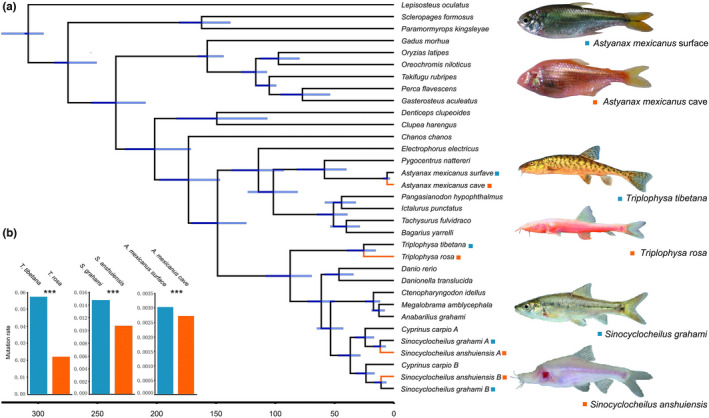
Phylogenetic and evolutionary analysis of cavefishes. (a) Divergence time estimates in cavefishes and other surface fishes (95% confidence interval). (b) Comparison of mutation rates in cavefishes and closely related surface fishes based on fourfold degenerate sites (4D sites). Blue: Surface fish; orange: Cavefish. Significant differences: ***p < .001; Student's t test.
3.2. Cavefish have low mutation rates but high protein evolutionary rates
We first examined 4‐fold degenerate (4D) sites across the genome. Evolutionary rates estimated from these sites can be used as a proxy for mutation rates (Kumar & Subramanian, 2002; Li, 1997). We found that all cavefish genomes had lower mutation rates than those of the closely related surface fishes (Figure 1b). Next, we examined rates of nonsynonymous substitutions (dN) and synonymous substitutions (dS). Cavefishes had lower dS than corresponding surface fishes (Figure 2), consistent with the results obtained from 4D sites. Cavefishes also exhibited lower dN than surface fishes. However, the degree of reduction was greater for dS than for dN (Figure 2), leading to higher dN/dS (ω) values in cavefishes than in surface fishes (p < .05 for all four pairwise comparisons between surface fish and cavefish, Wilcoxon rank‐sum test). Cavefishes also had greater numbers of genes with higher ω values than surface fishes (p < 10−3 for all comparisons, Fisher's exact test; Table S13).
FIGURE 2.
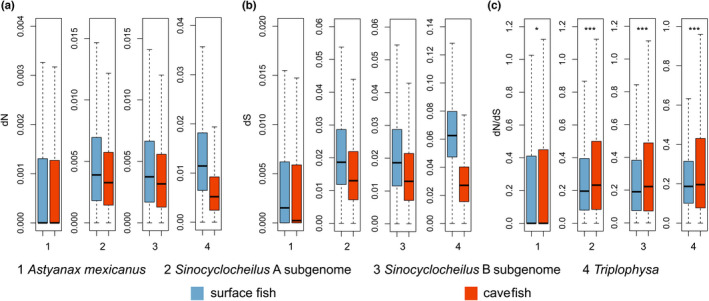
Box plot of pairwise dN (a), dS (b) and dN/dS (ω, c) values between cavefishes and surface fishes. The dN/dS values of cavefishes were significantly higher than those of surface fishes: *p < .05, ***p < .001, Wilcoxon rank‐sum test with continuity correction. The horizontal line in the centre of the box chart represents the median value.
3.3. Genome‐wide relaxation of purifying selection in cavefishes
The higher ω values of cavefishes may have been caused by positive selection of specific gene sets or by relaxation of purifying selection. We thus analysed the selection pressure using log‐likelihood ratio tests (Yang, 2007), similar to the approaches used in previous studies (Pirri et al., 2021; Shin et al., 2014; Wang et al., 2019). We compared the one‐ratio model (M0) with the two‐ratio model (M2, where dN/dS can differ for the lineage of interest compared to other lineages) using codeml. We found that in three out of the four cases, more genes exhibited significantly elevated dN/dS compared to the background values in cavefish than in its surface fish relative (Table 1). This observation is consistent with cavefishes having higher dN/dS ratios than surface fishes. On the other hand, all cavefishes had fewer genes with significantly reduced dN/dS than the background, compared to surface fish (Table 1).
TABLE 1.
The number of genes with p < .05 based on estimation of parameters of the codeml branch models
| Model 2 (two‐ratio) better fit than Model 0 (one‐ratio) (w i > w b ) | ||
|---|---|---|
| Surface | Cave | |
| Astyanax mexicanus | 1034 | 1160 |
| Sinocyclocheilus A | 1368 | 1611 |
| Sinocyclocheilus B | 1487 | 1768 |
| Triplophysa | 5723 | 4101 |
| Model 2 (two‐ratio) better fit than Model 0 (one‐ratio) (w i < w b ) | ||
|---|---|---|
| Surface | Cave | |
| Astyanax mexicanus | 67 | 56 |
| Sinocyclocheilus A | 106 | 71 |
| Sinocyclocheilus B | 105 | 86 |
| Triplophysa | 112 | 68 |
Note: w i : ω of the target species; w b : background ω.
Based on these results, we subsequently applied another approach specifically developed to test for relaxation of natural selection to interpret increases in dN/dS in a phylogenetic framework using relax (Wertheim et al., 2015). Briefly, the selection intensity parameter k is introduced in a likelihood ratio framework, and whether selection is significantly relaxed or intensified could be tested (Wertheim et al., 2015). We found that, compared to the most closely related surface fishes, cavefishes contained more genes with evidence of relaxation of natural selection (k < 1 and p < .05) than those with intensified natural selection (k > 1 and p < .05) (Table 2); this trend was significant in three of the four comparisons. In our analysis, we did not apply multiple test corrections to avoid overly restrictive conditions. As we have shown above, there were few substitutions between surface fish and cavefish due to recent divergence and reduced evolutionary rate of cavefish. Applying FDR correction drastically reduces the number of genes. Even though the general trends persisted, only A. mexicanus showed statistical significance (Table S14). Therefore, our results should be considered in light of this limitation. We then compared the relax and codeml results revealing that genes under positive selection tend to overlap with those under intense evolutionary pressure (Figure S5). We also observed that genes under relaxed selection tended to overlap with those with significantly elevated dN/dS values (Figure S5).
TABLE 2.
The number of genes under significantly relaxed selection and intensified selection
| Genomes | Surface fish | Cavefish | Significance (p)* | ||
|---|---|---|---|---|---|
| Relaxed | Intensified | Relaxed | Intensified | ||
| Astyanax mexicanus | 318 | 558 | 352 | 341 | <.0001 |
| Sinocyclocheilus A | 306 | 458 | 427 | 387 | <.0001 |
| Sinocyclocheilus B | 322 | 583 | 505 | 427 | <.0001 |
| Triplophysa | 673 | 751 | 723 | 710 | .09 |
Note: Relaxed: k < 1, p < .05; Intensified: k > 1, p < .05 using *Fisher's exact test.
Genome‐wide relaxation of purifying selection can lead to the accumulation of slightly deleterious mutations (Kimura, 1983; Ohta, 1973, 1992). We thus analysed the potential “deleteriousness” of amino acid substitutions in cavefishes and surface fishes. Specifically, we examined the changes in the hydrophobicity score (HS) as a proxy, which is often used to test for the “deleteriousness” of nonsynonymous substitutions (Brandt et al., 2017, 2019; Henry et al., 2012). The underlying assumption is that because the structure of a protein is influenced by changes in hydrophilic (hydrophobic) properties at protein mutation sites (Pace et al., 2011), amino acid changes involving substantial changes in hydrophilic and hydrophobic properties are likely to be deleterious (Brandt et al., 2017; Henry et al., 2012). A lower HS indicates a greater difference in hydrophobicity, whereas a value of 100 indicates identical properties (Riek et al., 1995). We found that the amino acid changes led to more dissimilar hydrophobicity in all cavefishes (generalized linear mixed model and Student's t test, all p < .01, Figure 3; Kolmogorov–Smirnov test, all p < .005, Figure S6). We then compared the HS of cavefish genes with evidence of relaxation versus intensification of natural selection (Table 2). We found that HS was significantly lower (more deleterious) for those genes where natural selection was relaxed compared to genes that experienced intensified natural selection in three out of four comparisons (Figure S7). These results further support the idea that relaxed natural selection of cavefish genomes has contributed to the accumulation of mildly deleterious mutations.
FIGURE 3.
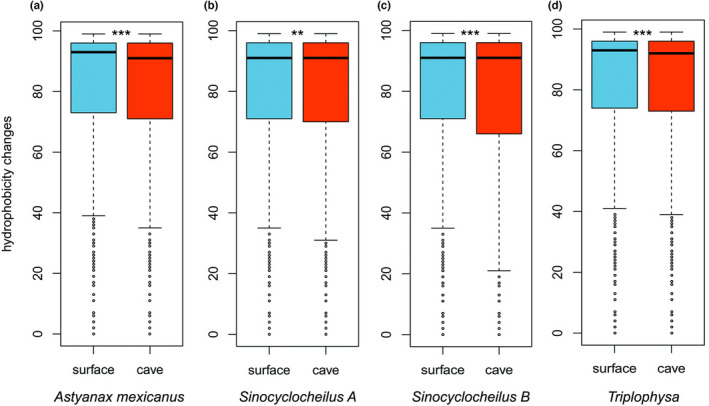
Hydrophilicity scores (HS) at cavefish and surface fish branches. The HS at the surface fish (blue) and cavefish (red) terminal branches are shown as boxplots (significant differences: **p < .01; ***p < .001; generalized linear mixed model). The horizontal line in the centre of the box chart represents the median value of the HS. (a) Astyanax mexicanus, (b) Sinocyclocheilus A subgenome, (c) Sinocyclocheilus B subgenome, (d) Triplophysa. A lower score indicates a more dissimilar hydrophobicity.
3.4. Analyses of cave phenotype‐related genes support limited gene decay in cavefishes
Policarpo et al. (2021) analysed gene sets related to cave phenotypes (including vision‐related genes, circadian clock genes and pigmentation genes) and found that cavefishes had few loss‐of‐function mutations compared to cave mammals. We examined the newly generated T. rosa genome sequence to re‐evaluate these findings. We found that T. rosa contained more vision‐related pseudogenes than the closely related surface fish (Figure S8A), which is consistent with findings in Policarpo et al. (2021). The numbers of pseudogenes in the circadian clock and pigmentation genes were similar between T. rosa and its closely related surface fish (Table S15; Figure S8A). Pseudogenes were shared between T. rosa and its closely related surface fish in all three gene sets. While the number of pseudogenes in T. rosa was within the range observed in other cavefishes, all pseudogenes related to vision in cavefishes (including T. rosa) contained fewer loss‐of‐function mutations (Figure S8B) than those in cave mammals, consistent with previous results from smaller subsets of samples (Policarpo et al., 2021). These results support that cavefishes exhibit limited decay of cave phenotype‐related candidate genes compared to cave mammals.
3.5. Little evidence of convergent sequence evolution in cavefish lineages
If the convergent phenotype of different cavefishes was caused by the same sets of genes or pathways, then we should observe similar or common sets of genes with signatures of positive selection. However, analyses of positive selection (using branch site models) did not find any common gene under positive selection in all cavefishes (Figure 4a). Then, to test if relaxed selection of similar sets of genes or pathways could lead to the convergent phenotype, we compared genes that had experienced significant relaxation of natural selection. We found that there is little overlap of genes that are under relaxed selection among the studied cavefishes (Figure 4b). These observations suggest that the similarity of phenotypes in cavefishes is not necessarily driven by convergent sequence evolution of the same sets of genes.
FIGURE 4.
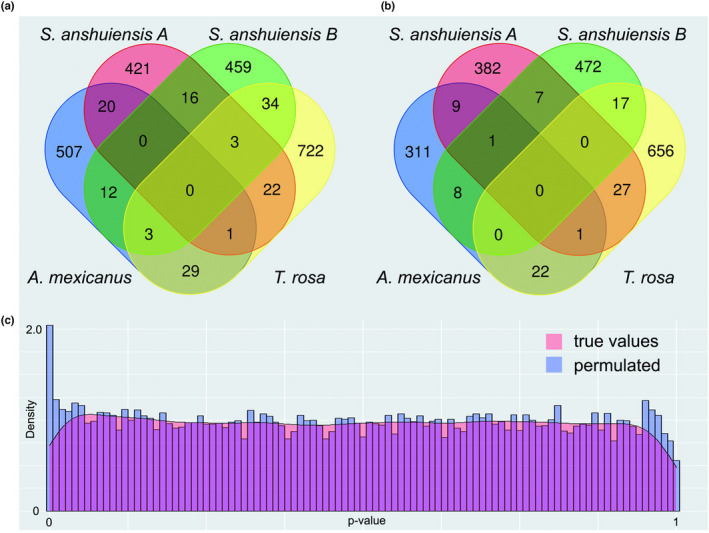
Similar phenotypes may not be dominated by the same genes. (a) Venn diagram of positively selected genes in the four cavefish genomes. (b) Venn diagram of genes under relaxed selection in the four cavefish genomes. (c) Distribution of p‐values from correlations between changes in the cave phenotypes and evolutionary rates of proteins.
It is possible that the tests for positive selection and relaxation of natural selection were too stringent, especially since the numbers of substitutions were small given the relatively short divergence times and the reduced mutation rates in the cavefishes. Therefore, we tested whether the protein evolutionary rates of the same genes were significantly correlated between lineages, which could be consistent with similar evolutionary forces operating in different lineages (Partha et al., 2017). Few genes exhibited correlated evolutionary rates across cavefishes (Figure 4c). We performed a permutation analysis to determine whether the observed correlations were significant (Kowalczyk et al., 2020). We found that the observed number of genes with high correlations was lower than that in the permuted samples (Figure 4c). Thus, there is no explicit signal for the correlated protein evolutionary rates associated with cavefish phenotypes.
3.6. Functional analysis of fast evolving genes
To further examine potential changes in gene function during cavefish evolution, we performed GO enrichment analysis of all positively selected genes from the branch site model. In A. mexicanus, many GO terms related to development were enriched (Figure S9; Table S16), such as embryo development, organ development and cell morphogenesis. Other terms were related to cellular processes or organism processes. In T. rosa, three GO entries were significantly enriched, namely single‐organism process, cellular process and single‐organism cellular process (Table S17). None of these GO terms was significantly enriched in A. mexicanus. In S. anshuiensis, we found only one significant GO term (cellular process) (Table S18).
In contrast, many significantly enriched GO terms were found in genes exhibiting relaxation of natural selection (Figure S10; Tables S19–S21). The same or similar significant GO terms were found in A. mexicanus, T. rosa, and the B subgenome of S. anshuiensis (Figure S10). These GO terms can be approximately divided into two categories: one related to development and the other to metabolism, particularly lipid metabolism. Anatomical structure development was also significantly enriched in the gene sets from all three genomes. GO terms related to fat metabolism mainly appeared in A. mexicanus and T. rosa (Figure S10A,B; Tables S19 and S21). Although the specific GO terms were not identical between species, it is notable that similar GO terms related to fat metabolism, such as those related to monocarboxylic, organic and carbonic acids, tended to be enriched in genes experiencing relaxation of natural selection in cavefishes. Meanwhile, we only identified a few lipid metabolism‐related genes under relaxed selection with positive selection sites, such as the ladh and stard8 genes in A. mexicanus cavefish and the lrp2b gene in the B subgenome of S. anshuiensis.
4. DISCUSSION
Our study provides a novel comparative whole‐genome analysis of multiple pairs of cavefishes and surface fishes, revealing several notable features of cavefish genome evolution. We show that cavefish genomes have low mutation rates and exhibit slow molecular evolution overall. We also detected pervasive relaxation of natural selection in these genomes. Analyses of the candidate genes underlying cave‐associated phenotypes solidified the relative lack of loss‐of‐function mutations in those genes. Interestingly, genes that exhibit relaxation of purifying selection were enriched in specific functional categories, including those implicated in lipid metabolism.
Some of these features may reflect the specific habitats of these fishes. The association between life history traits and mutation rates has been well documented in the literature and can be applied to cavefishes. Underground cave habitats are dark and food resources are scarce (Culver & Pipan, 2009), affecting the consuming habits of cavefishes as they eat as much as possible when food is available (Aspiras et al., 2015). Accordingly, cavefishes exhibit modified reproductive strategies (Hüppop & Wilkens, 1991). For example, female cavefish produce larger but fewer eggs than closely related surface fish (Hüppop & Wilkens, 1991). Cavefishes also display other characteristic life history traits associated with lower mutation rates (e.g., Bromham et al., 1996; Davies et al., 2004; Elango et al., 2009; Martin & Palumbi, 1993), including reduced metabolic rates and longer generation times (Aspiras et al., 2015; Hervant et al., 1998, 1999, 2001; Hüppop, 1988; Moran et al., 2015; Riddle et al., 2018; Shi et al., 2018). We note that as the divergence time increases, the difference in evolutionary rate between surface fishes and cavefishes increases (Figure 1b), indicating that the extended time spent in caves may further expand the rate difference between cavefishes and surface fishes.
We found that cavefish genomes tended to have higher dN/dS values than surface fish genomes (Figure 2; Table 2; Table S13). Additional analyses indicated that the overall patterns are consistent with the relaxation of purifying selection in cavefish genomes. Relaxation of purifying selection can lead to the accumulation of weakly deleterious mutations, which can be harmful. For instance, candidate gene studies in cavefish have shown that reduced selective constraint could lead to regressive phenotypes (Calderoni et al., 2016; Niemiller et al., 2013). The efficacy of natural selection can decrease in populations with small effective population sizes. Limited data indicate that the effective population sizes of the two cavefish species were smaller than those of the corresponding surface fishes (Bradic et al., 2012; Yang et al., 2016), while that of Triplophysa rosa is similar to its relative T. tibetana (Figure S4). However, more genetic data are necessary to systematically evaluate variation of the effective population sizes in cavefishes in comparison with their surface fish relatives.
Our findings are in contrast to those in fossorial mammals that inhabit caves, in which vision‐specific genes are known to have accrued a large number of mutations (Davies et al., 2018; Partha et al., 2017), and some genes exhibit similar evolutionary rates in a habitat‐specific manner (Chikina et al., 2016; Kowalczyk et al., 2020; Partha et al., 2017). The cause(s) of this intriguing difference remain(s) to be elucidated. There are vast ecological and evolutionary differences between fossorial cave mammals and cavefishes. For example, the timing of cave adaptation may be different (e.g., Oligocene vs. Pleistocene; Emerling & Springer, 2014; Policarpo et al., 2021). The phenotypic traits of fossorial mammals that are considered to be adaptations to subterranean environments are affected by several factors such as reduced oxygen as well as the availability of water and other nutrients (Culver & Pipan, 2009, 2010; Howarth & Moldovan, 2018; Jiménez‐Valverde et al., 2017). Such ecological differences could have led to differential patterns of genome evolution associated with cave phenotypes. However, here, we first consider other possibilities that are known to influence molecular evolution. One possible explanation is the short divergence time between cavefishes and surface fishes (Policarpo et al., 2021), implying that cavefishes have not had sufficient time to accumulate many mutations (Figure 4c). Second, information on candidate genes related to cavefish phenotypes, including vision, skin pigmentation and circadian rhythms, remains limited compared to that in cave mammals. Genomic resources such as those we present in this work would open future opportunities to further understand candidate genes. Yet another possibility is that for cave‐associated traits (depigmentation, optic tectum reduction, especially the eye degeneration), relaxed selection resulted in the degradation of previously constrained features because they are no longer beneficial.
Our study also highlights the implication of relaxed natural selection in fostering opportunities for evolutionary innovation. Specifically, reduced efficacy of natural selection can enable fixation of nearly neutral mutations, including those that are slightly deleterious or slightly advantageous (Charlesworth & Eyre‐Walker, 2007; Ohta, 1973). Such mutations can include both coding and noncoding variants, as well as genomic variants such as introns or transposable elements, which can provide material for the evolution of novel regulatory mechanisms and complexities in the genome (e.g., Lynch, 2007; Lynch & Conery, 2003; Ohta, 2002; Yi, 2006; Yi & Streelman, 2005, although see Whitney et al., 2011 and Whitney & Garland, 2010 for differing observations). Indeed, genomic‐scale studies in diverse taxa are increasingly identifying examples of relaxed natural selection preceding the evolution of novel traits (Cui et al., 2019; Dapper & Wade, 2020; Hunt et al., 2011; Lahti et al., 2009) as well as larger genomes (Lefébure et al., 2017). For example, reduced efficacy of natural selection provided opportunities for the evolution of phenotypic plasticity in hymenopteran insects (Hunt et al., 2011). Relaxation of purifying selection is also associated with alteration of lifespan in killifishes (Cui et al., 2019). Relaxation of purifying selection may explain the rapid evolution of reproductive genes (Dapper & Wade, 2020).
Notably, when we examined genes that have experienced significantly relaxed selection in cavefishes, several lipid metabolism‐related genes were found in Astyanax mexicanus and T. rosa (Figure S10; Tables S19–S21). This observation is interesting given that many known alterations of cavefish life history traits involve metabolism and eating behaviour due to scarcity of foods (Aspiras et al., 2015; Hervant et al., 1998, 1999, 2001; Hüppop, 1988; Moran et al., 2015; Riddle et al., 2018; Shi et al., 2018). Relaxation of selection of metabolism‐related genes may provide raw evolutionary materials enabling cavefishes to survive in food‐deficient environments. For example, relaxed selection could have facilitated fixation of slightly beneficial mutations (Charlesworth & Eyre‐Walker, 2007; Ohta, 1973). Some genes may be subject to extremely recent or ongoing positive selection, which would not be detected by our current data and analytical tools. Future population‐level studies with large numbers of genomic variants (such as single‐nucleotide polymorphisms and indels) from cavefishes can help to elucidate ongoing evolutionary forces to test such hypotheses. Our study highlights the potential significance of relaxation of natural selection in the evolution of cavefishes and the evolution of novel phenotypes in general, as well as providing necessary genomic resources for future genetic and phenotypic studies of cavefishes.
AUTHOR CONTRIBUTIONS
Z.P. and S.V.Y. designed research; Q.Z., F.S., Y.L., S.V.Y. and Z.P. performed research; Q.Z. and F.S. analysed data; and Q.Z., F.S., S.V.Y. and Z.P. wrote the paper.
FUNDING INFORMATION
This work was supported by a grant from the National Natural Science Foundation of China (grant no.: 32170457).
CONFLICT OF INTEREST
The authors declare no competing interests.
BENEFIT‐SHARING STATEMENT
The research addresses a priority concern, in this case understanding the genetic basis of cave adaptation of the organisms studied. Our group is committed to international scientific partnerships, as well as institutional capacity building. Benefits from this research accrue from the sharing of our data and results on public databases as described above.
Supporting information
Appendix S1
Tables S16–S18
Tables S19–S21
ACKNOWLEDGEMENTS
We thank Yabing Niu, Yang Mao, Yingqi Xiao, Shiying Liu, Chenchen Shi and Shumeng Duan for their help in sample collection and data analysis.
Zhao, Q. , Shao, F. , Li, Y. , Yi, S. V. , & Peng, Z. (2022). Novel genome sequence of Chinese cavefish (Triplophysa rosa) reveals pervasive relaxation of natural selection in cavefish genomes. Molecular Ecology, 31, 5831–5845. 10.1111/mec.16700
Handling Editor: Andrew Kinziger
Contributor Information
Soojin V. Yi, Email: soojinyi@ucsb.edu.
Zuogang Peng, Email: pzg@swu.edu.cn.
DATA AVAILABILITY STATEMENT
All data are available at NCBI under the Bioproject PRJNA673076. Short read sequences are deposited in the Sequence Read Archive (SRA) under accession nos. SRR13479655–13479666 and SRR13449942–13449957. The new Triplophysa rosa whole genome assembly has been deposited in DDBJ/ENA/GenBank under the accession no. JAFHDT000000000. The version described in this paper is version JAFHDT010000000.
REFERENCES
- Abascal, F. , Zardoya, R. , & Telford, M. J. (2010). TranslatorX: Multiple alignment of nucleotide sequences guided by amino acid translations. Nucleic Acids Research, 38, W7–W13. 10.1093/nar/gkq291 [DOI] [PMC free article] [PubMed] [Google Scholar]
- Aspiras, A. C. , Rohner, N. , Martineau, B. , Borowsky, R. L. , & Tabin, C. J. (2015). Melanocortin 4 receptor mutations contribute to the adaptation of cavefish to nutrient‐poor conditions. Proceedings of the National Academy of Sciences of the United States of America, 112(31), 9668–9673. 10.1073/pnas.1510802112 [DOI] [PMC free article] [PubMed] [Google Scholar]
- Ballesteros, J. A. , & Hormiga, G. (2016). A new orthology assessment method for phylogenomic data: Unrooted phylogenetic orthology. Molecular Biology and Evolution, 33(8), 2117–2134. 10.1093/molbev/msw069 [DOI] [PubMed] [Google Scholar]
- Bates, D. , Mächler, M. , Bolker, B. , & Walker, S. (2015). Fitting linear mixed‐effects models using lme4. Journal of Statistical Software, 67(1), 1–48. 10.18637/jss.v067.i01 [DOI] [Google Scholar]
- Behrmann‐Godel, J. , Nolte, A. W. , Kreiselmaier, J. , Berka, R. , & Freyhof, J. (2017). The first European cave fish. Current Biology, 27(7), R257–R258. 10.1016/j.cub.2017.02.048 [DOI] [PubMed] [Google Scholar]
- Blanchette, M. , Kent, W. J. , Riemer, C. , Elnitski, L. , Smit, A. F. , Roskin, K. M. , Baertsch, R. , Rosenbloom, K. , Clawson, H. , Green, E. D. , Haussler, D. , & Miller, W. (2004). Aligning multiple genomic sequences with the threaded blockset aligner. Genome Research, 14(4), 708–715. 10.1101/gr.1933104 [DOI] [PMC free article] [PubMed] [Google Scholar]
- Blanco, E. , Parra, G. , & Guigo, R. (2007). Using geneid to identify genes. Current Protocols in Bioinformatics, Chapter 4, Unit 4.3. 10.1002/0471250953.bi0403s18 [DOI] [PubMed] [Google Scholar]
- Boetzer, M. , Henkel, C. V. , Jansen, H. J. , Butler, D. , & Pirovano, W. (2011). Scaffolding pre‐assembled contigs using SSPACE. Bioinformatics, 27(4), 578–579. 10.1093/bioinformatics/btq683 [DOI] [PubMed] [Google Scholar]
- Bradic, M. , Beerli, P. , García‐de León, F. J. , Esquivel‐Bobadilla, S. , & Borowsky, R. L. (2012). Gene flow and population structure in the Mexican blind cavefish complex (Astyanax mexicanus). BMC Evolutionary Biology, 12, 9. 10.1186/1471-2148-12-9 [DOI] [PMC free article] [PubMed] [Google Scholar]
- Brandt, A. , Bast, J. , Scheu, S. , Meusemann, K. , Donath, A. , Schütte, K. , Machida, R. , & Kraaijeveld, K. (2019). No signal of deleterious mutation accumulation in conserved gene sequences of extant asexual hexapods. Scientific Reports, 9(1), 5338. 10.1038/s41598-019-41821-x [DOI] [PMC free article] [PubMed] [Google Scholar]
- Brandt, A. , Schaefer, I. , Glanz, J. , Schwander, T. , Maraun, M. , Scheu, S. , & Bast, J. (2017). Effective purifying selection in ancient asexual oribatid mites. Nature Communications, 8(1), 873. 10.1038/s41467-017-01002-8 [DOI] [PMC free article] [PubMed] [Google Scholar]
- Bromham, L. , Rambaut, A. , & Harvey, P. H. (1996). Determinants of rate variation in mammalian DNA sequence evolution. Journal of Molecular Evolution, 43(6), 610–621. 10.1007/BF02202109 [DOI] [PubMed] [Google Scholar]
- Burge, C. , & Karlin, S. (1997). Prediction of complete gene structures in human genomic DNA. Journal of Molecular Biology, 268(1), 78–94. 10.1006/jmbi.1997.0951 [DOI] [PubMed] [Google Scholar]
- Burton, J. N. , Adey, A. , Patwardhan, R. P. , Qiu, R. , Kitzman, J. O. , & Shendure, J. (2013). Chromosome‐scale scaffolding of de novo genome assemblies based on chromatin interactions. Nature Biotechnology, 31(12), 1119–1125. 10.1038/nbt.2727 [DOI] [PMC free article] [PubMed] [Google Scholar]
- Calderoni, L. , Rota‐Stabelli, O. , Frigato, E. , Panziera, A. , Kirchner, S. , Foulkes, N. S. , Kruckenhauser, L. , Bertolucci, C. , & Fuselli, S. (2016). Relaxed selective constraints drove functional modifications in peripheral photoreception of the cavefish P. andruzzii and provide insight into the time of cave colonization. Heredity, 117(5), 383–392. 10.1038/hdy.2016.59 [DOI] [PMC free article] [PubMed] [Google Scholar]
- Castresana, J. (2000). Selection of conserved blocks from multiple alignments for their use in phylogenetic analysis. Molecular Biology and Evolution, 17(4), 540–552. 10.1093/oxfordjournals.molbev.a026334 [DOI] [PubMed] [Google Scholar]
- Charlesworth, J. , & Eyre‐Walker, A. (2007). The other side of the nearly neutral theory, evidence of slightly advantageous back‐mutations. Proceedings of the National Academy of Sciences of the United States of America, 104(43), 16992–16997. 10.1073/pnas.0705456104 [DOI] [PMC free article] [PubMed] [Google Scholar]
- Chen, S. , Sheraliev, B. , & Peng, Z. (2021). Triplophysa wulongensis, a new species of cave‐dwelling loach (Teleostei, Nemacheilidae) from Chongqing, Southwest China. ZooKeys, 1026, 179–192. 10.3897/zookeys.1026.61570 [DOI] [PMC free article] [PubMed] [Google Scholar]
- Chikina, M. , Robinson, J. D. , & Clark, N. L. (2016). Hundreds of genes experienced convergent shifts in selective pressure in marine mammals. Molecular Biology and Evolution, 33(9), 2182–2192. 10.1093/molbev/msw112 [DOI] [PMC free article] [PubMed] [Google Scholar]
- Cui, R. , Medeiros, T. , Willemsen, D. , Iasi, L. N. M. , Collier, G. E. , Graef, M. , Reichard, M. , & Valenzano, D. R. (2019). Relaxed selection limits lifespan by increasing mutation load. Cell, 178(2), 385–399. 10.1016/j.cell.2019.06.004 [DOI] [PubMed] [Google Scholar]
- Culver, D. C. , & Pipan, T. (2009). The biology of caves and other subterranean habitats. Oxford University Press. [Google Scholar]
- Culver, D. C. , & Pipan, T. (2010). Climate, abiotic factors, and the evolution of subterranean life. Acta Carsologica, 39, 577–586. 10.3986/ac.v39i3.85 [DOI] [Google Scholar]
- Dapper, A. L. , & Wade, M. J. (2020). Relaxed selection and the rapid evolution of reproductive genes. Trends in Genetics, 36(9), 640–649. 10.1016/j.tig.2020.06.014 [DOI] [PubMed] [Google Scholar]
- Davies, K. T. J. , Bennett, N. C. , Faulkes, C. G. , & Rossiter, S. J. (2018). Limited evidence for parallel molecular adaptations associated with the subterranean niche in mammals: A comparative study of three superorders. Molecular Biology and Evolution, 35(10), 2544–2559. 10.1093/molbev/msy161 [DOI] [PMC free article] [PubMed] [Google Scholar]
- Davies, T. J. , Savolainen, V. , Chase, M. W. , Moat, J. , & Barraclough, T. G. (2004). Environmental energy and evolutionary rates in flowering plants. Proceedings of the Biological Sciences, 271(1553), 2195–2200. 10.1098/rspb.2004.2849 [DOI] [PMC free article] [PubMed] [Google Scholar]
- Elango, N. , Lee, J. , Peng, Z. , Loh, Y. H. , & Yi, S. V. (2009). Evolutionary rate variation in Old World monkeys. Biology Letters, 5(3), 405–408. 10.1098/rsbl.2008.0712 [DOI] [PMC free article] [PubMed] [Google Scholar]
- Emerling, C. A. , & Springer, M. S. (2014). Eyes underground: Regression of visual protein networks in subterranean mammals. Molecular Phylogenetics and Evolution, 78, 260–270. 10.1016/j.ympev.2014.05.016 [DOI] [PubMed] [Google Scholar]
- English, A. C. , Richards, S. , Han, Y. , Wang, M. , Vee, V. , Qu, J. , Qin, X. , Muzny, D. M. , Reid, J. G. , Worley, K. C. , & Gibbs, R. A. (2012). Mind the gap: Upgrading genomes with Pacific biosciences RS long‐read sequencing technology. PLoS One, 7(11), e47768. 10.1371/journal.pone.0047768 [DOI] [PMC free article] [PubMed] [Google Scholar]
- Espinasa, M. , & Espinasa, L. (2008). Losing sight of regressive evolution. Evolution: Education and Outreach, 1, 509–516. 10.1007/s12052-008-0094-z [DOI] [Google Scholar]
- Fang, X. , Nevo, E. , Han, L. , Levanon, E. Y. , Zhao, J. , Avivi, A. , Larkin, D. , Jiang, X. , Feranchuk, S. , Zhu, Y. , Fishman, A. , Feng, Y. , Sher, N. , Xiong, Z. , Hankeln, T. , Huang, Z. , Gorbunova, V. , Zhang, L. , Zhao, W. , … Wang, J. (2014). Genome‐wide adaptive complexes to underground stresses in blind mole rats Spalax. Nature Communications, 5, 3966. 10.1038/ncomms4966 [DOI] [PubMed] [Google Scholar]
- Frith, M. C. (2011). Gentle masking of low‐complexity sequences improves homology search. PLoS One, 6(12), e28819. 10.1371/journal.pone.0028819 [DOI] [PMC free article] [PubMed] [Google Scholar]
- Gnerre, S. , Maccallum, I. , Przybylski, D. , Ribeiro, F. J. , Burton, J. N. , Walker, B. J. , Sharpe, T. , Hall, G. , Shea, T. P. , Sykes, S. , Berlin, A. M. , Aird, D. , Costello, M. , Daza, R. , Williams, L. , Nicol, R. , Gnirke, A. , Nusbaum, C. , Lander, E. S. , & Jaffe, D. B. (2011). High‐quality draft assemblies of mammalian genomes from massively parallel sequence data. Proceedings of the National Academy of Sciences of the United States of America, 108(4), 1513–1518. 10.1073/pnas.1017351108 [DOI] [PMC free article] [PubMed] [Google Scholar]
- Gore, A. V. , Tomins, K. A. , Iben, J. , Ma, L. , Castranova, D. , Davis, A. E. , Parkhurst, A. , Jeffery, W. R. , & Weinstein, B. M. (2018). An epigenetic mechanism for cavefish eye degeneration. Nature Ecology and Evolution, 2(7), 1155–1160. 10.1038/s41559-018-0569-4 [DOI] [PMC free article] [PubMed] [Google Scholar]
- Gross, J. B. , Furterer, A. , Carlson, B. M. , & Stahl, B. A. (2013). An integrated transcriptome‐wide analysis of cave and surface dwelling Astyanax mexicanus . PLoS One, 8(2), e55659. 10.1371/journal.pone.0055659 [DOI] [PMC free article] [PubMed] [Google Scholar]
- Haas, B. J. , Salzberg, S. L. , Zhu, W. , Pertea, M. , Allen, J. E. , Orvis, J. , White, O. , Buell, C. R. , & Wortman, J. R. (2008). Automated eukaryotic gene structure annotation using EVidenceModeler and the program to assemble spliced alignments. Genome Biology, 9(1), R7. 10.1186/gb-2008-9-1-r7 [DOI] [PMC free article] [PubMed] [Google Scholar]
- Hamada, M. , Ono, Y. , Asai, K. , & Frith, M. C. (2017). Training alignment parameters for arbitrary sequencers with LAST‐TRAIN. Bioinformatics, 33(6), 926–928. 10.1093/bioinformatics/btw742 [DOI] [PMC free article] [PubMed] [Google Scholar]
- Henry, L. , Schwander, T. , & Crespi, B. J. (2012). Deleterious mutation accumulation in asexual Timema stick insects. Molecular Biology and Evolution, 29(1), 401–408. 10.1093/molbev/msr237 [DOI] [PubMed] [Google Scholar]
- Hervant, F. , Mathieu, J. , & Barre, H. (1999). Comparative study on the metabolic responses of subterranean and surface‐dwelling amphipods to long‐term starvation and subsequent refeeding. The Journal of Experimental Biology, 202 Pt 24, 3587–3595. [DOI] [PubMed] [Google Scholar]
- Hervant, F. , Mathieu, J. , Barre, H. , & Simon, K. (1998). Long‐term starvation and re‐feeding in hypogean and epigean crustaceans: Survival, locomotory and respiratory adaptations. Mémoires de Biospéologie, 25, 15–23. [Google Scholar]
- Hervant, F. , Mathieu, J. , & Durand, J. (2001). Behavioural, physiological and metabolic responses to long‐term starvation and refeeding in a blind cave‐dwelling (Proteus anguinus) and a surface‐dwelling (Euproctus asper) salamander. The Journal of Experimental Biology, 204(Pt 2), 269–281. [DOI] [PubMed] [Google Scholar]
- Hinaux, H. , Poulain, J. , Da Silva, C. , Noirot, C. , Jeffery, W. R. , Casane, D. , & Retaux, S. (2013). De novo sequencing of Astyanax mexicanus surface fish and Pachon cavefish transcriptomes reveals enrichment of mutations in cavefish putative eye genes. PLoS One, 8(1), e53553. 10.1371/journal.pone.0053553 [DOI] [PMC free article] [PubMed] [Google Scholar]
- Hoff, K. J. , Lange, S. , Lomsadze, A. , Borodovsky, M. , & Stanke, M. (2016). BRAKER1: Unsupervised RNA‐seq‐based genome annotation with GeneMark‐ET and AUGUSTUS. Bioinformatics, 32(5), 767–769. 10.1093/bioinformatics/btv661 [DOI] [PMC free article] [PubMed] [Google Scholar]
- Howarth, F. G. , & Moldovan, O. T. (2018). The ecological classification of cave animals and their adaptations. In Moldovan O., Kováč Ľ., & Halse S. (Eds.), Cave ecology. Ecological studies (analysis and synthesis) (Vol. 235, pp. 41–67). Springer. 10.1007/978-3-319-98852-8_4 [DOI] [Google Scholar]
- Huang, J. (2012). Comparative studies on the gross anatomy and histological structure of the central nervous system between Triplophysa bleeker and the Triplophysa rosa (Master thesis). Southwest University.
- Huang, Z. , Titus, T. , Postlethwait, J. H. , & Meng, F. (2019). Eye degeneration and loss of otx5b expression in the cavefish Sinocyclocheilus tileihornes . Journal of Molecular Evolution, 87(7–8), 199–208. 10.1007/s00239-019-09901-8 [DOI] [PMC free article] [PubMed] [Google Scholar]
- Hubisz, M. J. , Pollard, K. S. , & Siepel, A. (2011). PHAST and RPHAST: Phylogenetic analysis with space/time models. Briefings in Bioinformatics, 12(1), 41–51. 10.1093/bib/bbq072 [DOI] [PMC free article] [PubMed] [Google Scholar]
- Hughes, L. C. , Orti, G. , Huang, Y. , Sun, Y. , Baldwin, C. C. , Thompson, A. W. , Arcila, D. , Betancur‐R, R. , Li, C. , Becker, L. , Bellora, N. , Zhao, X. , Li, X. , Wang, M. , Fang, C. , Xie, B. , Zhou, Z. , Huang, H. , Chen, S. , … Shi, Q. (2018). Comprehensive phylogeny of ray‐finned fishes (Actinopterygii) based on transcriptomic and genomic data. Proceedings of the National Academy of Sciences of the United States of America, 115(24), 6249–6254. 10.1073/pnas.1719358115 [DOI] [PMC free article] [PubMed] [Google Scholar]
- Hunt, B. G. , Ometto, L. , Wurm, Y. , Shoemaker, D. , Yi, S. V. , Keller, L. , & Goodisman, M. A. (2011). Relaxed selection is a precursor to the evolution of phenotypic plasticity. Proceedings of the National Academy of Sciences of the United States of America, 108(38), 15936–15941. 10.1073/pnas.1104825108 [DOI] [PMC free article] [PubMed] [Google Scholar]
- Hüppop, K. (1988). Phänomene und Bedeutung der Energieersparnis bei dem Höhlenfisch Astyanax fasciatus (Characidae) (Thesis). Universität Hamburg.
- Hüppop, K. , & Wilkens, H. (1991). Bigger eggs in subterranean Astyanax fasciatus (Characidae, Pisces). Journal of Zoological Systematics and Evolutionary Research, 29(4), 280–288. 10.1111/j.1439-0469.1991.tb00673.x [DOI] [Google Scholar]
- Jeffery, W. R. (2001). Cavefish as a model system in evolutionary developmental biology. Developmental Biology, 231(1), 1–12. 10.1006/dbio.2000.0121 [DOI] [PubMed] [Google Scholar]
- Jiménez‐Valverde, A. , Sendra, A. , Garay, P. , & Reboleira, A. S. P. S. (2017). Energy and speleogenesis: Key determinants of terrestrial species richness in caves. Ecology and Evolution, 7(23), 10207–10215. 10.1002/ece3.3558 [DOI] [PMC free article] [PubMed] [Google Scholar]
- Keilwagen, J. , Wenk, M. , Erickson, J. L. , Schattat, M. H. , Grau, J. , & Hartung, F. (2016). Using intron position conservation for homology‐based gene prediction. Nucleic Acids Research, 44(9), e89. 10.1093/nar/gkw092 [DOI] [PMC free article] [PubMed] [Google Scholar]
- Kimura, M. (1983). The neutral theory of molecular evolution. Cambridge University Press. [Google Scholar]
- Korf, I. (2004). Gene finding in novel genomes. BMC Bioinformatics, 5, 59. 10.1186/1471-2105-5-59 [DOI] [PMC free article] [PubMed] [Google Scholar]
- Kowalczyk, A. , Partha, R. , Clark, N. L. , & Chikina, M. (2020). Pan‐mammalian analysis of molecular constraints underlying extended lifespan. eLife, 9, e51089. 10.7554/eLife.51089 [DOI] [PMC free article] [PubMed] [Google Scholar]
- Kumar, S. , & Subramanian, S. (2002). Mutation rates in mammalian genomes. Proceedings of the National Academy of Sciences of the United States of America, 99(2), 803–808. 10.1073/pnas.022629899 [DOI] [PMC free article] [PubMed] [Google Scholar]
- Lahti, D. C. , Johnson, N. A. , Ajie, B. C. , Otto, S. P. , Hendry, A. P. , Blumstein, D. T. , Coss, R. G. , Donohue, K. , & Foster, S. A. (2009). Relaxed selection in the wild. Trends in Ecology & Evolution, 24(9), 487–496. 10.1016/j.tree.2009.03.010 [DOI] [PubMed] [Google Scholar]
- Lefébure, T. , Morvan, C. , Malard, F. , François, C. , Konecny‐Dupré, L. , Guéguen, L. , Weiss‐Gayet, M. , Seguin‐Orlando, A. , Ermini, L. , Sarkissian, C. , Charrier, N. P. , Eme, D. , Mermillod‐Blondin, F. , Duret, L. , Vieira, C. , Orlando, L. , & Douady, C. J. (2017). Less effective selection leads to larger genomes. Genome Research, 27(6), 1016–1028. 10.1101/gr.212589.116 [DOI] [PMC free article] [PubMed] [Google Scholar]
- Li, H. , & Durbin, R. (2009). Fast and accurate short read alignment with burrows‐wheeler transform. Bioinformatics, 25(14), 1754–1760. 10.1093/bioinformatics/btp324 [DOI] [PMC free article] [PubMed] [Google Scholar]
- Li, L. , Stoeckert, C. J., Jr. , & Roos, D. S. (2003). OrthoMCL: Identification of ortholog groups for eukaryotic genomes. Genome Research, 13(9), 2178–2189. 10.1101/gr.1224503 [DOI] [PMC free article] [PubMed] [Google Scholar]
- Li, W.‐H. (1997). Molecular evolution. Sinauer Associates. [Google Scholar]
- Liu, S. Q. , Mayden, R. L. , Zhang, J. B. , Yu, D. , Tang, Q. Y. , Deng, X. , & Liu, H. Z. (2012). Phylogenetic relationships of the Cobitoidea (Teleostei: Cypriniformes) inferred from mitochondrial and nuclear genes with analyses of gene evolution. Gene, 508(1), 60–72. 10.1016/j.gene.2012.07.040 [DOI] [PubMed] [Google Scholar]
- Loytynoja, A. (2014). Phylogeny‐aware alignment with PRANK. Methods in Molecular Biology, 1079, 155–170. 10.1007/978-1-62703-646-7_10 [DOI] [PubMed] [Google Scholar]
- Luo, R. , Liu, B. , Xie, Y. , Li, Z. , Huang, W. , Yuan, J. , He, G. , Chen, Y. , Pan, Q. , Liu, Y. , Tang, J. , Wu, G. , Zhang, H. , Shi, Y. , Liu, Y. , Yu, C. , Wang, B. , Lu, Y. , Han, C. , … Wang, J. (2012). SOAPdenovo2: An empirically improved memory‐efficient short‐read de novo assembler. GigaScience, 1(1), 18. 10.1186/2047-217X-1-18 [DOI] [PMC free article] [PubMed] [Google Scholar]
- Lynch, M. (2007). The origins of genome architecture. Sinauer Associates Inc. [Google Scholar]
- Lynch, M. , & Conery, J. S. (2003). The origins of genome complexity. Science, 302(5649), 1401–1404. 10.1126/science.1089370 [DOI] [PubMed] [Google Scholar]
- Ma, L. , Gore, A. V. , Castranova, D. , Shi, J. , Ng, M. , Tomins, K. A. , van der Weele, C. M. , Weinstein, B. M. , & Jeffery, W. R. (2020). A hypomorphic cystathionine ss‐synthase gene contributes to cavefish eye loss by disrupting optic vasculature. Nature Communications, 11(1), 2772. 10.1038/s41467-020-16497-x [DOI] [PMC free article] [PubMed] [Google Scholar]
- Majoros, W. H. , Pertea, M. , & Salzberg, S. L. (2004). TigrScan and GlimmerHMM: Two open source ab initio eukaryotic gene‐finders. Bioinformatics, 20(16), 2878–2879. 10.1093/bioinformatics/bth315 [DOI] [PubMed] [Google Scholar]
- Martin, A. P. , & Palumbi, S. R. (1993). Body size, metabolic rate, generation time, and the molecular clock. Proceedings of the National Academy of Sciences of the United States of America, 90(9), 4087–4091. 10.1073/pnas.90.9.4087 [DOI] [PMC free article] [PubMed] [Google Scholar]
- McGaugh, S. E. , Gross, J. B. , Aken, B. , Blin, M. , Borowsky, R. , Chalopin, D. , Hinaux, H. , Jeffery, W. R. , Keene, A. , Ma, L. , Minx, P. , Murphy, D. , O'Quin, K. E. , Rétaux, S. , Rohner, N. , Searle, S. M. , Stahl, B. A. , Tabin, C. , Volff, J. N. , … Warren, W. C. (2014). The cavefish genome reveals candidate genes for eye loss. Nature Communications, 5, 5307. 10.1038/ncomms6307 [DOI] [PMC free article] [PubMed] [Google Scholar]
- McGowan, K. L. , Passow, C. N. , Arias‐Rodriguez, L. , Tobler, M. , & Kelley, J. L. (2019). Expression analyses of cave mollies (Poecilia mexicana) reveal key genes involved in the early evolution of eye regression. Biology Letters, 15(10), 20190554. 10.1098/rsbl.2019.0554 [DOI] [PMC free article] [PubMed] [Google Scholar]
- Meng, F. , Braasch, I. , Phillips, J. B. , Lin, X. , Titus, T. , Zhang, C. , & Postlethwait, J. H. (2013). Evolution of the eye transcriptome under constant darkness in Sinocyclocheilus cavefish. Molecular Biology and Evolution, 30(7), 1527–1543. 10.1093/molbev/mst079 [DOI] [PMC free article] [PubMed] [Google Scholar]
- Moran, D. , Softley, R. , & Warrant, E. J. (2015). The energetic cost of vision and the evolution of eyeless Mexican cavefish. Science Advances, 1(8), e1500363. 10.1126/sciadv.1500363 [DOI] [PMC free article] [PubMed] [Google Scholar]
- Moreno‐Hagelsieb, G. , & Latimer, K. (2008). Choosing BLAST options for better detection of orthologs as reciprocal best hits. Bioinformatics, 24(3), 319–324. 10.1093/bioinformatics/btm585 [DOI] [PubMed] [Google Scholar]
- Nadachowska‐Brzyska, K. , Burri, R. , Smeds, L. , & Ellegren, H. (2016). PSMC analysis of effective population sizes in molecular ecology and its application to black‐and‐white Ficedula flycatchers. Molecular Ecology, 25(5), 1058–1072. 10.1111/mec.13540 [DOI] [PMC free article] [PubMed] [Google Scholar]
- Nevo, E. (1979). Adaptive convergence and divergence of subterranean mammals. Annual Review of Ecology and Systematics, 10(1), 269–308. [Google Scholar]
- Niemiller, M. L. , Fitzpatrick, B. M. , Shah, P. , Schmitz, L. , & Near, T. J. (2013). Evidence for repeated loss of selective constraint in rhodopsin of amblyopsid cavefishes (Teleostei: Amblyopsidae). Evolution, 67(3), 732–748. 10.1111/j.1558-5646.2012.01822.x [DOI] [PubMed] [Google Scholar]
- Ohta, T. (1973). Slightly deleterious mutant substitutions in evolution. Nature, 246(5428), 96–98. 10.1038/246096a0 [DOI] [PubMed] [Google Scholar]
- Ohta, T. (1992). The nearly neutral theory of molecular evolution. Annual Review of Ecology and Systematics, 23, 263–286. [Google Scholar]
- Ohta, T. (2002). Near‐neutrality in evolution of genes and gene regulation. Proceedings of the National Academy of Sciences of the United States of America, 99(25), 16134–16137. 10.1073/pnas.252626899 [DOI] [PMC free article] [PubMed] [Google Scholar]
- Pace, C. N. , Fu, H. , Fryar, K. L. , Landua, J. , Trevino, S. R. , Shirley, B. A. , Hendricks, M. M. , Iimura, S. , Gajiwala, K. , Scholtz, J. M. , & Grimsley, G. R. (2011). Contribution of hydrophobic interactions to protein stability. Journal of Molecular Biology, 408(3), 514–528. 10.1016/j.jmb.2011.02.053 [DOI] [PMC free article] [PubMed] [Google Scholar]
- Partha, R. , Chauhan, B. K. , Ferreira, Z. , Robinson, J. D. , Lathrop, K. , Nischal, K. K. , Chikina, M. , & Clark, N. L. (2017). Subterranean mammals show convergent regression in ocular genes and enhancers, along with adaptation to tunneling. eLife, 6, e25884. 10.7554/eLife.25884 [DOI] [PMC free article] [PubMed] [Google Scholar]
- Pirri, F. , Ometto, L. , Fuselli, S. , Fernandes, F. A. N. , Ancona, L. , Bohec, C. L. , Zane, L. , & Trucchi, E. (2021). Selection‐driven adaptation to the extreme Antarctic environment in the emperor penguin. bioRxiv, 2021.12.14.471946. 10.1101/2021.12.14.471946 [DOI] [PMC free article] [PubMed] [Google Scholar]
- Policarpo, M. , Fumey, J. , Lafargeas, P. , Naquin, D. , Thermes, C. , Naville, M. , Dechaud, C. , Volff, J. N. , Cabau, C. , Klopp, C. , Møller, P. R. , Bernatchez, L. , García‐Machado, E. , Rétaux, S. , & Casane, D. (2021). Contrasting gene decay in subterranean vertebrates: Insights from cavefishes and fossorial mammals. Molecular Biology and Evolution, 38(2), 589–605. 10.1093/molbev/msaa249 [DOI] [PMC free article] [PubMed] [Google Scholar]
- Retaux, S. , & Casane, D. (2013). Evolution of eye development in the darkness of caves: Adaptation, drift, or both? EvoDevo, 4(1), 26. 10.1186/2041-9139-4-26 [DOI] [PMC free article] [PubMed] [Google Scholar]
- Rhie, A. , Walenz, B. P. , Koren, S. , & Phillippy, A. M. (2020). Merqury: Reference‐free quality, completeness, and phasing assessment for genome assemblies. Genome Biology, 21(1), 245. 10.1186/s13059-020-02134-9 [DOI] [PMC free article] [PubMed] [Google Scholar]
- Riddle, M. R. , Aspiras, A. C. , Gaudenz, K. , Peuss, R. , Sung, J. Y. , Martineau, B. , Peavey, M. , Box, A. C. , Tabin, J. A. , McGaugh, S. , Borowsky, R. , Tabin, C. J. , & Rohner, N. (2018). Insulin resistance in cavefish as an adaptation to a nutrient‐limited environment. Nature, 555(7698), 647–651. 10.1038/nature26136 [DOI] [PMC free article] [PubMed] [Google Scholar]
- Riek, R. P. , Handschumacher, M. D. , Sung, S. S. , Tan, M. , Glynias, M. J. , Schluchter, M. D. , Novotny, J. , & Graham, R. M. (1995). Evolutionary conservation of both the hydrophilic and hydrophobic nature of transmembrane residues. Journal of Theoretical Biology, 172(3), 245–258. 10.1006/jtbi.1995.0021 [DOI] [PubMed] [Google Scholar]
- Salmela, L. , & Rivals, E. (2014). LoRDEC: Accurate and efficient long read error correction. Bioinformatics, 30(24), 3506–3514. 10.1093/bioinformatics/btu538 [DOI] [PMC free article] [PubMed] [Google Scholar]
- Servant, N. , Varoquaux, N. , Lajoie, B. R. , Viara, E. , Chen, C. J. , Vert, J. P. , Heard, E. , Dekker, J. , & Barillot, E. (2015). HiC‐pro: An optimized and flexible pipeline for hi‐C data processing. Genome Biology, 16, 259. 10.1186/s13059-015-0831-x [DOI] [PMC free article] [PubMed] [Google Scholar]
- Shi, C. , Yao, M. , Lv, X. , Zhao, Q. , Peng, Z. , & Luo, Y. (2018). Body and organ metabolic rates of a cave fish, Triplophysa rosa: Influence of light and ontogenetic variation. Journal of Comparative Physiology. B, Biochemical, Systemic, and Environmental Physiology, 188(6), 947–955. 10.1007/s00360-018-1178-x [DOI] [PubMed] [Google Scholar]
- Shin, S. C. , Ahn, D. H. , Kim, S. J. , Pyo, C. W. , Lee, H. , Kim, M. K. , Lee, J. , Lee, J. E. , Detrich, H. W. , Postlethwait, J. H. , Edwards, D. , Lee, S. G. , Lee, J. H. , & Park, H. (2014). The genome sequence of the Antarctic bullhead notothen reveals evolutionary adaptations to a cold environment. Genome Biology, 15(9), 468. 10.1186/s13059-014-0468-1 [DOI] [PMC free article] [PubMed] [Google Scholar]
- Simao, F. A. , Waterhouse, R. M. , Ioannidis, P. , Kriventseva, E. V. , & Zdobnov, E. M. (2015). BUSCO: Assessing genome assembly and annotation completeness with single‐copy orthologs. Bioinformatics, 31(19), 3210–3212. 10.1093/bioinformatics/btv351 [DOI] [PubMed] [Google Scholar]
- Slater, G. S. , & Birney, E. (2005). Automated generation of heuristics for biological sequence comparison. BMC Bioinformatics, 6, 31. 10.1186/1471-2105-6-31 [DOI] [PMC free article] [PubMed] [Google Scholar]
- Soares, D. , & Niemiller, M. L. (2013). Sensory adaptations of fishes to subterranean environments. Bioscience, 63(4), 274–283. [Google Scholar]
- Stahl, B. A. , & Gross, J. B. (2017). A comparative transcriptomic analysis of development in two Astyanax cavefish populations. Journal of Experimental Zoology. Part B, Molecular and Developmental Evolution, 328(6), 515–532. 10.1002/jez.b.22749 [DOI] [PMC free article] [PubMed] [Google Scholar]
- Stamatakis, A. (2014). RAxML version 8: A tool for phylogenetic analysis and post‐analysis of large phylogenies. Bioinformatics, 30(9), 1312–1313. 10.1093/bioinformatics/btu033 [DOI] [PMC free article] [PubMed] [Google Scholar]
- Supek, F. , Bosnjak, M. , Skunca, N. , & Smuc, T. (2011). REVIGO summarizes and visualizes long lists of gene ontology terms. PLoS One, 6(7), e21800. 10.1371/journal.pone.0021800 [DOI] [PMC free article] [PubMed] [Google Scholar]
- Wang, K. , Shen, Y. , Yang, Y. , Gan, X. , Liu, G. , Hu, K. , Li, Y. , Gao, Z. , Zhu, L. , Yan, G. , He, L. , Shan, X. , Yang, L. , Lu, S. , Zeng, H. , Pan, X. , Liu, C. , Yuan, Y. , Feng, C. , … He, S. (2019). Morphology and genome of a snailfish from the Mariana trench provide insights into deep‐sea adaptation. Nature Ecology and Evolution, 3(5), 823–833. 10.1038/s41559-019-0864-8 [DOI] [PubMed] [Google Scholar]
- Wertheim, J. O. , Murrell, B. , Smith, M. D. , Kosakovsky Pond, S. L. , & Scheffler, K. (2015). RELAX: Detecting relaxed selection in a phylogenetic framework. Molecular Biology and Evolution, 32(3), 820–832. 10.1093/molbev/msu400 [DOI] [PMC free article] [PubMed] [Google Scholar]
- Whelan, S. , & Goldman, N. (2001). A general empirical model of protein evolution derived from multiple protein families using a maximum‐likelihood approach. Molecular Biology and Evolution, 18(5), 691–699. 10.1093/oxfordjournals.molbev.a003851 [DOI] [PubMed] [Google Scholar]
- Whitney, K. D. , Boussau, B. , Baack, E. J. , & Garland, T., Jr. (2011). Drift and genome complexity revisited. PLoS Genetics, 7(6), e1002092. 10.1371/journal.pgen.1002092 [DOI] [PMC free article] [PubMed] [Google Scholar]
- Whitney, K. D. , & Garland, T., Jr. (2010). Did genetic drift drive increases in genome complexity? PLoS Genetics, 6(8), e1001080. 10.1371/journal.pgen.1001080 [DOI] [PMC free article] [PubMed] [Google Scholar]
- Xu, P. , Xu, J. , Liu, G. , Chen, L. , Zhou, Z. , Peng, W. , Jiang, Y. , Zhao, Z. , Jia, Z. , Sun, Y. , Wu, Y. , Chen, B. , Pu, F. , Feng, J. , Luo, J. , Chai, J. , Zhang, H. , Wang, H. , Dong, C. , … Sun, X. (2019). The allotetraploid origin and asymmetrical genome evolution of the common carp Cyprinus carpio . Nature Communications, 10(1), 4625. 10.1038/s41467-019-12644-1 [DOI] [PMC free article] [PubMed] [Google Scholar]
- Yang, J. , Chen, X. , Bai, J. , Fang, D. , Qiu, Y. , Jiang, W. , Yuan, H. , Bian, C. , Lu, J. , He, S. , Pan, X. , Zhang, Y. , Wang, X. , You, X. , Wang, Y. , Sun, Y. , Mao, D. , Liu, Y. , Fan, G. , … Shi, Q. (2016). The Sinocyclocheilus cavefish genome provides insights into cave adaptation. BMC Biology, 14, 1. 10.1186/s12915-015-0223-4 [DOI] [PMC free article] [PubMed] [Google Scholar]
- Yang, Z. (1996). Among‐site rate variation and its impact on phylogenetic analyses. Trends in Ecology & Evolution, 11(9), 367–372. 10.1016/0169-5347(96)10041-0 [DOI] [PubMed] [Google Scholar]
- Yang, Z. (2007). PAML 4: Phylogenetic analysis by maximum likelihood. Molecular Biology and Evolution, 24(8), 1586–1591. 10.1093/molbev/msm088 [DOI] [PubMed] [Google Scholar]
- Yi, S. , & Streelman, J. T. (2005). Genome size is negatively correlated with population size in ray‐finned fish. Trends in Genetics, 21(12), 643–646. 10.1016/j.tig.2005.09.003 [DOI] [PubMed] [Google Scholar]
- Yi, S. V. (2006). Non‐adaptive evolution of genome complexity. BioEssays, 28(10), 979–982. 10.1002/bies.20478 [DOI] [PubMed] [Google Scholar]
- Zhao, Q. , Zhang, R. , Xiao, Y. , Niu, Y. , Shao, F. , Li, Y. , & Peng, Z. (2020). Comparative transcriptome profiling of the loaches Triplophysa bleekeri and Triplophysa rosa reveals potential mechanisms of eye degeneration. Frontiers in Genetics, 10, 1334. 10.3389/fgene.2019.01334 [DOI] [PMC free article] [PubMed] [Google Scholar]
Associated Data
This section collects any data citations, data availability statements, or supplementary materials included in this article.
Supplementary Materials
Appendix S1
Tables S16–S18
Tables S19–S21
Data Availability Statement
All data are available at NCBI under the Bioproject PRJNA673076. Short read sequences are deposited in the Sequence Read Archive (SRA) under accession nos. SRR13479655–13479666 and SRR13449942–13449957. The new Triplophysa rosa whole genome assembly has been deposited in DDBJ/ENA/GenBank under the accession no. JAFHDT000000000. The version described in this paper is version JAFHDT010000000.