

Summary
The shift from outcrossing to selfing is one of the main evolutionary transitions in plants. It is accompanied by profound effects on reproductive traits, the so‐called selfing syndrome. Because the transition to selfing also implies deep genomic and ecological changes, one also expects to observe a genomic selfing syndrome.
We took advantage of the three independent transitions from outcrossing to selfing in the Capsella genus to characterize the overall impact of mating system change on RNA expression, in flowers but also in leaves and roots. We quantified the extent of both selfing and genomic syndromes, and tested whether changes in expression corresponded to adaptation to selfing or to relaxed selection on traits that were constrained in outcrossers.
Mating system change affected gene expression in all three tissues but more so in flowers than in roots and leaves. Gene expression in selfing species tended to converge in flowers but diverged in the two other tissues. Hence, convergent adaptation to selfing dominates in flowers, whereas genetic drift plays a more important role in leaves and roots.
The effect of mating system transition is not limited to reproductive tissues and corresponds to both adaptation to selfing and relaxed selection on previously constrained traits.
Keywords: Capsella, convergent adaptation, gene expression, genomic and selfing syndromes, mating system change, relaxed selection
Introduction
Mating system has a profound effect on organism evolution, as it strongly impacts both the level and structure of genomic variation and the ecology of a species (Charlesworth & Wright, 2001; Barrett, 2002; Campbell & Kessler, 2013; Cutter, 2019; Glémin et al., 2019). Self‐fertilizing species are characterized by higher homozygosity and lower effective recombination rate than outcrossing ones (Charlesworth & Wright, 2001). Their effective population size also is smaller, which leads to an overall reduction in selection efficiency although selection against recessive alleles will be stronger as a result of the higher level of homozygosity (Hamrick & Godt, 1996; Charlesworth & Wright, 2001; Charlesworth & Meagher, 2003). In the short term, selfing is beneficial because of its inherent transmission advantage, and reproductive assurance when mates and/or pollinators are scarce (Lande, 1988; Leimu & Fischer, 2008; Ellison et al., 2011). However, in the long term, the reduction in effective population size (N e) associated to selfing leads to an accumulation of slightly deleterious mutations and may lower the adaptive capacity of the species. The shift in mating system also will be accompanied by major phenotypic changes (Wright et al., 2013). In particular, self‐fertilizing plant species no longer need to attract pollinators and are characterized by reduced flowers, and a low production of pollen, nectar and scent compared to their outcrossing relatives (Carr & Eubanks, 2002; Koslow & DeAngelis, 2006). Altogether, the most conspicuous changes associated with the transition from outcrossing to selfing have been called the selfing syndrome (Sicard & Lenhard, 2011; Rifkin et al., 2019, 2021; Tsuchimatsu & Fujii, 2022), and there is evidence of convergent evolution across species, at least for floral traits (Woźniak et al., 2020). Given the major impact of the shift from outcrossing to selfing on genetic diversity, population ecology and dynamics, one would expect the shift in mating system to also alter basic genomic processes such as gene expression (Thomas et al., 2012; Cutter, 2019), and therefore to affect phenotypic traits beyond those directly related to reproduction. In other words, in addition to a selfing syndrome related to reproductive traits (Woźniak et al., 2020), a significant genomic selfing syndrome also is expected (Arunkumar et al., 2016; Cutter, 2019; Wang et al., 2021) and may include (1) reduced molecular diversity and increased linkage disequilibrium, (2) accumulation of deleterious mutations (Kryvokhyzha et al., 2019a,b), (3) smaller genomes and reduced abundance or activity of transposable elements, and (4) greater structural chromosomal evolution (Cutter, 2019). The transition to selfing thus may also be expected to affect expression of genes globally. Here we shall investigate transcriptomic changes associated to selfing in three different tissues – flowers, roots and leaves. Patterns of gene expression are expected to be strongly altered in flowers (Woźniak et al., 2020) but also in other tissues, although probably not as profoundly as in flower. Such a ‘broad’ transcriptomic selfing syndrome also is indirectly supported by recent developments in quantitative genetics and in our understanding of the evolution of gene regulation, which both indicate that mutations associated to changes in expression of a given gene are not limited to core genes (i.e. genes directly regulating the gene under study, nor genes known a priori to regulate those), but instead are found across the whole genome (Boyle et al., 2017; Liu et al., 2019; Hill et al., 2021; Sinnott‐Armstrong et al., 2021). In other words, these results support the universal pleiotropy hypothesis that stems from Fisher's geometric model of evolution (Fisher, 1930), or at least seem in line with the widespread pleiotropy predicted by the omnigenic model (Boyle et al., 2017).
Generally, one would expect traits specifically related to reproduction to be more strongly affected by mating system shift than less related traits. Traits associated with the shift in mating system can evolve as a direct or indirect – in the case of correlated response – adaptation to the new conditions associated with self‐fertilization, that can be viewed as a new phenotypic optimum, and/or because the selection pressure associated with outcrossing is relaxed (Cutter, 2019; Rifkin et al., 2021; Tsuchimatsu & Fujii, 2022). Relaxed selection can take many forms (Lahti et al., 2009). In the specific case of the shift in mating system, the effect of relaxed selection will be two‐fold. First, because of the decrease in N e associated to the shift in mating system, selection will be potentially less effective, especially for traits on which selection is intrinsically weak. Secondly, for some specific traits selection pressure will be alleviated independently of the decrease in N e. For instance, nectar is no longer needed in selfers, and therefore selection on traits related to nectar production and display will be altered. Selection may initially be relaxed but positive selection for lower nectar production and display may follow in a second step because maintaining functions that are no longer required can represent substantial metabolic cost. Much less is known about the impact of change in mating system on RNA expression. If the shift in mating system is initially accompanied by relaxed selection, one would expect a more random pattern of expression than under purifying or positive selection. Most of the studies conducted so far have focused on changes in expression occurring in flowers (e.g. Woźniak et al., 2020) or aimed at identifying genes underlying the change in mating system (Tsuchimatsu & Fujii, 2022), and paid less attention to gene expression changes occurring in vegetative tissues (but see Frazee et al., 2021). More generally, few studies have investigated the role of natural selection in mating system shift and fewer still have considered traits that were not a priori elements of the selfing syndrome.
The Capsella genus comprises one outcrossing species, C. grandiflora, and three self‐fertilizing ones, C. orientalis, C. rubella and C. bursa‐pastoris. Capsella grandiflora, C. orientalis and C. rubella are diploids, whereas C. bursa‐pastoris is an allotetraploid. Capsella orientalis and C. grandiflora derived from a common ancestor some 1 million years ago, and C. rubella and C. grandiflora diverged c. 50 000 yr ago (Douglas et al., 2015). Capsella bursa‐pastoris originated from a hybrid between C. grandiflora and C. orientalis c. 100 000 yr ago (Fig. 1a; Douglas et al., 2015). Hence, all three transitions to selfing occurred independently (Hurka et al., 2012; Douglas et al., 2015; Bachmann et al., 2019), and in Capsella, as in other genera, the change from outcrossing to selfing is accompanied by a characteristic set of changes to the morphology and function of flowers, with evidence of convergent evolution of floral traits in C. rubella and C. orientalis (Woźniak et al., 2020). In Kryvokhyzha et al. (2019a) we studied the expression changes in the allo‐tetraploid C. bursa‐pastoris and showed that the expression of each subgenome was biased towards the expression of their corresponding parental species, thereby demonstrating a conserved phylogenetic signal in expression across tissues. In addition to the phylogenetic signal, RNA expression also showed tissue‐specific patterns. In flowers, expression was globally biased towards the selfing parent, C. orientalis, whereas in leaves and roots the expression was globally biased towards the outcrossing parent, C. grandiflora. We proposed that selection associated to the change in mating system drove the convergence in expression in flowers between the two selfing species (C. bursa‐pastoris and C. orientalis), whereas a lower accumulation rate of deleterious mutation on the subgenome inherited from the outcrossing species, C. grandiflora, explained the bias in expression towards the outcrossing parental species in leaves and roots. In summary, the impact of selfing on both flower morphology (Woźniak et al., 2020) and genetic load (Kryvokhyzha et al., 2019a) have already been thoroughly described in Capsella, and in both cases there was evidence of a strong selfing syndrome. In the present study, we took advantage of the three independent transitions from outcrossing to selfing that occurred in the Capsella genus to further study the overall impact of mating system change on RNA expression, not only in flowers but also in leaves and roots. In particular, we quantified the extent of the genomic syndrome and tested whether changes in gene expression correspond to adaptation to selfing or to relaxed selection on genes that were involved in the control of traits constrained in outcrossers (Tsuchimatsu & Fujii, 2022). We focused our analysis on the three diploid species and only used the tetraploid self‐fertilizing C. bursa‐pastoris to confirm the results obtained with the diploid species. Finally, we carried out a GO analysis of differentially expressed genes between selfing and outcrossing species in order to facilitate comparison between our study and other studies on convergent evolution in selfing species and assess the breadth of the genomic selfing syndrome.
Fig. 1.
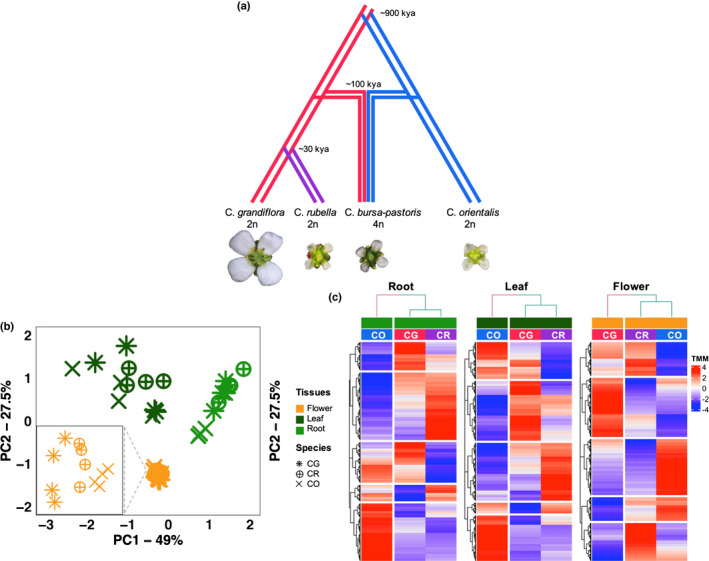
Overall gene expression clusters by tissue, and by mating system in flower and phylogeny in root and leaf. (a) Evolutionary history of four species in Capsella genus. Species are labeled with specific colors: pink, C. grandiflora (CG); purple, C. rubella (CR); sky‐blue, C. orientalis (CO). (b) Principal component analysis. Different tissues are represented by different colors and species by different shapes: orange, flower; dark green, leaf; light green, root. The zoomed‐in plot for flowers is shown at the bottom left. (c) Heatmaps based on TMM normalized reads counts for 17 307 transcripts of CR (selfer), CG (outcrosser) and CO (selfer) for the three tissues: ‘Root’, left panels, ‘Leaf’, middle panels and ‘Flower’, right panels. For each heatmap, each row represents a transcript and each column represents the mean expression value of a species. The higher the expression value the darker the red, and conversely the lower the blue the lower the expression. The upper dendrogram shows the hierarchical relationships among species, and the row dendrogram shows the hierarchical relationships of gene expression for a specific tissue. Species are labeled with specific colors: pink, CG; purple, CR; sky‐blue, CO.
Materials and Methods
Samples and sequencing
In the present study, we re‐used the RNA‐seq data that were generated in Kryvokhyzha et al. (2019a) for three of the four species of the Capsella genus: C. grandiflora (Fauché & Chaub.) Boiss. (diploid, outcrosser), C. orientalis Klokov (diploid, selfer) and C. bursa‐pastoris (L.) Medik. (allotetraploid, selfer). We added to this dataset, four accessions from C. rubella Reut. (diploid, selfer). These additional C. rubella accessions were part of the same experiment as accessions from the three other Capsella species. They were thus pre‐processed simultaneously with those and according to the same protocol. Briefly, seeds were surface‐sterilized and sown into agar plates as described in Kryvokhyzha et al. (2019a,b). Following sterilization and germination, seedlings were transplanted into pots (10 × 10 × 10 cm) filled with soil 7 d after germination and cultivated in growth chamber (22°C, 16 h : 8 h, light : dark photoperiod, light intensity 150 μmol m−2 s−1). One week after the onset of flowering, flower buds, leaves and roots were collected. We collected closed green buds (without visible white petals) one week after the onset of flowering. We waited for a week after the onset of flowering to allow more buds to form and thus to have enough tissue for extraction. Tissues were immediately frozen in liquid nitrogen and stored at −80°C before RNA extraction. RNA was extracted from three different tissues: flowers, leaves and roots. Number of samples, accession names and sampling locations, and total library size per sample and per tissue, as well as the references of the sequences, are provided in Table S1. Total RNA of all four species was extracted and sequenced at the same time, following the same protocol (Kryvokhyzha et al., 2019a), described in Methods S1. For all downstream analyses we filtered transcripts and considered a total of n = 17 307 genes (see below).
Analysis of gene expression in diploid species.
Only samples from the three diploid species (C. grandiflora, C. orientalis and C. rubella) were used in the initial analyses to detect genes potentially involved in the transition from outcrossing to selfing. Capsella bursa‐pastoris was not included at that stage in order to limit confounding effects of polyploidy and hybridization, but was used as a control later on (see below).
RNA expression variation pattern
Initially, in order to assess the overall gene expression pattern (e.g. across tissues, across species and between species with different mating systems) principal component analyses (PCAs) were performed on normalized reads count (TMM normalization, edger package (v.3.32.1; Robinson et al., 2010) using the prcomp function, in R (R Core Team, 2013)). For any given gene, missing data were imputed as being the average expression value of each species and tissue. Then, for each tissue taken separately, more subtle variation in expression was analyzed using heatmaps (Heatmap function in R/complexheatmap (v.2.7.10; Gu et al., 2016), with distance method ‘euclidean’ and clustering method ‘ward.D’).
Differential gene expression analysis
Differential gene expression analyses were conducted using TMM normalization in R/edger (Robinson et al., 2010). We used strict criteria when trimming the transcripts. First, in order to be retained a transcript should have a nonzero expression in at least one sample per species, and this should be satisfied in all three tissues. Second, each transcript should have a nonzero expression in at least five samples in each tissue (n = 17 307). In each comparison, genes differentially expressed between groups and with an FDR‐adjusted P‐value of 0.05 were considered as differentially expressed and hereafter called ‘DE genes’.
Quantification of global effect of mating system transition on gene expression
We developed two indices to compare the relative distance in gene expression between different pairs of species and account for the effect of mating system change and phylogenetic inertia (Fig. 1a). Some pairs are phylogenetically distant but either share the same mating system (C. rubella, CR, and C. orientalis, CO, both selfers), or have different ones (C. grandiflora, CG, and C. orientalis, CO, respectively outcrosser and selfer), whereas others are phylogenetically close but differ in mating system (C. rubella and C. grandiflora). Both indices are centered on 0 and constrained between −1 and 1.
For each transcript i, the first distance index, D CR , was computed as the difference between the absolute difference in normalized expression between the two selfers ( and ) and the absolute differences in normalized expression between CG and CR ( and ).
| (Eqn 1) |
indicates that the expression of a gene, i, in C. rubella is closer to the expression of the same gene in C. orientalis than in C. grandiflora. indicates that the expression of a given gene in C. rubella is closer to that in C. grandiflora than in C. orientalis. Finally, indicates that the expression in C. rubella is as distant from C. orientalis as it is from C. grandiflora.
Likewise, D CO for transcript i is defined as:
| (Eqn 2) |
D CO < 0 indicates that CO expression is closer to that of CR than to that of CG, D CO > 0 is the opposite (CO closer to CG than to CR), D CO ≈ 0 indicates that CO expression is equidistant from CG and CR.
In order to test whether the observed distributions of D CR or D CO could have been observed in the absence of selection we used simulations. The evolution of gene expression can be simulated as an Ornstein–Uhlenbeck (OU) process running on the phylogenetic tree (Felsenstein, 1988; Hansen, 1997; Nourmohammad et al., 2017). An OU process can be described by the following stochastic differential equation, with parameters α, θ and σ:
| (Eqn 3) |
where θ is the optimum trait value, α is the strength of the force moving the trait towards the optimum (~ selection) and dB is a Wiener process (aka Brownian motion) with variance σ (~ drift). We used the function rcOU of R/sde. For simplicity, we assume that the ancestral value is X 0 = 0 and that the optimum value also is θ = 0. As we are interested in simulating the null hypothesis, we consider constant parameters along the phylogeny. When α tends towards 0, the process is equivalent to a Brownian motion, so expression is evolving under a pure random genetic drift model. If α > 0, the process corresponds to uniform stabilizing selection along the phylogeny. In practice the parameter α cannot be set exactly to 0, so we used a very low value to simulate a Brownian motion. The evolution of 20 000 genes were simultaneously simulated. Details are given in Notes S1.
In order to further test for selection and, more specifically, assess whether the selfing syndrome involved adaptation and/or relaxed selection, we calculated the πN : πS ratio for each transcript, where πN is the nonsynonymous nucleotide diversity and πS is the synonymous nucleotide diversity (Chen et al., 2017). πN/πS measures the efficiency of purifying selection: efficient purifying selection will lower πN/πS whereas weak selection will lead to high values. For each transcript in each tissue, the per‐site πS and πN diversity in focal species were calculated using the ‘dNdSpiNpiS’ function, which is part of the software PopPhyl, a specific pipeline designed to handle transcriptome‐based NGS data (Cahais et al., 2012). Details are provided in Methods S1. To minimize the variance between genes resulting from SNPs number differences between genes, πN and πS values first were weighted by the respective number of complete sites:
where ncs i is the number of complete sites used for πN and πS calculation in transcript i. Negative values of the D CO index indicate convergence of expression in the self‐fertilizing species, whereas positive values indicate less constrains. If the convergence is driven primarily by natural selection, then we would expect the πN : πS ratio to be smaller for negative D CO than for genes with positive values of the index and even more so in selfing species. The dataset thus was ordered according to increasing D CO values and and were summed over sliding windows of 100 transcripts. Average πN : πS ratios then were computed for bins of n = 10 transcripts:
Classification of differentially expressed genes and mating system transition gene identification
In order to identify differentially expressed genes associated to mating system shift (hereafter DEself genes), we first compared the whole gene expression dataset between pairs of species (CR vs CG, CO vs CG, and CR vs CO) for each tissue separately. For each transcript, in each comparison, we use the same method and threshold than for the identification of DE genes described above. We then compared DE gene lists across pairwise comparisons to define the set of mating system differentially expressed genes. A gene is DEself when it satisfied the two following criteria: (1) expression significantly differed between the outcrosser and both selfers but not between selfers (i.e. DE between C. grandiflora and C. orientalis and between C. grandiflora and C. rubella, but not between C. orientalis and C. rubella) and (2) for a given gene, this pattern is specific to flower tissue. Following Woźniak et al. (2020) co‐differentially expressed genes (coDEGs) were defined as genes that are DE between each of the selfing species and the outcrosser, and that show changes in the same direction relative to the outcrosser.
In flower only, we further investigated genes putatively involved in mating system transition using the gene co‐expression network analysis implemented in the ‘Weighted correlation network analysis’ R/wgcna package (v.1.70‐3, optimal soft threshold of ‘power = 10’; Langfelder & Horvath, 2008). The cutreeDynamic function (minClusterSize = 30 & deepSplit = 2) build in wgcna (minClusterSize = 30 & deepSplit = 2) was used for tree trimming of the gene hierarchical clustering dendrograms to define co‐expression modules. Modules with dissimilarity of module eigengenes (ME) lower than 0.25 were merged. The strength of association between co‐expression modules and mating system was quantified using Pearson's correlation coefficient.
Genes expressed in flowers that are DESelf and that belong to co‐expression network associated with mating system were called mating system transition related genes, hereafter MST genes.
Gene ontology enrichment analysis
Gene ontology (GO) enrichment tests were performed using R/topGO (v.2.42; Alexa & Rahnenfuhrer, 2020). The GO term database for C. rubella was downloaded from PlantRegMap (http://plantregmap.gao‐lab.org) and was used as reference for enrichment tests. We used a custom background list of genes that included only genes with a nonzero expression value in at least one sample per species and tissue (n = 17 307). Significance of enrichment was tested using Fisher's exact‐tests (FDR < 0.05) either for molecular functions (MF) or biological processes (BP) related GO terms. Finally, we used REViGO (http://revigo.irb.hr; Supek et al., 2011) with the Arabidopsis thaliana database to remove GO terms redundancy (medium, 0.7) and to cluster the remaining terms in a 2D space derived by applying multidimensional scaling to a matrix of the GO terms semantic similarities.
Ascertaining the global effect of mating system shift using the tetraploid selfer C. bursa‐pastoris
Capsella bursa‐pastoris (Cbp) originated from the hybridization between C. orientalis and C. grandiflora but retained both parental genomes, one inherited from the outcrosser (Cbp Cg ) and one from the selfer (Cbp Co ). As an additional test of our hypothesis about the global effect of mating system transition on gene expression, we computed a similarity index () exactly as in Kryvokhyzha et al. (2019a) except that we replaced C. grandiflora with C. rubella. The quantifies the similarity between the expression level of each subgenome and the expression level in the ‘parental’ species. For each transcript i and each subgenome , S was computed as the subgenome relative expression deviation from the mean expression level in the ‘parental’ species (). In the present study, as in Kryvokhyzha et al.'s (2019a) initial analysis, or when CG was substituted by CR.
| (Eqn 4) |
where is the expression of a given transcript i, from a given genetic background j, ( or subgenomes of C. bursa‐pastoris). This index is centered and oriented to one parental species so that > 0 (respectively, < 0) indicates that the expression of transcript i is more similar (respectively, different) to the expression of parental species j.
Results
Global pattern of gene expression changes in diploids across three tissues
We used a PCA to explore the global pattern of gene expression variation (n = 17 307) among the three diploid Capsella species (CR, CG and CO) and the three tissues (flowers, leaves and roots). Most of the variance in expression was between tissues (PC1 and PC2 together explained 76.5%; Fig. 1b). Consequently, tissues were analyzed separately in later analyses. Species clustered according to phylogenetic relationships in roots and leaves (i.e. CR and CG vs CO) and according to mating system in flowers (Figs 1c, S1). This difference in clustering was a consequence of both up‐ and downregulation in the selfing species (CR and CO) compared with the outcrossing species (block 2 and 4 in Fig. 1c). However, the shift to selfing was more often accompanied by downregulation (downregulated genes were at least twice as many as upregulated ones).
Disentangling phylogenetic signal from mating system transition effect on gene expression using distance indices
The first index, D CR , measures the relative distance in expression between CR and CO, on the one hand, and CR and CG, on the other. As expected, the overall distribution of D CR is biased towards 1 (CR closer to CG than to CO), indicating that phylogenetic relationships explain most of the variation in gene expression in all three tissues (median D CR_flower = 0.19, D CR_root = 0.37 and D CR_leaf = 0.37). However, the distribution of D CR in flowers differed from that in leaves and roots, and was characterized by an excess of negative values (Fig. 2a). For many genes, the expression between the two selfers (CR and CO) is thus closer than what would be expected given their phylogenetic relationships, suggesting the presence of convergent evolution in gene expression. The pattern was similar but more pronounced when D CR index was calculated only for genes that are differentially expressed (DE, FDR < 0.05) between CG and CO (median D CR_flower = 0.42, D CR_leaf = 0.69 and D CR_root = 0.71, Fig. 2c). The negative fraction of the distribution of the D CR index in all three tissues implies that there are still a substantial number of genes with similar expression levels in CR and CO when only DE genes between CG and CO are considered (38.67%, 21.68% and 18.94%, respectively for flower, leaf and root).
Fig. 2.
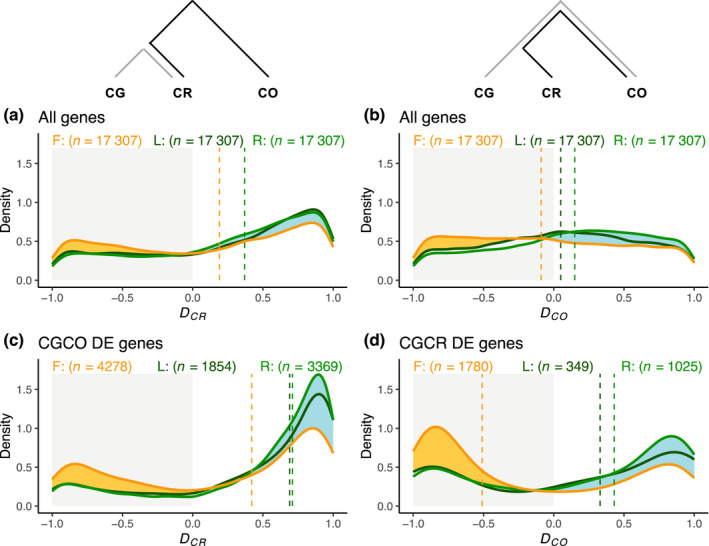
Global effect of mating system transition and phylogeny on gene expression. (a, c) The D CR index compares gene expression difference between Capsella rubella (CR) and C. orientalis (CO) (black line in the upper schematic plot), on the one hand, and the difference between C. rubella (CR) and C. grandiflora (CG) (gray line in the upper schematic plot), on the other (see Eqn 2 in the text). D CR < 0 indicates that CR expression is closer to that of CO than to that of CG, D CR > 0 is the opposite (CR closer to CG than to CO), D CR ≈ 0 indicates that CR expression is equidistant from CG and CO. Dotted lines are the median of the distribution of the D CR index for the three tissues. (a) all genes; (c) differentially expressed (DE) genes between CG and CO. Both D CO and D CR value ranges from −1 to 1. (b, d) The D CO index compares gene expression difference between C. orientalis (CO) and C. rubella (CR) ¦CO–CR¦ (black line in the upper schematic plot), on the one hand, and the difference between C. orientalis (CO) and C. grandiflora (CG) (gray line in the upper schematic plot), on the other (see Eqn 1 in the text). D CO < 0 indicates that CO expression is closer to that of CR than to that of CG, D CO > 0 is the opposite (CO closer to CG than to CR), D CO ≈ 0 indicates that CO expression is equidistant from CG and CR. Flower, yellow; leaf, dark green; root, light green. Dotted lines are the median of the distribution of the D CO index for the three tissues. (b) All genes; (d) DE genes between CG and CR.
The second index, D CO , measures the relative distance in expression between CR and CO, on the one hand, and CG and CO, on the other, and allows controlling for the effect of phylogenetic distance on gene expression. The distribution of D CO is slightly positively biased (CO closer to CG than to CR) in leaves and roots (median D CO_leaf = 0.05 and D CO_root = 0.15) and slightly negatively biased (CO closer to CR than to CG) in flowers (median D CO_flower = −0.09). This indicates that in flowers constraints on gene expression evolution probably associated to mating system transition makes CO and CR more similar than expected, supporting the pattern of convergent evolution detected with D CR . Interestingly, even though negative D CO values were less frequent in leaves and roots than in flowers, they are still far from negligible, indicating that a substantial number of genes in leaves and roots also were influenced by mating system transition through the genomic selfing syndrome. When we only considered DE genes between CG and CR, the distribution of D CO was similar but the expression of CO is even closer to CG than to CR in leaves and roots (median D CO_leaf = 0.33 and D CO_root = 0.43) whereas, as expected, the expression of the two selfing species are even closer in flowers (median D CO_flower = −0.51) (Fig. 2d). Note that considering only DE genes led to a larger increase in bias in flower (0.42) than in root and leaves (0.28 each).
In order to test whether the observed distributions of D CR or D CO could have been observed under a pure drift model, we simulated a OU process for 20 000 independent genes under a pure drift model. No combination of parameters in the OU simulations led to the observed distribution of D CR or D CO and departure from the expected distribution was the strongest in flowers (Notes S1). To test further whether the shift in expression associated with mating system transition was a consequence of adaptation and/or relaxed selection we compared the distribution of πN : πS ratios between D CO ≤ −0.5 and D CO ≥ 0.5 (Fig. 3). As for the distribution of D CO index described above, in flowers, πN : πS ratios were higher for D CO ≥ 0.5 than for D CO ≤ −0.5, in particular for the two selfers. The same trend was observed in leaves although the differences in selfers were weaker and no specific trend was observed in roots. All of these analyses support a predominant role of natural selection in explaining convergence in expression in selfers and in particular in flowers.
Fig. 3.
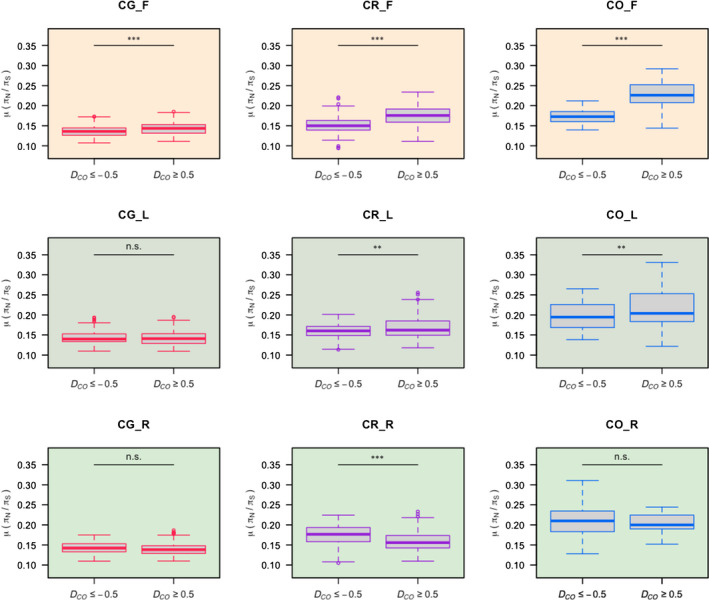
πN : πS ratios for different categories of D CO index. The distribution of πN : πS ratios is compared between D CO ≤ − 0.5 and D CO ≥ 0.5 for the different species (Capsella grandiflora, CG, left column; C. rubella, CR, middle column; C. orientalis, CO, right column) and for the different tissues (flowers, top row; leaves, middle row; roots, bottom row). Within each box plot, the bold horizontal line represents the median value; box region means values within interquartilie range (IQR) from first quartile (Q1) to third quartile (Q3); up and down whiskers indicate 1.5 IQR above the Q3 (Q3 + 1.5 IQR) and 1.5 IQR below the Q1 (Q1 − 1.5 IQR), separately; circles representative outliers. Wilcoxon test: ns, P > 0.05; **, P < 0.01; ***, P < 0.001.
Classification of differentially expressed genes
We then used pairwise comparisons between all three diploid species, to identify genes whose expression was most affected by mating system transition. In flower, there were more DE genes between CG and CO than in any other pairwise comparison, whereas in leaf and root there were more DE genes between CO and CR and, in particular, more than between CO and CG which are at the same phylogenetic distance (Fig. 4a–c). Also, the proportion of DE genes shared by the comparisons involving mating system transition, CR/CG and CO/CG, was four‐fold larger than in leaves and roots. Therefore, gene expression in selfers tends to converge in flower but also tends to diverge in the two other tissues.
Fig. 4.
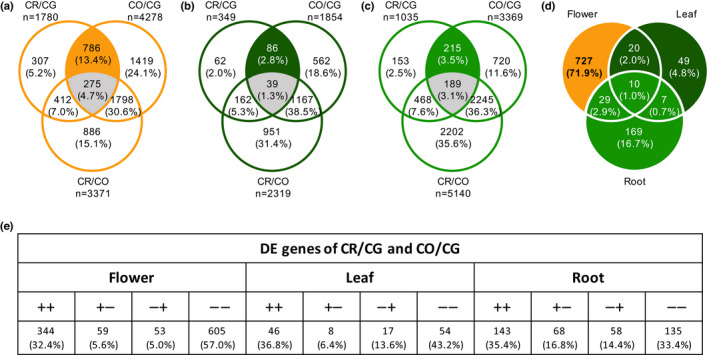
Differentially expressed (DE) genes analysis and mating system transition (MST) related candidate genes identification. (a) Venn diagrams showing the number of detected DE (FDR < 0.05) genes in flower from groups of species pairwise comparison (i.e. between CR and CG, CO and CG, CR and CG), as well as overlaps between groups in number and in percentage. The orange highlighted overlap represents co‐differentially‐expressed genes (coDEGs) of CR and CO in flower. The coDEGs of CR and CO were defined as being differentially expressed between CG and CR and between CG and CO, but not between CR and CO. The gray highlighted overlap represents the coDEGs of CG and CO in flower. (b) In leaf (dark green), the same role as (a). (c) In root (light green), the same role as (a). (d) Identification of MST‐related candidate genes. Each coDEGs of CR and CO should be flower‐specific (orange highlighted) to be an MST‐related candidate. (e) Summary of DE genes of CR/CG and CO/CG across tissues. ‘++’ and ‘−−’ means genes either upregulated in both CR/CG and CO/CG, or downregulated in both comparisons. ‘+−‘ and ‘−+’ means genes upregulated in one comparison but downregulated in another. CG, Capsella grandiflora; CO, C. orientalis; CR, C. rubella.
DEself genes are genes that are differentially expressed between the outcrossing species (CG) and each of the two selfers (CO and CR), but are not differentially expressed between the two selfers (Fig. 4a–c, colored sector). In agreement with results obtained with D CO and D CR , the number of DEself genes (786) was higher in flowers than in leaves (86) and roots (215). Overlap in DEself genes between the three tissues was limited, indicating tissue specific expression for these genes (Fig. 4d). Only 7% of the DE genes were classified as DEself in at least two tissues (1% in the three tissues). Finally, coDEGs are genes that are DE between each of the selfing species and the outcrosser, and that show changes in the same direction relative to the outcrosser (Fig. 4e). The DE genes were much more common in flower than in leaves and roots (1061, 125 and 404, respectively) and the fraction of coDEG (i.e. both upregulated, coDEG+ or both downregulated, coDEG−) was significantly different between the three tissues (flower, 0.89, leaves, 0.8, and roots 0.68, binomial tests all P < 0.05). In flower coDEG− genes (64%) were significantly more common than coDEG+ (37%) (binomial test, χ2 = 142, df = 1, P < 0.001), whereas they were in similar proportion in leaves and roots (binomial test, P = 0.32 and P = 0.55, respectively; Fig. 4e). Hence, the pattern of coDEGs further supports higher convergence in expression in flower for genes associated to mating system transition and shows that it is driven mainly by downregulation of these genes.
Definition of mating system transition related genes and functional analysis
In order to narrow down the list of 786 DE genes potentially involved in mating system transition in flower, we conducted a weighted gene correlation network analysis (wgcna v.1.70‐3; Fig. S2). Three gene clusters (‘modules’ in wgcna) showed a particularly strong association with mating system in flower (light green, 233 genes, Pearson's r = 0.92, P = 3e−12; tan module, 467 genes, r = 0.71, P = 3e−5; and turquoise module, 2070 genes, r = −0.84, P = 2e−8; Fig. S2). A total of 482 genes were detected using both approaches (Fig. S3; Table S2) and were defined, hereafter, as mating system transition genes (MST genes). Expression of these MST genes clustered according to mating system, the clustering being mainly due to genes that were downregulated in both selfing species (Fig. S3). We used a GO terms analysis to classify the MST genes according to BP and MF. For BP, there were 44 nonredundant GO terms (P < 0.05) and many were functionally related to pollen, fruit and anther development processes (Fig. S4; Table S3). At the MF level, MST genes clustered into 24 GO terms (Fig. S5; Table S4). One pathway seems particularly interesting as it relates to the process of l‐ascorbic acid binding (GO:0031418).
Using the tetraploid self‐fertilizing C. bursa‐pastoris to further test the effect of mating system shift across tissues
In Kryvokhyzha et al. (2019a) we defined a similarity index, S, to quantify the shift in expression level of each subgenome in Cbp relative to the mean in expression level in the ‘parental’ species. In each tissue the expression of each subgenome was closest to its own ‘parental’ species – thus, there was a phylogenetic signal (S Co and S Cg in Fig. 5a) – but the global expression was biased toward different parental species in the different tissue (ΔS in Fig. 5a). In flowers, the pattern of expression of the subgenome inherited from the selfer CO (Cbp Co ) tended to dominate that of the subgenome inherited from the outcrosser CG (Cbp Cg ), leading to a bias towards the expression of the self‐fertilizing parent CO (ΔS > 0). In leaves, and even more so in roots, we observed the opposite pattern where the subgenome Cbp Co tended to be dominated by the subgenome Cbp Cg (ΔS < 0), the bias in expression thus being towards the outcrossing parent. Given that Cbp is self‐fertilizing, this pattern was interpreted as follows: in tissues more closely associated to the mating system transition the CO‐like expression pattern sets the standard, whereas in tissues less associated to mating system but more closely related to vigor and to the overall divergence between the two parental species, the CG pattern dominates. If this is indeed the case, replacing CG by CR as a ‘parental’ species should remove the mating system effect without affecting the general vigor and phylogeny effects. We would thus expect to see a drastic change in S in flowers, from a bias toward CO to no bias if mating system of the parental species were the only factor explaining the relative expression between the two subgenomes. For leaves and roots much less change in S index is expected, although one would expect a slightly higher bias toward CR due to genes associated to selfing in these tissues. Replacing CG by CR led to a negative ΔS and a shift towards CR in all three tissues (Fig. 5b). However, the bias of ∆S away from 0 was smallest in flowers (∆S = −0.084) indicating that flowers were less influenced by the phylogenetic signal than leaves (∆S = −0.128) and roots (∆S = −0.197) or, conversely, more strongly affected by the mating system than other tissues.
Fig. 5.
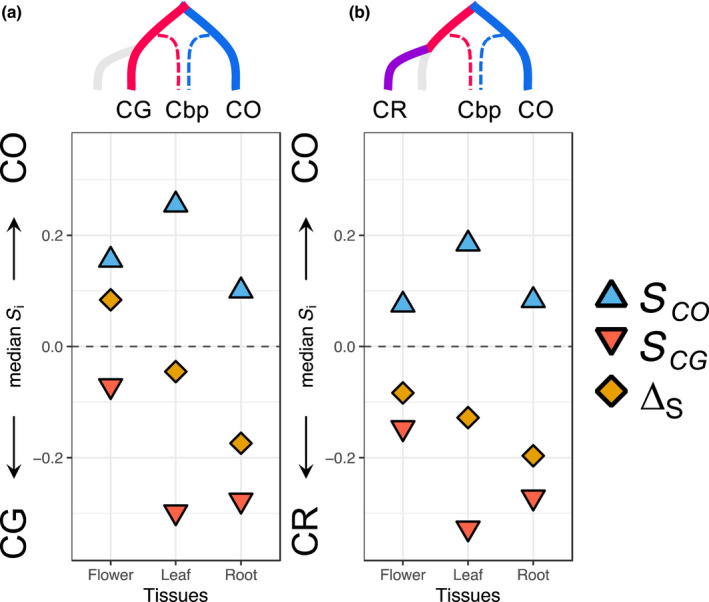
Similarity indices of subgenomes of Capsella bursa‐pastoris (Cbp) to different ‘parental’ species. In a given pair of diploid species, for each tissue and each subgenome, the median of similarity indices for each subgenome, either inherited from CO (S CO ) or from CG (S CG ), are presented as well as the difference between the two indices (ΔS) (see the Materials and Methods section for definitions). ΔS measures the dominance of one parental genetic background. Gray dotted line (S = 0) corresponds to an absence of bias. Phylogenetic trees on the top of each panel represent the phylogenetic relationships of Cbp with the diploid species used for the comparison. CG, Capsella grandiflora; CO, C. orientalis; CR, C. rubella.
Discussion
In the present study, we analyzed changes in gene expression in flowers, leaves and roots between self‐fertilizing Capsella species and their sole outcrossing relative, C. grandiflora. Our results show that gene expression was more affected in flower tissues than in leaves and roots and that there was an excess of convergent genes between selfing species (CO and CR) in flowers compared to roots and leaves. However, leaves and roots also were affected by mating system shift. In flowers, many changes were convergent across selfing species and adaptive, whereas changes in roots and leaves were more random and relaxed selection probably explained some of them.
This is not the first study of genome‐wide expression in the Capsella genus although it is the first to look at the nature of the selective change associated to the mating system transition and include all four species and three tissues. Slotte et al. (2013) identified DE genes between C. rubella and C. grandiflora in flower tissues, and compared those to DE genes between A. lyrata and A. thaliana, noting some overlap suggesting some convergent evolution in flower. Combining transcriptomic and gene mapping in C. rubella and C. orientalis, Woźniak et al. (2020) showed that petal size had a similar genetic basis in the two species. We compared our list of MST genes with the list of convergent genes between C. rubella and A. thaliana established by Slotte et al. (2013), on the one hand, and with the list of coDEGs between C. rubella and C. orientalis from Woźniak et al. (2020), on the other. Because Slotte et al. (2013) list of MST genes was unavailable, we first used their gene expression data to establish two MST gene lists using two different approaches (by permutation and using R/limma). Of our list of 482 MST genes, 218 overlapped with at least one of the two previous studies (Fig. S6).
These 218 overlapped genes belonged to pathways functionally related to pollen development, and more precisely pollen exine formation (GO:0010584) (Tables S5, S6). In general, our results correspond to the observation in Slotte et al. (2013) that many DE genes between C. grandiflora and C. rubella are functionally related with pollen number differences. However, Woźniak et al. (2020) did not report such pollen‐related pathways, even though they observed a dramatic decrease (around four‐fold) of the number of pollen grain in both selfing species compared to C. grandiflora. Another interesting discrepancy is that both Slotte et al. (2013) and Woźniak et al. (2020) detected many genes associated to petal development but we did not. One potential reason is difference in sample and sampling time across these three studies. In Slotte et al. (2013) total RNA was harvested from mixed flower buds from five C. grandiflora genotypes and six C. rubella genotypes, and the expression patterns in Capsella compared with expression patterns of stage‐12 floral buds of A. thaliana and A. lyrata. In Woźniak et al. (2020) total RNA was extracted from dividing flower buds (so before stage 10 according to Bowman et al.'s (1991) development classification), and expanding/maturing flower buds. In the present study, buds were collected one week after the onset of flowering. Another possible explanation is that we used all four species, including both diploid, and three tissues as well as two different methods for detecting genes related with mating system transition, whose criteria are stricter than those used by Slotte et al. (2013) or Woźniak et al. (2020).
The classification of the MST genes based on GO showed that many terms are functionally related to pollen, fruit and anther development processes. Pollen is critical for plant reproductive success and is predicted to be under strong selective force in outcrossing species as a result of the pervasive male–male gamete competition, resulting in the outcrossing species being prone to generating a larger number of pollen grains (Harvey & May, 1989). By contrast, selfing species generally show a lower number of pollen grains, because fertilization is easier to complete in a selfing species than in its outcrossing relatives (Willis, 1999; Cruden, 2000; Shimizu & Tsuchimatsu, 2015; Liao et al., 2022). Because the selfing species does not need to attract pollinators, some rewarding products for pollinators, such as scents, nectars and feeding anthers, that are costly for the plant to produce, will no longer be needed and thus will be under relaxed selection (Smith, 2016; Wessinger & Hileman, 2016; Liao et al., 2022). Selfing species also exhibit an early mature time of pollen development (de Jong et al., 1993) and a lower amount of fruit set (Bellusci et al., 2009; Jacquemyn & Brys, 2015). The fact that MST genes clustered into categories functional related to pollen sperm cell differentiation (GO:0048235), fruit development (GO:0010154) and anther wall tapetum development (GO:0048658) indicate that MST genes have a broad effect on reproductive functions at different stages of the life cycle.
When genes are classified according to MF, the most interesting seems to be the process of l‐ascorbic acid binding. l‐ascorbic acid appears highly pleiotropic and plays a role in seed germination, floral induction and senescence (Barth et al., 2006). The antagonistic role of ascorbic acid in regulating seed germination has been well‐documented (Koornneef et al., 2002; Finch‐Savage et al., 2006). In many plant species, underexpression of ascorbic acid leads to enhanced germination potential and sometimes produce viviparous seeds (McCarty, 1995; Salaita et al., 2005), whereas overexpression of ascorbic acid results in enhanced dormancy or delayed germination (Thompson et al., 2000; Qin & Zeevaart, 2002; Okamoto et al., 2010). In general, there is evidence that mating system influences phenology and, in particular, seed phenology and germination (e.g. Carta et al., 2015; Baskin & Baskin, 2017). Hence, as for GO, the classification according to molecular function points at changes in developmental timing between selfers and outcrossers.
Understandably, studies of the selfing syndrome have largely focused on floral and reproductive traits and genes associated to traits such as the reduction in flower size have been identified as part of the selfing syndrome (e.g. Woźniak et al., 2020). These results generally were obtained through quantitative trait loci (QTL) studies focusing on targeted traits and therefore intrinsically ignoring the possibility of an impact of mating system shift beyond floral and reproductive traits. However, there are many reasons to expect changes to extend beyond those traits (Tsuchimatsu & Fujii, 2022). Selfing species differ from outcrossing ones in many factors that directly impact the rate of evolution: the effective population size is divided by two and the effective recombination rate is reduced. Thus, we can expect the genomic selfing syndrome to affect all genes and not only those directly related to selfing. We showed that the expression of a large fraction of genes deviated from what would be expected considering the phylogenetic relationships between the three species in all three tissues. This pattern is not explained by some ubiquitous genes given the small overlap that we found between the three tissues.
One central question is whether selfing syndrome trait evolution arises from relaxed selection (random genetic drift), from adaptive re‐allocation of resources or from a mixture of both (Cutter, 2019; Rifkin et al., 2021; Tsuchimatsu & Fujii, 2022). As pointed out by Cutter (2019), deciphering the relative contribution of adaptive changes vs relaxed selection for any trait individually remains challenging and few studies have attempted it. In morning glory (Ipomoea lacunosa), Rifkin et al. (2021) used Q ST–F ST comparisons to identify selection associated to the divergence between selfers and outcrossers on traits ranging from corolla size to early growth. Divergence between selfers and outcrossers was found to be under selection for corolla size and nectar traits, but not for early growth or pollen traits. The authors concluded that some aspects of the selfing syndrome were under selection but evolution in others was either due to drift or to correlated selection. The design of our study also allowed insights on the relative importance of these two evolutionary processes. First, the availability of three tissues, one closely related to reproduction and two others more distantly related to it means that we shall be able to capture both the selfing syndrome sensu stricto via flowers and the genomic selfing syndrome via comparison of expression across the three tissues. Second, the availability of three independent mating system transitions implies that we can use the phylogeny to derive expectations and identify genes that are more likely to be under directional selection than under relaxed selection.
Combining both allowed us to show that the observed pattern in gene expression cannot be obtained under a strictly neutral model, but instead is the result of a mixture of convergent adaptive changes and relaxed selection. Support for convergent evolution between the selfing species was particularly pronounced in flowers (both D CO and D CR indices <0), but also was observed in the two other tissues. Convergent evolution can be the result of either adaptation to a same new optimum in gene expression in selfing species or a change in the same direction in expression following relaxed selection. The later could create an enrichment for negative D index values (thereby mimicking adaptive convergence) if a consistent bias toward either up‐ or downregulation existed for genes evolving through drift, once the selection has been relaxed. Though we cannot completely rule out such a hypothesis, further observations support the role of positive selection in driving the pattern of convergent evolution in flower.
First, the enrichment for positive values in the D CO index in leaves and roots indicates that gene expression evolved at a relatively higher rate on the branches leading to CR and CG. This could, for instance, occur if selection on CR is relaxed after mating system shift. Differentially expressed gene analyses also revealed that in leaves and roots many more genes showed a difference in expression between the two selfing species, CO and CR, than in any other comparisons, and in particular between CG and CO that are at the same phylogenetic distance. If changes in expression were to be biased towards either up‐ or downregulation after the selection is relaxed, such a pattern would not be observed. By contrast, the expression in the two self‐fertilizing species tended to drift apart showing that drift following relaxed selection can lead to both up‐ or downregulation without preference. This, in turn, further supports the role of selection in shaping the convergence in expression in flower. Second, the presence of convergent evolution is strongly supported by the fraction of coDEGs among DE genes in the three tissues (i.e. genes whose expression in CO and CR compared to CG is in the same direction): c. 90% in flowers, c. 80% in leaves and c. 70% in roots (Fig. 3). In leaves and roots, the coDEGs are evenly distributed between coDEG− (co‐downregulated genes) and coDEG+ (co‐upregulated genes). However, there is significantly more coDEG− than coDEG+ in flower (64%) further supporting the role of convergent adaptation in flower. Third, we used the tetraploid selfing species C. bursa‐pastoris, to test and confirm our predictions about the respective role of natural selection and genetic drift in the evolution of RNA expression in the various tissues. Concretely, one would not expect different patterns of S i index between the three tissues, as was observed, unless the relative importance of selection and drift in shaping RNA expression changed between them. Finally, the global pattern of variation of πN : πS ratio with the D CO index further supports the respective roles of selection and drift in shaping pattern of expression following mating system change. The ratio πN/πS measures selection efficacy, and is expected to be small when purifying selection is effective and to increase as drift becomes more potent (Chen et al., 2017). In our case, this suggests a more important role for drift in shaping RNA expression in leaves and roots in selfing species, and for selection for the genes showing a convergent pattern of RNA expression between selfing species, mainly in flowers.
Author contributions
ML, PM and SG designed the study; ZZ and PM analyzed the data; MO and DK performed experiments; and ZZ, PM, SG and ML drafted the manuscript. All authors read and approved the final version of the manuscript. PM and ML contributed equally to this work.
Supporting information
Fig. S1 Heatmap of 17 307 transcripts based on individual TMM normalized reads count for three Capsella species (CG, CR, CO) across tissues.
Fig. S2 Weighted gene correlation network analysis (WGCNA) revealed three modules highly related with mating system transition traits in Capsella.
Fig. S3 Putative selfing syndrome related genes identification and most of them were downregulated in selfers.
Fig. S4 Nonredundancy GO terms of selfing syndrome related genes in biological process category.
Fig. S5 Nonredundancy GO terms of selfing syndrome related genes in molecular function category.
Fig. S6 MST related genes overlapping with MST genes detected by Slotte et al. (2013) and CR‐CO co‐convergency genes from Woźniak et al. (2020).
Methods S1 Supplementary methods.
Notes S1 Simulation of Ornstein–Uhlenbeck processes for Capsella RNA seq evolution.
Table S1 Accessions used in the present study together with RNASEQ library size for the different tissues together with their SRA reference numbers.
Table S2 Reputed Capsella MST‐related gene list, and overlaps with Slotte et al. (2013) and Woźniak et al. (2020).
Table S3 Nonredundancy GO terms of 482 putative MST genes (biological process).
Table S4 Nonredundancy GO terms of 482 putative MST genes (molecuar function).
Table S5 Nonredundancy GO terms of 218 overlapping genes (biological process).
Table S6 Nonredundancy GO terms of 218 overlapping genes (molecular function).
Please note: Wiley Blackwell are not responsible for the content or functionality of any Supporting Information supplied by the authors. Any queries (other than missing material) should be directed to the New Phytologist Central Office.
Acknowledgements
The study was supported by grant 2019‐00806 from the Swedish Research Council to ML. ML also acknowledges support from the Erik Philip‐Sörensen Foundation. The computation and data handling were provided by the Swedish National Infrastructure for Computing (SNIC) at Uppmax, partially funded by the Swedish Research Council through grant agreement no. 2018‐05973.
Contributor Information
Pascal Milesi, Email: pascal.milesi@scilifelab.uu.se.
Martin Lascoux, Email: martin.lascoux@ebc.uu.se.
Data availability
All data are available and were deposited. The sequence references are given in Table S1. SRR8944173–SRR8944194 are from Kryvokhyzha et al. (2019a) and SRR18361966–SRR18361976 are newly sequenced.
References
- Alexa A, Rahnenfuhrer J. 2020. topGO: enrichment analysis for gene ontology 2.40.0. R package v.2(0) [WWW document] URL http://www.bioconductor.org/packages/release/bioc/html/topGO.html.
- Arunkumar R, Maddison TI, Barrett SCH, Wright SI. 2016. Recent mating‐system evolution in Eichhornia is accompanied by cis‐regulatory divergence. New Phytologist 211: 697–707. [DOI] [PubMed] [Google Scholar]
- Bachmann JA, Tedder A, Laenen B, Fracassetti M, Désamoré A, Lafon‐Placette C, Steige KA, Callot C, Marande W, Neuffer B et al. 2019. Genetic basis and timing of a major mating system shift in Capsella . New Phytologist 224: 505–517. [DOI] [PubMed] [Google Scholar]
- Barrett SCH. 2002. The evolution of plant sexual diversity. Nature Reviews. Genetics 3: 274–284. [DOI] [PubMed] [Google Scholar]
- Barth C, Tullio MD, Conklin PL. 2006. The role of ascorbic acid in the control of flowering time and the onset of senescence. Journal of Experimental Botany 57: 1657–1665. [DOI] [PubMed] [Google Scholar]
- Baskin JM, Baskin CC. 2017. Seed germination in cleistogamous species: theoretical considerations and a literature survey of experimental results. Seed Science Research 27: 84–98. [Google Scholar]
- Bellusci F, Pellegrino G, Musacchio A. 2009. Different levels of inbreeding depression between outcrossing and selfing Serapias species. Biologia Plantarum. 53: 175–178. [Google Scholar]
- Bowman JL, Drews GN, Meyerowitz EM. 1991. Expression of the Arabidopsis floral homeotic gene AGAMOUS is restricted to specific cell types late in flower development. Plant Cell 3: 749–758. [DOI] [PMC free article] [PubMed] [Google Scholar]
- Boyle EA, Li YI, Pritchard JK. 2017. An expanded view of complex traits: from polygenic to omnigenic. Cell 169: 1177–1186. [DOI] [PMC free article] [PubMed] [Google Scholar]
- Cahais V, Gayral P, Tsagkogeorga G, Melo‐Ferreira J, Ballenghien M, Weinert L, Chiari Y, Belkhir K, Ranwez V, Galtier N. 2012. Reference‐free transcriptome assembly in non‐model animals from next‐generation sequencing data. Molecular Ecology Resources 12: 834–845. [DOI] [PubMed] [Google Scholar]
- Campbell SA, Kessler A. 2013. Plant mating system transitions drive the macroevolution of defense strategies. Proceedings of the National Academy of Sciences, USA 110: 3973–3978. [DOI] [PMC free article] [PubMed] [Google Scholar]
- Carr DE, Eubanks MD. 2002. Inbreeding alters resistance to insect herbivory and host plant quality in Mimulus guttatus (Scrophulariaceae). Evolution 56: 22–30. [DOI] [PubMed] [Google Scholar]
- Carta A, Bedini G, Giannotti A, Savio L, Peruzzi L. 2015. Mating system modulates degree of seed dormancy in Hypericum elodes L. (Hypericaceae). Seed Science Research 25: 299–305. [Google Scholar]
- Charlesworth D, Meagher TR. 2003. Effects of inbreeding on the genetic diversity of populations. Philosophical Transactions of the Royal Society of London. Series B: Biological Sciences 358: 1051–1070. [DOI] [PMC free article] [PubMed] [Google Scholar]
- Charlesworth D, Wright SI. 2001. Breeding systems and genome evolution. Current Opinion in Genetics & Development 11: 685–690. [DOI] [PubMed] [Google Scholar]
- Chen J, Glémin S, Lascoux M. 2017. Genetic diversity and the efficacy of purifying selection across plant and animal species. Molecular Biology and Evolution 34: 1417–1428. [DOI] [PubMed] [Google Scholar]
- Cruden RW. 2000. Pollen grains: why so many? Plant Systematics and Evolution 222: 143–165. [Google Scholar]
- Cutter AD. 2019. Reproductive transitions in plants and animals: selfing syndrome, sexual selection and speciation. New Phytologist 224: 1080–1094. [DOI] [PubMed] [Google Scholar]
- Douglas GM, Gos G, Steige KA, Salcedo A, Holm K, Josephs EB, Arunkumar R, Ågren JA, Hazzouri KM, Wang W et al. 2015. Hybrid origins and the earliest stages of diploidization in the highly successful recent polyploid Capsella bursa‐pastoris . Proceedings of the National Academy of Sciences, USA 112: 2806–2811. [DOI] [PMC free article] [PubMed] [Google Scholar]
- Ellison A, Cable J, Consuegra S. 2011. Best of both worlds? Association between outcrossing and parasite loads in a selfing fish. Evolution 65: 3021–3026. [DOI] [PubMed] [Google Scholar]
- Felsenstein J. 1988. phylogenies and quantitative characters. Annual Review of Ecology and Systematics 19: 445–471. [Google Scholar]
- Finch-Savage WE, Leubner-Metzger G. 2006. Seed dormancy and the control of germination. New Phytologist 171: 501–523. [DOI] [PubMed] [Google Scholar]
- Fisher R. 1930. The genetical theory of natural selection. Oxford, UK: The Clarendon Press. [Google Scholar]
- Frazee LJ, Rifkin J, Maheepala DC, Grant A‐G, Wright S, Kalisz S, Litt A, Spigler R. 2021. New genomic resources and comparative analyses reveal differences in floral gene expression in selfing and outcrossing Collinsia sister species. G3: Genes, Genomes, Genetics 11: jkab177. [DOI] [PMC free article] [PubMed] [Google Scholar]
- Glémin S, François CM, Galtier N. 2019. Genome evolution in outcrossing vs. selfing vs. asexual species. In: Anisimova M, ed. Evolutionary genomics. New York, NY: Humana, 1910: 331–369. [DOI] [PubMed] [Google Scholar]
- Gu Z, Eils R, Schlesner M. 2016. Complex heatmaps reveal patterns and correlations in multidimensional genomic data. Bioinformatics 32: 2847–2849. [DOI] [PubMed] [Google Scholar]
- Hamrick JL, Godt MJW. 1996. Effects of life history traits on genetic diversity in plant species. Philosophical Transactions of the Royal Society of London. Series B: Biological Sciences 351: 1291–1298. [Google Scholar]
- Hansen TF. 1997. Stabilizing selection and the comparative analysis of adaptation. Evolution 51: 1341–1351. [DOI] [PubMed] [Google Scholar]
- Harvey PH, May RM. 1989. Out for the sperm count. Nature 337: 508–509. [DOI] [PubMed] [Google Scholar]
- Hill MS, Zande PV, Wittkopp PJ. 2021. Molecular and evolutionary processes generating variation in gene expression. Nature Reviews. Genetics 22: 203–215. [DOI] [PMC free article] [PubMed] [Google Scholar]
- Hurka H, Friesen N, German DA, Franzke A, Neuffer B. 2012. “Missing link” species Capsella orientalis and Capsella thracica elucidate evolution of model plant genus Capsella (Brassicaceae). Molecular Ecology 21: 1223–1238. [DOI] [PubMed] [Google Scholar]
- Jacquemyn H, Brys R. 2015. Pollen limitation and the contribution of autonomous selfing to fruit and seed set in a rewarding orchid. American Journal of Botany 102: 67–72. [DOI] [PubMed] [Google Scholar]
- de Jong TJ, Waser NM, Klinkhamer PG. 1993. Geitonogamy: the neglected side of selfing. Trends in Ecology & Evolution. 18: 321–325. [DOI] [PubMed] [Google Scholar]
- Koornneef M, Bentsink L, Hilhorst H. 2002. Seed dormancy and germination. Current Opinion in Plant Biology 5: 33–36. [DOI] [PubMed] [Google Scholar]
- Koslow JM, DeAngelis DL. 2006. Host mating system and the prevalence of disease in a plant population. Proceedings of the Royal Society B: Biological Sciences 273: 1825–1831. [DOI] [PMC free article] [PubMed] [Google Scholar]
- Kryvokhyzha D, Milesi P, Duan T, Orsucci M, Wright SI, Glémin S, Lascoux M. 2019a. Towards the new normal: transcriptomic convergence and genomic legacy of the two subgenomes of an allopolyploid weed (Capsella bursa‐pastoris). PLoS Genetics 15: e1008131. [DOI] [PMC free article] [PubMed] [Google Scholar]
- Kryvokhyzha D, Salcedo A, Eriksson MC, Duan T, Tawari N, Chen J, Guerrina M, Kreiner JM, Kent TV, Lagercrantz U et al. 2019b. Parental legacy, demography, and admixture influenced the evolution of the two subgenomes of the tetraploid Capsella bursa‐pastoris (Brassicaceae). PLoS Genetics 15: e1007949. [DOI] [PMC free article] [PubMed] [Google Scholar]
- Lahti DC, Johnson NA, Ajie BC, Otto SP, Hendry AP, Blumstein DT, Coss RG, Donohue K, Foster SA. 2009. Relaxed selection in the wild. Trends in Ecology & Evolution 24: 487–496. [DOI] [PubMed] [Google Scholar]
- Lande R. 1988. Genetics and demography in biological conservation. Science 241: 1455–1460. [DOI] [PubMed] [Google Scholar]
- Langfelder P, Horvath S. 2008. wgcna: an R package for weighted correlation network analysis. BMC Bioinformatics 9: 559. [DOI] [PMC free article] [PubMed] [Google Scholar]
- Leimu R, Fischer MA. 2008. Meta‐analysis of local adaptation in plants. PLoS ONE 3: 1–8. [DOI] [PMC free article] [PubMed] [Google Scholar]
- Liao IT, Rifkin JL, Cao G, Rausher MD. 2022. Modularity and selection of nectar traits in the evolution of the selfing syndrome in Ipomoea lacunosa (Convolvulaceae). New Phytologist 233: 1505–1519. [DOI] [PubMed] [Google Scholar]
- Liu X, Li YI, Pritchard JK. 2019. Trans effects on gene expression can drive omnigenic inheritance. Cell 177: 1022–1034. [DOI] [PMC free article] [PubMed] [Google Scholar]
- McCarty DR. 1995. Genetic control and integration of maturation and germination pathways in seed development. Annual Review of Plant Biology 46: 71–93. [Google Scholar]
- Nourmohammad A, Rambeau J, Held T, Kovacova V, Berg J, Lässig M. 2017. Adaptive evolution of gene expression in Drosophila . Cell Reports 20: 1385–1395. [DOI] [PubMed] [Google Scholar]
- Okamoto M, Tatematsu K, Matsui A, Morosawa T, Ishida J, Tanaka M, Endo TA, Mochizuki Y, Toyoda T, Kamiya Y et al. 2010. Genome‐wide analysis of endogenous abscisic acid‐mediated transcription in dry and imbibed seeds of Arabidopsis using tiling arrays. The Plant Journal 62: 39–51. [DOI] [PubMed] [Google Scholar]
- Qin X, Zeevaart JA. 2002. Overexpression of a 9‐cis‐epoxycarotenoid dioxygenase gene in Nicotiana plumbaginifolia increases abscisic acid and phaseic acid levels and enhances drought tolerance. Plant Physiology 128: 544–551. [DOI] [PMC free article] [PubMed] [Google Scholar]
- R Core Team . 2013. R: a language and environment for statistical computing. Vienna, Austria: R Foundation for Statistical Computing. [Google Scholar]
- Rifkin JL, Cao G, Rausher MD. 2021. Genetic architecture of divergence: the selfing syndrome in Ipomoea lacunosa . American Journal of Botany 108: 2038–2054. [DOI] [PubMed] [Google Scholar]
- Rifkin JL, Liao IT, Castillo AS, Rausher MD. 2019. Multiple aspects of the selfing syndrome of the morning glory Ipomoea lacunosa evolved in response to selection: a Qst–Fst comparison. Ecology and Evolution 9: 7712–7725. [DOI] [PMC free article] [PubMed] [Google Scholar]
- Robinson MD, McCarthy DJ, Smyth GK. 2010. edgeR: a bioconductor package for differential expression analysis of digital gene expression data. Bioinformatics 26: 139–140. [DOI] [PMC free article] [PubMed] [Google Scholar]
- Salaita L, Kar RK, Majee M, Downie AB. 2005. Identification and characterization of mutants capable of rapid seed germination at 10 C from activation‐tagged lines of Arabidopsis thaliana . Journal of Experimental Botany 56: 2059–2069. [DOI] [PubMed] [Google Scholar]
- Shimizu KK, Tsuchimatsu T. 2015. Evolution of selfing: recurrent patterns in molecular adaptation. Annual Review of Ecology, Evolution, and Systematics 46: 593–622. [Google Scholar]
- Sicard A, Lenhard M. 2011. The selfing syndrome: a model for studying the genetic and evolutionary basis of morphological adaptation in plants. Annals of Botany 107: 1433–1443. [DOI] [PMC free article] [PubMed] [Google Scholar]
- Sinnott‐Armstrong N, Naqvi S, Rivas M, Pritchard JK. 2021. GWAS of three molecular traits highlights core genes and pathways alongside a highly polygenic background. eLife 10: e58615. [DOI] [PMC free article] [PubMed] [Google Scholar]
- Slotte T, Hazzouri KM, Ågren JA, Koenig D, Maumus F, Guo Y‐L, Steige K, Platts AE, Escobar JS, Newman LK et al. 2013. The Capsella rubella genome and the genomic consequences of rapid mating system evolution. Nature Genetics 45: 831–835. [DOI] [PubMed] [Google Scholar]
- Smith SD. 2016. Pleiotropy and the evolution of floral integration. New Phytologist 209: 80–85. [DOI] [PubMed] [Google Scholar]
- Supek F, Bošnjak M, Škunca N, Šmuc T. 2011. Revigo summarizes and visualizes long lists of Gene Ontology terms. PLoS ONE 6: e21800. [DOI] [PMC free article] [PubMed] [Google Scholar]
- Thomas CG, Li R, Smith HE, Woodruff GC, Oliver B, Haag ES. 2012. Simplification and desexualization of gene expression in self‐fertile nematodes. Current Biology 22: 2167–2172. [DOI] [PMC free article] [PubMed] [Google Scholar]
- Thompson AJ, Jackson AC, Symonds RC, Mulholland BJ, Dadswell AR, Blake PS, Burbidge A, Taylor IB. 2000. Ectopic expression of a tomato 9‐cis‐epoxycarotenoid dioxygenase gene causes over‐production of abscisic acid. The Plant Journal 23: 363–374. [DOI] [PubMed] [Google Scholar]
- Tsuchimatsu T, Fujii S. 2022. The selfing syndrome and beyond: diverse evolutionary consequences of mating system transitions in plants. Philosophical Transactions of the Royal Society of London. Series B: Biological Sciences 377: 20200510. [DOI] [PMC free article] [PubMed] [Google Scholar]
- Wang X‐J, Barrett SCH, Zhong L, Wu Z‐K, Li D‐Z, Wang H, Zhou W. 2021. The genomic selfing syndrome accompanies the evolutionary breakdown of heterostyly. Molecular Biology and Evolution 38: 168–180. [DOI] [PMC free article] [PubMed] [Google Scholar]
- Wessinger CA, Hileman LC. 2016. Accessibility, constraint, and repetition in adaptive floral evolution. Developmental Biology 419: 175–183. [DOI] [PMC free article] [PubMed] [Google Scholar]
- Willis JH. 1999. The contribution of male‐sterility mutations to inbreeding depression in Mimulus guttatus . Heredity 83: 337–346. [DOI] [PubMed] [Google Scholar]
- Woźniak NJ, Kappel C, Marona C, Altschmied L, Neuffer B, Sicard A. 2020. A similar genetic architecture underlies the convergent evolution of the selfing syndrome in Capsella . Plant Cell 32: 935–949. [DOI] [PMC free article] [PubMed] [Google Scholar]
- Wright SI, Kalisz S, Slotte T. 2013. Evolutionary consequences of self‐fertilization in plants. Proceedings of the Royal Society B: Biological Sciences 280: 20130133. [DOI] [PMC free article] [PubMed] [Google Scholar]
Associated Data
This section collects any data citations, data availability statements, or supplementary materials included in this article.
Supplementary Materials
Fig. S1 Heatmap of 17 307 transcripts based on individual TMM normalized reads count for three Capsella species (CG, CR, CO) across tissues.
Fig. S2 Weighted gene correlation network analysis (WGCNA) revealed three modules highly related with mating system transition traits in Capsella.
Fig. S3 Putative selfing syndrome related genes identification and most of them were downregulated in selfers.
Fig. S4 Nonredundancy GO terms of selfing syndrome related genes in biological process category.
Fig. S5 Nonredundancy GO terms of selfing syndrome related genes in molecular function category.
Fig. S6 MST related genes overlapping with MST genes detected by Slotte et al. (2013) and CR‐CO co‐convergency genes from Woźniak et al. (2020).
Methods S1 Supplementary methods.
Notes S1 Simulation of Ornstein–Uhlenbeck processes for Capsella RNA seq evolution.
Table S1 Accessions used in the present study together with RNASEQ library size for the different tissues together with their SRA reference numbers.
Table S2 Reputed Capsella MST‐related gene list, and overlaps with Slotte et al. (2013) and Woźniak et al. (2020).
Table S3 Nonredundancy GO terms of 482 putative MST genes (biological process).
Table S4 Nonredundancy GO terms of 482 putative MST genes (molecuar function).
Table S5 Nonredundancy GO terms of 218 overlapping genes (biological process).
Table S6 Nonredundancy GO terms of 218 overlapping genes (molecular function).
Please note: Wiley Blackwell are not responsible for the content or functionality of any Supporting Information supplied by the authors. Any queries (other than missing material) should be directed to the New Phytologist Central Office.
Data Availability Statement
All data are available and were deposited. The sequence references are given in Table S1. SRR8944173–SRR8944194 are from Kryvokhyzha et al. (2019a) and SRR18361966–SRR18361976 are newly sequenced.