Abstract
Protein misfolding and aggregation are hallmarks of many severe neurodegenerative diseases including Alzheimer's, Parkinson's and Huntington's disease. As a supramolecular ligand that binds to lysine and arginine residues, the molecular tweezer CLR01 was found to modify the aggregation pathway of disease‐relevant proteins in vitro and in vivo with beneficial effects on toxicity. However, the molecular mechanisms of how tweezers exert these effects remain mainly unknown, hampering further drug development. Here, we investigate the modulation mechanism of unfolding and aggregation pathways of SOD1, which are involved in amyotrophic lateral sclerosis (ALS), by CLR01. Using a truncated version of the wildtype SOD1 protein, SOD1bar, we show that CLR01 acts on the first step of the aggregation pathway, the unfolding of the SOD1 monomer. CLR01 increases, by ∼10 °C, the melting temperatures of the A4V and G41D SOD1 mutants, which are commonly observed mutations in familial ALS. Molecular dynamics simulations and binding free energy calculations as well as native mass spectrometry and mutational studies allowed us to identify K61 and K92 as binding sites for the tweezers to mediate the stability increase. The data suggest that the modulation of SOD1 conformational stability is a promising target for future developments of supramolecular ligands against neurodegenerative diseases.
Keywords: amyotrophic lateral sclerosis, CLR01, SOD1, medicinal chemistry, supramolecular ligands
The molecular tweezer CLR01 binds specifically to lysine residues of superoxide dismutase 1 (SOD1) and thereby increases its folding stability.
Introduction
Amyotrophic lateral sclerosis (ALS) is a severe neuromuscular disorder caused by a progressive loss of motor neuron function in the spinal cord, brain stem, and motor cortex. 90–95 % of ALS patients do not have genetic abnormalities (referred to as sporadic ALS or sALS). Less than 10 % of ALS patients have a familial history and the cases are linked to multiple mutations in different genes (known as familial ALS, or fALS). [1] More than 160 mutations in fALS occur in the superoxide dismutase 1 (SOD1) gene, causing 10–15 % of all fALS cases. [2] SOD1 is an enzyme that converts superoxide ions into hydrogen peroxide. The pathology of fALS is, however, not attributed to a loss of function mechanism of the enzyme, but rather a gain‐of‐toxicity mechanism in which the (stable) enzyme unfolds, misfolds and aggregates in intracellular inclusions. [3] The unfolding process of the stable monomer was suggested to play a crucial role since a shift of the folding equilibrium towards the denatured monomer is common to all pathogenic mutations. [4] Remarkably, a linear correlation exists between the change of protein stability caused by the mutation in vitro and the average survival time of the patient. [5] In this regard, the pathology of fALS is distinct from other neurodegenerative disorders such as Huntington's or Alzheimer's disease where precursor proteins are (partially) intrinsically disordered and can directly fold into pathogenic structures. The unfolding of SOD1 may lead to further self‐association involving soluble oligomers that elongate into fibrils by fragmentation‐assisted growth.[ 6 , 7 ] Unfolded and misfolded SOD1 associates with stress granules (SGs)[ 8 , 9 ] and it was suggested that this may lead to aberrant liquid‐solid phase transitions that maybe associated with disease. [8]
Therapeutic intervention relying on small molecules modulating the folding and aggregation pathways were tested for many neurogenerative diseases including ALS. [10] One strategy was to decrease the expression level of the SOD1 protein and thereby prevent aggregation.[ 11 , 12 ] Other approaches aim to inhibit aggregation using small molecules such as pyrimidine 2,4,6‐trione (PYT) derivatives [13] or to increase the solubility of the SOD1 monomer by artificial chaperones such as taurine, [14] sodium phenylbutyrate [15] or tauroursodeoxycholic acid (TUDCA).[ 16 , 17 ] Furthermore, the hydrophobic cavity of the SOD1 dimer interface was targeted by drugs like N‐nitroso‐5‐(phenylsulfinyl)pyridin‐2‐amine, 6‐[(4‐chlorophenyl)amino]pyrimidine‐2,4(1H,3H)‐dione or 4‐bromo‐2‐{(E)‐[(4‐ fluorophenyl)imino]methyl}phenol. [18] However, so far the only Federal Drug Administration (FDA)‐approved drugs are Riluzole (inhibits glutamate release) and Edaravone or Radicut (reduces oxidative stress by scavenging free radicals), which only delay disease progression by ∼3 months.[ 19 , 20 ]
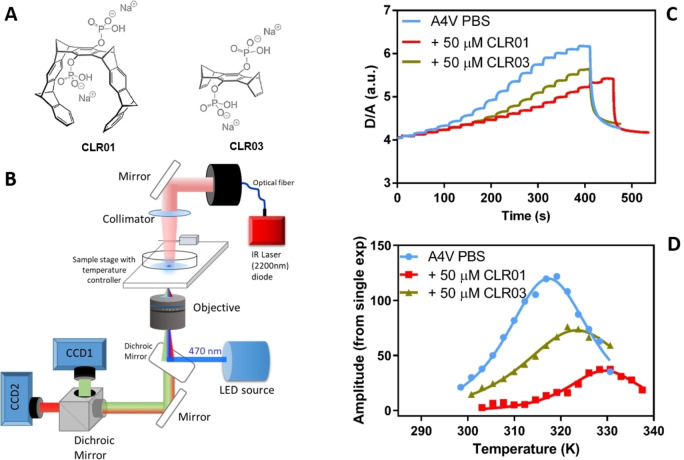
Here, we investigate molecular tweezers as a novel therapeutic approach in ALS. Molecular tweezers bind specifically to lysine and arginine residues with low micromolar affinity. [21] The binding interferes with the self‐assembly process by perturbing hydrophobic and electrostatic interactions. Thereby, for several amyloidogenic proteins, it was shown that the molecular tweezer CLR01 (Figure 1 A) prevents toxic aggregation.[ 22 , 23 , 24 , 25 , 26 , 27 , 28 ] Recent studies found that CLR01 also inhibits the aggregation of SOD1, as measured using ThT fluorescence assays, with a minor reduction of disease duration in a SOD1 mouse model of ALS. [29] However, the molecular mechanism associated with the beneficial effects of molecular tweezers in ALS still needs to be elucidated for further drug development. Due to the pivotal role of the unfolding processes of SOD1 in ALS pathology, we seek to address key questions on the molecular mechanism of CLR01 action, including whether CLR01 functions by increasing the stability of SOD1, or prevents the formation of aggregates and amyloids, or both. To address these open questions, we studied how the folding stability of SOD1 and its disease‐related mutants is tuned by CLR01. We investigated the monomeric construct SOD1bar, [30] which retains apo‐state folding characteristics and a reversible two‐state transition, using fast relaxation imaging. Mass spectrometry, molecular dynamics simulations and free energy calculations allowed us to identify preferred binding sites of the molecular tweezer and to propose a mechanism in which CLR01 modulates the stability of SOD1 folding.
Figure 1.
(A) Schematic representation of CLR01 and CLR03 (adapted from Ref. [23]). (B) Experimental setup for Fast Relaxation Imaging (FReI). The sample was encased in a sample chamber and excited by blue light (λ=470 nm). Fluorescence emission from SOD1bar was collimated by the objective and detected simultaneously by two CCD cameras. The IR laser (λ=2,200 nm) was focused onto the sample from the top. (C) Exemplary D/A vs. time profile during FReI of the SOD1bar A4V in PBS and 50 μM CLR01 and CLR03. (D) Temperature jump amplitudes of the SOD1bar melting curve in the presence of CLR01 and CLR03. The Tm corresponds to the maximum of these curves.
Results and Discussion
SOD1bar stability in the presence and absence of CLR01 measured by fast relaxation imaging
To measure the folding stability of SOD1bar in the presence and absence of the molecular tweezer CLR01 (Figure 1A), we employed Fast Relaxation Imaging (FReI) (Figure 1B). CLR03 was used as a negative control, since it lacks the hydrophobic arms of CLR01, and it is therefore unable to form inclusion complexes with Lys and Arg residues. [22] FReI was previously applied to measure the protein folding‐stability of SOD1bar in vitro and in the cell. [31] Here, we used this technique to investigate specific mutants in the presence and absence of the tweezers in vitro. Accordingly, wide‐field fluorescence microscopy and Förster resonance energy transfer (FRET) experiments were combined with rapid temperature jumps triggered by an infrared laser (Figure 1B, see section of Material and Methods for further details). Using 16—18 consecutive temperature jumps with an amplitude of the unfolding of the protein was induced. To monitor the unfolding process, SOD1bar was labelled at the C‐ and N‐termini with the fluorescent fusion proteins, AcGFP1 (Donor) and mCherry (Acceptor), respectively. The temperature‐induced protein unfolding led to an alteration in FRET efficiency and thus a change in donor and acceptor intensity ratio (D/A) with time (Figure 1C). These D/A kinetic amplitudes were fitted as a function of temperature (Figure 1D) according to an analytical model described previously [32] to determine the melting temperature Tm , the standard free energy of folding (at 37 °C) and the cooperativity parameter dg1 . All fitted thermodynamic parameters are listed in Table S1 and shown in Figures S1–S6 of the Supporting Information.
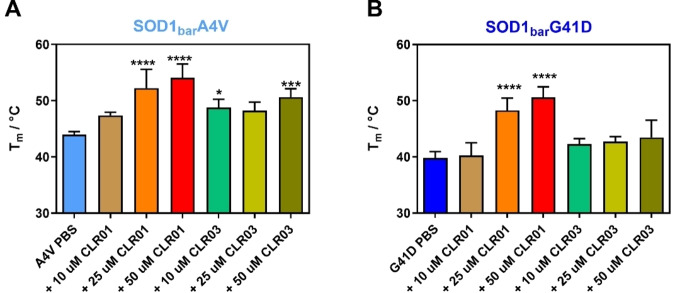
We investigated the mutants A4V and G41D, which are commonly observed mutations[ 33 , 34 ] in fALS. Earlier studies showed that these mutants were destabilized by ∼1.65 kcal/mol (A4V) and ∼2.27 kcal/mol (G41D) compared to dilute DPBS buffer and by ∼1.96 kcal/mol (A4V) and ∼2.94 kcal/mol (G41D) inside living cells. [31] First, the A4V mutant was studied in the presence and absence of CLR01 at the concentrations 10 μM, 25 μM and 50 μM (Figure 2A). An increase in Tm was observed for CLR01 as well as a minor increase for CLR03. An increase of Tm from 43.8±0.5 °C to 53.9±2.5 °C and of from −0.53±0.06 kcal/mol to −1.25±0.47 kcal/mol (Table S1, Supporting Information) was observed in presence of CLR01. The cooperativity parameter (dg1) remained unchanged (Table S1, Supporting Information). Similarly, upon adding CLR01, we found a major increase in the stability of the G41D mutant (Tm from 39.7±1.1 °C to 50.4±1.9 °C and (at 37 °C) changed from 0.23±0.10 kcal/mol to −1.32±0.46 kcal/mol whereas no significant change was observed upon addition of CLR03 (Figure 2B). Minor changes in the presence of the control (CLR03) were also reported in previous studies of tweezers with other proteins.[ 21 , 23 ] These changes may be attributed to transient interactions of the ligands with the protein residues, established via the negatively charged hydrogen phosphate groups adorning the periphery of both molecules. Unlike CLR01, CLR03 cannot form supramolecular complexes that further contribute to stabilize these interactions. In summary, FReI experiments showed that CLR01 significantly increases the stability of the A4V and G41D SOD1bar mutants.
Figure 2.
Melting temperatures of SOD1bar A4V (A) and G41D (B) in PBS buffer and in the presence and absence of CLR01 and CLR03. Mean values and s.d. are shown. Using one‐way ANOVA with post‐hoc analysis, significant statistical differences with respect to the PBS measurement were determined, which are indicated by asterisks (*p<0.05, **p<0.01, ****p<0.0001); n=5.
Molecular dynamics and binding free energy calculations
Next, we carried out molecular dynamics (MD) simulations and free energy calculations to investigate the mechanism of CLR01‐mediated stabilization of SOD1bar. The MD simulations of the native protein in explicit water, comprising 600 ns of sampling time, evidenced a flexible region corresponding to the loop L7 of SOD1bar, which consists of residues E91 – R100. Figure 3 shows the conformational transition observed in loop L7 during the simulations. L7 undergoes up‐ and down‐folding transitions in time intervals of several tens of nanoseconds. This transition is observed frequently enough to suggest a low energy barrier between both states (up‐ and down‐ Figure 3). Nevertheless, the time scale does not allow the quantitative estimation of equilibrium parameters from conventional MD simulations. Still, the (expected) low free energy difference between these states would explain the observed changes in stability upon tweezers binding, provided that CLR01 strongly shifts the conformational equilibrium of L7 to one of these structures (up‐ and down‐ Figure 3).
Figure 3.
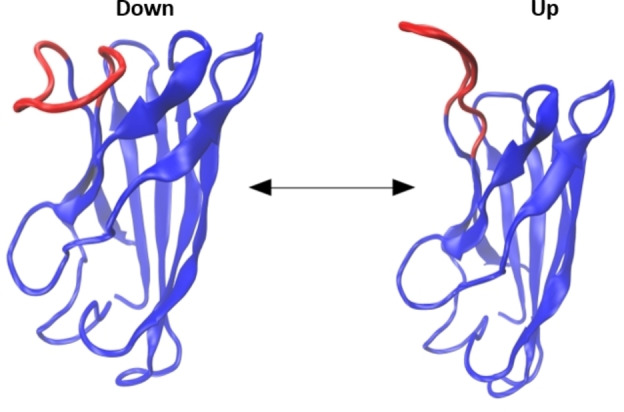
Up‐ and down‐fold states of loop L7 (E91 – R100), shown in red, observed during the molecular dynamics simulations.
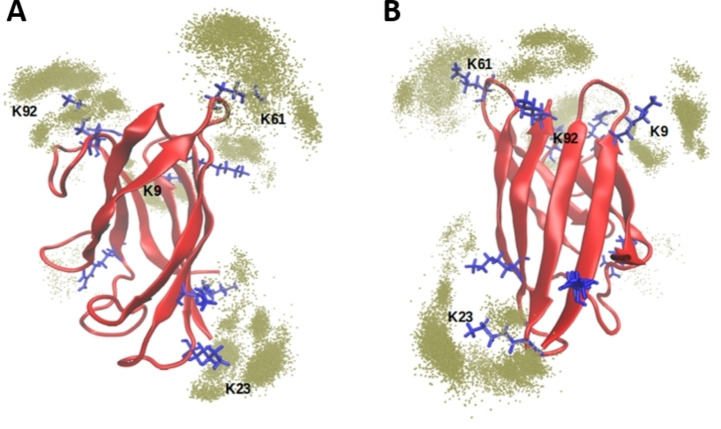
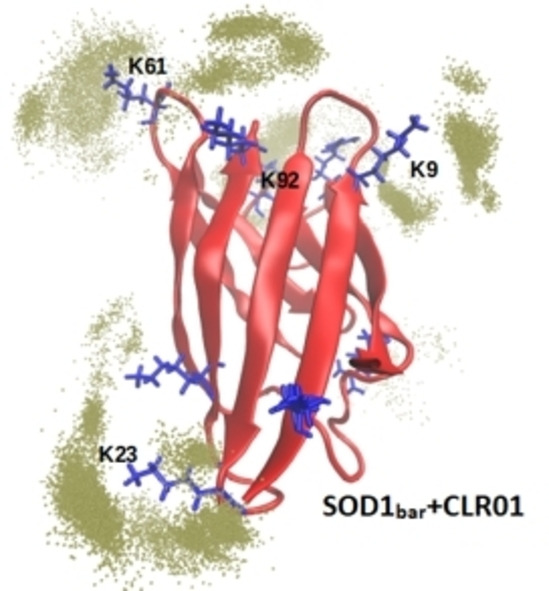
Accordingly, we illustrate with further MD simulations and free energy calculations the possible structural foundations of the experimentally observed effect of the tweezers on SOD1bar. First, we addressed the issue of elucidating the most favorable binding sites of CLR01 among the seven lysine (K3, K9, K23, K30, K36, K61, K92), and the two arginine residues (R85, R100) on the surface of SOD1. We built a fully saturated system in which it is assumed that each lysine and arginine can bind one CLR01 molecule and ran six replicas of MD simulations of ∼100 ns each at 300 K. We sampled simulation frames every 50 ps and determined the prevalence of tweezers in the vicinity of each residue. The vicinity was defined as 4 Å distance between the tweezers and any heavy atom of the amino acid. Figure 4 illustrates the different populations of tweezers around lysine residues along the simulations. This analysis indicates that K9, K23, K61 and K92 are the sites where the inclusion complexes of the tweezer are most conserved (the prevalence of tweezers around all residues is shown in Figure S7, Supporting Information).
Figure 4.
Structural representation of the localization of CLR01 molecules. The SOD1bar is represented in red, lysine and arginine residues are highlighted in blue licorice and the green dots depict the positions of the phosphorous atoms of the tweezers within 4 Å of any heavy atom of each lysine residue. A and B are different views of the structure, rotated 180° around the central axis of the barrel.
To further evaluate the identified binding sites, we performed site‐specific binding free energy calculations using the central limit free energy perturbation (CL‐FEP) approach. [35] The systems for these calculations were prepared in the form of 1 : 1 complexes on each of the previously identified lysine sites. The solvated simulation boxes and configuration files for the calculations were obtained from the webserver CLFEP‐GUI. [36] Harmonic restraints were applied on the shape of the protein during the sampling simulations to prevent slow conformational motions from affecting the energy distribution of the bound and unbound states. The difference between the average work applied by the restraints in the bound and unbound simulations was subtracted from the CL‐FEP calculation to recover an unbiased binding free energy estimate. In excellent agreement with the results of the previous MD simulations, only three of the lysine sites showed a thermodynamically favored binding affinity. These sites are K23, K92 and K61. We note that these values are very close in energy to allow for a reliable discrimination between them within the range of accuracy of force field‐based free energy calculations (Table 1).
Table 1.
Site‐specific binding free energy calculations of CLR01 to lysine residues in SOD1. Only lysine sites with thermodynamically favored binding free energy estimations are listed.
|
Site |
ΔGbind [kcal/mol] |
|---|---|
|
K23 |
−4.2 ±0.53 |
|
K92 |
−3.8 ±0.74 |
|
K61 |
−2.0 ±0.52 |
Structural mechanism of CLR01 to modulate the stability of SOD1
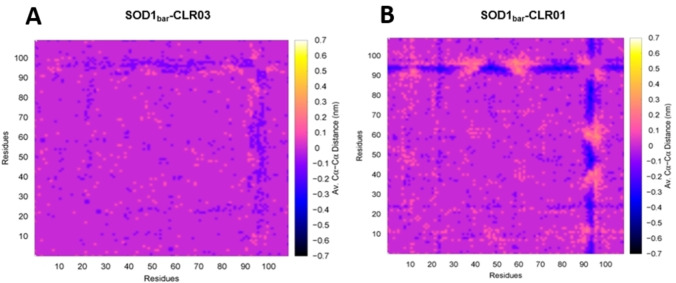
Equipped with the knowledge of the predicted binding sites, we performed a detailed analysis of the protein dynamics when saturated with CLR01 molecules. Thus, we compared simulations of SOD1bar with and without CLR01. As a control system, we also performed calculations with the same amount of CLR03 molecules in the simulation box. Figure 5 shows our analysis based on the average distance matrices, computed among all the α‐carbon atoms of the protein for SOD1bar, SOD1bar – CLR01 and SOD1bar – CLR03. The average was obtained over the MD simulation trajectories. To analyze the simulations in the presence of CLR01 or CLR03, the matrix obtained for the barrel protein was used as reference. As indicated by the plots, the major difference between the two relative matrices (with CLR01 and with the CLR03 control) is found at the loop L7 comprising residues E91 to R100. In the presence of CLR01, L7 is pushed closer to the protein barrel (blue regions), thus showing the role of the tweezers in stabilizing the more compact conformations of the loop. This effect is a consequence of the binding of CLR01 to K92. This binding leads to a complex where a tweezers’ hydrogen phosphate group is placed on L7 inducing the loop's folding towards the barrel (down‐fold state). Figure 6 depicts the binding mode of CLR01 with K92.
Figure 5.
The panels show the subtractions between average distance matrices computed among all the α‐carbon atoms of SOD1bar in presence of CLR01 or CLR03 with the barrel protein as reference. Panels A and B correspond to SOD1bar in presence of CLR03 and CLR01, respectively.
Figure 6.
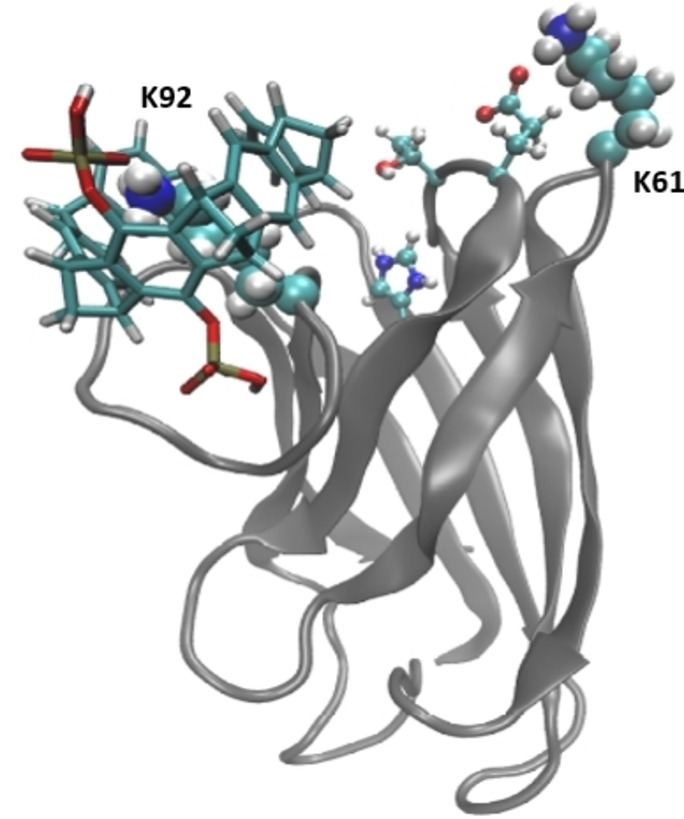
Representation of the binding mode of CLR01 with K92. CLR01 is shown in licorice, neighboring residues (T39, E40, H43) are presented in balls and sticks. K92 and K61 are highlighted in van der Waals representation. The backbone of the protein is shown in gray new cartoon.
We note that this analysis does not preclude the possibility of binding at alternative sites (e. g., K61 or K23), it only points to the fact that, among the existing binding sites, the one responsible of the stability changes should be K92.
Investigation of predicted binding sites by mass spectrometry
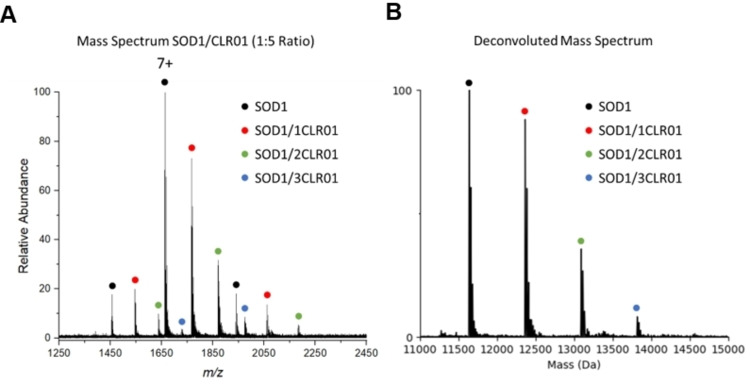
To experimentally interrogate the predicted binding sites, native mass spectrometry (nMS) and top‐down mass spectrometry (TD‐MS) were performed on SOD1bar/CLR01 complexes. nMS performed on a 10 μM sample of CLR01 with a 5x molar concentration of CLR01 in the solution showed three dominant charge states with multiple binding states (Figure 7A). The resulting mass spectrum showing a binding stoichiometry of up to three can be observed at this molar ratio of CLR01 to SOD1bar (Figure 7B). The binding constant (KD ) of CLR01 on SOD1bar was calculated to be 34.23 μM (Figure S8, Supporting Information) (binding free energy, kcal mol−1). In addition, TD‐MS of the 7+ charge state of the SOD1bar/CLR01 complex was performed to determine the binding site of CLR01. Analysis of the TD‐MS spectrum suggested that CLR01 primarily binds SOD1bar at K61 (Figure S9, Supporting Information).
Figure 7.
(A) An electrospray ionization (ESI) mass spectrum of SOD1bar in the presence of CLR01 and (B) the corresponding deconvoluted mass spectrum indicating up to three CLR01 molecules can bind SOD1bar when added at a 5x molar concentration ratio.
SOD1bar stability upon K61 and K92 mutation
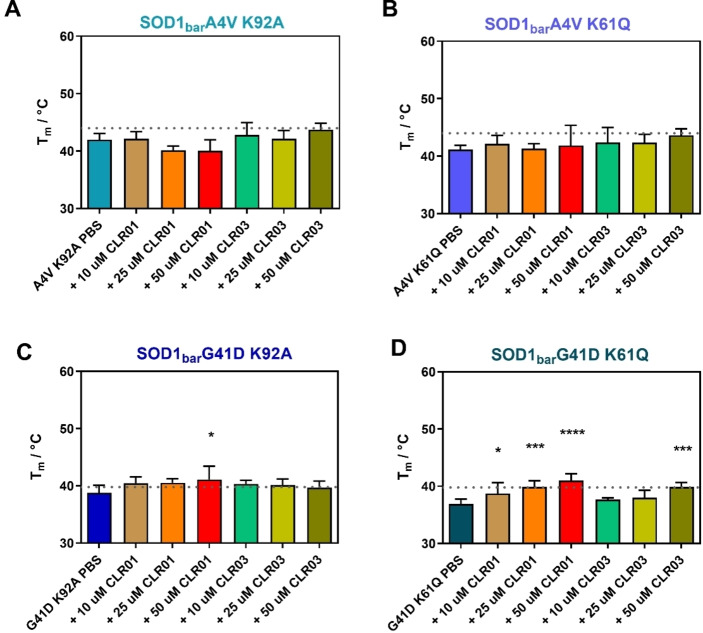
To evaluate if K92 is the responsible binding site for mediating the stability increase by compaction of the loop, we mutated K92 in A4V and G41D proteins. As a reference, we investigated K61, the main binding site identified by nMS. Indeed, the mutation of K92A fully abolishes the effect of CLR01 and no significant stability change was observed for both, A4V K92A (Figure 8A) and G41D K92A (Figure 8C). However, we observed a similar trend for the mutation K61Q with no stability increase in the double mutant A4V K61Q (Figure 8B), but a minor increase for the G41D K61Q variant (Figure 8D, Table S1). This shows that the stability increase is not K92 specific, but rather requires the availability of both binding sites. The difference between A4V and G41D further suggests that different disease‐related mutants may respond differently to CLR01 treatment which needs to be considered in future in vivo studies. [29]
Figure 8.
Melting temperatures of SOD1bar A4V and G41D double mutants in the presence and absence of the molecular tweezer CLR01 and the control CLR03. (A) A4V K92A, (B) A4V K61Q, (C) G41D K92A, (D) G41D K61Q in PBS (pH 7.4) and in presence of CLR01/03. The dotted horizontal lines show the Tm values of A4V for A, B and G41D for C, D (Figure 2) as a reference. Graphs represent mean and s.d. Sample size was n=5. Using one‐way ANOVA with post‐hoc analysis, significant statistical differences with respect to the PBS measurement were determined, which are indicated by asterisks (*p<0.05, **p<0.01, ****p<0.0001).
Conclusion
Using a monomeric version of SOD1, that does not aggregate, we show that CLR01 does significantly increase the folding stability of the SOD1 monomer. The MD simulations corroborate this effect and identify K61 and K92 among possible binding sites that after binding restrict the flexibility of the loop L7 and render the SOD1bar structure more compact. K61 was further confirmed as a preferential binding site by nMS and mutational studies showed that both, K61 and K92 are needed to retain the observed stability effect. Our experiments agree with earlier studies that suggest that CLR01 modulates SOD1 folding and aggregation pathway with possible beneficial effects in disease progression. [29] CLR01 modulates the protein folding equilibrium and thus targets the earliest stage of the folding and aggregation pathway. This knowledge can be used for the further development of supramolecular ligands that can be designed to specifically increase SOD1 stability.
Experimental Section
Computational details: Molecular dynamics simulations were performed using NAMD2.13 [37] and the CHARMM36 m force field. [38] VMD 1.9.3 [39] was employed for the analysis and visualization of the trajectories. The simulations were carried out with explicit TIP3P [40] water molecules at a pressure of 1 atm and at a temperature of 300 K. Temperature and pressure coupling were achieved with Langevin dynamics[ 41 , 42 , 43 ] with a damping constant of 5 ps−1. An electrostatic cut‐off of 14 Å was used. The Particle Mesh Ewald method [44] was employed for the treatment of long‐range electrostatic interactions.
The dynamics analyses comprised two systems, each one with the protein surrounded by nine CLR01 molecules in one case, or CLR03 in the other. The initial configurations of SOD1 in presence of CLR01 were built by forming inclusion complexes with the lysine and arginine residues as long as they were sterically allowed. The structures were first minimized and then solvated in a rectangular box with a padding of 25 Å. Ions were added to neutralize the system. The boxes were previously equilibrated at 300 K using short NVT and NPT simulations with harmonic constraints on atoms of the protein and the ligand. Subsequently, six replicas of ∼100 ns each were performed for each system. Coordinates of the systems were saved every 5 ps to perform the analyses.
Binding energy calculations were performed based on the Central Limit Free Energy Perturbation (CL‐FEP) method [35] and configured using default parameters of the CLFEP‐GUI web server. [36] 200 ns (4×50 ns) simulations were run for each state of each system. A harmonic potential was used to restraint the shape of the protein and the net difference between the average of the applied work in the bound and unbound states was used as an approach to correct the estimated free energy values. The convergence analysis of the bootstrap protocol implemented for CL‐FEP is summarized in Tables S2–S4, Supporting Information.
Site‐directed mutagenesis: Site‐directed mutagenesis was used to generate SOD1bar mutants using the Quick‐change Lightning Site‐Directed Mutagenesis Kit.
Protein purification
SOD1bar (with AcGFP1 and mCherry fusions): A polyhistidine tag was used for Ni‐affinity chromatography using the His60 Ni Gravity Column Purification Kit. (TaKaRa). 2 mL of His60 Ni×Tractor buffer were added per 100 mg bacterial pellet. The pellet was resuspended by pipetting up and down several times. DNase (1 μL) was added per 2 mL extract and the samples were shaken gently. The samples were incubated for 15 minutes on ice and centrifuged for 30 minutes at 7100 g. Protein purification was performed at 4 °C. The columns were washed with 5 mL equilibration buffer. 5 mL supernatant was then added to the columns and those were inverted slowly for 1 hour to let the protein bind to the column. The columns were washed then twice with 5 mL equilibration buffer. The protein was eluted with 10 mL elution buffer and 1 mL fractions were collected.
SOD1bar (without AcGFP1 and mCherry fusions): GST tagged SOD1barWt (expressed from pGEX‐6p1 vector plasmid transformed into NiCo21 E. coli) was purified in two steps by using i) glutathione spin column (Thermo Scientific, Germany) affinity chromatography and ii) size exclusion chromatography (ENrichTM 650, BioRad). The bacterial cell lysate (after sonication and centrifugation) supernatant was added to the glutathione column after being equilibrated (centrifuged at 700×g rcf for 2 min) with sterile 50 mM Tris (pH 8.0) buffer (with 150 mM NaCl) at 4°C. To confirm binding, the column was incubated for 60 min at 4 °C, using gentle rotation (Heraeus instruments, mini‐PERM RA40). The column was washed 2–3 times) with equilibration buffer and centrifuged 700×g rcf for 2 min. The GST‐SOD1bar protein was eluted by 50 mM Tris buffer (pH 8.0) with 150 mM NaCl, 10 mM reduced glutathione. The flow through was collected and GST was cleaved (in 15 mL falcon tube at 4 °C for 6 h) by PreScission protease (GE Healthcare, UK). The mixture was further put into the regenerated glutathione spin column after applied equilibrium buffer (10 mM PBS (pH 7.3), 140 mM NaCl, 2.7 mM KCl). It was incubated for 60 min at 4°C to confirm the binding of cleaved GST and precision protease. The untagged protein was washed by cleavage buffer of pH 7.0 (50 mM Tris‐HCl, 150 mM NaCl, 1 mM EDTA, 1 mM DTT) and the flow through was collected. The GST moiety of the tagged protein and the PreScission Protease remain attached to the Glutathione. The collected protein was concentrated by using 3 kDa Amicon® ultra‐15 centrifugal filters (Sigma‐Aldrich, Germany) and then dialyzed (by Maxi GeBaFlex‐tube‐dialysis kit, MWCO 8 kDa, Generon) overnight in 1 L PBS buffer (pH 7.4) solution at 4 °C. For further purification size exclusion chromatography (SEC650, BioRad) with PBS buffer (pH 7.4) by NGC quest 10 plus system (BioRad) was used. The protein purity and stability were checked by SDS‐PAGE gel electrophoresis and differential scanning calorimetry, respectively. Finally, the ultra‐pure fractions were collected and lyophilized (Alpha 3‐4 LSCbasic freeze dryer CHRIST, GmbH).
Sample preparation for in vitro FReI: For in vitro measurements, the sample mixture was prepared in a PCR tube, resulting in a protein concentration around 10 μM. Afterwards, 19 μL of the mixture were pipetted into the glass bottom fluorodish (WPI). A sterile cover glass was placed onto it with a sticky spacer of 120 μm thickness (Secure Seal, Sigma).
FReI measurement and data analysis: FReI is a microscopic technique based on infrared (IR) laser heating to measure protein folding/unfolding (thermodynamics as well as kinetics) both in vitro and under cellular conditions.[ 45 , 46 ] The temperature jumps (T‐jump) were calibrated by using the temperature‐sensitive dye rhodamine B (100 μM solution). FRET imaging (200 ms interval, excited by 470 nm LED) was performed by an inverted wide field microscope (AxioObserver Z1, Zeiss) customized by an external IR diode laser, emitting continuous wave light of 2200±20 nm (m2k laser, GmbH, Germany). A custom‐written Labview script was used to control the IR laser which heated up the sample by 2.3±0.1 °C each 25 seconds for 16–18 T‐jumps. The donor and acceptor channel images were analyzed by Fiji/ImageJ (NIH) to compute intensities which were fitted by a self‐written Matlab code to evaluate the ratio of donor and acceptor intensity (D/A). The D/A values for each T‐jump were fitted by Girdhar's model (equation 1. [32]
| (1) |
where dg1 is first order cooperativity parameter, ▵T is the amplitude of each T‐jump (2.3 °C), Tm is the melting temperature, A 0 and ma are the parameters for the baseline. The standard free energy of unfolding at 37 °C was calculated by equation (2). Assuming a reversible equilibrium process, the standard free energy of folding ( ) was calculated.
| (2) |
Mass spectra measurement and analysis: SOD1bar was dissolved in 20 mM ammonium acetate and the protein solution was buffer exchanged with an Amicon 10 kDa filter. To obtain a native mass spectrum of the SOD1bar/CLR01 complex, a solution containing 10 μM protein and 50 μM of CLR01 was electrosprayed (capillary voltage of 1.2 kV) on a Bruker SolariX 15T FT‐ICR mass spectrometer. The native mass spectrum was deconvoluted to the mass domain with the software program, UniDec. [47] To obtain a top‐down mass spectrum of the native SOD1bar/CLR01 complex, the 7+ charge state of the SOD1bar/CLR01 complex was isolated, and electron ionization dissociation (EID) was performed with a pulse length of 0.6 s, a bias of 25 V, and a lens potential of 60 V. The resulting top‐down mass spectrum was deconvoluted with the SNAP algorithm from DataAnalysis 5.0 with a signal to noise threshold of 2. Deconvoluted values were matched with ClipsMS [48] with an error tolerance of 2 ppm and manually validated up to 5 ppm. To calculate the KD value, native mass spectra were collected at varying concentrations of CLR01 ranging from 0 μM to 50 μM in a solution of 10 μM SOD1bar. The mass spectra were deconvoluted with UniDec and a plot was constructed based on the peak intensities from the deconvolution. A 2nd degree polynomial curve was fitted to the data with MATLAB (equation (3)) and the quadratic formula [49] ( ) was then used to calculate the KD (the concentration of ligand at which 50 % of SOD1bar is bound) with the values from the equation.
| (3) |
Conflict of interest
The authors declare no conflict of interest.
Supporting information
As a service to our authors and readers, this journal provides supporting information supplied by the authors. Such materials are peer reviewed and may be re‐organized for online delivery, but are not copy‐edited or typeset. Technical support issues arising from supporting information (other than missing files) should be addressed to the authors.
Supporting Information
Acknowledgements
This work was supported by the Deutsche Forschungsgemeinschaft (DFG, German Research Foundation) under Germany's Excellence Strategy ‐ EXC 2033‐390677874 ‐ RESOLV to S.E and E.S.‐G. and by the Programm Forschungsgroßgeräte, project ID: 436586093 to E.S.‐G and project ID: 423465882 to S.E. S.E. acknowledges funding from GIF (grant 1410) and the German Research Foundation DFG‐SPP 2191 “Molecular Mechanisms of Functional Phase Separation” (Project number 402723784). D.G. acknowledges funding by the IGSN. E. S.‐G. also acknowledges the Collaborative Research Center “Supramolecular Chemistry on Proteins” CRC 1093, funded by the DFG (project A8) and computational time provided at the supercomputer magnitUDE of the University of Duisburg‐Essen. J.A.L. acknowledges support from the US National Institutes of Health (R01GM103479, S10RR028893) and the US Department of Energy (DE‐FC02‐02ER63421). C.L. acknowledges support from the Ruth L. Kirschstein National Research Service Award program (GM007185). We thank M. Oliveberg and J. Danielsson for providing the SOD1 barrel plasmid and helpful discussions. We thank T. Schrader and G. Bitan for providing CLR01 and CLR03. We thank M. Papenfuß and Y. Göcke for the help with protein lyophilization. We thank S. Ribeiro and P. Shrestha for critical reading of the manuscript. Open Access funding enabled and organized by Projekt DEAL.
N. Samanta, Y. B. Ruiz-Blanco, Z. Fetahaj, D. Gnutt, C. Lantz, J. A. Loo, E. Sanchez-Garcia, S. Ebbinghaus, ChemBioChem 2022, 23, e202200396.
Contributor Information
Prof. Dr. Elsa Sanchez‐Garcia, Email: elsa.sanchez-garcia@uni-due.de.
Prof. Dr. Simon Ebbinghaus, Email: s.ebbinghaus@tu-braunschweig.de.
References
- 1. Li H.-F., Wu Z.-Y., Transl. Neurodegener. 2016, 5, 3. [DOI] [PMC free article] [PubMed] [Google Scholar]
- 2. Sreedharan J., Brown R. H., Ann. Neurol. 2013, 74, 309–316. [DOI] [PubMed] [Google Scholar]
- 3. Johnston J. A., Dalton M. J., Gurney M. E., Kopito R. R., Proc. Natl. Acad. Sci. USA 2000, 97, 12571–12576. [DOI] [PMC free article] [PubMed] [Google Scholar]
- 4. Byström R., Andersen P. M., Gröbner G., Oliveberg M., J. Biol. Chem. 2010, 285, 19544–19552. [DOI] [PMC free article] [PubMed] [Google Scholar]
- 5. Lindberg M. J., Byström R., Boknäs N., Andersen P. M., Oliveberg M., Proc. Natl. Acad. Sci. USA 2005, 102, 9754–9759. [DOI] [PMC free article] [PubMed] [Google Scholar]
- 6. Lang L., Kurnik M., Danielsson J., Oliveberg M., Proc. Natl. Acad. Sci. USA 2012, 109, 17868–17873. [DOI] [PMC free article] [PubMed] [Google Scholar]
- 7. Proctor E. A., Fee L., Tao Y., Redler R. L., Fay J. M., Zhang Y., Lv Z., Mercer I. P., Deshmukh M., Lyubchenko Y. L., Dokholyan N. V., Proc. Natl. Acad. Sci. USA 2016, 113, 614–619. [DOI] [PMC free article] [PubMed] [Google Scholar]
- 8. Mateju D., Franzmann T. M., Patel A., Kopach A., Boczek E. E., Maharana S., Lee H. O., Carra S., Hyman A. A., Alberti S., EMBO J. 2017, 36, 1669–1687. [DOI] [PMC free article] [PubMed] [Google Scholar]
- 9. Samanta N., Ribeiro S. S., Becker M., Laborie E., Pollak R., Timr S., Sterpone F., Ebbinghaus S., J. Am. Chem. Soc. 2021, 143, 19909–19918. [DOI] [PubMed] [Google Scholar]
- 10. Malik R., Corrales C., Linsenmeier M., Alalami H., Sepanj N., Bitan G., FASEB J. 2020, 34, 11957–11969. [DOI] [PMC free article] [PubMed] [Google Scholar]
- 11. Reaume A. G., Elliott J. L., Hoffman E. K., Kowall N. W., Ferrante R. J., Siwek D. R., Wilcox H. M., Flood D. G., Beal M. F., Brown R. H., Scott R. W., Snider W. D., Nat. Genet. 1996, 13, 43–47. [DOI] [PubMed] [Google Scholar]
- 12. Murakami G., Inoue H., Tsukita K., Asai Y., Amagai Y., Aiba K., Shimogawa H., Uesugi M., Nakatsuji N., Takahashi R., J. Biomol. Screening 2011, 16, 405–414. [DOI] [PubMed] [Google Scholar]
- 13. Xia G., Benmohamed R., Kim J., Arvanites A. C., Morimoto R. I., Ferrante R. J., Kirsch D. R., Silverman R. B., J. Med. Chem. 2011, 54, 2409–2421. [DOI] [PMC free article] [PubMed] [Google Scholar]
- 14. Lee N.-Y., Kang Y.-S., Taurine 10 (Eds.: Lee D.-H., Schaffer S. W., Park E., Kim H. W.), Springer, Dordrecht: 2017, pp. 887–895. [Google Scholar]
- 15. Cudkowicz M. E., Andres P. L., Macdonald S. A., Bedlack R. S., Choudry R., R. H. Brown Jr , Zhang H., Schoenfeld D. A., Shefner J., Matson S., Matson W. R., Ferrante R. J., Amyotrophic Lateral Scler. 2009, 10, 99–106. [DOI] [PubMed] [Google Scholar]
- 16. Vang S., Longley K., Steer C. J., Low W. C., Glob. Adv. Health Med. 2014, 3, 58–69. [DOI] [PMC free article] [PubMed] [Google Scholar]
- 17. Elia A. E., Lalli S., Monsurrò M. R., Sagnelli A., Taiello A. C., Reggiori B., La Bella V., Tedeschi G., Albanese A., Eur. J. Neurol. 2016, 23, 45–52. [DOI] [PMC free article] [PubMed] [Google Scholar]
- 18. Ray S. S., Nowak R. J., Brown R. H., Lansbury P. T., Proc. Natl. Acad. Sci. USA 2005, 102, 3639–3644. [DOI] [PMC free article] [PubMed] [Google Scholar]
- 19. Vucic S., Rothstein J. D., Kiernan M. C., Trends Neurosci. 2014, 37, 433–442. [DOI] [PubMed] [Google Scholar]
- 20. Tsuburaya N., Homma K., Higuchi T., Balia A., Yamakoshi H., Shibata N., Nakamura S., Nakagawa H., Ikeda S., Umezawa N., Kato N., Yokoshima S., Shibuya M., Shimonishi M., Kojima H., Okabe T., Nagano T., Naguro I., Imamura K., Inoue H., Fujisawa T., Ichijo H., Nat. Commun. 2018, 9, 2668. [DOI] [PMC free article] [PubMed] [Google Scholar]
- 21. Zheng X., Liu D., Klärner F.-G., Schrader T., Bitan G., Bowers M. T., J. Phys. Chem. B 2015, 119, 4831–4841. [DOI] [PMC free article] [PubMed] [Google Scholar]
- 22. Herzog G., Shmueli M. D., Levy L., Engel L., Gazit E., Klärner F.-G., Schrader T., Bitan G., Segal D., Biochemistry 2015, 54, 3729–3738. [DOI] [PubMed] [Google Scholar]
- 23. Vöpel T., Bravo-Rodriguez K., Mittal S., Vachharajani S., Gnutt D., Sharma A., Steinhof A., Fatoba O., Ellrichmann G., Nshanian M., Heid C., Loo J. A., Klärner F.-G., Schrader T., Bitan G., Wanker E. E., Ebbinghaus S., Sanchez-Garcia E., J. Am. Chem. Soc. 2017, 139, 5640–5643. [DOI] [PMC free article] [PubMed] [Google Scholar]
- 24. Sinha S., Lopes D. H. J., Du Z., Pang E. S., Shanmugam A., Lomakin A., Talbiersky P., Tennstaedt A., McDaniel K., Bakshi R., Kuo P.-Y., Ehrmann M., Benedek G. B., Loo J. A., Klärner F.-G., Schrader T., Wang C., Bitan G., J. Am. Chem. Soc. 2011, 133, 16958–16969. [DOI] [PMC free article] [PubMed] [Google Scholar]
- 25. Lump E., Castellano L. M., Meier C., Seeliger J., Erwin N., Sperlich B., Stürzel C. M., Usmani S., Hammond R. M., von Einem J., Gerold G., Kreppel F., Bravo-Rodriguez K., Pietschmann T., Holmes V. M., Palesch D., Zirafi O., Weissman D., Sowislok A., Wettig B., Heid C., Kirchhoff F., Weil T., Klärner F.-G., Schrader T., Bitan G., Sanchez-Garcia E., Winter R., Shorter J., Münch J., eLife 2015, 4, e05397. [DOI] [PMC free article] [PubMed] [Google Scholar]
- 26. Lopes D. H. J., Attar A., Nair G., Hayden E. Y., Du Z., McDaniel K., Dutt S., Bandmann H., Bravo-Rodriguez K., Mittal S., Klärner F.-G., Wang C., Sanchez-Garcia E., Schrader T., Bitan G., ACS Chem. Biol. 2015, 10, 1555–1569. [DOI] [PubMed] [Google Scholar]
- 27. Malishev R., Salinas N., Gibson J., Eden A. B., Mieres-Perez J., Ruiz-Blanco Y. B., Malka O., Kolusheva S., Klärner F.-G., Schrader T., Sanchez-Garcia E., Wang C., Landau M., Bitan G., Jelinek R., Cell Chem. Biol. 2021, 28, 1310–1320.e5. [DOI] [PMC free article] [PubMed] [Google Scholar]
- 28. Mittal S., Bravo-Rodriguez K., Sanchez-Garcia E., J. Phys. Chem. B 2018, 122, 4196–4205. [DOI] [PubMed] [Google Scholar]
- 29. Malik R., Meng H., Wongkongkathep P., Corrales C. I., Sepanj N., Atlasi R. S., Klärner F.-G., Schrader T., Spencer M. J., Loo J. A., Wiedau M., Bitan G., J. Biol. Chem. 2019, 294, 3501–3513. [DOI] [PMC free article] [PubMed] [Google Scholar]
- 30. Danielsson J., Kurnik M., Lang L., Oliveberg M., J. Biol. Chem. 2011, 286, 33070–33083. [DOI] [PMC free article] [PubMed] [Google Scholar]
- 31. Gnutt D., Timr S., Ahlers J., König B., Manderfeld E., Heyden M., Sterpone F., Ebbinghaus S., J. Am. Chem. Soc. 2019, 141, 4660–4669. [DOI] [PubMed] [Google Scholar]
- 32. Girdhar K., Scott G., Chemla Y. R., Gruebele M., J. Chem. Phys. 2011, 135, 015102. [DOI] [PubMed] [Google Scholar]
- 33. Saeed M., Yang Y., Deng H.-X., Hung W.-Y., Siddique N., Dellefave L., Gellera C., Andersen P. M., Siddique T., Neurology 2009, 72, 1634–1639. [DOI] [PMC free article] [PubMed] [Google Scholar]
- 34. Cudkowicz M. E., McKenna-Yasek D., Sapp P. E., Chin W., Geller B., Hayden D. L., Schoenfeld D. A., Hosler B. A., Horvitz H. R., Brown R. H., Ann. Neurol. 1997, 41, 210–221. [DOI] [PubMed] [Google Scholar]
- 35. Ruiz-Blanco Y. B., Sanchez-Garcia E., J. Chem. Theory Comput. 2020, 16, 1396–1410. [DOI] [PubMed] [Google Scholar]
- 36.“CLFEP-GUI,” can be found under https://clfep.zmb.uni-due.de/analysis.php
- 37. Phillips J. C., Braun R., Wang W., Gumbart J., Tajkhorshid E., Villa E., Chipot C., Skeel R. D., Kalé L., Schulten K., J. Comput. Chem. 2005, 26, 1781–1802. [DOI] [PMC free article] [PubMed] [Google Scholar]
- 38. Huang J., Rauscher S., Nawrocki G., Ran T., Feig M., de Groot B. L., Grubmüller H., MacKerell A. D., Nat. Methods 2017, 14, 71–73. [DOI] [PMC free article] [PubMed] [Google Scholar]
- 39. Humphrey W., Dalke A., Schulten K., J. Mol. Graphics 1996, 14, 33–38. [DOI] [PubMed] [Google Scholar]
- 40. Jorgensen W. L., Jenson C., J. Comput. Chem. 1998, 19, 1179–1186. [Google Scholar]
- 41. Feller S. E., Zhang Y., Pastor R. W., Brooks B. R., J. Chem. Phys. 1995, 103, 4613–4621. [Google Scholar]
- 42. Hoover W. G., Phys. Rev. A 1986, 34, 2499–2500. [DOI] [PubMed] [Google Scholar]
- 43. Hoover W. G., Phys. Rev. A 1985, 31, 1695–1697. [DOI] [PubMed] [Google Scholar]
- 44. Darden T., York D., Pedersen L., J. Chem. Phys. 1993, 98, 10089–10092. [Google Scholar]
- 45. Ebbinghaus S., Dhar A., McDonald J. D., Gruebele M., Nat. Methods 2010, 7, 319–323. [DOI] [PubMed] [Google Scholar]
- 46. Dhar A., Gruebele M., Curr. Protoc. Protein Sci. 2011, 65, 28.1.1–28.1.19. [DOI] [PubMed] [Google Scholar]
- 47. Marty M. T., Baldwin A. J., Marklund E. G., Hochberg G. K. A., Benesch J. L. P., Robinson C. V., Anal. Chem. 2015, 87, 4370–4376. [DOI] [PMC free article] [PubMed] [Google Scholar]
- 48. Lantz C., Zenaidee M. A., Wei B., Hemminger Z., Ogorzalek Loo R. R., Loo J. A., J. Proteome Res. 2021, 20, 1928–1935. [DOI] [PMC free article] [PubMed] [Google Scholar]
- 49. Jarmoskaite I., AlSadhan I., Vaidyanathan P. P., Herschlag D., eLife 2020, 9, e57264. [DOI] [PMC free article] [PubMed] [Google Scholar]
Associated Data
This section collects any data citations, data availability statements, or supplementary materials included in this article.
Supplementary Materials
As a service to our authors and readers, this journal provides supporting information supplied by the authors. Such materials are peer reviewed and may be re‐organized for online delivery, but are not copy‐edited or typeset. Technical support issues arising from supporting information (other than missing files) should be addressed to the authors.
Supporting Information


