Abstract
This study aimed to develop a versatile automatic segmentation model of bladder cancer (BC) on MRI using a convolutional neural network and investigate the robustness of radiomics features automatically extracted from apparent diffusion coefficient (ADC) maps. This two-center retrospective study used multi-vendor MR units and included 170 patients with BC, of whom 140 were assigned to training datasets for the modified U-net model with five-fold cross-validation and 30 to test datasets for assessment of segmentation performance and reproducibility of automatically extracted radiomics features. For model input data, diffusion-weighted images with b = 0 and 1000 s/mm2, ADC maps, and multi-sequence images (b0-b1000-ADC maps) were used. Segmentation accuracy was compared between ours and existing models. The reproducibility of radiomics features on ADC maps was evaluated using intraclass correlation coefficient. The model with multi-sequence images achieved the highest Dice similarity coefficient (DSC) with five-fold cross-validation (mean DSC = 0.83 and 0.79 for the training and validation datasets, respectively). The median (interquartile range) DSC of the test dataset model was 0.81 (0.70–0.88). Radiomics features extracted from manually and automatically segmented BC exhibited good reproducibility. Thus, our U-net model performed highly accurate segmentation of BC, and radiomics features extracted from the automatic segmentation results exhibited high reproducibility.
Subject terms: Machine learning, Image processing, Bladder
Introduction
Bladder cancer (BC) is the tenth most common malignancy worldwide, with an increasing mortality rate1. There are various treatment options for BC depending on the clinical staging, including transurethral resection of bladder tumor (TURBT), intravesical therapy, total cystectomy, radiation therapy, chemotherapy, and immunotherapy2. Although TURBT provides pathological information on the local staging of BC, the quality of TURBT depends on the expertise of the urologist. Consequently, MRI is now an essential tool for the preoperative local staging of BC, including the recently released Vesical Imaging Reporting and Data System (VI-RADS)3–5.
Medical image analysis using radiomics approaches has garnered increasing attention in recent years. Radiomics extracts and analyzes large amounts of advanced quantitative imaging features with the goal of objective diagnostic imaging. Several studies have employed radiomics to predict BC staging, including muscle invasion6–10. For this type of research, tumor segmentation is necessary; however, manual segmentation is labor-intensive, time-consuming, and lacks objectivity. Thus, highly accurate automatic tumor segmentation is necessary to create regions of interest (ROIs) with less effort and conduct radiomics studies on a large scale.
Various methods for BC segmentation have been reported. Segmentation with convolutional neural network (CNN)-based methods has recently received growing attention11–18. U-net is a model for automatic segmentation that was initially developed for biomedical science and has emerged as a popular method of CNN-based segmentation of medical images19. Several studies of automated segmentation of BC on MRI using CNN-based methods have been reported. However, these studies were conducted at a single institution with a small number of cases and, therefore, lacked sufficient generalizability for clinical application14–18. To overcome these limitations, it is necessary to conduct research with a larger number of MR images of patients with BC obtained using multi-vendor MR scanners at multiple institutes. Furthermore, the robustness of radiomics features extracted using automatic segmentation is important for performing texture analysis with automatically acquired ROIs.
This study thus aimed to conduct a modified U-Net automatic segmentation of BC with high generalization performance on two-center, multi-vendor MR images using a CNN, an approach that has never been attempted before. In addition, we investigated the reproducibility of radiomics features extracted from manually and automatically segmented BC.
Materials and methods
This two-center retrospective study was approved, and the need for written informed consent was waived, because of the retrospective study design, by the Ethics Committee of Kyoto University Graduate School and Faculty of Medicine and the Medical Ethics Committee of Osaka Red Cross Hospital (R2695 and J-0202, respectively). All methods were conducted in accordance with the Declaration of Helsinki.
Patients
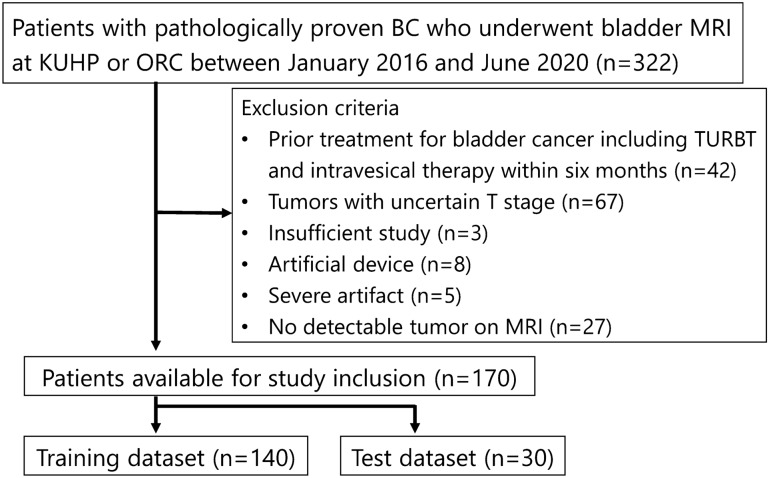
This study included consecutive patients with pathologically proven BC who underwent preoperative bladder MRI at Kyoto University Hospital and Osaka Red Cross Hospital between January 2016 and June 2020. Pathological diagnosis of BC was confirmed by TURBT or cystectomy. Exclusion criteria were (1) prior treatment for BC within 6 months, including TURBT and intravesical therapy, (2) tumors with uncertain T stage according to the European Association of Urology guidelines20, (3) insufficient MR images, (4) artificial devices, (5) severe artifacts, and (6) no detectable tumor on MRI. A final total of 170 patients enrolled in this study were randomly divided into two datasets: a training dataset of 140 patients and a test dataset of 30 patients (Fig. 1). Two board-certified radiologists (Y.M. and N.N. with 12 and 10 years of experience in urogenital radiology, respectively) searched the clinical and pathological records for age, sex, histological grade, and the presence of muscle invasion. The presence of muscle invasion was determined based on the European Association of Urology guidelines20.
Figure 1.
Flow chart of patient selection. KUHP Kyoto University Hospital, ORC Osaka Red Cross Hospital, TURBT transurethral resection of bladder tumor.
MRI protocol
MR images were obtained using a 1.5-T or 3-T scanner with a phased-array coil. The following MR scanners were used: Skyra, Prisma, Avanto (Siemens Healthineers), Achieva, Ingenia, Intera (Philips Healthcare), and SIGNA EXCITE (GE Healthcare). At a minimum, each study included axial T2-weighted images (T2WIs), axial T1-weighted images (T1WIs), and axial diffusion-weighted images (DWIs). The b-values applied to DWI were as follows: b = 0, 1000 s/mm2; b = 0, 500, 1000 s/mm2; and b = 0, 100, 500, 1000 s/mm2. Apparent diffusion coefficient (ADC) maps were automatically constructed with a mono-exponential decay model, using all b-values. Axial DWIs with b = 0 and 1000 s/mm2 and axial ADC maps were used as input sources for subsequent analyses. The MR scanners and their corresponding number of patients and DWI parameters are shown in Supplementary Table. The matrix size of DWI and ADC maps was 110–192 × 80–128.
Image annotation and processing
A board-certified radiologist with 12 years of experience in urogenital radiology (Y.M.) manually segmented BCs on each slice of axial DWIs with b = 1000 s/mm2 using 3D Slicer (https://www.slicer.org) with reference to MR images of other sequences and pathological reports. Another board-certified radiologist with 12 years of experience (Y.K.) verified the ROIs for all cases. The labeled ROIs were regarded as the reference standard for tumor segmentation.
Axial DWIs were resized to 128 × 128 pixels. MR signal intensities (SIs) were normalized according to the following Eq. (1):
| 1 |
where normalized_SI, mean_SI, and SD_SI denote the normalized SI, mean SI of the images, and standard deviation (SD) of the SI of the images, respectively.
U-net architecture
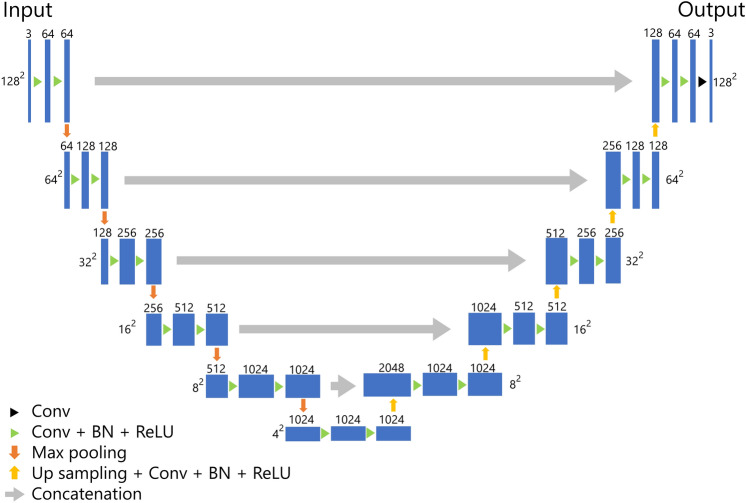
The architecture of our U-net-based model for the segmentation of BC is presented in Fig. 2. Our model was composed of five layers, which was deeper than the original U-net composed of four layers. For training the model, we employed the Adam optimizer as the optimizer with the cost function of Dice loss. The epochs, batch size, and initial learning were set to 30, 56, and 0.001, respectively. During the training, we performed five-fold cross-validation using 80% of the patients for training and 20% for validation.
Figure 2.
U-Net architecture. Conv convolution, BN batch normalization, ReLU rectified linear unit.
To evaluate the impact of input image type on training effectiveness, we used single-sequence images (b0 images, b1000 images, or ADC maps) and multi-sequence images (b0 images + b1000 images + ADC maps) as input data and compared their segmentation performance. When using single-sequence images, one of the b0 images, b1000 images, or ADC maps was input to all of the triple channels. When using multi-sequences, the three sequence images were input to each of the triple channels. The input data type with the highest accuracy in the training dataset was evaluated using the test dataset. In addition, we compared the segmentation performance of our U-Net model with previously reported segmentation networks, such as original U-Net, attention U-Net, UNet++, U2-Net, and TransUNet19,21–24.
Segmentation accuracy
Segmentation accuracy was evaluated with the metric of Dice similarity coefficient (DSC), which was defined using Eq. (2), as follows:
| 2 |
where |T| and |P| represent the count of voxels for the true manual segmentation (reference standard) and predicted segmentation results, respectively, and |T ∩ P| denotes the count of voxels for which BC is accurately segmented (true positive).
Model training
Our U-net model was built and trained with Tensorflow (version 2.5.0) on a Linux workstation (Ubuntu version 18.04) with an NVIDIA GeForce RTX3090 graphics processing unit with 24 GB memory.
Performance evaluation of the test dataset
After building our U-net models using the training dataset, segmentation performance was evaluated using the test dataset. For the segmentation of BC in the test dataset, we employed an ensemble model composed of the five models created during the cross-validation process. The area predicted as BC in three or more of the five models was defined as the predicted BC. The ensemble method to predict the BC on the test dataset is presented in Fig. 3.
Figure 3.
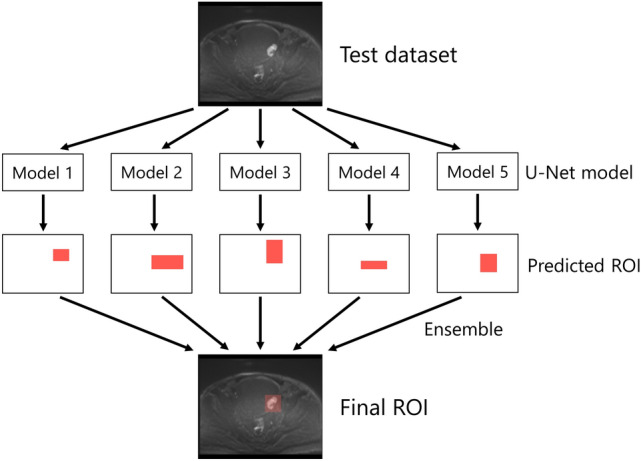
The ensemble model to predict the area of bladder cancer in the test dataset. ROI region of interest.
Extraction of radiomics features
To evaluate the reproducibility of the radiomics features extracted from ADC maps, we compared the features calculated from manually and automatically segmented BC by our U-net model. The radiomics features were calculated using PyRadiomics (version 3.0.1). Basically, we used the default setting of PyRadiomics except for binwidth (= 0.005) and voxel array shift (= 1). The calculated radiomics features were first-order features (n = 18), shape-based features (n = 14), and high-order features (n = 75). High-order features included the following: gray-level co-occurrence matrix (GLCM, n = 24), gray-level run length matrix (GLRLM, n = 16), gray-level size zone matrix (GLSZM, n = 16), neighboring gray tone difference matrix (NGTDM, n = 5), and gray-level dependence matrix (GLDM, n = 14). The details of the radiomics features are available online for reference (https://pyradiomics.readthedocs.io/en/latest/index.html).
Statistical analysis
Clinical characteristics of the patients in the training and test datasets were analyzed using JMP Pro (version 15.2.0, SAS Institute Inc.). Age was compared using a t test, whereas sex, grade, and muscle invasion were compared using a chi-square test. The reproducibility of radiomics features was assessed using the intraclass correlation coefficient (ICC 2.1) calculated using pingouin (version 0.3.8)25. ICC values were interpreted as poor (< 0.50), moderate (0.50–0.75), good (0.75–0.90), and excellent (> 0.90)26. A p-value less than 0.05 was regarded as statistically significant.
Results
Clinical characteristics
The clinical characteristics of the patients assigned to the training and test datasets are shown in Table 1. The patient ages ranged from 47 to 94 years (mean, 73.6 years). There was no statistically significant difference regarding age, sex, histological grade, or muscle invasion between the training and test datasets.
Table 1.
Patient characteristics.
| Training set | Test set | p-value | |
|---|---|---|---|
| Number of patients | 140 | 30 | |
| Age (years, mean ± SD) | 73.5 ± 8.8 | 73.9 ± 10.3 | 0.84 |
| Sex | 0.62 | ||
| Male | 113 | 23 | |
| Female | 27 | 7 | |
| Histological grade | 0.97 | ||
| High | 112 | 24 | |
| Low | 24 | 6 | |
| Others | 4 | 0 | |
| Muscle invasion | 0.98 | ||
| MIBC | 51 | 11 | |
| NMIBC | 89 | 19 |
SD standard deviation, MIBC muscle-invasive bladder cancer, NMIBC non-muscle-invasive bladder cancer.
Segmentation performance in the training and test datasets
The mean DSCs with different sequences as input data for five-fold cross-validation are shown in Table 2. Our U-Net model with multi-sequence images (b0 images, b1000 images, and ADC maps for triple channels) achieved the highest mean DSC of 0.83 and 0.79 in the training and validation datasets, respectively. Consequently, we decided to adopt multi-sequence images as the input data for the final model. The mean DSCs for the validation dataset of five-fold cross-validation with multiple-sequence images using original U-Net, attention U-Net, UNet++, U2-Net, and TransUNet were 0.75, 0.74, 0.46, 0.69, and 0.75, respectively. These DSCs were lower than those for our modified U-Net model.
Table 2.
Dice similarity coefficient with different sequences as input data for cross-validation.
| Training | Validation | |
|---|---|---|
| b0 | 0.69 (0.64–0.75) | 0.37 (0.29–0.46) |
| b1000 | 0.79 (0.77–0.80) | 0.64 (0.37–0.75) |
| ADC | 0.78 (0.76–0.81) | 0.66 (0.59–0.71) |
| b0 + b1000 + ADC | 0.83 (0.81–0.84) | 0.79 (0.78–0.81) |
Data are presented as the mean and range of five cross-validation models.
ADC apparent diffusion coefficient map, DSC dice similarity coefficient.
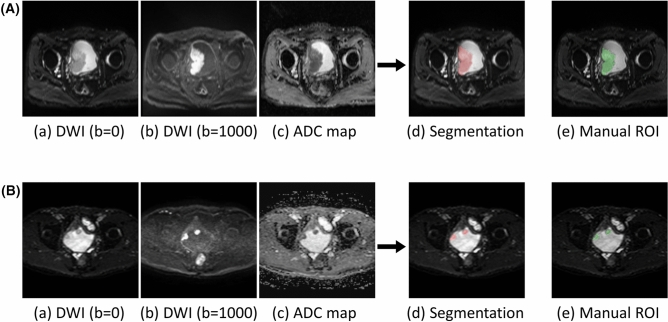
The median DSC of the final model with multi-sequence images for the test dataset was 0.81 (interquartile range, 0.70–0.88). Representative cases of automatic segmentation for the test dataset are presented in Fig. 4.
Figure 4.
Two representative cases of automatic segmentation of bladder cancer in the test dataset (case 1 (A); case 2 (B)). (a) Diffusion weighted image with b = 0 s/mm2, (b) diffusion weighted image with b = 1000 s/mm2, (c) apparent diffusion coefficient map, (d) results of automatic segmentation overlayed on diffusion weighted image with b = 0 s/mm2, (e) manual region of interest for the reference standard. The large tumor was almost perfectly segmented in case 1 (Dice similarity coefficient = 0.95), and the two distant tumors were well segmented in case 2 (Dice similarity coefficient = 0.82).
Reproducibility of radiomics features
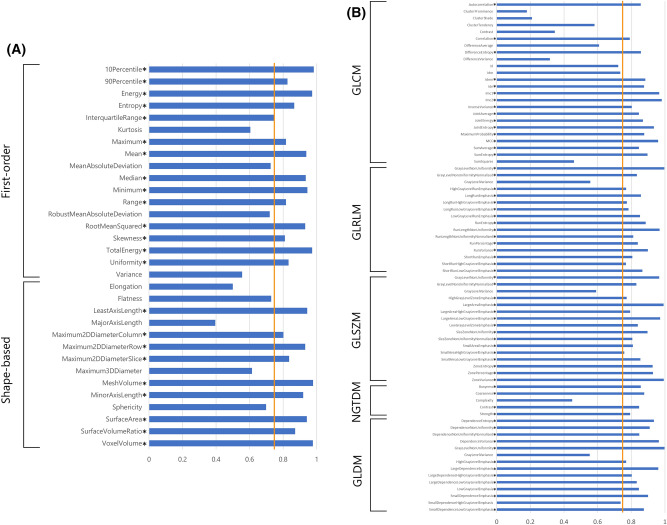
The ICC values of the radiomics features derived from manually and automatically segmented BC are presented in Fig. 5. Good to excellent reproducibility was confirmed (ICC, 0.75–0.98) regarding first-order and shape-based features except for kurtosis, mean absolute deviation, robust mean absolute deviation, variance, elongation, flatness, major axis length, maximum 3D diameter, and sphericity (ICC, 0.39–0.73). Among the higher-order features, 61/75 features demonstrated good to excellent reproducibility (ICC, 0.76–1.00). All features with good to excellent ICC returned a significant p-value < 0.05 for the ICC analysis. The ICC values for each feature group are summarized in Table 3. All of the median ICCs of the radiomics feature groups showed good reliability (ICC, 0.83–0.86).
Figure 5.
Intraclass correlation coefficient (ICC) values for radiomics features obtained by manual and automatic segmentation (first-order and shape-based features (A); high-order features (B)). Asterisks indicate the features with good to excellent ICC values (ICC > 0.75; orange line). GLCM gray-level co-occurrence matrix, GLRLM gray-level run length matrix, GLSZM gray-level size zone matrix, NGTDM neighboring gray tone difference matrix, GLDM gray-level dependence matrix.
Table 3.
Median and interquartile range for the intraclass correlation coefficient (ICC) values per feature group.
| Features group | Number of features | Median ICC | Interquartile range |
|---|---|---|---|
| First-order features | 18 | 0.83 | 0.77–0.94 |
| Shape-based features | 14 | 0.85 | 0.71–0.94 |
| GLCM | 24 | 0.85 | 0.60–0.88 |
| GLRLM | 16 | 0.84 | 0.78–0.87 |
| GLSZM | 16 | 0.85 | 0.80–0.94 |
| NGTDM | 5 | 0.85 | 0.79–0.86 |
| GLDM | 14 | 0.86 | 0.81–0.93 |
GLCM gray-level co-occurrence matrix, GLRLM gray-level run length matrix, GLSZM gray-level size zone matrix, NGTDM neighboring gray tone difference matrix, GLDM gray-level dependence matrix.
Discussion
In this two-center study, we developed the automatic segmentation model of BC on multi-vendor MR images using a CNN. The model with multi-sequence MR images exhibited higher segmentation performance compared to that of the single-sequence models. Our final model demonstrated high segmentation performance with a median DSC of 0.81 for the test dataset. Radiomics features calculated from the automatic segmentation results by our model showed high reproducibility in terms of first-order, shape-based, and higher-order features.
Several single-center studies have performed automatic segmentation of BC, and some of these studies reported DSCs higher than 0.815–17. However, machine learning studies conducted at a single site on a small number of cases carry the risk of generalization performance degradation due to overfitting27. To resolve this problem, we conducted the first study of automatic segmentation of BC with multi-vendor MR scanners at two institutes with the largest number of cases to date. This study design increased the generalization performance of our segmentation model because it handled MR images of diverse cohorts of patients with BC using diverse MR scanners and parameters. Despite the heterogeneity of images collected in our study, our U-net model achieved a median DSC of 0.81 for the test dataset. In addition, our model outperformed previously reported segmentation models, including the original U-Net. These results suggest that our U-net model can be applied to clinical practice and large-scale research using a radiomics approach.
This study also reported the effects of differences in input images on segmentation performance. Our U-Net model with multi-sequence MR images exhibited superior performance compared to that with single-sequence images. A similar study has been conducted on cervical cancer28. In accordance with our findings, the model with multi-sequence images of b0 images, b1000 images, and ADC maps exhibited the highest DSC of 0.82.
Most of the radiomics features derived from manually and automatically segmented BC exhibited good to excellent reproducibility for first-order, shape-based, and high-order features. To date, the robustness of radiomics features of BC has not been reported, but several studies on cervical and endometrial cancers exist28,29. A previous study on uterine cervical cancer reported poor reliability of features derived from manually and automatically segmented tumor except for first-order features28. A study on uterine endometrial cancer presented good to excellent reliability for many of the features but poor reliability for GLCM, GLRLM, and NGTDM29. Although direct comparison of BC results with those of other organs is difficult, radiomics features obtained from our U-Net model yielded better reliability compared to those in previous reports. Accordingly, our U-Net model may facilitate radiomics studies with a large number of BC cases.
There were several limitations in this study. First, we focused on DWIs and did not deal with T2WIs or dynamic contrast-enhanced T1WIs. One reason for this was bladder deformation associated with fluctuating urine volume in the bladder during scanning. Although using other sequences including T2WIs as input data with deformable image registration may have improved segmentation performance, there was a risk of misregistration leading to diminished accuracy of automatic segmentation. Our U-Net-based model performed sufficiently accurate segmentation solely using DWIs and ADC maps possibly because b0 images partially contained the information of T2WIs. Second, the cases from the two institutes were mixed and divided into training and test datasets, and external validation was not performed. Validation studies including BC cases from other institutions are warranted to demonstrate the robustness of our segmentation model. Third, the sample size of the test dataset might be small for evaluating ICC with sufficient statistical power. However, this was unavoidable, given the overall number of patients included in this study.
In conclusion, we developed a U-Net model that could accurately segment BC on MRI obtained with two-center, multi-vendor scanners. First-order, shape-based, and higher-order radiomics features extracted from the automatic segmentation results exhibited high reproducibility.
Supplementary Information
Acknowledgements
The authors would like to thank Sachiko Minamiguchi for her support regarding the pathological findings.
Author contributions
Y.M., Y.K., and M.N.: Conceptualization, Methodology, Software. A.K., S.O., Y.H., N.N., and A.F.: Data Curation, Interpretation. H.O., K.M., and T.K.: Resources. Y.N.: Supervision. All authors reviewed the manuscript.
Funding
This work was supported by Bayer research grant of the Japanese Radiological Society and JSPS KAKENHI (Grant Number: JP20K16780).
Data availability
The datasets generated during and/or analysed during the current study are available from the corresponding author on reasonable request.
Competing interests
The authors declare no competing interests.
Footnotes
Publisher's note
Springer Nature remains neutral with regard to jurisdictional claims in published maps and institutional affiliations.
Supplementary Information
The online version contains supplementary material available at 10.1038/s41598-023-27883-y.
References
- 1.Sung H, et al. Global cancer Statistics 2020: GLOBOCAN estimates of incidence and mortality worldwide for 36 cancers in 185 countries. CA Cancer J. Clin. 2021;71:209–249. doi: 10.3322/caac.21660. [DOI] [PubMed] [Google Scholar]
- 2.Kamat AM, et al. Bladder cancer. Lancet. 2016;388:2796–2810. doi: 10.1016/S0140-6736(16)30512-8. [DOI] [PubMed] [Google Scholar]
- 3.Mariappan P, Zachou A, Grigor KM, Edinburgh Uro-Oncology Group Detrusor muscle in the first, apparently complete transurethral resection of bladder tumour specimen is a surrogate marker of resection quality, predicts risk of early recurrence, and is dependent on operator experience. Eur. Urol. 2010;57:843–849. doi: 10.1016/j.eururo.2009.05.047. [DOI] [PubMed] [Google Scholar]
- 4.Panebianco V, et al. Multiparametric magnetic resonance imaging for bladder cancer: Development of VI-RADS (Vesical Imaging-Reporting and Data System) Eur. Urol. 2018;74:294–306. doi: 10.1016/j.eururo.2018.04.029. [DOI] [PMC free article] [PubMed] [Google Scholar]
- 5.Witjes JA, et al. European Association of Urology guidelines on muscle-invasive and metastatic bladder cancer: Summary of the 2020 guidelines. Eur. Urol. 2021;79:82–104. doi: 10.1016/j.eururo.2020.03.055. [DOI] [PubMed] [Google Scholar]
- 6.Zheng Z, et al. Integrating multiparametric MRI radiomics features and the Vesical Imaging-Reporting and Data System (VI-RADS) for bladder cancer grading. Abdom. Radiol. (NY) 2021;46:4311–4323. doi: 10.1007/s00261-021-03108-6. [DOI] [PubMed] [Google Scholar]
- 7.Xu S, et al. Combining DWI radiomics features with transurethral resection promotes the differentiation between muscle-invasive bladder cancer and non-muscle-invasive bladder cancer. Eur. Radiol. 2020;30:1804–1812. doi: 10.1007/s00330-019-06484-2. [DOI] [PubMed] [Google Scholar]
- 8.Wang H, et al. Elaboration of a multisequence MRI-based radiomics signature for the preoperative prediction of the muscle-invasive status of bladder cancer: A double-center study. Eur. Radiol. 2020;30:4816–4827. doi: 10.1007/s00330-020-06796-8. [DOI] [PubMed] [Google Scholar]
- 9.Zheng J, et al. Development of a noninvasive tool to preoperatively evaluate the muscular invasiveness of bladder cancer using a radiomics approach. Cancer. 2019;125:4388–4398. doi: 10.1002/cncr.32490. [DOI] [PubMed] [Google Scholar]
- 10.Xu X, et al. Quantitative identification of nonmuscle-invasive and muscle-invasive bladder carcinomas: A multiparametric MRI Radiomics analysis. J. Magn. Reson. Imaging. 2019;49:1489–1498. doi: 10.1002/jmri.26327. [DOI] [PubMed] [Google Scholar]
- 11.Xiao D, et al. 3D detection and extraction of bladder tumors via MR virtual cystoscopy. Int. J. Comput. Assist. Radiol. Surg. 2016;11:89–97. doi: 10.1007/s11548-015-1234-x. [DOI] [PubMed] [Google Scholar]
- 12.Ma Z, Jorge RN, Mascarenhas T, Tavares JM. Novel approach to segment the inner and outer boundaries of the bladder wall in T2-weighted magnetic resonance images. Ann. Biomed. Eng. 2011;39:2287–2297. doi: 10.1007/s10439-011-0324-3. [DOI] [PubMed] [Google Scholar]
- 13.Bandyk MG, Gopireddy DR, Lall C, Balaji KC, Dolz J. MRI and CT bladder segmentation from classical to deep learning based approaches: Current limitations and lessons. Comput. Biol. Med. 2021;134:104472. doi: 10.1016/j.compbiomed.2021.104472. [DOI] [PubMed] [Google Scholar]
- 14.Dolz J, et al. Multiregion segmentation of bladder cancer structures in MRI with progressive dilated convolutional networks. Med. Phys. 2018;45:5482–5493. doi: 10.1002/mp.13240. [DOI] [PubMed] [Google Scholar]
- 15.Hammouda, K. et al. A deep learning-based approach for accurate segmentation of bladder wall using MR images. In The 2019 IEEE International Conference on Imaging Systemsand Techniques (IST) 1–6 (IEEE Publications, 2019).
- 16.Liu, J. et al. Bladder cancer multi-class segmentation in MRI with Pyramid-In-Pyramid network. In The 2019 16th International Symposium on Biomedical Imaging (ISBI) 28–31 (IEEE Publications, 2019).
- 17.Hammouda, K. et al. A 3D CNN with a learnable adaptive shape prior for accurate segmentation of bladder wall using MR images. In The 2020 17th International Symposium on Biomedical Imaging (ISBI) 935–938 (IEEE Publications, 2020).
- 18.Liu Y, et al. The invasion depth measurement of bladder cancer using T2-weighted magnetic resonance imaging. Biomed. Eng. Online. 2020;19:92. doi: 10.1186/s12938-020-00834-8. [DOI] [PMC free article] [PubMed] [Google Scholar]
- 19.Ronneberger, O., Fischer, P. & Brox, T. U-net: Convolutional networks for biomedical image segmentation. In The International Conference on Medical Image Computing and Computer-Assisted Intervention Conference 234–241 (Springer, 2015). 10.1007/978-3-319-24574-4_28.
- 20.Babjuk M, et al. European Association of Urology guidelines on non-muscle-invasive bladder cancer (TaT1 and carcinoma in situ)—2019 update. Eur. Urol. 2019;76:639–657. doi: 10.1016/j.eururo.2019.08.016. [DOI] [PubMed] [Google Scholar]
- 21.Oktay, O. et al. Attention U-Net: Learning where to look for the pancreas. Preprint at arXiv:1804.03999 (2018).
- 22.Zhou Z, Siddiquee MMR, Tajbakhsh N, Liang J. UNet++: A nested U-net architecture for medical image segmentation. Deep Learn. Med. Image Anal. Multimodal Learn. Clin. Decis. Support. 2018;11045:3–11. doi: 10.1007/978-3-030-00889-5_1. [DOI] [PMC free article] [PubMed] [Google Scholar]
- 23.Qin X, Zhang Z, Huang C, Dehghan M, Zaiane OR, Jagersand M. U2-Net: Going deeper with nested U-structure for salient object detection. Pattern Recognit. 2020;106:107404. doi: 10.1016/j.patcog.2020.107404. [DOI] [Google Scholar]
- 24.Chen, J. et al. TransUNet: Transformers make strong encoders for medical image segmentation. Preprint at arXiv:2102.04306 (2021).
- 25.Shrout PE, Fleiss JL. Intraclass correlations: Uses in assessing rater reliability. Psychol. Bull. 1979;86:420–428. doi: 10.1037//0033-2909.86.2.420. [DOI] [PubMed] [Google Scholar]
- 26.Koo TK, Li MY. A guideline of selecting and reporting intraclass correlation coefficients for reliability research. J. Chiropr. Med. 2016;15:155–163. doi: 10.1016/j.jcm.2016.02.012. [DOI] [PMC free article] [PubMed] [Google Scholar]
- 27.Cheng PM, et al. Deep learning: An update for radiologists. Radiographics. 2021;41:1427–1445. doi: 10.1148/rg.2021200210. [DOI] [PubMed] [Google Scholar]
- 28.Lin YC, et al. Deep learning for fully automated tumor segmentation and extraction of magnetic resonance radiomics features in cervical cancer. Eur. Radiol. 2020;30:1297–1305. doi: 10.1007/s00330-019-06467-3. [DOI] [PubMed] [Google Scholar]
- 29.Kurata Y, et al. Automatic segmentation of uterine endometrial cancer on multi-sequence MRI using a convolutional neural network. Sci. Rep. 2021;11:14440. doi: 10.1038/s41598-021-93792-7. [DOI] [PMC free article] [PubMed] [Google Scholar]
Associated Data
This section collects any data citations, data availability statements, or supplementary materials included in this article.
Supplementary Materials
Data Availability Statement
The datasets generated during and/or analysed during the current study are available from the corresponding author on reasonable request.


