

Abstract
Introduction/Purpose:
Physical activity may influence chronic disease risk, in part, through epigenetic mechanisms. Previous studies have demonstrated that an acute bout of physical activity can influence DNA methylation status. Few studies have explored the relationship between habitual, accelerometer-measured physical activity or sedentary time with epigenetic markers of aging.
Methods:
We used linear regression to examine cross-sectional associations of accelerometer-measured physical activity and sedentary time with extrinsic and intrinsic epigenetic age acceleration models (EEAA and IEAA) and GrimAge measured from blood samples from Framingham Heart Study participants with accelerometry and DNA methylation data (n=2435; mean age 54.9±14.3, 46.0% men). Residuals of Hannum-, Horvath-, and GrimAge-predicted epigenetic age were calculated by regressing epigenetic age on chronological age. We took into account blood cell composition for EEAA, IEAA, and AdjGrimAge. Moderate to vigorous physical activity (MVPA) was log-transformed to normalize its distribution. Adjustment models accounted for family structure, age, sex, smoking status, cohort-laboratory indicator, and accelerometer wear time. We additionally explored adjustment for body mass index (BMI).
Results:
Walking 1500 more steps/day or spending 3 fewer hours sedentary was associated with >10 months lower GrimAge biological age (or ~1 month lower AdjGrimAge, after adjusting for blood cells, p<0.05). Every 5 min/day more MVPA was associated with 19-79 days lower GrimAge (4-23 days lower using EEAA or AdjGrimAge, p<0.01). Adjusting for BMI attenuated these results, but all statistically significant associations with AdjGrimAge remained.
Conclusions:
Greater habitual physical activity and lower sedentary time were associated with lower epigenetic age, which was partially explained by BMI. Further research should explore whether changes in physical activity influence methylation status and whether those modifications influence chronic disease risk.
Keywords: EXERCISE, DNA METHYLATION, EPIGENETIC CLOCK, EPIDEMIOLOGY, BIOLOGICAL AGE
INTRODUCTION
Physical inactivity and sedentary behavior are determinants of many chronic age-related diseases(1) and are associated with increased mortality risk.(2) There is strong evidence demonstrating the effect of physical inactivity on metabolic health, target organ damage, and functional decline, but the molecular basis for these effects is not fully understood. It is clear that a bout of physical activity affects gene expression, activating several signaling cascades with downstream effects on inflammation and aging. Physical inactivity has also been associated with shorter leukocyte telomere length,(3, 4) a marker of biological aging that is associated with mortality.(5, 6) One way in which physical inactivity may affect gene expression and telomere length, contributing to downstream effects, is through influencing DNA methylation patterns, one form of epigenetic modification.(7)
Several epigenetic patterns have been identified that are associated with chronological and biological age, using weighted averages of DNA methylation levels at specific CpGs.(8–10) The Hannum- and Horvath-methylation models are two examples of methylation patterns used to predict age (i.e. epigenetic clocks) that we focus on in this investigation.(11–13) Methylation status at these CpG sites has been reported to relate to chronic diseases including metabolic syndrome,(14) heart disease,(15) stroke,(16) cancer,(17) and mortality, even after adjusting for age and other traditional risk factors.(11, 18) Second-generation epigenetic clocks, like GrimAge, were developed using DNA methylation correlates of mortality and other markers of health, rather than just chronological age.(19) In recent publications, it appears that GrimAge may outperform other epigenetic clocks in prediction of clinical phenotypes and mortality.(20)
Previous studies have shown that acute exercise can confer acute epigenetic changes;(21) and other observational studies have demonstrated that individuals who are habitually physically active have methylation signatures on a number of DNA CpG sites in both blood cells and in skeletal muscle that differ from inactive individuals.(22–24) Few studies have explored the relationship between physical activity and epigenetic patterns of biological aging, with no consistent associations emerging after adjusting for confounding factors, and most studies using self-reported measures of physical activity.(23–29) Therefore, this relationship required more exploration in a large study, using objective assessment of physical activity. In the present investigation, we sought to identify whether physical activity and sedentary time, measured objectively with accelerometry, were associated with Hannum-, Horvath-, and GrimAge-predicted epigenetic age models in blood samples. We hypothesized that we would observe associations of physical activity measures with the Hannum and GrimAge-predicted age models because these models have been demonstrated to relate to other lifestyle factors.(20, 26)
METHODS
Study Design
The Framingham Heart Study (FHS) is a longitudinal population-based cohort study that began in 1948 to prospectively identify risk factors for cardiovascular disease (CVD).(30) The Framingham Offspring Study began in 1971 and consists of children of the original cohort participants and the spouses of the Offspring.(31) In 2002, the Third Generation cohort was recruited from the children of the Offspring cohort.(32) Participants were eligible for the current investigation if they attended the Third Generation exam 2 (2008-2011, n=3411) or Offspring exam 9 (2011-2014, n=2430) and returned accelerometry data (n=4340), as shown in Figure 1. We excluded 117 participants who returned the accelerometer but did not wear it for ≥10 hours on at least 3 days. An additional 1788 participants were excluded who did not have DNA methylation data from blood samples collected at these exams, leaving a sample size of 2435 participants. Accelerometer devices were worn for the 3-8 days following the participant exam date, unless the participant requested to wear it at a later date. All participants provided written informed consent, and the institutional review board at Boston University Medical Center approved the study protocols.
Figure 1.
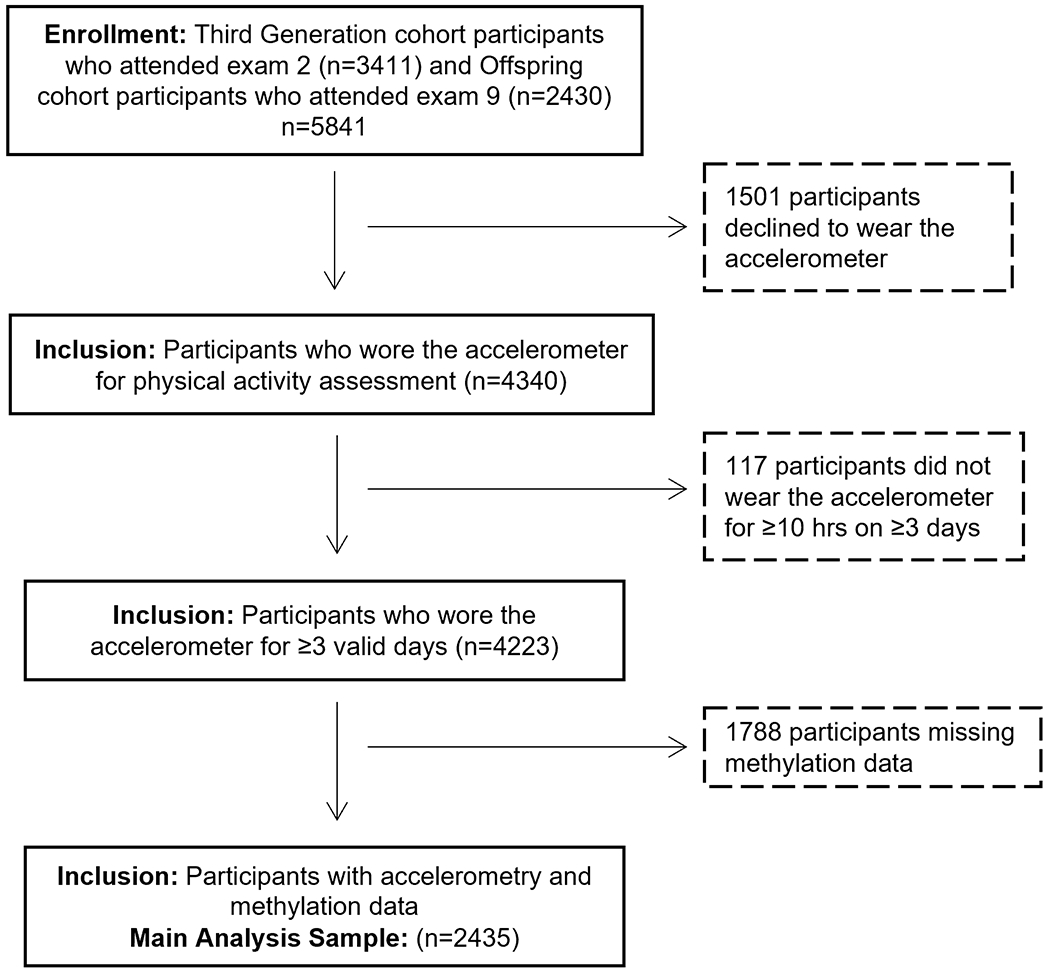
Diagram illustrating derivation of analytic sample used for the main analysis
Physical Activity Assessment
All participants were asked to wear an omnidirectional accelerometer (Actical model no. 198-0200-00; Philips Respironics) on the hip for 8 days for 24 hours/day for Third Generation and only for all waking hours for Offspring, except when bathing. The wearing instructions were altered for the Offspring cohort due to difficulty distinguishing between waking and sleeping hours in Third Generation data. This accelerometer records signals within 0.5-3 Hz and accelerations/decelerations within 0.05-2 g. Recorded signals were grouped into “counts” or “steps” at 30 second intervals (epochs). Data were analyzed at the FHS using customized software (Kinesoft, version 3.3.63) and a predefined protocol for quality control.(33) Data were processed using a SAS program developed by Colley et al.(34) Non-wear time was removed from data processing using the Choi algorithm.(35) Then we created a sliding window of 6 hours in each 24 hour period (including the lowest accumulated number of counts) to remove potential sleep time not removed using Choi algorithm. An adherent (valid) day of Actical wear was defined as at least 10 hours of wear time (and at most 18 hours due to removal of the 6 hour window) on at least 3 days.
Each minute of wear time was classified using the following intensity cutpoints: moderate to vigorous physical activity (MVPA) was defined at a threshold of ≥1535 counts/minute;(34) sedentary time was defined as any minute with ≤100 counts/minute(36) and standardized to wear time by dividing sedentary time/wear time and multiplying by 18 hours. Steps accumulated each day were averaged over all valid days and Winsorized at 20,000 steps/day to address 19 outliers.
DNA Methylation and Age Acceleration Residuals
Participants were selected from the Third Generation exam 2 to have DNA methylation quantified by choosing individuals whose parent(s) had whole genome sequencing and DNA methylation quantified at a previous FHS exam (aspects that were not used for the current study). These samples were process by the Illumina laboratory (San Diego, CA). At a later date, remaining Third Generation exam 2 participant blood samples were processed at the University of Southern California (USC), along with a random selection of blood samples from participants who attended Offspring exam 9. We had samples from two cohorts tested in two different laboratories, making three cohort-laboratory combinations that were adjusted for in analysis, described later.
To assess DNA methylation in each laboratory, first, peripheral blood samples were collected and DNA was extracted from the buffy coat. DNA samples were bisulphite converted and hybridized to Human-Methylation450 BeadChips (Illumina Inc, San Diego, CA). Quantification was performed by the Biconductor minfi package with background correction at each laboratory to generate methylation beta values. Lab-specific normalization and quality control procedures were performed on all samples. Samples were excluded if they had missing rate >1%, poor matching to SNP genotypes at control positions, sex mismatch, or outliers from multi-dimensional scaling (MDS). Probes were excluded if missing rate >20%.
Three measures of DNA methylation age (i.e. epigenetic age) were calculated: Hannum-predicted age (based on 71 CpG probes, of which we used 65 that were available), Horvath-predicted age (based on 353 CpG probes, of which we used 334), and GrimAge (based on 1,030 CpG probes, but the actual probe identifiers were unavailable so it is unclear how many were used in our calculation) using the sum of the beta values multiplied by the respective regression coefficients reported previously.(12, 13, 19, 37) These methylation ages were then regressed on their chronologic age at the time of blood collection to create age acceleration residuals, “Hannum-, Horvath-, and GrimAge-predicted age residuals.” We additionally incorporated age-related changes in blood cells to create additional epigenetic-predicted age models, described below. Calculations of Hannum age, Horvath age, GrimAge age, and blood cell counts, were performed online at https://dnamage.genetics.ucla.edu/home.(11, 12)
Even after regressing on chronological age, these epigenetic models are associated with age-related conditions and blood cell composition. Therefore, we also created additional epigenetic-predicted age models to account for these blood cell differences, as others have previously reported. We calculated the Hannum model of “extrinsic epigenetic aging acceleration” (EEAA)(11) by combining the Hannum-predicted age residuals with the counts for naïve cytotoxic T cells, exhausted cytotoxic T cells, and plasmablasts to create an enhanced Hannum model (more highly predictive of extrinsic factors because the distribution of those blood cells is sensitive to the environment and lifestyle factors).(26) In contrast, the Horvath model of “intrinsic epigenetic aging acceleration” (IEAA) adjusts for (rather than incorporating) age-related changes in blood cell composition. Therefore, IEAA is, instead, under tighter genetic control and may be more stable in response to extrinsic forces in the environment or lifestyle.(11, 26, 28, 38, 39) IEAA adjusts for blood cell counts including CD8 T cells, CD4 T cells, plasma B cells, natural killer cells, monocytes, and granulocytes, which are imputed from the methylation data.(39) We also performed an epigenetic-predicted age model for GrimAge, using the intrinsic model (AdjGrimAge), adjusting for the same white blood cells as in IEAA to similarly account for potential differences in these cells due to age and other risk factors.
As described above, our samples were processed in three different cohort-laboratory combinations, with each lab having their own technical variables. These technical variables, different cohorts, and laboratories may be confounders since they are associated with the methylation level and epigenetic age. We, therefore, fit cohort-laboratory-specific models to minimize potential confounding by the technical variables specific to our study when deriving Hannum-, Horvath-, and GrimAge-predicted age residuals”, EEAA, IEAA, and AdjGrimAge. Briefly, we fit linear regression models (regressing epigenetic-predicted age on chronological age) separately for the three cohort-laboratory combinations, adjusting for technical variables that were different across laboratories. Chip ID, row ID and column ID were adjusted for in samples run at the Illumina lab, whereas, for the USC lab, sample container ID and analyte isolation year were the available variables we adjusted for. Then we adjusted for the cohort (dichotomous) and laboratory (dichotomous) along with other covariates in our models, as described below.
Statistical Analysis
We used multivariable linear mixed effects regression models to relate accelerometer variables to predicted age residuals, accounting for family structure through specifying within family correlation as twice the kinship matrix (to account for the 783 parent-offspring pairs in our sample). The analyses were performed using the lmekin function in coxme package in R (https://cran.r-project.org/web/packages/coxme/index.html) and p<0.05 was considered statistically significant. MVPA was log transformed as log(MVPA+0.1) to reduce skewness of the distribution. Sedentary time was presented as a percent of wear time and then multiplied by 18 hours to get “sedentary time in hours, standardized to an 18 hour day” (see further description above). Accelerometer variables (in steps/day, minutes/day, or hours/day) and age residuals (in years) were standardized to the standard deviation of each variable. All models included the following variables: age, sex, smoking status, cohort, laboratory indicator, and wear time (for the steps and MVPA analysis). Smoking status was defined as a current smoker=1 and former or never-smoker=0. Education was left out of models because it had very little impact on effect sizes. We explored additional adjustment for body mass index (BMI) and interactions by cohort and dichotomous age (>/< 60 years) and considered interactions statistically significant at the p=0.05 level.
RESULTS
Our study sample had an average age of 54.9 years and included 46.0% men (Table 1). More than half of participants included in this study graduated from college, and 32.6% performed at least 150 min/week of MVPA, meeting the Physical Activity Guidelines for Americans.(40) On average, our participants had a higher predicted age using the GrimAge epigenetic model (60.8 years). Hannum-, Horvath-, and GrimAge-predicted age were correlated with actual chronological age (r=0.70, r=0.92, r=0.79, respectively, Figure 2). Hannum-predicted age and Horvath-predicted age were also correlated with each other (r=0.710) and each was correlated with GrimAge (r=0.862 and r=0.728, respectively). We created predicted age residuals using the Hannum- Horvath-, and GrimAge-based algorithms to determine whether “biological” (epigenetic age) was higher or lower than chronological age. These predicted age residuals did not correlate with chronological age (r=−0.004, r=0.007, r=0.0005, Figure 3), and had a lower correlation with each other (although still moderate, r=0.442 [Hannum and Horvath], r=0.188 [Hannum and GrimAge], r=0.065 [Horvath and GrimAge). IEAA, EEAA, and AdjGrimAge age residuals did not correlate with chronological age either (r=0.0174, r=−0.0012, r=0.0023, Figure 4), and had a lower correlation with each other (although still moderate, r=0.317 [IEAA and EEAA], r=0.060 [IEAA and AdjGrimAge], r=0.143 [EEAA and AdjGrimAge]).
Table 1.
Demographics of participants (n=2435)
| Variables | Mean ± SD or N(%) |
|---|---|
|
| |
| Age, years | 54.9 ± 14.3 |
|
| |
| Body Mass Index, kg/m2 | 27.9 ± 5.3 |
|
| |
| Education | |
| No High School Degree | 28 (1.1%) |
| High School Degree | 366 (15.1%) |
| Some College | 774 (31.9%) |
| College Graduate | 1258 (51.9%) |
|
| |
| Men | 1121 (46.0%) |
|
| |
| Smoking status | 178 (7.3%) |
|
| |
| Hypertension | 738 (30.4%) |
|
| |
| Diabetes Mellitus | 154 (6.4%) |
|
| |
| Cardiovascular Disease | 176 (7.2%) |
|
| |
| Steps per day | 7275 ± 3781 |
|
| |
| Wear time, hr/day | 15.2 ± 1.5 |
|
| |
| Sedentary time, hr/day | 13.9 ± 1.5 |
|
| |
| MVPA, min/day, Q1; median; Q3 | 4.50; 13.00; 26.17 |
|
| |
| Log(MVPA+0.1), min/day | 2.20 ± 1.54 |
|
| |
| Achieving PA Guidelines (≥150 minutes/week MVPA) | 794 (32.6%) |
|
| |
| Total valid days | 7.2 ± 1.4 |
|
| |
| Hannum age, years | 54.1 ± 10.1 |
|
| |
| Horvath age, years | 56.3 ± 12.0 |
|
| |
| GrimAge, years | 60.8 ± 9.9 |
|
| |
| Hannum age residuals, years | −0.036 ± 3.70 |
|
| |
| Horvath age residuals, years | 0.033 ± 4.36 |
|
| |
| GrimAge residuals, years | −0.21 ± 3.94 |
|
| |
| EEAA, years | −0.11 ± 5.08 |
|
| |
| IEAA, years | 0.04± 4.11 |
|
| |
| AdjGrimAge residuals (after adjusting blood cell counts), years | −0.14 ± 3.56 |
Abbreviations: standard deviation (SD), physical activity (PA), moderate-to-vigorous physical activity (MVPA), extrinsitc epigenetic age acceleration (EEAA), intrinsic epigenetic age acceleration (IEAA)
Figure 2. Scatter plot of chronological age vs. epigenetic-predicted age.
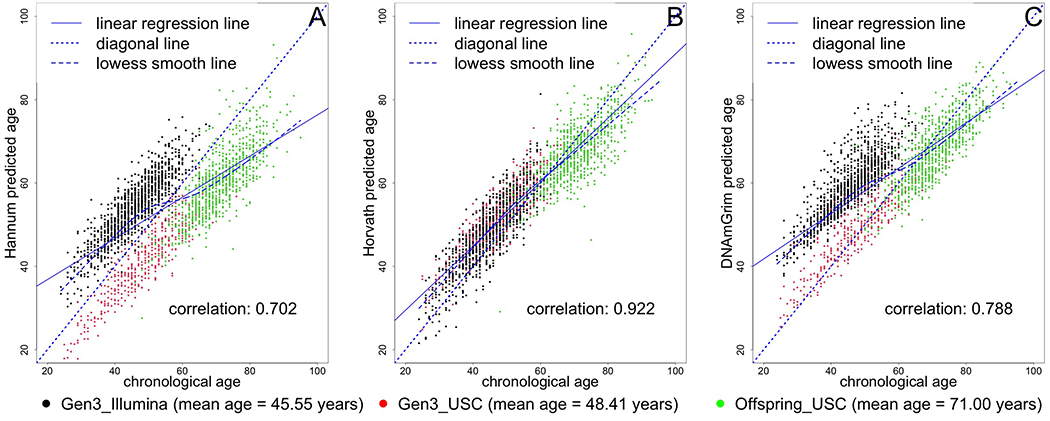
Black circles represent samples from the Gen 3 cohort, run in the Illumina laboratory. Red circles represent samples from the Gen 3 cohort, run at the USC laboratory. Green circles represent samples from the Offspring cohort, run at the USC laboratory.
Figure 3. Scatter plot of chronological age vs. epigenetic age residuals.
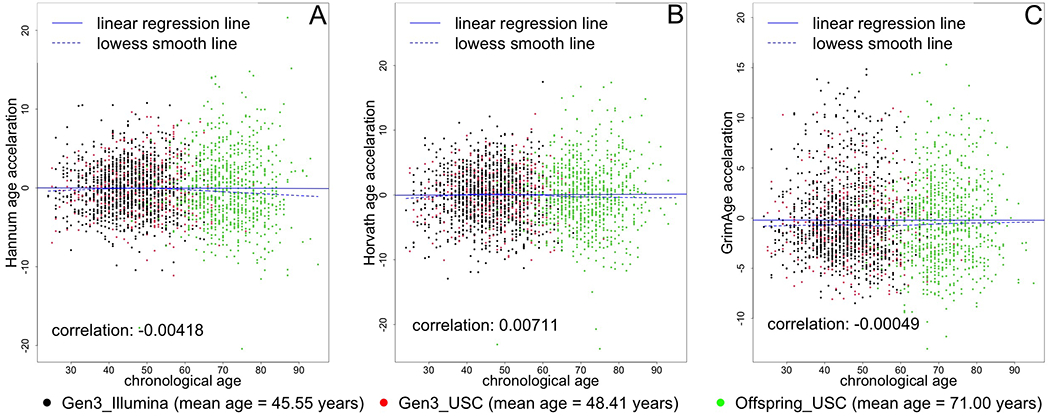
Black circles represent samples from the Gen 3 cohort, run in the Illumina laboratory. Red circles represent samples from the Gen 3 cohort, run at the USC laboratory. Green circles represent samples from the Offspring cohort, run at the USC laboratory.
Figure 4. Scatter plot of chronological age vs. EEAA, IEAA, and AdjGrimAge residuals.
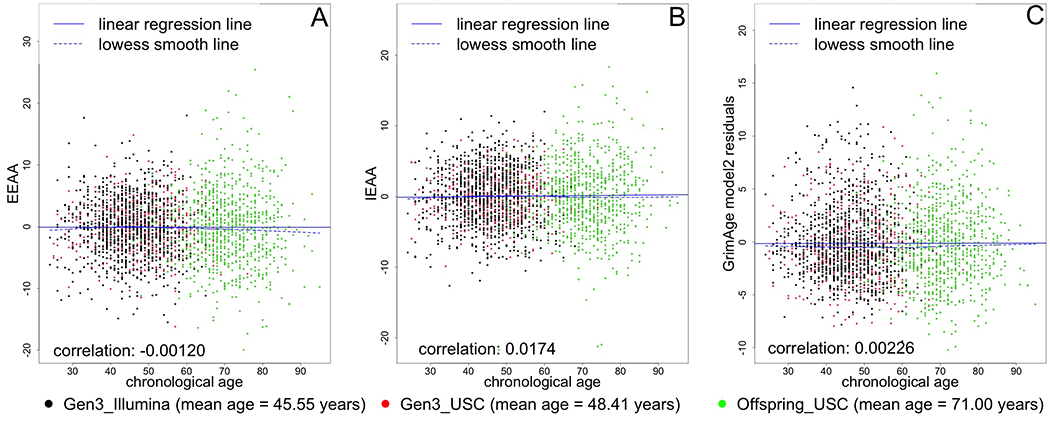
Black circles represent samples from the Gen 3 cohort, run in the Illumina laboratory. Red circles represent samples from the Gen 3 cohort, run at the USC laboratory. Green circles represent samples from the Offspring cohort, run at the USC laboratory.
We observed that individuals who participated in more MVPA had lower EEAA (standardized beta=−0.060; standard error [SE]=0.023; p=0.009), GrimAge (standardized beta=−0.105; SE=0.020; p<0.001), and AdjGrimAge (standardized beta=−0.069; SE=0.020; p<0.001), in models including adjustments for age, sex, smoking status, cohort-laboratory indicator, and accelerometer wear time (Table 2). We standardized both the predictor, log(MVPA+0.1), and the response, age residuals, so that each increase of one standard deviation unit (SDU) of log(MVPA+0.1) was equivalent to −0.060 SDU difference in age residuals. Log(MVPA+0.1) has a standard deviation (SD) of 1.54 and the EEAA has a SD of 5.08, so for every 1.54 minute increase in log(MVPA+0.1), EEAA decreased by 0.06*5.08=0.30 years (and 1 unit increase in log[MVPA+0.1] = −0.195 years EEAA). Since we are using the log scale, we assessed whether the relationship between MVPA and EEAA was non-linear. An increase of 5 min/day in MVPA from the bottom quartile cutoff of 4.5 min/day is a change of [log(4.5+5+0.1) − log(4.5+0.1)] = 0.32, so each increase of 5 min/day is associated with 0.32*0.195=0.062 years or around 23 days lower (younger) biological age. Similarly, from the median of 13 min/day MVPA, an increase of 5 min/day was equivalent to around 10 days lower biological age (log[13+5+0.1]-log[13+0.1]=0.140, then 0.140*0.195=0.027 years). Finally, from the third quartile cutoff of 26.17 min/day, a 5 min/day increase in MVPA was associated with around 6 days lower biological age (log[26.17+5+0.1]−log[26.17+0.1]=0.076, then 0.076*0.195=0.015 years).
Table 2.
Association of physical activity and sedentary time with epigenetic-predicted age residuals
| Epigenetic Age Models | Steps/day | (log) MVPA min/d | Sedentary Time (standardized to 18 h/day) | |||
|---|---|---|---|---|---|---|
| beta (SE) | p | beta (SE) | p | beta (SE) | p | |
| Epigenetic age models using the Hannum methylation sites | ||||||
| Hannum-predicted age residuals | −0.015 (0.021) | 0.470 | −0.037 (0.023) | 0.110 | −0.0012 (0.020) | 0.950 |
| Extrinsic Epigenetic Age Acceleration (EEAA) | −0.020 (0.021) | 0.350 | −0.060 (0.023) | 0.009 | −0.0021 (0.020) | 0.920 |
| Epigenetic age models using the Horvath methylation sites | ||||||
| Horvath-predicted age residuals | −0.041 (0.022) | 0.057 | −0.033 (0.024) | 0.160 | 0.0079 (0.021) | 0.710 |
| Intrinsic Epigenetic Age Acceleration (IEAA) | −0.042 (0.022) | 0.052 | −0.025 (0.024) | 0.280 | 0.011 (0.021) | 0.600 |
| Epigenetic age models using the GrimAge methylation sites | ||||||
| GrimAge-predicted age residuals | −0.067 (0.018) | <0.001 | −0.105 (0.020) | <0.001 | 0.043 (0.018) | 0.015 |
| AdjGrimAge-predicted age residuals | −0.065 (0.019) | <0.001 | −0.069 (0.020) | <0.001 | 0.052 (0.018) | 0.005 |
Abbreviations: Moderate-to-vigorous physical activity (MVPA), standard error (SE). Accelerometer variables (in steps/day, minutes/day, or hours/day) and age residuals (in years) were standardized to the standard deviation of each variable. All adjustment models included the following variables: age, sex, smoking status, cohort, laboratory indicator, and wear time (for the steps and MVPA analysis). We also accounted for family structure through specifying within family correlation as twice the kinship matrix.
Hannum-, Horvath-, and GrimAge-predicted age residuals were calculated by regressing epigenetic-predicted age on chronological age and the cohort-laboratory indicator variables.
Extrinsic Epigenetic Age Acceleration (Hannum age residuals, with additional adjustments) was calculated using residuals of the model: BioAge4HAStatic(an enhanced Hannum_Age, combined with naïve cytotoxic T cells, exhausted cytotoxic T cells, and plasmablasts)~ chronological age +cohort-laboratory indicator variables.
Intrinsic Epigenetic Age Acceleration (Horvath age residuals, with additional adjustments) was calculated using residuals of the model: Horvath_Age~ chronological age +CD8.naive+ CD8pCD28nCD45RAn+PlasmaBlast+Mono+Gran+NK+CD4T +cohort-laboratory indicator variables.
AdjGrimAge-predicted age residuals (GrimAge age residuals with additional adjustments) was calculated using residuals of the model: DNAmGrimAge~ chronological age +CD8.naive+ CD8pCD28nCD45RAn+PlasmaBlast+Mono+Gran+NK+CD4T + cohort-laboratory indicator variables.
Using the same formula described above, a 5 min/day higher MVPA was associated with 19-79 days lower biological age (using GrimAge, depending on whether participants started in Q3 or Q1, respectively). In the AdjGrimAge model, the effect size was attenuated to 4-19 days lower biological age, per 5 min/day increase in MVPA. There were also associations of more steps walked per day with the GrimAge-predicted age residuals (standardized beta=−0.067, SE=0.018; p<0.001, Table 2) and AdjGrimAge (standardized beta=−0.065; SE=0.019; p<0.001). We standardized steps/day and the age residuals, so that each increment of one SDU (3781 steps/day) was equivalent to −0.067 SDU (9.9 years) difference in age residuals (GrimAge). Equivalently, each increment of 1500 steps was associated with (1500/3781 steps SDU) x (−0.067*9.9 years, GrimAge SDU) = −0.26314 years, or 96 days (~3 months) lower “biological” age compared to chronological age (or ~1 month using AdjGrimAge). Three hours more sedentary time was associated with 10.4 months older biological age using GrimAge (or ~1 month using AdjGrimAge).
In Table 3, we observed that additional adjustment for BMI attenuated results. For example, the association of steps walked per days with GrimAge- and AdjGrimAge-predicted age residuals had roughly one-third lower effect size (standardized beta=−0.041; SE=0.018; p=0.023; and standardized beta=−0.046; SE=0.019; p=0.015; respectively) after adjusting for BMI. The associations of MVPA with EEAA and sedentary time with GrimAge were no longer statistically significant (p>0.05). We observed no statistically significant interactions by cohort or age (p>0.05).
Table 3.
Association of physical activity and sedentary time with epigenetic-predicted age residuals, additionally adjusted for body mass index
| Epigenetic Age Models | Steps/day | (log) MVPA min/d | Sedentary Time (standardized to 18 h/day) | |||
|---|---|---|---|---|---|---|
| beta (SE) | p | beta (SE) | p | beta (SE) | p | |
| Epigenetic age models using the Hannum methylation sites | ||||||
| Hannum-predicted age residuals | −0.0044(0.021) | 0.840 | −0.022 (0.023) | 0.340 | −0.0085 (0.020) | 0.680 |
| Extrinsic Epigenetic Age Acceleration (EEAA) | −0.0073(0.021) | 0.730 | −0.044 (0.023) | 0.061 | −0.011 (0.020) | 0.600 |
| Epigenetic age models using the Horvath methylation sites | ||||||
| Horvath-predicted age residuals | −0.036 (0.022) | 0.100 | −0.025 (0.024) | 0.300 | 0.0038 (0.021) | 0.860 |
| Intrinsic Epigenetic Age Acceleration (IEAA) | −0.038 (0.022) | 0.086 | −0.018 (0.024) | 0.450 | 0.0077 (0.021) | 0.720 |
| Epigenetic age models using the GrimAge methylation sites | ||||||
| GrimAge-predicted age residuals | −0.041 (0.018) | 0.023 | −0.069 (0.020) | <0.001 | 0.024 (0.018) | 0.160 |
| GrimAge-predicted age residuals model 2 | −0.046 (0.019) | 0.015 | −0.041 (0.021) | 0.047 | 0.038 (0.018) | 0.039 |
Abbreviations: Moderate-to-vigorous physical activity (MVPA), body mass index (BMI), standard error (SE). Accelerometer variables (in steps/day, minutes/day, or hours/day) and age residuals (in years) were standardized to the standard deviation of each variable. All adjustment models included the following variables: age, sex, smoking status, cohort, laboratory indicator, wear time (for the steps and MVPA analysis), and BMI. We also accounted for family structure through specifying within family correlation as twice the kinship matrix.
Hannum-, Horvath-, and GrimAge-predicted age residuals were calculated by regressing epigenetic-predicted age on chronological age and the cohort-laboratory indicator variables.
Extrinsic Epigenetic Age Acceleration (Hannum age residuals, with additional adjustments) was calculated using residuals of the model: BioAge4HAStatic(an enhanced Hannum_Age, combined with naïve cytotoxic T cells, exhausted cytotoxic T cells, and plasmablasts)~ chronological age +cohort-laboratory indicator variables.
Intrinsic Epigenetic Age Acceleration (Horvath age residuals, with additional adjustments) was calculated using residuals of the model: Horvath_Age~ chronological age +CD8.naive+ CD8pCD28nCD45RAn+PlasmaBlast+Mono+ Gran+NK+CD4T+cohort-laboratory indicator variables.
AdjGrimAge-predicted age residuals (GrimAge age residuals with additional adjustments) was calculated using residuals of the model: DNAmGrimAge~ chronological age +CD8.naive+ CD8pCD28nCD45RAn+PlasmaBlast+Mono+ Gran+NK+CD4T + cohort-laboratory indicator variables.
DISCUSSION
In our investigation, we observed that walking 1500 more steps per day or spending 3 fewer hours sedentary was associated with roughly 1 month lower biological age, using AdjGrimAge, in multivariable models accounting for chronological age and other covariates, including white blood cell counts. Performing 5 minutes more MVPA/day was also associated with a range of 4-23 days lower predicted biological age using the EEAA and AdjGrimAge models. Previous research has suggested that the Hannum model of predicted age (used to calculate EEAA) may be more sensitive to the environment and lifestyle, compared to the Horvath model, which is under genetic control and may be more stable in response to extrinsic forces.(26, 28, 38) GrimAge and AdjGrimAge appear to outperform both models in previous studies, with more consistently reported associations with physical activity.(20, 29) It was interesting to observe that the size of the association of MVPA with epigenetic age was larger, and became statistically significant, only when also incorporating age related blood cells counts in the EEAA model, rather than the strict Hannum model of epigenetic age. In previous studies, smoking status, BMI and education were other factors that have been associated with epigenetic clocks,(29) so we explored adjustment for these factors. Smoking status was adjusted for in the main adjustment model along with other covariates, but education was left out of the adjustment model because exploration revealed that adjustment for education did not influence effect sizes substantially. In a secondary model, adjustment for BMI attenuated our statistically significant results. It is likely that BMI partially mediates the associations we observed of physical inactivity and sedentary time with epigenetic aging.
In a recent systematic review, available data demonstrated that many environmental factors were associated with the Hannum, Horvath, and GrimAge epigenetic age models.(29) But only GrimAge was consistently linked with physical activity.(20, 29) Most previous studies examining the association of physical activity with Hannum, Horvath, or GrimAge predicted age models in adults used self-reported physical activity.(20, 26–29) Just one study that we identified, by Gale, et al., used accelerometers to measure physical activity and sedentary time in relation to epigenetic aging, but it was a relatively small cohort (n=248) of participants who were all aged 79 years old at the time of the exam.(25) Gale, et al. reported that the number of steps walked per day was associated with lower EEAA (using the Hannum model of epigenetic age). These results were borderline significant, with some indication that they may be confounded by comorbidities in these older adults. There were no associations of sedentary time with either Hannum or Horvath models, which was similar to our findings, and the authors of that previous study did not investigate any associations with MVPA. It is unclear why our results were slightly different in terms of the physical activity intensity and epigenetic markers that showed associations compared to the study by Gale et al. in older adults, though population characteristics may partially explain these differences. Our observed association of objectively-measured physical activity and sedentary time with GrimAge is a novel result that we have not seen tested in other observational studies of adults.
The Hannum-predicted model of epigenetic aging was created using methylation status on CpGs that lay within or near genes that contribute to oxidative stress, DNA damage, metabolic dysfunction, and diseases like cancer and Alzheimer’s disease.(13) GrimAge was created by regressing time-to-death on epigenetic surrogates of smoking pack-years (which causes oxidative stress) and plasma proteins that are associated with morbidity and mortality.(19) Evidence has shown that both the Hannum and GrimAge models are negatively associated with circulating antioxidants present in many fruits and vegetables, called beta-carotenoids,(19, 26) further suggesting sensitivity of the Hannum and GrimAge models to the redox environment. Exercise is complicated because it acutely increases oxidative stress and inflammation. There are epigenetic changes (methylation or demethylation) that occur acutely in response to a bout of exercise that may be related to increases in oxidative stress.(21) But it is unclear whether epigenetic patterns associated with habitual physical activity (measured by accelerometers) reflect acute changes in DNA methylation or rather reflect part of the adaptive response to chronic bouts of physical activity over time, which stimulates an endogenous anti-inflammatory response, mitochondrial biogenesis, and skeletal muscle hypertrophy.(41, 42) The effects of exercise on DNA methylation patterns may also vary with the timing, dose, and intensity of the activity, as we observed different methylation patterns that related to MVPA compared to those that related to the volume of physical activity (steps/day) or sedentary time.
In studies using epigenome-wide approaches to explore the association of physical activity with DNA methylation, a number of CpG sites were identified on which methylation status was associated with physical activity or sedentary time.(22–24) The challenge is that most of these studies also used self-reported physical activity and an approximation of sedentary time or specific type of sedentary time (i.e. self-reported television viewing time), instead of the objective measure used in our study. Interestingly, time spent viewing television was predictive of methylation status on a number of CpG sites that were separate from sites linked to self-reported physical activity.(23) Because few epigenetic studies have focused on sedentary time, it was an important aspect of our investigation, as a potentially separate epidemiological construct from physical activity.(43) From spaceflight studies and studies that imposed prolonged sedentary behavior or bedrest, we know that prolonged sedentary behavior promotes oxidative stress and metabolic dysfunction.(44–47) In our investigation, similar to previous reports, we did not observe an association between sedentary time and IEAA or EEAA, but we did observe an association with GrimAge, with and without adjustment for white blood cells.
Strengths and Limitations
We conducted this investigation using data from a large cohort that measured physical activity and sedentary time objectively, using accelerometers. This is a major strength because most previous studies have used self-reported measures of physical activity. One limitation is that we do not have data regarding the acute physical activity profile (i.e., whether participants were active in close proximity to the blood draw for assessment of DNA methylation). We also measured epigenetic aging from blood samples, which may not reflect epigenetic profiles in tissue. Our analyses were also cross-sectional, so we are unable to assess causation. We included many potential confounders in adjustment models, but it is likely that residual confounding may play a role in the associations observed, such as the fact that individuals with better health may be more likely to participate in higher levels of physical activity. Furthermore, the homogeneous nature of our FHS cohort makes the generalizability of our results weaker and, therefore, our results require replication in more diverse populations. We focused on three methylation clocks in our current investigation in order to give these associations a detailed exploration. One other clock we considered exploring was DunedinPACE,(48) but we did not have a sufficient number of probes to calculate it. Future studies can explore different methylation patterns or sites that may be more closely associated with habitual physical activity.
It is also important to discuss the processes used to minimize any effects of our differences in methods between cohorts. One important procedure we employed was to remove a 6 hour block of potential accelerometer wear time from every 24 hours to limit wear time to a maximum of 18 hours/day. Therefore, whether participants wore the monitor during sleep, or not, their sleep period should be removed from processing. Large differences in wear time could have influenced sedentary time because it is reported as a proportion of wear time. On average, sedentary time makes up 13.6 hours out of the total potential 18 hours of wear time, while MVPA only takes up 13 min/day. Any effects of remaining differences in sedentary time between cohorts (as well as other differences between cohorts, most significantly the older age of Offspring cohort participants) was addressed by adjusting for the cohort-laboratory indicator variable in all analyses. Finally, despite our large cohort study, many of the associations we observed had very small effect sizes, and therefore, we may not have had power to detect statistical significance for all analyses. It is not surprising that previous smaller studies have not observed similar results as we reported.
CONCLUSIONS
In the current study, we provide evidence to suggest that habitual physical activity and sedentary time were associated with DNA methylation status on markers associated with mortality and older age. BMI only partially explains these associations. Further research could explore whether these and other markers of methylation status can be modified by changes in lifestyle habits and whether those modifications to methylation status confer influence on disease risk.
Acknowledgements
This investigation was supported by the Framingham Heart Study’s National Heart, Lung and Blood Institute contracts (N01-HC25195, HHSN268201500001I, 75N92019D00031) with additional support from the following National Institutes of Health grants (R01-AG047645, R01-HL131029, R01-HL36266, R01-AG054076, RF1-AG059421, R01-NS017950, U01-AG052409, P30-AG066546), the Alzheimer’s Association (2018-AARG-591645) and American Heart Association Awards (15GPSGC24800006 and 16MCPRP30310001). Dr. Vasan is supported in part by the Evans Medical foundation and the Jay and Louis Coffman Endowment, Department of Medicine, Boston University School of Medicine. Measurement of DNA methylation used in this study was funded by the Division of Intramural Research, National Heart, Lung, and Blood Institute (Dr. Levy, PI) and an NIH Director’s Award (Dr. Levy, PI).
Conflict of Interest
Dr. Spartano received funding from Novo Nordisk for an investigator-initiated research grant unrelated to the current paper. The results of the study are presented clearly, honestly, and without fabrication, falsification, or inappropriate data manipulation. The results of the present study do not constitute endorsement by the American College of Sports Medicine.
REFERENCES
- 1.Sallam N, Laher I. Exercise modulates oxidative stress and inflammation in aging and cardiovascular diseases. Oxid Med Cell Longev. 2016;2016:7239639. [DOI] [PMC free article] [PubMed] [Google Scholar]
- 2.Ekelund U, Tarp J, Steene-Johannessen J, et al. Dose-response associations between accelerometry measured physical activity and sedentary time and all cause mortality: systematic review and harmonised meta-analysis. BMJ. 2019;366:l4570. [DOI] [PMC free article] [PubMed] [Google Scholar]
- 3.Latifovic L, Peacock SD, Massey TE, King WD. The influence of alcohol consumption, cigarette smoking, and physical activity on leukocyte telomere length. Cancer Epidemiol Biomarkers Prev. 2016;25(2):374–80. [DOI] [PubMed] [Google Scholar]
- 4.Cherkas LF, Hunkin JL, Kato BS, et al. The association between physical activity in leisure time and leukocyte telomere length. Arch Intern Med. 2008;168(2):154–8. [DOI] [PubMed] [Google Scholar]
- 5.Kimura M, Hjelmborg JV, Gardner JP, et al. Telomere length and mortality: a study of leukocytes in elderly Danish twins. Am J Epidemiol. 2008;167(7):799–806. [DOI] [PMC free article] [PubMed] [Google Scholar]
- 6.Wang Q, Zhan Y, Pedersen NL, Fang F, Hägg S. Telomere length and all-cause mortality: a meta-analysis. Ageing Res Rev. 2018;48:11–20. [DOI] [PubMed] [Google Scholar]
- 7.Buxton JL, Suderman M, Pappas JJ, et al. Human leukocyte telomere length is associated with DNA methylation levels in multiple subtelomeric and imprinted loci. Sci Rep. 2014;4:4954. [DOI] [PMC free article] [PubMed] [Google Scholar]
- 8.Bocklandt S, Lin W, Sehl ME, et al. Epigenetic predictor of age. PLoS One. 2011;6(6):e14821. [DOI] [PMC free article] [PubMed] [Google Scholar]
- 9.Garagnani P, Bacalini MG, Pirazzini C, et al. Methylation of ELOVL2 gene as a new epigenetic marker of age. Aging Cell. 2012;11(6):1132–4. [DOI] [PubMed] [Google Scholar]
- 10.Lin Q, Weidner CI, Costa IG, et al. DNA methylation levels at individual age-associated CpG sites can be indicative for life expectancy. Aging (Albany NY). 2016;8(2):394–401. [DOI] [PMC free article] [PubMed] [Google Scholar]
- 11.Chen BH, Marioni RE, Colicino E, et al. DNA methylation-based measures of biological age: meta-analysis predicting time to death. Aging (Albany NY). 2016;8(9):1844–65. [DOI] [PMC free article] [PubMed] [Google Scholar]
- 12.Horvath S. DNA methylation age of human tissues and cell types. Genome Biol. 2013;14(10):R115. [DOI] [PMC free article] [PubMed] [Google Scholar]
- 13.Hannum G, Guinney J, Zhao L, et al. Genome-wide methylation profiles reveal quantitative views of human aging rates. Mol Cell. 2013;49(2):359–67. [DOI] [PMC free article] [PubMed] [Google Scholar]
- 14.Morrison FG, Logue MW, Guetta R, et al. Investigation of bidirectional longitudinal associations between advanced epigenetic age and peripheral biomarkers of inflammation and metabolic syndrome. Aging (Albany NY). 2019;11(11):3487–504. [DOI] [PMC free article] [PubMed] [Google Scholar]
- 15.Roetker NS, Pankow JS, Bressler J, Morrison AC, Boerwinkle E. Prospective study of epigenetic age acceleration and incidence of cardiovascular disease outcomes in the ARIC study (Atherosclerosis Risk in Communities). Circ Genom Precis Med. 2018;11(3):e001937. [DOI] [PMC free article] [PubMed] [Google Scholar]
- 16.Soriano-Tárraga C, Lazcano U, Jiménez-Conde J, et al. Biological age is a novel biomarker to predict stroke recurrence. J Neurol. 2021;268(1):285–92. [DOI] [PubMed] [Google Scholar]
- 17.Kresovich JK, Xu Z, O’Brien KM, Weinberg CR, Sandler DP, Taylor JA. Methylation-based biological age and breast cancer risk. J Natl Cancer Inst. 2019;111(10):1051–8. [DOI] [PMC free article] [PubMed] [Google Scholar]
- 18.Marioni RE, Shah S, McRae AF, et al. DNA methylation age of blood predicts all-cause mortality in later life. Genome Biol. 2015;16(1):25. [DOI] [PMC free article] [PubMed] [Google Scholar]
- 19.Lu AT, Quach A, Wilson JG, et al. DNA methylation GrimAge strongly predicts lifespan and healthspan. Aging (Albany NY). 2019;11(2):303–27. [DOI] [PMC free article] [PubMed] [Google Scholar]
- 20.McCrory C, Fiorito G, Hernandez B, et al. GrimAge outperforms other epigenetic clocks in the prediction of age-related clinical phenotypes and all-cause mortality. J Gerontol A Biol Sci Med Sci. 2021;76(5):741–9. [DOI] [PMC free article] [PubMed] [Google Scholar]
- 21.Schenk A, Koliamitra C, Bauer CJ, et al. Impact of acute aerobic exercise on genome-wide DNA-methylation in natural killer cells-a pilot study. Genes (Basel). 2019;10(5):380. [DOI] [PMC free article] [PubMed] [Google Scholar]
- 22.Sailani MR, Halling JF, Møller HD, et al. Lifelong physical activity is associated with promoter hypomethylation of genes involved in metabolism, myogenesis, contractile properties and oxidative stress resistance in aged human skeletal muscle. Sci Rep. 2019;9(1):3272. [DOI] [PMC free article] [PubMed] [Google Scholar]
- 23.Van Roekel EH, Dugué PA, Jung CH, et al. Physical activity, television viewing time, and DNA methylation in peripheral blood. Med Sci Sports Exerc. 2019;51(3):490–8. [DOI] [PubMed] [Google Scholar]
- 24.Fernandez-Sanles A, Sayols-Baixeras S, Castro DMM et al. Physical activity and genome-wide DNA methylation: the REgistre GIroní del COR study. Med Sci Sports Exerc. 2020;52(3):589–97. [DOI] [PMC free article] [PubMed] [Google Scholar]
- 25.Gale CR, Marioni RE, Cukic I, et al. The epigenetic clock and objectively measured sedentary and walking behavior in older adults: the Lothian Birth Cohort 1936. Clin Epigenetics. 2018;10:4. [DOI] [PMC free article] [PubMed] [Google Scholar]
- 26.Quach A, Levine ME, Tanaka T, et al. Epigenetic clock analysis of diet, exercise, education, and lifestyle factors. Aging (Albany NY). 2017;9(2):419–46. [DOI] [PMC free article] [PubMed] [Google Scholar]
- 27.Sillanpää E, Ollikainen M, Kaprio J, et al. Leisure-time physical activity and DNA methylation age-a twin study. Clin Epigenetics. 2019;11(1):12. [DOI] [PMC free article] [PubMed] [Google Scholar]
- 28.KankaanpÄÄ A, Tolvanen A, Bollepalli S, et al. Leisure-time and occupational physical activity associates differently with epigenetic aging. Med Sci Sports Exerc. 2021;53(3):487–95. [DOI] [PMC free article] [PubMed] [Google Scholar]
- 29.Oblak L, van der Zaag J, Higgins-Chen AT, Levine ME, Boks MP. A systematic review of biological, social and environmental factors associated with epigenetic clock acceleration. Ageing Res Rev. 2021;69:101348. [DOI] [PubMed] [Google Scholar]
- 30.Dawber TR, Meadors GF, Moore FE Jr. Epidemiological approaches to heart disease: the Framingham Study. Am J Public Health Nations Health. 1951;41(3):279–81. [DOI] [PMC free article] [PubMed] [Google Scholar]
- 31.Kannel WB, Feinleib M, McNamara PM, Garrison RJ, Castelli WP. An investigation of coronary heart disease in families. The Framingham offspring study. Am J Epidemiol. 1979;110(3):281–90. [DOI] [PubMed] [Google Scholar]
- 32.Splansky GL, Corey D, Yang Q, et al. The Third Generation Cohort of the National Heart, Lung, and Blood Institute’s Framingham Heart Study: design, recruitment, and initial examination. Am J Epidemiol. 2007;165(11):1328–35. [DOI] [PubMed] [Google Scholar]
- 33.Glazer NL, Lyass A, Esliger DW, et al. Sustained and shorter bouts of physical activity are related to cardiovascular health. Med Sci Sports Exerc. 2013;45(1):109–15. [DOI] [PMC free article] [PubMed] [Google Scholar]
- 34.Colley RC, Tremblay MS. Moderate and vigorous physical activity intensity cut-points for the Actical accelerometer. J Sports Sci. 2011;29(8):783–9. [DOI] [PubMed] [Google Scholar]
- 35.Choi L, Liu Z, Matthews CE, Buchowski MS. Validation of accelerometer wear and nonwear time classification algorithm. Med Sci Sports Exerc. 2011;43(2):357–64. [DOI] [PMC free article] [PubMed] [Google Scholar]
- 36.Wong SL, Colley R, Connor Gorber S, Tremblay M. Actical accelerometer sedentary activity thresholds for adults. J Phys Act Health. 2011;8(4):587–91. [DOI] [PubMed] [Google Scholar]
- 37.Kho M, Wang YZ, Chaar D, et al. Accelerated DNA methylation age and medication use among African Americans. Aging (Albany NY). 2021;13(11):14604–29. [DOI] [PMC free article] [PubMed] [Google Scholar]
- 38.Gibson J, Russ TC, Clarke TK, et al. A meta-analysis of genome-wide association studies of epigenetic age acceleration. PLoS Genet. 2019;15(11):e1008104. [DOI] [PMC free article] [PubMed] [Google Scholar]
- 39.Horvath S, Levine AJ. HIV-1 infection accelerates age according to the epigenetic clock. J Infect Dis. 2015;212(10):1563–73. [DOI] [PMC free article] [PubMed] [Google Scholar]
- 40.2018 Physical Activity Guidelines Advisory Committee. 2018 Physical Activity Guidelines Advisory Committee Scientific Report. Washington, DC: U.S. Department of Health and Human Services. 2018. [Google Scholar]
- 41.Egan B, Zierath JR. Exercise metabolism and the molecular regulation of skeletal muscle adaptation. Cell Metab. 2013;17(2):162–84. [DOI] [PubMed] [Google Scholar]
- 42.Petersen AM, Pedersen BK. The anti-inflammatory effect of exercise. J Appl Physiol (1985). 2005;98(4):1154–62. [DOI] [PubMed] [Google Scholar]
- 43.Salmon J, Bauman A, Crawford D, Timperio A, Owen N. The association between television viewing and overweight among Australian adults participating in varying levels of leisure-time physical activity. Int J Obes Relat Metab Disord. 2000;24(5):600–6. [DOI] [PubMed] [Google Scholar]
- 44.Bergouignan A, Rudwill F, Simon C, Blanc S. Physical inactivity as the culprit of metabolic inflexibility: evidence from bed-rest studies. J Appl Physiol (1985). 2011;111(4):1201–10. [DOI] [PubMed] [Google Scholar]
- 45.da Silveira WA, Fazelinia H, Rosenthal SB, et al. Comprehensive multi-omics analysis reveals mitochondrial stress as a central biological hub for spaceflight impact. Cell. 2020;183(5):1185–201.e20. [DOI] [PMC free article] [PubMed] [Google Scholar]
- 46.Margaritis I, Rousseau AS, Marini JF, Chopard A. Does antioxidant system adaptive response alleviate related oxidative damage with long term bed rest? Clin Biochem. 2009;42(4-5):371–9. [DOI] [PubMed] [Google Scholar]
- 47.Saunders TJ, Larouche R, Colley RC, Tremblay MS. Acute sedentary behaviour and markers of cardiometabolic risk: a systematic review of intervention studies. J Nutr Metab. 2012;2012:712435. [DOI] [PMC free article] [PubMed] [Google Scholar]
- 48.Andersson C, Lyass A, Larson MG, et al. Physical activity measured by accelerometry and its associations with cardiac structure and vascular function in young and middle-aged adults. J Am Heart Assoc. 2015;4(3):e001528. [DOI] [PMC free article] [PubMed] [Google Scholar]