Abstract
Non-coding genetic variants may cause disease by modulating gene expression. However, identifying these expression quantitative trait loci (eQTLs) is complicated by differences in gene regulation across fluid functional cell states within cell types. These states–for example, neurotransmitter-driven programs in astrocytes or perivascular fibroblast differentiation–are obscured in eQTL studies that aggregate cells1,2. Here we modelled eQTLs at single-cell resolution in one complex cell type: memory T cells. Using more than 500,000 unstimulated memory T cells from 259 Peruvian individuals, we show that around one-third of 6,511 cis-eQTLs had effects that were mediated by continuous multimodally defined cell states, such as cytotoxicity and regulatory capacity. In some loci, independent eQTL variants had opposing cell-state relationships. Autoimmune variants were enriched in cell-state-dependent eQTLs, including risk variants for rheumatoid arthritis near ORMDL3 and CTLA4; this indicates that cell-state context is crucial to understanding potential eQTL pathogenicity. Moreover, continuous cell states explained more variation in eQTLs than did conventional discrete categories, such as CD4+ versus CD8+, suggesting that modelling eQTLs and cell states at single-cell resolution can expand insight into gene regulation in functionally heterogeneous cell types.
Genome-wide association studies (GWAS) have implicated non-coding variants in regulatory regions3. However, the effect of these variants on gene expression–eQTLs–incompletely explains their pathogenicity4,5. This may be because eQTL effects vary in magnitude with cell states, such as differentiation or activation, as well as with cell-type composition and environment6–12. Bulk studies have proposed new strategies to derive and model these complex cell states, but the bulk approach still obscures many of the diverse disease-relevant physiological states that are present in vivo.
T cells, in particular, are implicated in autoimmunity and allergy and have functional states defined by surface markers (CD4+ and CD8+), cytokines (T helper 1, T helper 2 and T helper 17 cells; TH1, TH2 and TH17, respectively), transcription factors (T-bet and RORγt) or graded transcriptomic programs (effector, cytotoxicity and activation)13–15. Similar to states in other cell types, T cell states are continuous, dynamic (for example, TH17 cells can become IL-17-and-IFNγ-coproducing TH17/1 cells that are implicated in tuberculosis) and may coexist in one cell (for example, effector-like CD4+ TH2 cells, which are seen in asthma)16–20.
Single-cell assays capture these states, but many single-cell eQTL studies assess state dependence by aggregating cells from discrete clusters and using pseudobulk linear models9,21–24. This limits analysis to coarse states that imperfectly partition a continuous transcriptional landscape. We instead focus on continuous cell states, which are uniquely discernible at single-cell resolution. These states may take many forms, including trajectories or gene scores. In this study, we leverage low-dimensional embeddings to represent multidimensional cell-state heterogeneity in multimodal single-cell assays of unstimulated memory T cells, and we also demonstrate the broader applicability of this approach. Decomposing multiple states in each cell, we dissect state-dependent eQTL effects at single-cell resolution.
Memory T cell eQTLs in Peruvian individuals
We used single-cell expression of the transcriptome and 30 T cell surface proteins from a previous cellular indexing of transcriptomes and epitopes by sequencing (CITE-seq) study of 500,089 memory T cells isolated from 259 healthy Peruvian individuals with a previously resolved Mycobacterium tuberculosis infection25 (Methods, Supplementary Fig. 1a–c; experimental details in Supplementary Note). This sample was selected from a larger cohort of genotyped individuals of admixed Native American and European genetic ancestry26 (Supplementary Fig. 2a, b; details in Supplementary Note). After quality control and imputation, we analysed 5,486,956 genetic variants (Supplementary Fig. 2c, Methods).
We first defined a robust set of eQTLs across all memory T cells in pseudobulk; this state-agnostic analysis would produce promising candidates to test for state dependence in a single-cell model (Fig. 1a). We summed the expression of each gene across all cells from each donor (mean = 1,846 cells per donor; Supplementary Fig. 1c) and then normalized and corrected measured and latent covariates in this pseudobulk profile (Supplementary Fig. 1d). We tested cis-eQTL associations between the covariate-corrected expression of 15,789 genes expressed in more than 50% of samples and variants less than 1 Mb from the transcription start site (TSS) of each gene.
Fig. 1 |. Modelling memory T cell states and eQTLs.
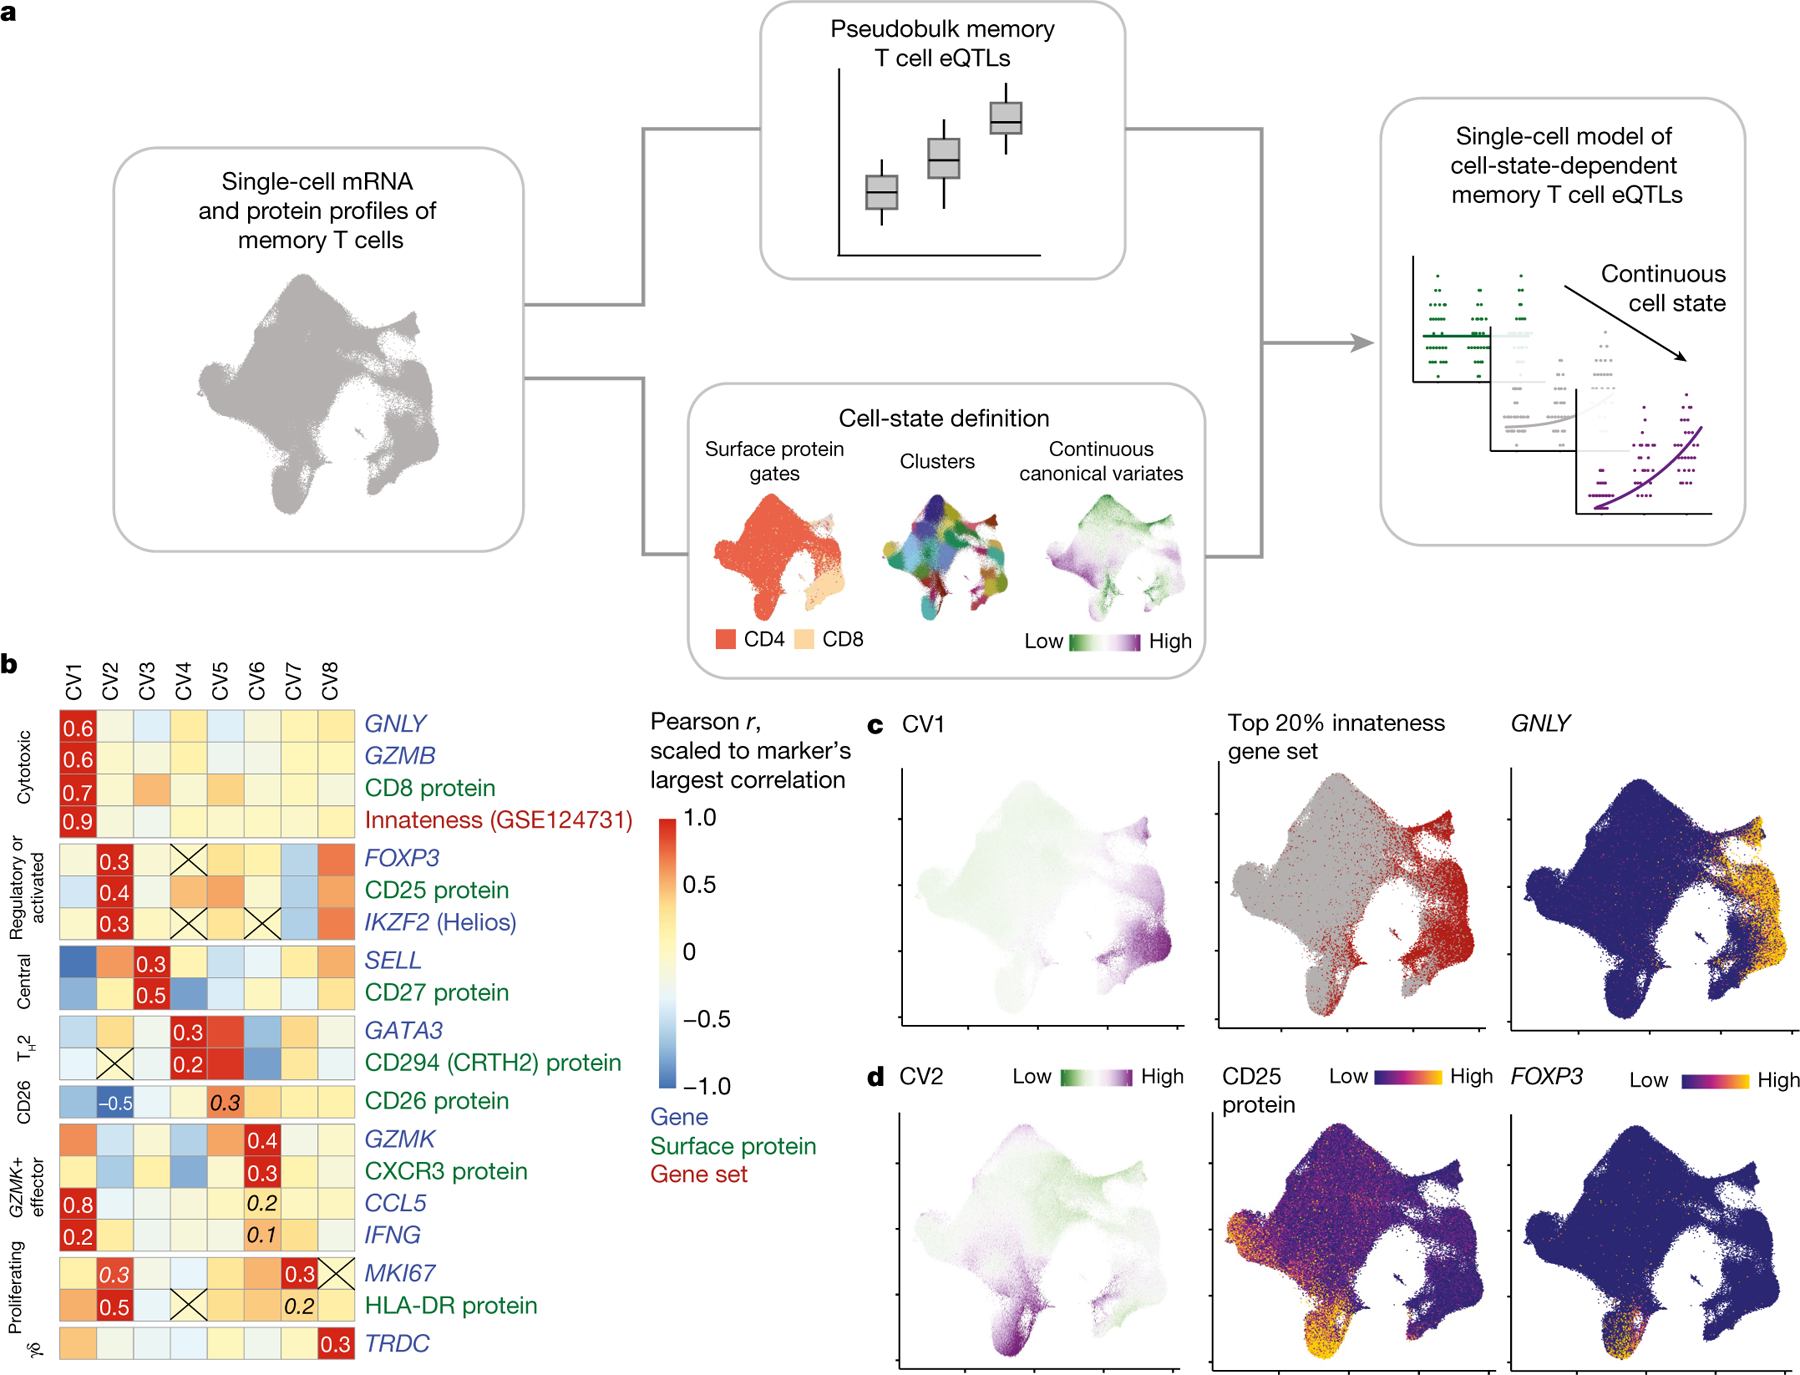
a, Single-cell eQTL modelling strategy. We conduct a pseudobulk analysis of memory T cell eQTLs and define single-cell states with continuous canonical variates. These states can be used to identify dynamic memory T cell eQTLs in a single-cell model (shown here binned into low, medium and high for ease of visualization). b, Heat map coloured by scaled Pearson correlations between CVs and normalized expression of select marker genes or surface proteins and gene set scores (weighted sum of scaled gene expression). Correlations are scaled for each marker relative to the most extreme value, which is specified. Other correlations of interest are also written in italics and non-significant correlations are crossed out. c, Uniform manifold approximation and projection (UMAP) plots coloured by CV1 score (left), top 20% of cells based on innateness gene set score (red) (middle) and normalized GNLY expression (right). d, UMAP plots coloured by CV2 score (left), CD25 protein expression (middle) and normalized FOXP3 expression (right). Colours for CV scores range from low (green) to high (purple). Colours for expression range from minimum (blue) to maximum (yellow).
We found 6,511 genes with significant cis-eQTLs (eGenes, q < 0.05), consistent with similarly sized bulk eQTL studies and including previously described eGenes such as CTLA4 and ERAP2 (refs. 27–29) (Extended Data Fig. 1a, b, Supplementary Table 1). We also found 808 eQTLs with effects that are likely to be population-specific; that is, driven by genetic variation that is common in Peruvian individuals (minor allele frequency (MAF) > 0.05) but rare in European individuals (MAF < 0.05). For example, an eQTL for the gene encoding the MAF transcription factor (MAF; rs9927852, β = 0.32, P = 3.45 × 10⁻⁷) was not reported in previous eQTL studies of predominantly European cohorts29–31 (minor allele frequency = 22% in the study cohort, 27% in the 1000 Genomes Project Peruvians in Lima (PEL) cohort and 1% in the 1000 Genomes Project European (EUR) cohort; Extended Data Fig. 1c, d, Supplementary Table 2). When we iteratively conditioned on the lead eQTL for each eGene (n = 6,511), we observed multiple independent effects at 436 loci (Extended Data Fig. 1e, f, Supplementary Table 3).
We compared the effects of lead variants to published bulk memory CD4+ T cell eQTLs from the Database of Immune Cell eQTLs (DICE, n = 91) and the BLUEPRINT epigenome project27,31 (n = 169). We found high directional concordance for eQTLs (DICE: 2,094/2,214 = 93% same direction of effect; BLUEPRINT: 1,917/2,056 = 93%; Extended Data Fig. 2a, b, Supplementary Note). In other cell types assayed in BLUEPRINT, eQTLs had less overlap with our memory T cell eQTLs and lower directional concordance (monocytes: 1,397/1,651 = 85%; neutrophils: 1,019/1,312 = 78%; Extended Data Fig. 2c, d, Supplementary Table 4).
T cell diversity spans continuous states
Combined single-cell mRNA and protein measurements from CITE-seq allow us to not only discretely cluster cells but also capture continuous states in a multimodal low-dimensional embedding from canonical correlation analysis (CCA), as previously described (Methods)25. In the original analysis of these single-cell data, clustering cells on the top 20 independent CCA dimensions (canonical variates (CVs)) leveraged variation shared between modalities for a robust definition of cell states beyond what mRNA alone captured and associated with T cell markers, clinical and demographic variables25 (Supplementary Fig. 3a, b). Here, we again scored each cell along the top 20 CVs, but rather than clustering on CVs, we now used them as continuous, independent representations of cell state.
We observed that individual CVs correlate with genes, proteins and gene sets that are relevant to well-described T cell functions (for example, CV1 and cytotoxicity, CV2 and regulatory or activated; Fig. 1b–d, Supplementary Table 5). Some CVs correlated with lineage-defining markers of T cell state; for example, CV4 and the TH2 marker GATA3 (Pearson r = 0.23 in non-zero cells. P < 10−1785), or CV8 and the γδ T cell marker TRDC (ref. 32) (Pearson r = 0.51 in non-zero cells, P < 10−767; Supplementary Fig. 3c–f). We can attempt to interpret the correspondence of each CV to known immune states, while recognizing the limitation that individual marker genes may have context-dependent roles and multiple axes are likely to contribute to functions associated with known cell states.
The average scores of T cells on eight CVs varied among CCA-defined clusters (Supplementary Table 6), but these clusters obscured intercellular heterogeneity within them (Supplementary Fig. 3g). Thus, continuous CVs or similar single-cell metrics–capturing the degree of each state’s presence in a cell–may be a more faithful representation of activation or helper states manifesting in T cells.
Single-cell models of state-dependent eQTLs
Single-cell-resolution eQTLs and bulk eQTLs require different statistical models. For single cells, we used Poisson mixed-effects (PME) regression, which can model discrete and continuous single-cell states, Poisson-distributed unique molecular identifier (UMI) counts and batch structure33,34. We model the UMI counts of a gene in single cells as a function of genotype, adjusting for common eQTL confounders (age, sex, genotype principal components (PCs) and gene expression PCs) and covariates shown to have gene-specific effects in single-cell data35 (UMI count and percentage of mitochondrial UMIs; Fig. 2a, Methods). Genotype PCs captured Native American and European components of admixed Peruvian genetic ancestry26 (Supplementary Fig. 2a, b). Random-effect covariates account for batch and repeated measurements (donor, library preparation batch). We assessed the model’s significance with a likelihood ratio test (LRT) and compared effect sizes with Wald statistics.
Fig. 2 |. Modelling eQTL interactions with continuous cell states across single cells.
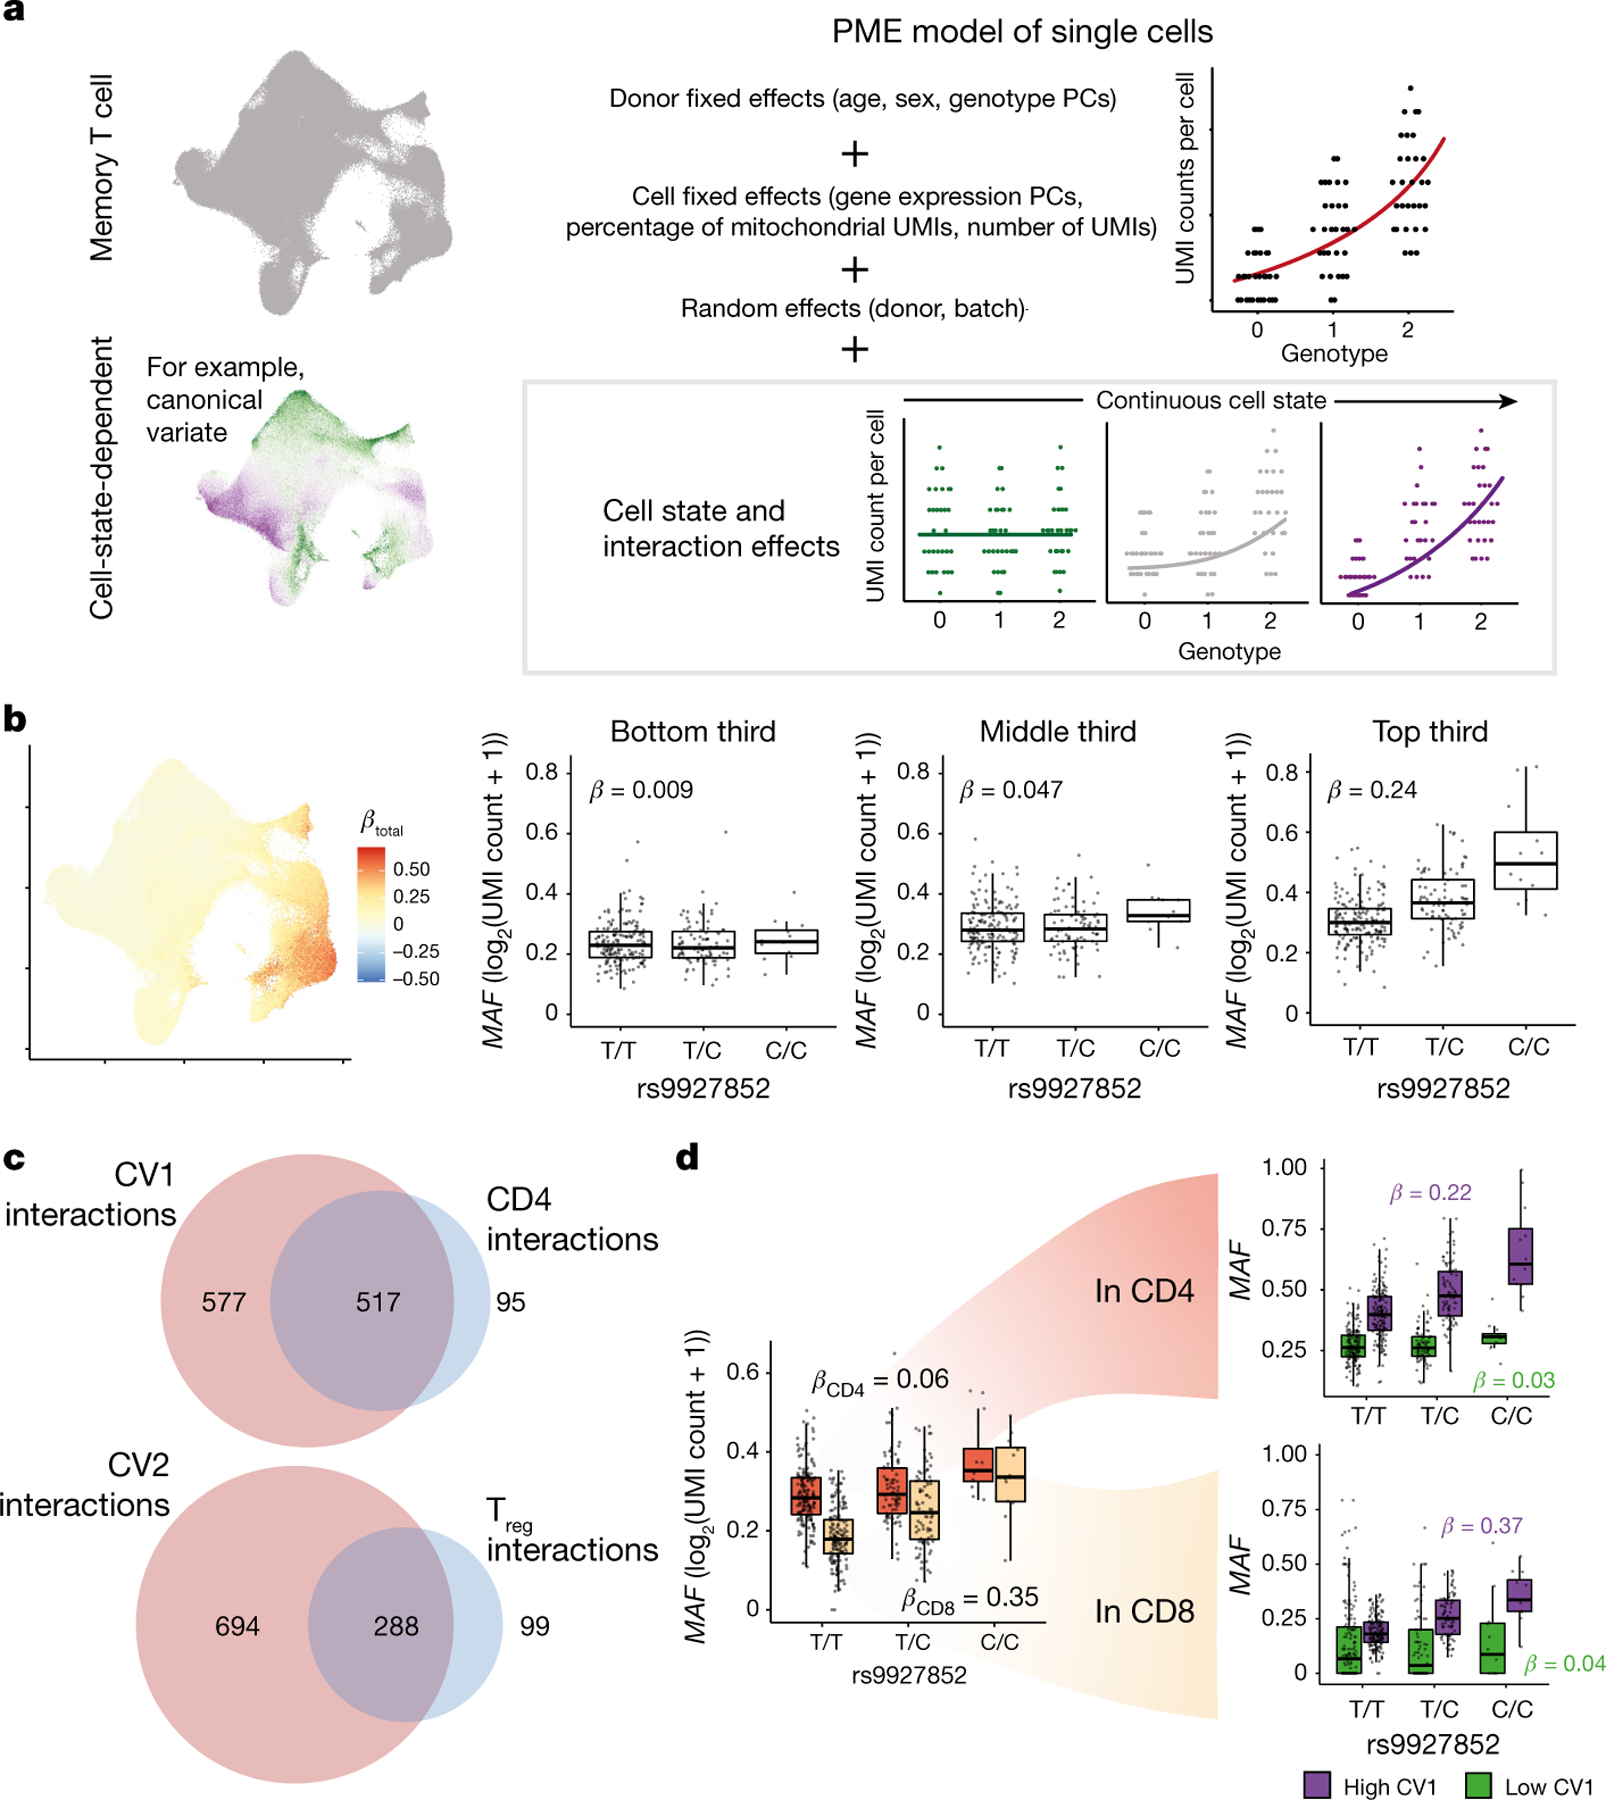
a, Schematic of PME model for cell-state-dependent single-cell eQTL analysis. After adjusting for covariates, we can measure the interaction between a continuous cell state (shown here binned into low, medium and high for ease of visualization) and genotype. b, Interaction of the rs9927852 eQTL for MAF with CV1. Left, UMAP plot of total effect size (βtotal = βG + βCV1 × CV1 score) per cell. Box plots show the eQTL effect for cells in the bottom (left), middle (centre), and top (right) thirds of CV1 scores. c, Venn diagrams of eGenes with significant CV interactions (red) and discrete state interactions (blue) for CV1 versus CD4+ (top) and CV2 versus Treg (bottom) at q < 0.05. d, rs9927852 eQTL for MAF in CD4+ (orange) and CD8+ (beige) cells (left), then each divided by low (green) or high (purple) CV1 score (right). CD4+ or CD8+ classification is based on CITE-seq surface-protein-based gating. High or low CV1 is based on threshold = 0. For b, d, each point in a box plot represents the average log2(UMI count + 1) across all cells in the indicated subset of cells in a donor (n = 259), grouped by genotype. Box plots show median (horizontal bar), 25th and 75th percentiles (lower and upper bounds of the box, respectively) and 1.5 times the interquartile range (IQR) (or minimum and maximum values if they fall within that range; end of whiskers).
To demonstrate consistency with commonly used linear models, we reanalysed our data with PME. We successfully recapitulated almost all pseudobulk eQTLs (q < 0.05 with π0 = 0.38, 6,402/6,511 = 98%) with concordant direction of effect (6,509/6,511 = 100%; Supplementary Fig. 4a–c, Supplementary Table 7), powered by a large cell count (Supplementary Note). We observed well-calibrated type I error when we permuted genotypes (346/6,511 = 5.3% significant at P < 0.05; Supplementary Fig. 4d). Almost no eQTLs interacted with the progression of tuberculosis, which was unsurprising because the donors had received highly effective treatment for tuberculosis four or more years earlier (6,510/6,511 eQTLs with interaction q > 0.05; Supplementary Table 8).
To identify eQTLs with cell-state-dependent effects, we added an interaction term between genotype and cell state. We compared this to a baseline model including genotype (overall eQTL) and cell-state (differential expression) effects and assessed significance with LRT (Methods). First, in a simple binary test case (CD4+ versus CD4−), we assessed concordance between the interaction model (run on all cells) and two non-interaction models (run on gated CD4+ cells) that we validated above: the conventional pseudobulk linear model or a single-cell PME model without an interaction term (Supplementary Fig. 5). The total eQTL effect in CD4+ cells (βtotal = βG + βG×CD4) was consistent with the genotype effects estimated in both of these models (pseudobulk: Pearson r2 = 0.92; single-cell: Pearson r2 = 1.00; Extended Data Fig. 3a, b, Supplementary Tables 9–11), and type I error for the interaction term was well-controlled at α = 0.05 when we permuted cell state (391/6,511 = 0.060; Extended Data Fig. 3c). As expected, effects were less concordant between CD4 βtotal and pseudobulk or single-cell models of gated CD8+ T cells (pseudobulk: Pearson r2 = 0.80; single-cell: Pearson r2 = 0.82; Supplementary Fig. 6, Supplementary Tables 12, 13).
An alternative is a linear mixed-effects (LME) model of normalized single-cell expression. Without considering cell state, LME performed similarly to PME (Supplementary Fig. 4e–h, Supplementary Table 14). However, with an interaction term, LME was confounded by sparsity and cell-state expression differences (Extended Data Fig. 3d–f, Supplementary Fig. 7, Supplementary Table 15, Supplementary Note). LME spuriously detected highly significant state-specific eQTLs when we simulated differential expression between CD4+ and CD4− cells, whereas PME did not (Methods, Extended Data Fig. 3g, h). This is consistent with studies showing that linear models inadequately describe single-cell gene expression33,34.
eQTLs vary along continuous cell states
We represented cell states in the PME model with the CV projections of cells and controlled for the same covariates described above, such as genetic ancestry, which may confound cell-state interactions (Fig. 2a, Supplementary Figs. 2, 3a, b, Methods, Supplementary Note). We found that many eQTLs vary along these cell states. CV1, capturing cytotoxic function, significantly interacted with 1,094/6,511 memory T cell eQTLs (q < 0.05; Supplementary Table 16). For example, the interaction with rs9927852 eQTL for MAF amplified the effect in cells with higher CV1 scores (βG = 0.097, βG×CV1 = 0.13, average βtotal in lower third = 0.009, average βtotal in upper third = 0.24; Fig. 2b). Interaction effects were independent from differential expression and main genotype effects and occurred in less sparse genes, and the type I error was well-controlled when permuting CV1 scores and in simulated null data (Supplementary Fig. 8, Methods, Supplementary Note). Interactions from Poisson and negative binomial models were largely consistent for the subset of 1,000 eGenes that we tested because gene expression was mostly not overdispersed (Supplementary Fig. 9, Supplementary Table 17, Supplementary Note).
Continuous cell states captured more state-dependent regulatory variation than analogous discrete phenotypes. For example, continuous CV1 scores discriminate between CD4+ and CD8+ T-cell lineages (CD4+ classified as CV1 < 0: sensitivity = 0.85; specificity = 0.93; Extended Data Fig. 4a); accordingly, a PME model of eQTL interactions with continuous CV1 recapitulated 517/612 (84%) interactions identified in a PME model with discrete CD4+ state. However, in this dataset, we observe not only CD4+ helper and CD8+ cytotoxic cells–common lineage phenotypes–but also rarer CD4+ cytotoxic and CD8+ non-cytotoxic subsets. These deviating states are obscured in a discrete CD4 versus CD8 classification, but can be better resolved by continuous CVs inferred from the data (Extended Data Fig. 4a). We identified 577 additional eQTLs with CV1 interactions that lacked significant CD4 interactions but had consistent directions of effect (94% concordant direction; Fig. 2c, Extended Data Fig. 4b). CV1 interactions generally had higher power (Deming β between z scores = −1.48). Similarly, CV2 correlates with markers of regulatory T (Treg) cells and activation, and the 982 eQTLs with CV2 interactions included but exceeded 288/387 (74%) eQTLs with significant Treg cluster interactions (Fig. 2c, Extended Data Fig. 4c, Supplementary Tables 18, 19). These correspondences were CV-specific (Extended Data Fig. 4d, e), showing that decomposing single-cell data into continuous states may capture regulatory biology.
Continuous cell states may also better explain many heterogeneous eQTL effects. For example, CD4+ cells tend to have lower CV1 scores, and both are associated with aweaker MAF eQTL (CD4: βG = 0.33, βG×CD4 = −0.25, PG×CD4 = 2.91 × 10−86; CV1: βG = 0.097, βG×CV1 = 0.13, PG×CV1 = 3.15 × 10−246). However, in a joint model with cell state and genotype–cell state interaction terms for both CD4 and CV1, the CD4+ interaction was no longer significant (P = 0.87), but the CV1 interaction was (P = 2.34 × 10−118). Upon closer inspection, the MAF eQTL is strong in both CD4+ and CD8+ memory T cells with high CV1 scores (βCD4, high CV1 = 0.22, βCD8, high CV1 = 0.37; Fig. 2d), but weaker in cells with a CV1 scores (βCD4, low CV1 = 0.03, βCD8, low CV1 = 0.04). The significance of the CV1 interaction similarly superseded the discrete CD4+ interaction in the joint model for 264/517 eQTLs with significant interactions in both univariate models, whereas CD4 interactions superseded continuous interactions for 49/517 eQTLs (LRT P < 0.05). Hence, although some eQTLs may be driven by lineage, much of the observed regulatory variation is better explained by the degree of cytotoxicity.
Individual cells have distinct eQTL effects
To capture the regulatory effects of multifaceted states in individual cells, we added orthogonal CVs sequentially to a multivariate PME eQTL model. We observed that the number of significant interacting eGenes reaches a plateau with 7 CVs (2,117 interacting/6511 eGenes, at q < 0.05; Extended Data Fig. 5a, Supplementary Table 20), and in univariate models, CVs 8 and beyond identify fewer eQTL interactions than earlier CVs (Supplementary Tables 21–33). Therefore, we included 7 CVs in the multivariate model and observed high concordance with univariate interactions (r = 0.87–0.97; Supplementary Fig. 10a), consistent with the independence of orthogonal CVs. Although we limited further analyses to pseudobulk-significant eGenes and their lead variants to minimize multiple testing burden and focus on more robust candidates, a minority of non-pseudobulk-significant eQTLs were state-dependent (390/8,692 at q < 0.05; Supplementary Table 34), such as TIGIT (Supplementary Fig. 11, Supplementary Note).
As validation, we focused on the subset of eQTLs also identified through meta-analysis of six DICE memory T cell subsets. The state-dependent eQTLs identified by the 7-CV PME model recapitulated 15 out of 16 of the eQTLs with high heterogeneity across memory T cell states in DICE (Cochran P < 0.001 and I2 > 25%).
CV1 had the most interacting eGenes in both the univariate and the 7-CV multivariate models (Extended Data Fig. 5b, Supplementary Fig. 10b). Some eGenes significantly interacted with multiple cell states (Extended Data Fig. 5c), with related directions of effect in the multivariate model; for example, CV1 (cytotoxicity) and CV6 (TH1) tended to have the same direction of effect, whereas CV1 and CV3 (central) tended to have opposite directions (Extended Data Fig. 5d–f). Clustering genes on the basis of their scaled multivariate interaction β values (relative to the direction of the main effect) defined 10 broad patterns of CV interactions that may reflect shared cell-state-dependent regulatory mechanisms (Supplementary Fig. 12, Supplementary Table 35). Using HOMER, we observed the enrichment of some transcription-factor-binding motifs either in the promoter of eGenes interacting with each CV or overlapping the interacting lead variants, including known T cell transcription factors such as RUNX1 (refs. 32,36) (Supplementary Table 36). There were few such significant enrichments, suggesting that the regulatory landscape may be more complex than individual transcription-factor-driven programs.
CVs define biologically relevant cell states that may be missed by single-modality PCs, but eQTL models with seven mRNA or protein PCs still yielded similar numbers of interactions to those with seven CVs25 (mRNA: 2,364, protein: 1,915, q < 0.05; Supplementary Fig. 13a, Supplementary Tables 37, 38). Most of these eQTLs replicated across all three models (Supplementary Fig. 13b–d).
We estimated eQTL effects at single-cell resolution by summing the products of interaction β values and corresponding CV scores per cell (Fig. 3a, Methods). These CV scores capture the partial influence of each state that may modulate regulatory activity. Adding this value to the baseline genotype β estimates the total cell-level eQTL effect, which varies across cells independent of eGene expression.
Fig. 3 |. Single-cell dissection of eQTLs.
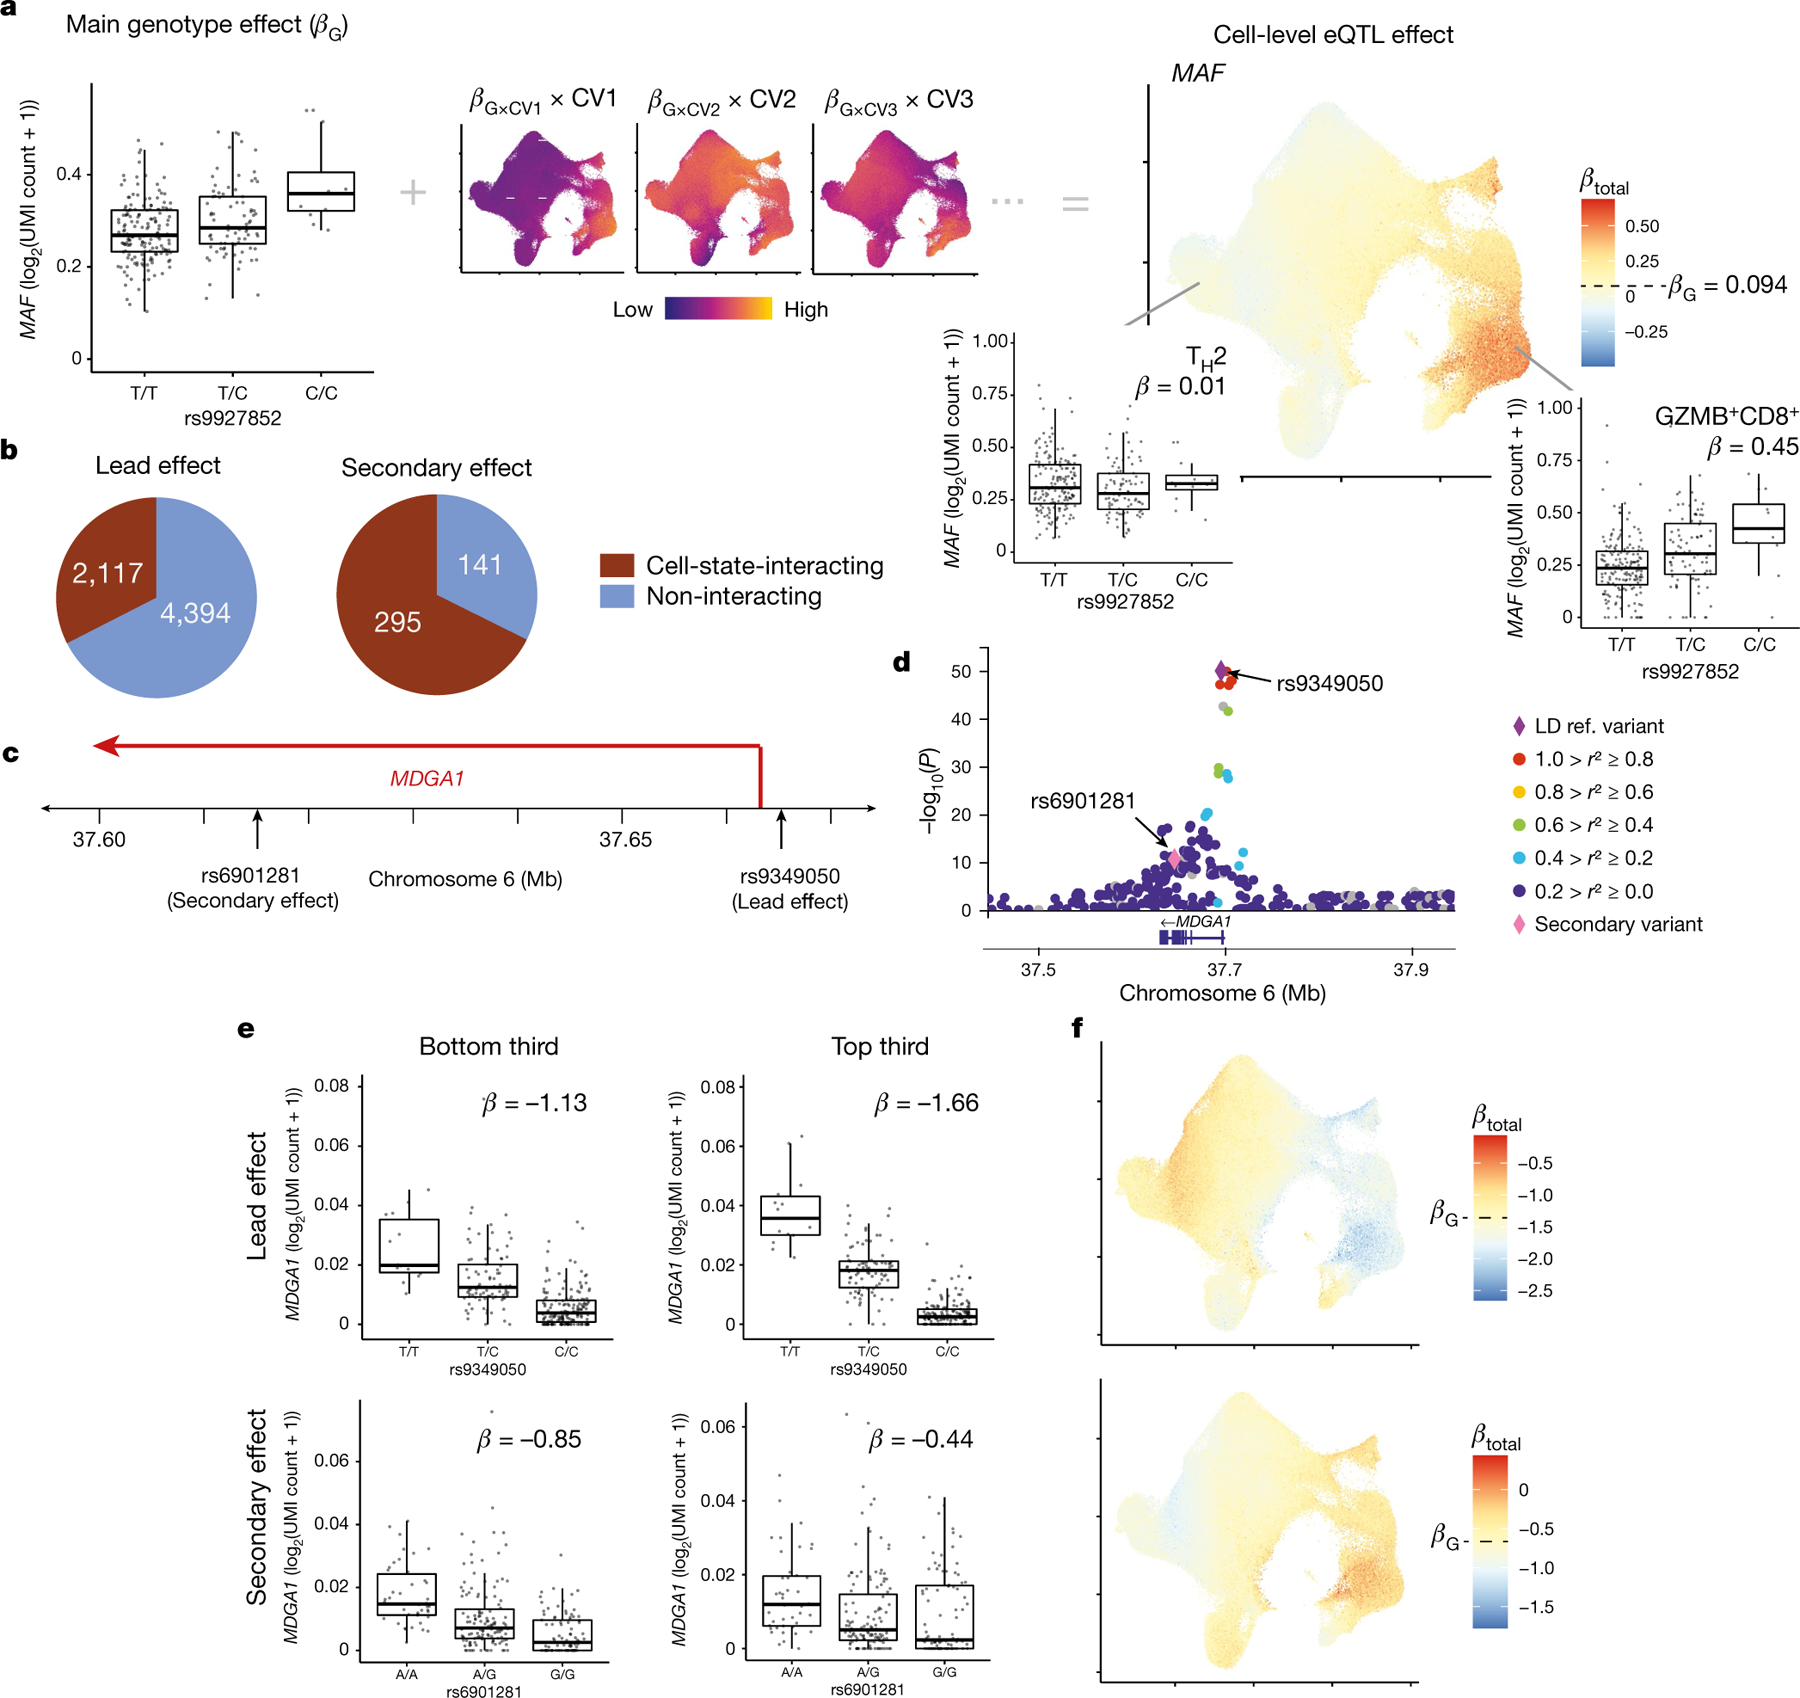
a, Schematic of calculating cell-level eQTL β values with the example of MAF and rs9927852. UMAP (right) shows the total eQTL effect size at single-cell resolution, computed by summing the main genotype effect (box plot) and individual CV effects (UMAPs). CV UMAPs (middle) depict the interaction β value of each CV multiplied by cell-level CV scores scaled independently from lowest (purple) to highest (yellow). b, Number of lead eQTL variants and independent secondary variants with significant cell-state interactions (brown). c, MDGA1 locus with two independent eQTLs. d, Zoom plot of the MDGA1 locus. Purple diamond, lead variant; pink diamond, secondary variant; other variants are coloured according to r2 values with the lead variant in 1000 Genomes AMR (American ancestry: Puerto Rican in Puerto Rico, Colombian in Medellín, Peruvian in Lima, and Mexican ancestry in Los Angeles). e, Lead (top) and secondary (bottom) eQTLs for MDGA1 in cells with the bottom third (left) and top third (right) of CV1 scores. Each point represents the average log2(UMI count + 1) across all cells in the indicated CV1 score bin in a donor (n = 259), grouped by genotype. Box plots show median (horizontal bar), 25th and 75th percentiles (lower and upper bounds of the box, respectively) and 1.5 × IQR (or minimum and maximum values if they fall within that range; end of whiskers). β values are the average βtotal for cells in the bin. f, UMAP plots of the total eQTL effect of lead (top) and secondary (bottom) variants for MDGA1. Each cell is coloured by its scaled βtotal, centred on βG with the maximum (red) and minimum (blue) determined by the most extreme βtotal in any cell.
eGenes can have multiple dynamic effects
Previous studies suggest that secondary eQTLs conditioned on the lead effect are more likely to be cell-state-specific37. We observed that 68% of secondary eQTLs had significant cell-state interactions compared to 33% of lead variants (Fig. 3b, Fisher P = 1.96 × 10−47; Supplementary Table 39). Discordant Gene Ontology term enrichments for lead and secondary variants further suggest distinct functional significance (Supplementary Table 40, Supplementary Note). A total of 203 eGenes had at least 2 independent state-interacting effects–sometimes with contradictory CV interactions. For example, MDGA1’s lead eQTL increases with CV1, whereas its secondary effect decreases (Fig. 3c–f). Of the 60 eGenes with at least 2 independent CV1-dependent effects (q < 0.05), 29 eGenes had different CV1 interaction directions for their lead and secondary variants. Seventy eGenes showed this discordance with at least one CV (Extended Data Fig. 6).
Many autoimmune loci are dynamic eQTLs
Consistent with previous studies, we found that the pseudobulk memory T cell eQTLs were enriched for lead variants in linkage disequilibrium (LD) (r2 ≥ 0.5) with genome-wide significant loci associated with immune traits compared to genome-wide significant loci for all other traits in the GWAS Catalog27,38 (rheumatoid arthritis (RA): odds ratio (OR) = 4.67, Fisher P = 2.25 × 10⁻⁷; inflammatory bowel disease: OR = 4.80, Fisher P = 2.63 × 10⁻¹¹; Extended Data Fig. 7a, Supplementary Table 41). We recapitulated previously described disease-associated eQTL variants such as rs1893592 (chr21_42434957_A_C), an RA-associated UBASH3A eQTL39.
Moreover, the lead variants of cell-state-interacting eQTLs in memory T cells were enriched for overlap with GWAS variants compared to non-interacting eQTLs (OR = 1.31, Fisher P = 5.3 × 10⁻⁵), and state-dependent eQTL lead variants overlapped with at least one GWAS variant for 185/194 traits tested from the GWAS Catalog. State-interacting eQTLs were nominally enriched compared to non-interacting eQTLs for overlap with 11 individual traits, only significantly exceeding the null expectation (2,117/6,511 = 33%) for some immune and blood traits such as RA (16/24 = 67%), type 1 diabetes (13/20 = 65%) and multiple sclerosis (24/43 = 56%) (ORs:1.45–6.24; Extended Data Fig. 7b, Supplementary Table 42).
To assess this further, we used coloc, a Bayesian colocalization method that estimates the posterior probability that the same causal variant explains the eQTL and trait association in a locus40. We tested 15 traits for which GWAS have been performed in cohorts of European or Asian ancestry (Methods), including those thought to be immune-mediated (for example, RA and type 1 diabetes) and non-immune (for example, coronary artery disease and height). Admixed ancestry of the eQTL cohort and LD discrepancies with the GWAS cohorts may limit the power of this analysis. As expected, traits without major immune aetiology were not enriched for colocalization with state-dependent eQTLs (for example, height: OR = 0.87, P = 0.43; coronary artery disease: OR = 1.17, P = 0.49), whereas GWAS loci for some known T-cell-mediated diseases such as psoriasis (OR = 2.70, P = 2.9 × 10⁻³) and multiple sclerosis (OR = 2.06, P = 4.06 × 10⁻⁴) colocalized with state-dependent eQTLs at significantly higher rates than expected (Extended Data Fig. 7c). Other immune-mediated traits, such as RA (OR = 1.55, P = 0.063) and asthma (OR = 1.56, P = 0.13), had substantial proportions of state-dependent-eQTL-colocalizing loci but were not significantly enriched, potentially owing to limited power.
The lead eQTL variant for ORMDL3 (rs4065275) was in LD (1000 Genomes PEL, r2 = 0.69; 1000 Genomes EUR, r2 = 0.68) with an RA GWAS variant (rs59716545) and had significant multivariate interactions with CVs 1 and 2 (ref. 41). The ORMDL3 eQTL was strongest in GZMB+ cytotoxic CD8+ T cells (Fig. 4a). On the other hand, the lead IL18R1 eQTL variant (rs11123923, chr2_102351384_C_A)—in LD with the inflammatory bowel disease GWAS variant rs1420098 (r2 = 1.00 in 1000 Genomes PEL and EUR)—was strongest in TH2 and TH17 cells with weaker effects in cytotoxic states42 (Fig. 4b).
Fig. 4 |. Cell-state-dependent disease and regulatory effect of eQTLs.
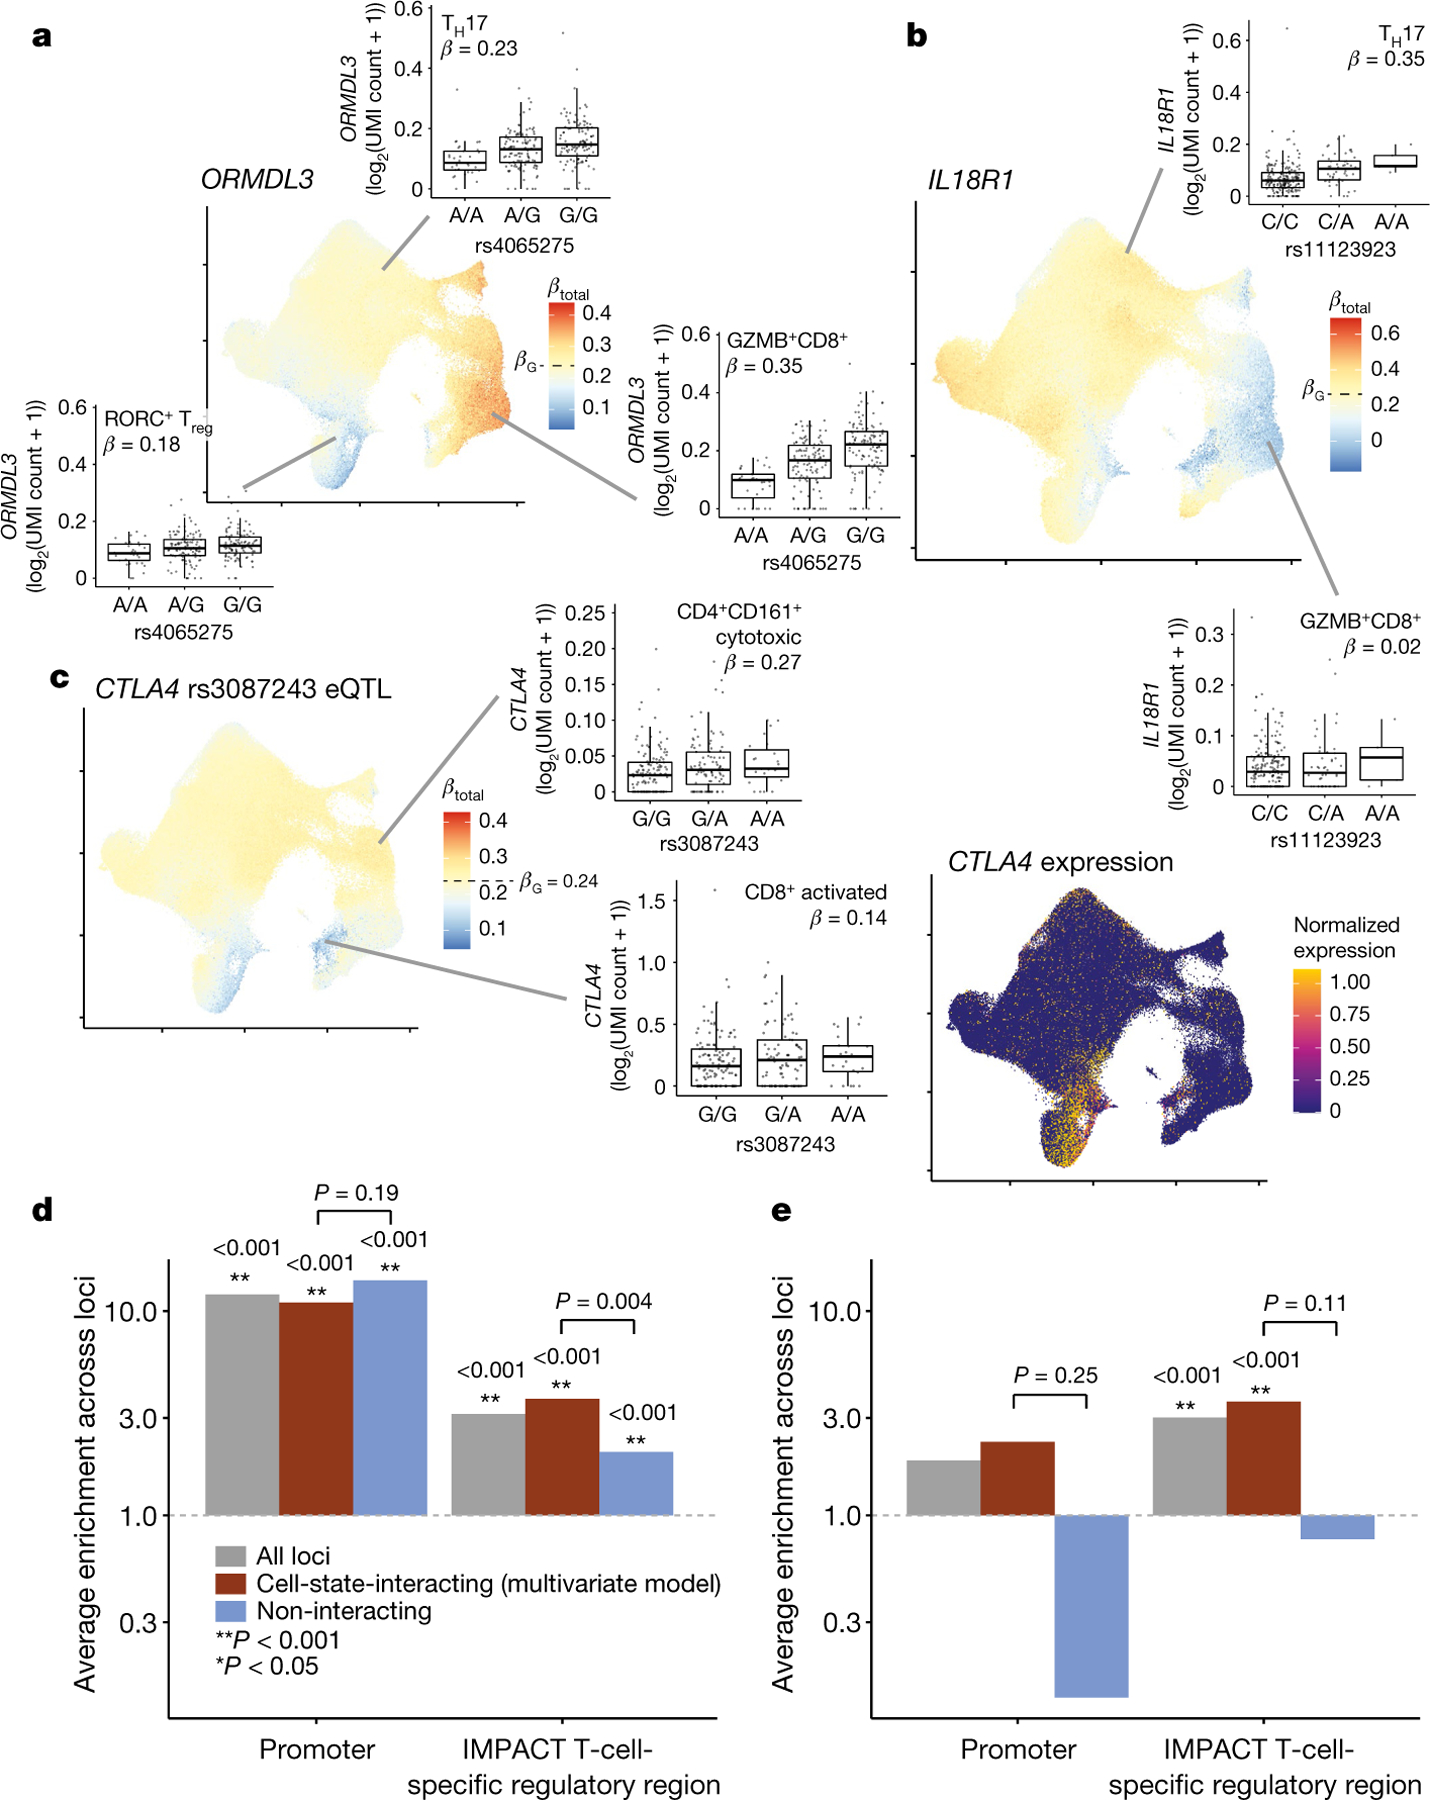
a, b, UMAP plots of the single-cell effect sizes of the RA-linked rs4065275 eQTL for ORMDL3 (a) and the irritable bowel disease (IBD)-associated rs11123923 eQTL for IL18R1 (b). c, Left, UMAP plot of the single-cell effect size of the RA-associated rs3087243 eQTL for CTLA4. Right, single-cell normalized expression of the CTLA4 gene scaled from lowest (dark blue) to highest (yellow). For all single-cell eQTL effect UMAP plots, each cell is coloured by its scaled βtotal, centred on βG with the maximum (red) and minimum (blue) determined by the most extreme βtotal. For all box plots, each point represents the average log2(UMI count + 1) across all cells in the indicated cluster in a donor (n = 259), grouped by genotype. Box plots show median (horizontal bar), 25th and 75th percentiles (lower and upper bounds of the box, respectively) and 1.5 × IQR (or minimum and maximum values if they fall within that range; end of whiskers). β values are the average βtotal for all cells in the cluster. d, e, Enrichment of eQTL lead effects (d; n = 461) or independent secondary (conditional) effects (e; n = 53) in promoter or T-cell-specific regulatory regions. The analysis was limited to loci in which at least one variant had PIP ≥ 0.5. The grey bars show the average enrichment across all analysed loci; the red bars are limited to those with significant cell-state interaction (LRT q < 0.05 in multivariate model with 7 CVs); and the blue bars show those without significant cell-state interaction. Bars with P ≥ 0.001 (limit of 1,000 permutations) are labelled with their one-sided P value and with corresponding asterisks. Pairs of interacting and non-interacting bars are labelled with a one-sided permutation P value for the difference (interacting minus non-interacting). The grey dotted line indicates enrichment statistic = 1.
GWAS variants did not always have stronger eQTL effects in states with higher overall expression. For example, the lead eQTL effect for CTLA4 was mediated by rs3087243 (chr2_203874196_G_A), which is associated with RA and type 1 diabetes43. Although CTLA4 expression is highest in Treg cells, RORC+ Treg cells and activated T cells, these cells had weaker eQTL effects (Fig. 4c). The eQTL effect was strongest in cytotoxic CD4+ T cells, a state with very low CTLA4 expression. This suggests that disease processes may emerge in unlikely states in which pathogenic variants modulate low-level gene expression.
Dynamic eQTLs are in regulatory regions
State-dependent eQTLs may be concentrated in regulatory regions, including promoters (shared across states) or enhancers (state-specific)44. We fine-mapped the eQTL effect at each locus with causal variants identification in associated regions (CAVIAR) based on pseudobulk summary statistics45. For loci for which we fine-mapped the lead effect to one variant (n = 461, posterior inclusion probability (PIP) ≥ 0.5), we calculated a 12.05-fold PIP-weighted enrichment of eQTL variants in promoters (TSS ± 2 kb; permutation P < 0.001; Fig. 4d, Methods). Cell-state-interacting and non-interacting eQTLs defined on the basis of the 7-CV multivariate model were both strongly enriched at 11.00- and 14.15-fold, respectively (P < 0.001, one-sided Δint–no int permutation P = 0.19), reflecting the state-agnostic regulatory importance of promoters.
To test enrichments in enhancers–given the uncertainty in their locations–we used an inference and modelling of phenotype-related active transcription (IMPACT) model of T-bet in CD4+ TH1 cells to define cell-type-specific regulatory regions on the basis of transcription factor binding and epigenetic features46. We excluded promoters defined above. Cell-state-interacting eQTLs were almost twice as enriched (3.72) as non-interacting eQTLs (2.04) in T-cell-specific regulatory regions (both P < 0.001, one-sided Δint–no int permutation P = 0.004; Fig. 4d). These state-dependent eQTLs were less significantly overrepresented in B cell (1.45× more enriched, Δint–no int permutation P = 0.067), or monocyte-specific (1.18× more enriched, Δint–no int permutation P = 0.33) regulatory regions compared to non-interacting eQTLs.
To more precisely identify causal variants, we combined this Peruvian dataset with European data from BLUEPRINT and conducted multi-ancestry fine-mapping of pseudobulk effects47. We fine-mapped the lead effects for 916 eGenes to single causal variants (PIP ≥ 0.5). As in the Peruvian analysis, these variants were enriched in promoters (15.44; P < 0.001) and state-interacting eQTLs were more enriched (4.17) in T-cell-specific regions compared to non-interacting eQTLs (1.97) (both P < 0.001; one-sided P for Δint–no int < 0.001; Extended Data Fig. 8a). State-interacting and non-interacting eQTLs were both strongly enriched in assay for transposase-accessible chromatin using sequencing (ATAC-seq) peaks assayed in CD4 and CD8 subsets, which reflect a combination of promoter and distal regulatory regions48 (Extended Data Fig. 8b).
Secondary eQTL variants and their predominant state-dependent subset were also enriched in T cell ATAC-seq peaks (Extended Data Fig. 8c). Consistent with previous studies finding an overrepresentation of secondary eQTL variants in enhancers compared to promoters37, we found that secondary eQTL variants were less enriched in promoters than lead variants (1.86; P = 0.13). Their significant enrichment in T-cell-specific regulatory regions (3.01; P < 0.001), especially state-interacting secondary variants (3.60; P < 0.001; Fig. 4e), suggests cell-type-specific regulatory roles.
Modelling other dynamic eQTL landscapes
To assess the utility of this approach in mixed cell types, we applied the model to a published single-cell RNA-sequencing dataset in peripheral blood mononuclear cells (PBMCs) (n = 89), in which mRNA PCs delineated discrete cell types24. We observed that around one-third of the 962 pseudobulk eQTLs varied along the top 6 mRNA PCs and had consistent interactions with the corresponding discrete cell types (Supplementary Fig. 14, Supplementary Tables 43, 44, Methods, Supplementary Note). Conversely, we also identified eQTL interactions with more granular cell states within subsets of a larger cell type by modelling CVs defined within CD4 and CD8 T cells in the memory T cell dataset (Supplementary Fig. 15, Supplementary Tables 45, 46, Supplementary Note).
eQTL interactions with disease states
Cell states can also be defined through nonlinear trajectory or velocity analysis of cells sampled throughout perturbation or differentiation and accompanying changes in gene regulation. We demonstrated the ability of PME to model eQTLs interacting with nonlinear pseudotime computed across monocytes with a variable response to influenza A virus or mock infection24 (Supplementary Fig. 16, Supplementary Table 47, Supplementary Note).
In addition to in vitro perturbations, in vivo disease states may also correlate with eQTLs. However, disease-profiling single-cell datasets may contain relatively few cells because patient samples are scarce. We propose projecting large, genotyped single-cell datasets onto smaller disease reference datasets and using the cells’ projections in the reference’s low-dimensional embedding as cell states to test for eQTL interactions. This allows us to leverage both the large cell counts of the non-disease dataset and the clinically relevant framework of the disease reference. We demonstrated the feasibility of this approach by projecting 500,089 memory T cells onto an ulcerative colitis (UC) reference of around 70,000 colon T cells and tested our eQTLs for interactions with the UC-PCs49 (Supplementary Fig. 17a–d, Supplementary Table 48, Supplementary Note). In addition to recapitulating many interactions from the original memory T cell analysis, we observed some interactions unique to UC-PCs that define pathogenic cell states, which may reflect tissue- or disease-specific dynamics (Supplementary Fig. 17e–h).
Discussion
Single-cell data from genotyped cohorts make it possible to investigate how cell states shape the complex relationship between genetic variation, gene expression and disease. In this study, we underscore the untapped potential of these data to reveal state-dependent regulatory heterogeneity when only analysed with traditional bulk methods and emphasize the urgent need to refocus eQTL analyses at single-cell resolution.
Recognizing growing evidence that clusters obscure the functional diversity of dynamic cell types such as T cells, we leveraged the granularity of single-cell data to better define continuous state-dependent eQTLs using a single-cell Poisson model50,51. This model leverages large cell counts for power, circumventing a common limitation for previous studies that have reported mixed success using similar approaches or pseudobulk analysis23,52,53. In contrast to linear models, the PME model is robust to sparsity and hence is an essential tool to measure robust statistical interactions. When we reconstructed eQTL effects in individual cells, it was clear that they can vary even between cells in the same cluster because continuous states transcend clusters. This offers a different perspective on context-dependent disease-associated variation. For example, RA-linked rs4065275 has the strongest effect on ORMDL3 expression in GZMB+ cytotoxic CD8+ T cells, but by modelling continuous states, we see that it is driven by cytotoxicity more broadly. Loci with independent eQTLs that have opposing state-dependent effects suggest that positionally distinct state-specific regulatory elements within a locus may determine these regulatory interactions.
As more large, genotyped single-cell datasets emerge–especially from cohorts of non-European genetic ancestry, and diverse clinical phenotypes or perturbations–they will present heterogeneity beyond well-defined cell types54,55. Large cell counts and sample sizes will enable well-powered single-cell studies, but computational tractability may limit the current utility of the PME model in these settings. In our dataset of more than 500,000 cells from 259 donors, we had to restrict state-dependent analysis to pseudobulk-ascertained eQTLs, which is likely to underestimate the full scope of dynamic eQTLs by omitting certain state-dependent eQTLs obscured in pseudobulk: for example, specific to rare states or with opposing effects in different states. For the PME model to be a practical choice for genome-wide eQTL analysis, we need faster generalized linear mixed models. These analyses will also need to contend with the multiple testing burden of assessing interactions between thousands of genes and tens of cell states.
Continuous states exist in many cell types, so this approach applies to single-cell eQTL studies of functional states beyond T cells, such as spatial gradients of neurons and astrocytes, epithelial–mesenchymal transitions, Notch signalling in fibroblasts, or development1,2,9,22. Analyses in heterogeneous PBMCs suggest that gating individual cell types may be necessary before defining continuous states in a mixture of cell types, or using a decomposition method such as non-negative matrix factorization that captures cross-cell-type gradients56. The PME model is flexible enough to accommodate many types of cell states, including non-linear pseudotime along a single-cell trajectory or states imputed through projection onto a reference. Although we used multimodal CCA of gene expression and surface proteins to define continuous states, for other cell types, alternative continuous representations of cell state may be more effective. This study offers a broadly applicable template to probe single-cell regulatory heterogeneity.
Extended Data
Extended Data Fig. 1 |. Memory T cell eQTLs.
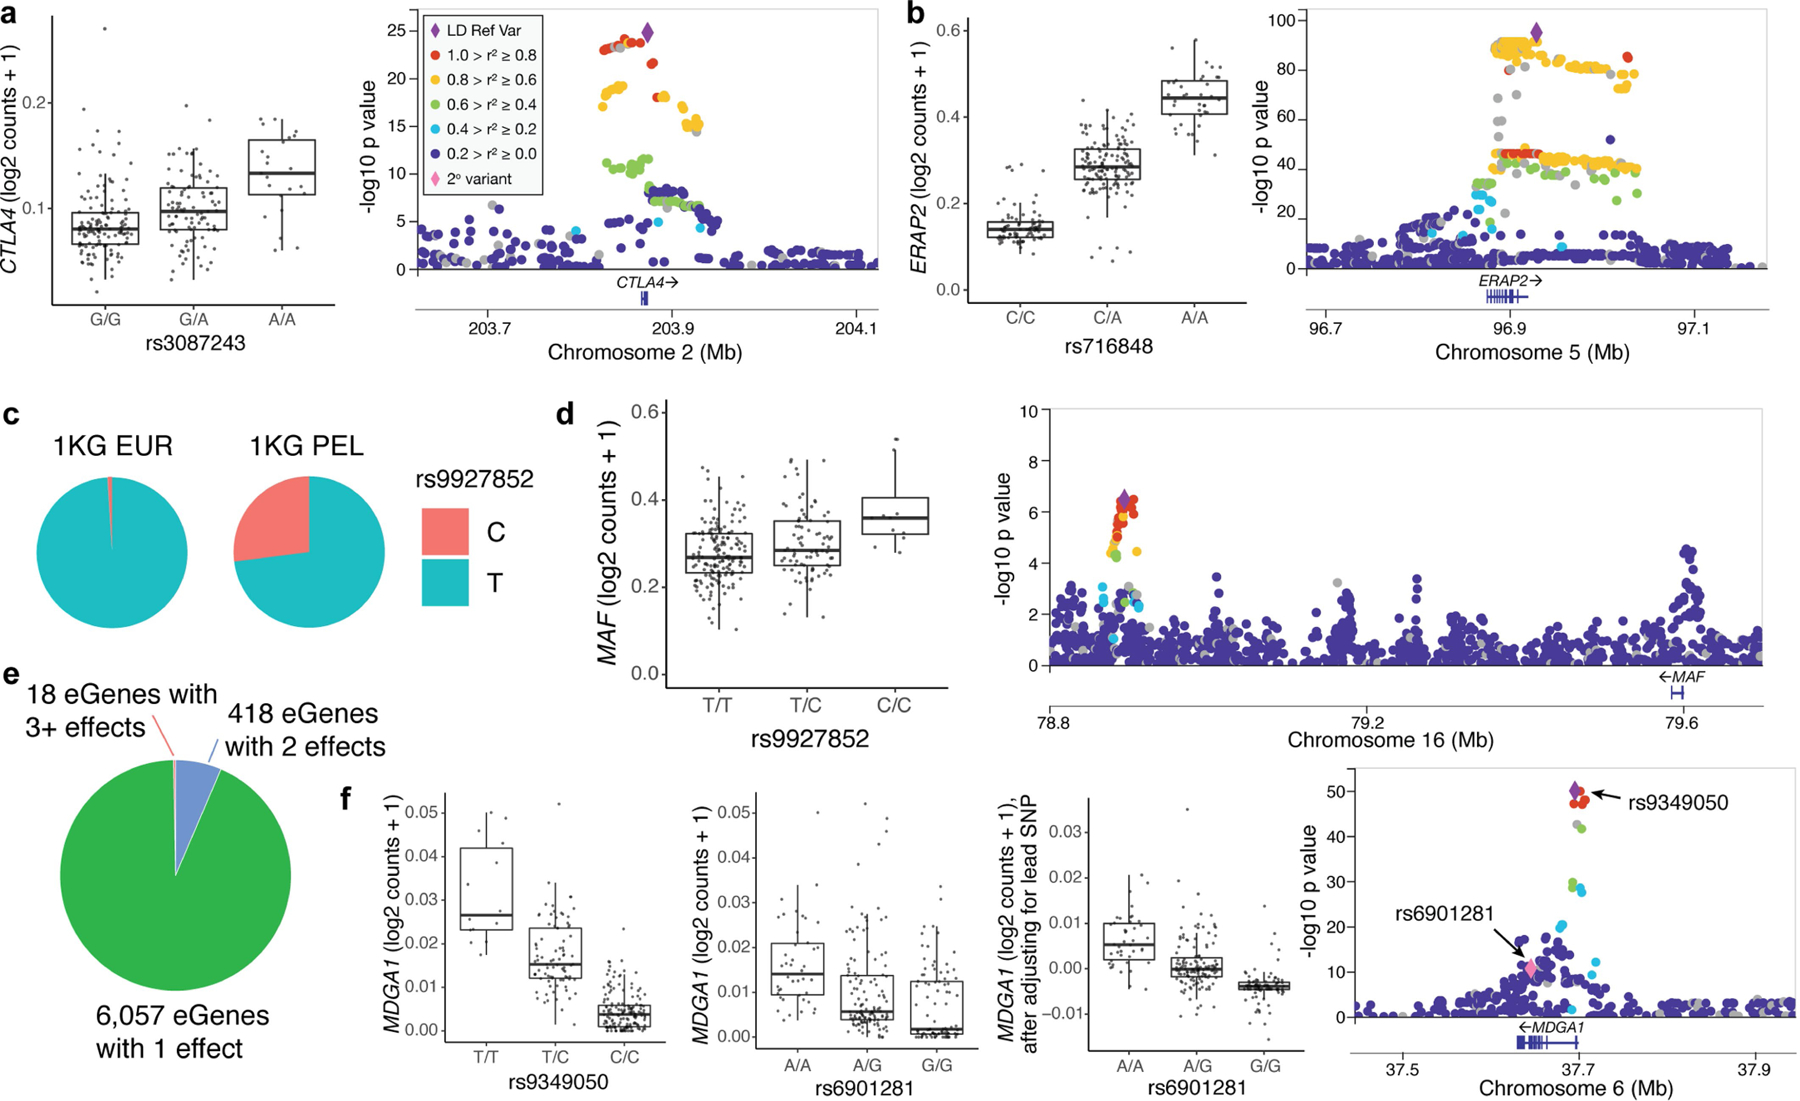
a, (left) Box plot and (right) locus plot of rs3087243 eQTL for CTLA4 and b, rs716848 eQTL for ERAP2. Except where indicated, each point in box plots (panels a, b, d, f) represents the average log2(UMI counts + 1) across all cells in a donor (n = 259), grouped by genotype. Box plots show median (horizontal bar), 25th and 75th percentiles (lower and upper bounds of the box, respectively) and 1.5 times the IQR (or minimum/maximum values if they fall within that range; end of whiskers). Each locus plot shows the variants in a +/250kb window around the TSS plotted based on their nominal pseudobulk eQTL p value and genomic coordinate. The purple diamond is the lead variant and other variants are coloured based on their r2 with the lead variant in 1000 Genomes AMR (American ancestry, including Puerto Rican in Puerto Rico, Colombian in Medellín, Peruvian in Lima, and Mexican ancestry in Los Angeles). c, Pie charts of the allele frequencies at rs9927852 in 1000 Genomes EUR (European) and PEL populations. d, Box plot and locus plot of rs9927852 eQTL for MAF (n = 259). e, Number of eGenes with 1, 2, or 3+ independent eQTLs. f, Box plots for lead (rs9349050, left) secondary (rs6901281, middle), and secondary conditioned on lead (right) eQTL variants for MDGA1. In the box plot for rs6901281 conditioned on rs9349050, each point represents the average residual of log2(UMI counts + 1) after regressing out genotype at rs9349050 across all cells in a donor (n = 259). In the locus plot, the pink diamond is the secondary variant.
Extended Data Fig. 2 |. Concordance of published bulk T cell eQTLs and Peruvian (pseudo)bulk memory T cell eQTLs.
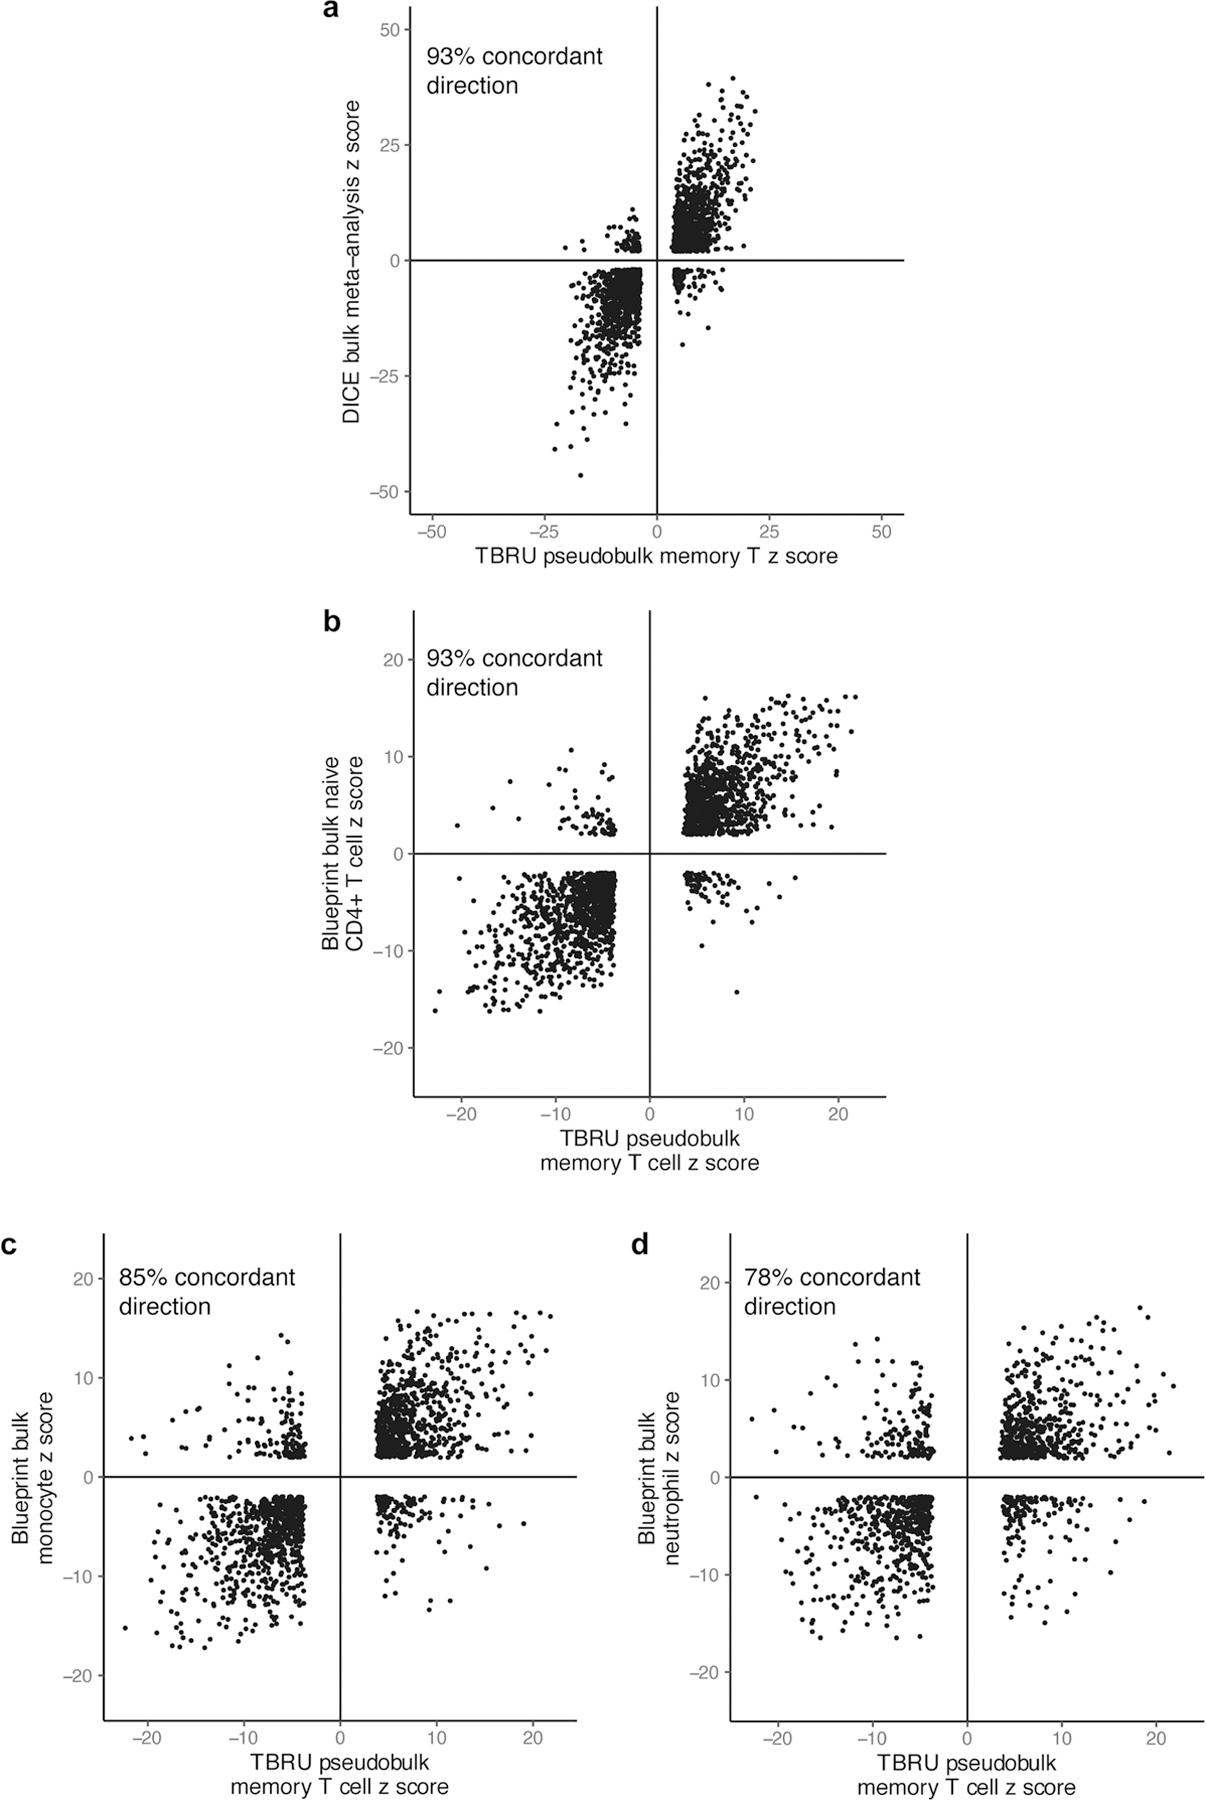
Z scores of β values from pseudobulk analysis of Peruvian dataset compared to z scores from a, inverse-variance-weighted meta-analysis of memory T cell subsets in DICE, b, BLUEPRINT bulk eQTL analysis of naïve CD4+ T cells, c, BLUEPRINT bulk eQTL analysis of monocytes, and d, BLUEPRINT bulk eQTL analysis of neutrophils. Each point represents an eGene/Peruvian lead variant pair significant in both datasets (q < 0.05).
Extended Data Fig. 3 |. Assessing the robustness of the single-cell Poisson model.
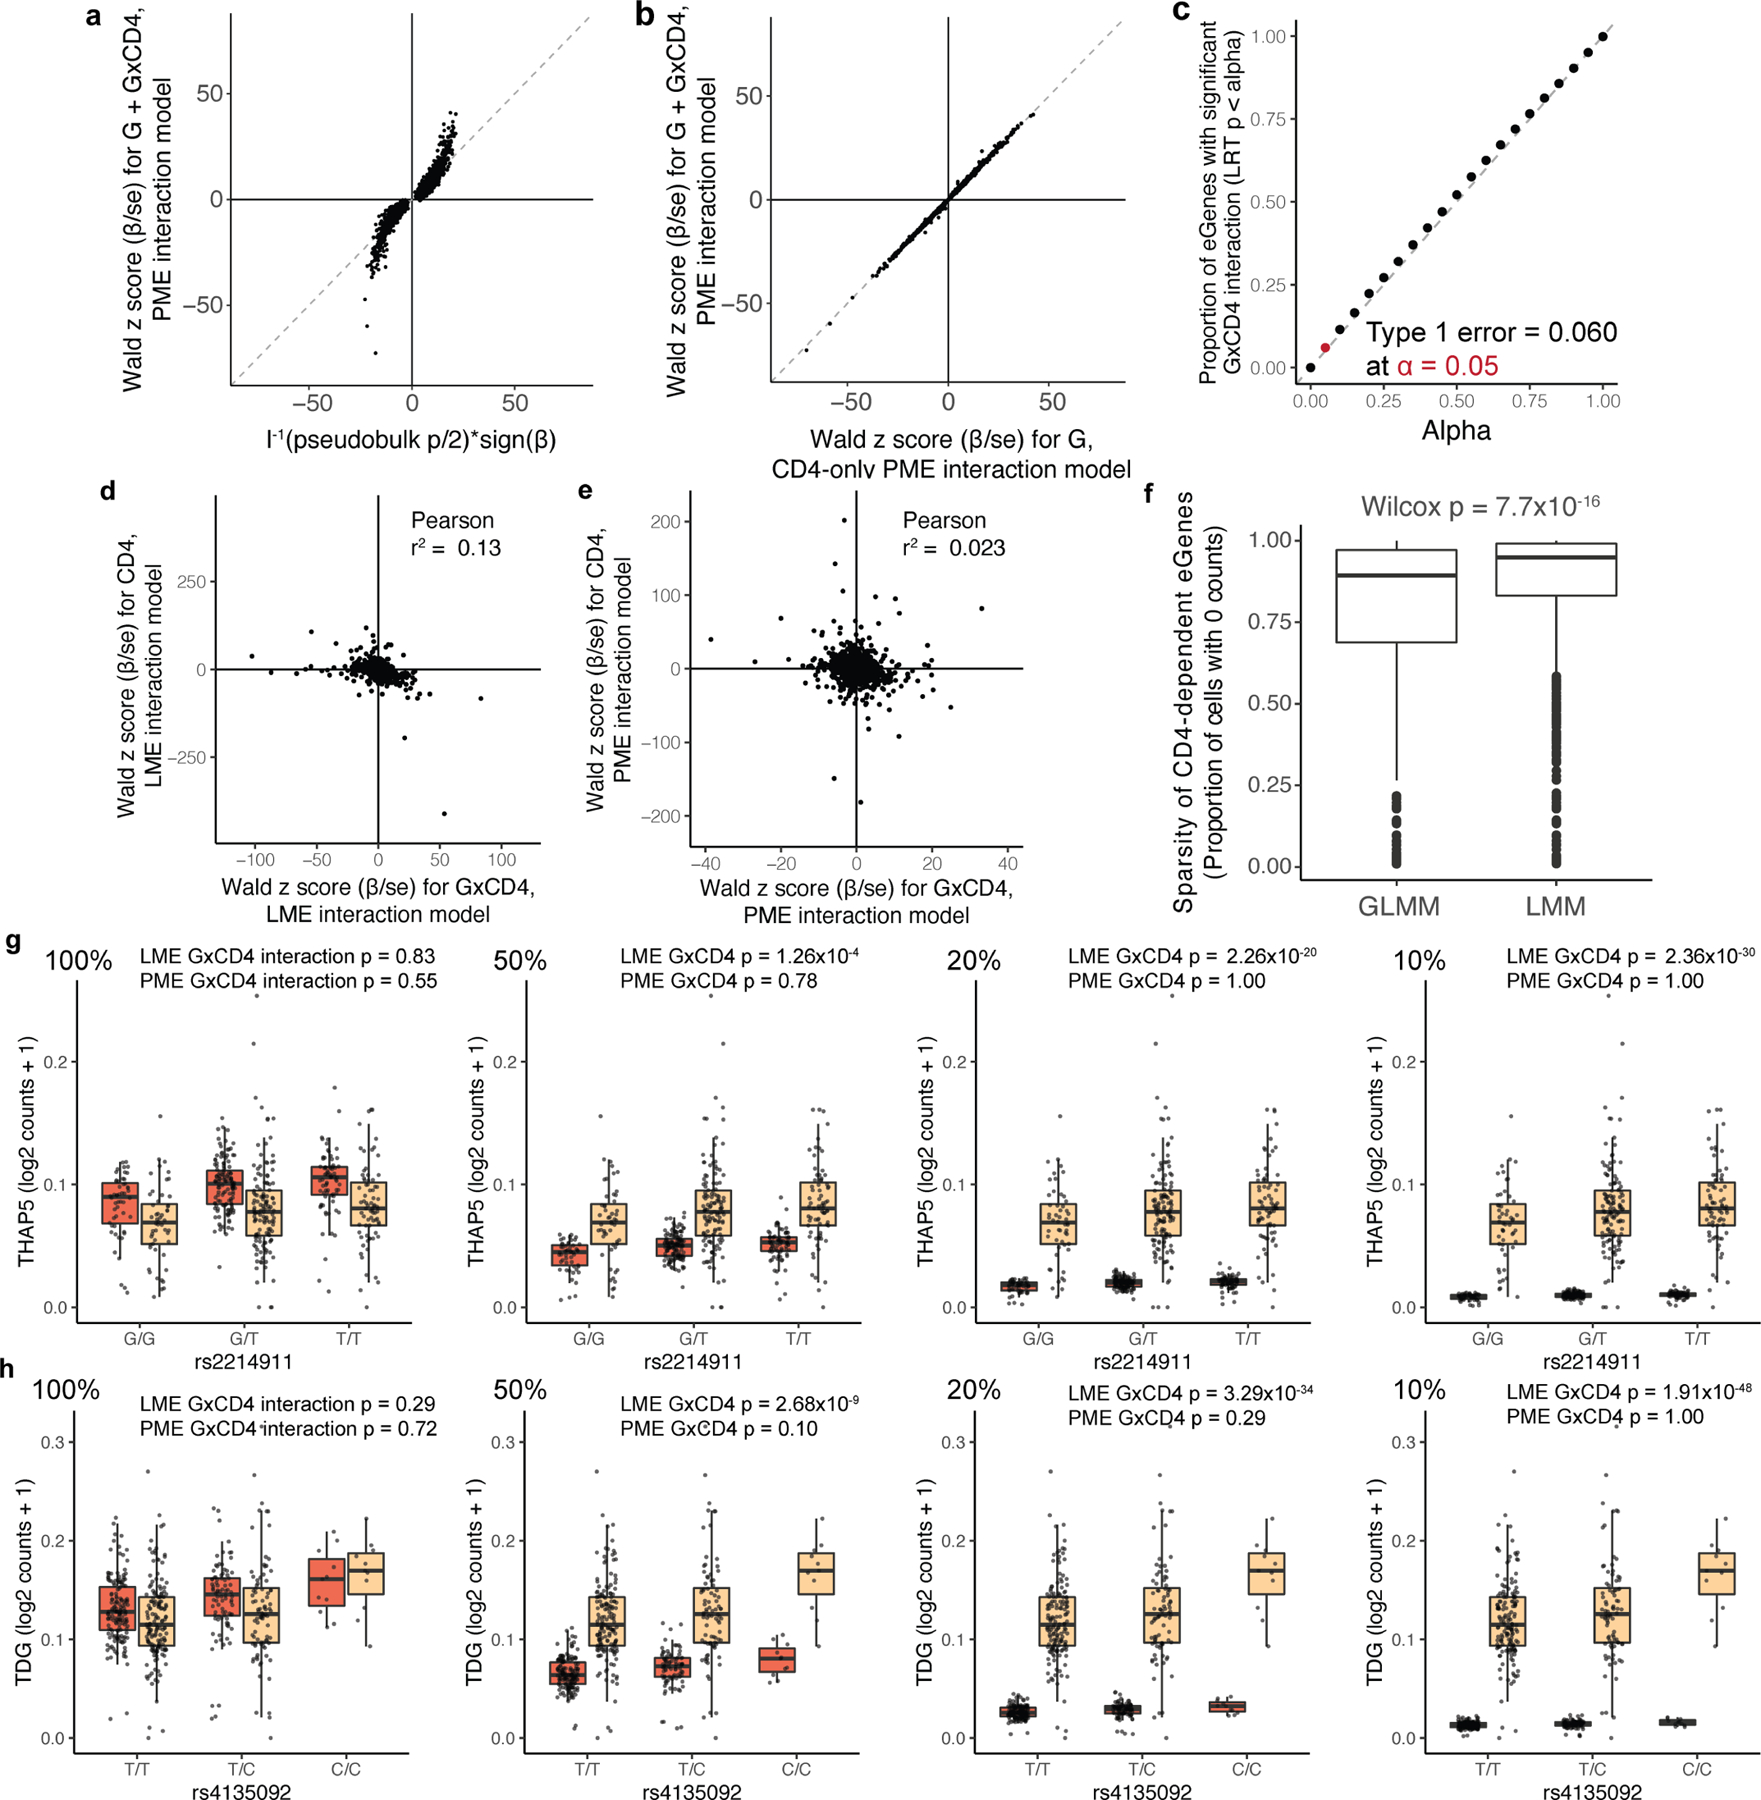
a, b, Dot plot of each memory-T-cell eGene based on Wald z score for total β (βG+βG×CD4) in PME interaction model of all cells and LRT-based statistic from a, pseudobulk model or b, Wald z score for βG from a PME model of only CD4+ cells. c, Proportion of eGenes with significant βG×CD4 under genotype permutation. Each dot represents the proportion significant at the given alpha threshold. d, e, Dot plot of memory-T-cell eGenes (n = 6,511) based on z score for cell state β (βCD4 or βCD8) and z score for cell state interaction β (βG×CD4 or βG×CD8) in d, LME and e, PME models. f, Box plot of sparsity of eGenes with significant CD4 interactions (q < 0.05) in GLMM or LMM. P value is from a two-sided Wilcoxon rank-sum test (nGLMM = 612 genes, nLMM = 1214 genes). Each point represents a gene and box plots show median (horizontal bar), 25th and 75th percentiles (lower and upper bounds of the box, respectively) and 1.5 times the IQR (or minimum/maximum values if they fall within that range; end of whiskers). g, rs2214911 eQTL for THAP5 and h, rs4135092 eQTL for TDG in CD4+ (orange) and CD8+ (beige) cells. Box plots show the eQTL effects as per-cell gene expression decreased from 100% to 50, 20, and 10 percent in CD4+ cells (left to right). Each point represents the average log2(UMI counts + 1) across all cells in the indicated subset of cells in a donor (n = 259), grouped by genotype. Box plots show median (horizontal bar), 25th and 75th percentiles (lower and upper bounds of the box, respectively) and 1.5 times the IQR (or minimum/maximum values if they fall within that range; end of whiskers).
Extended Data Fig. 4 |. Concordance between eQTL interactions with continuous and discrete states.
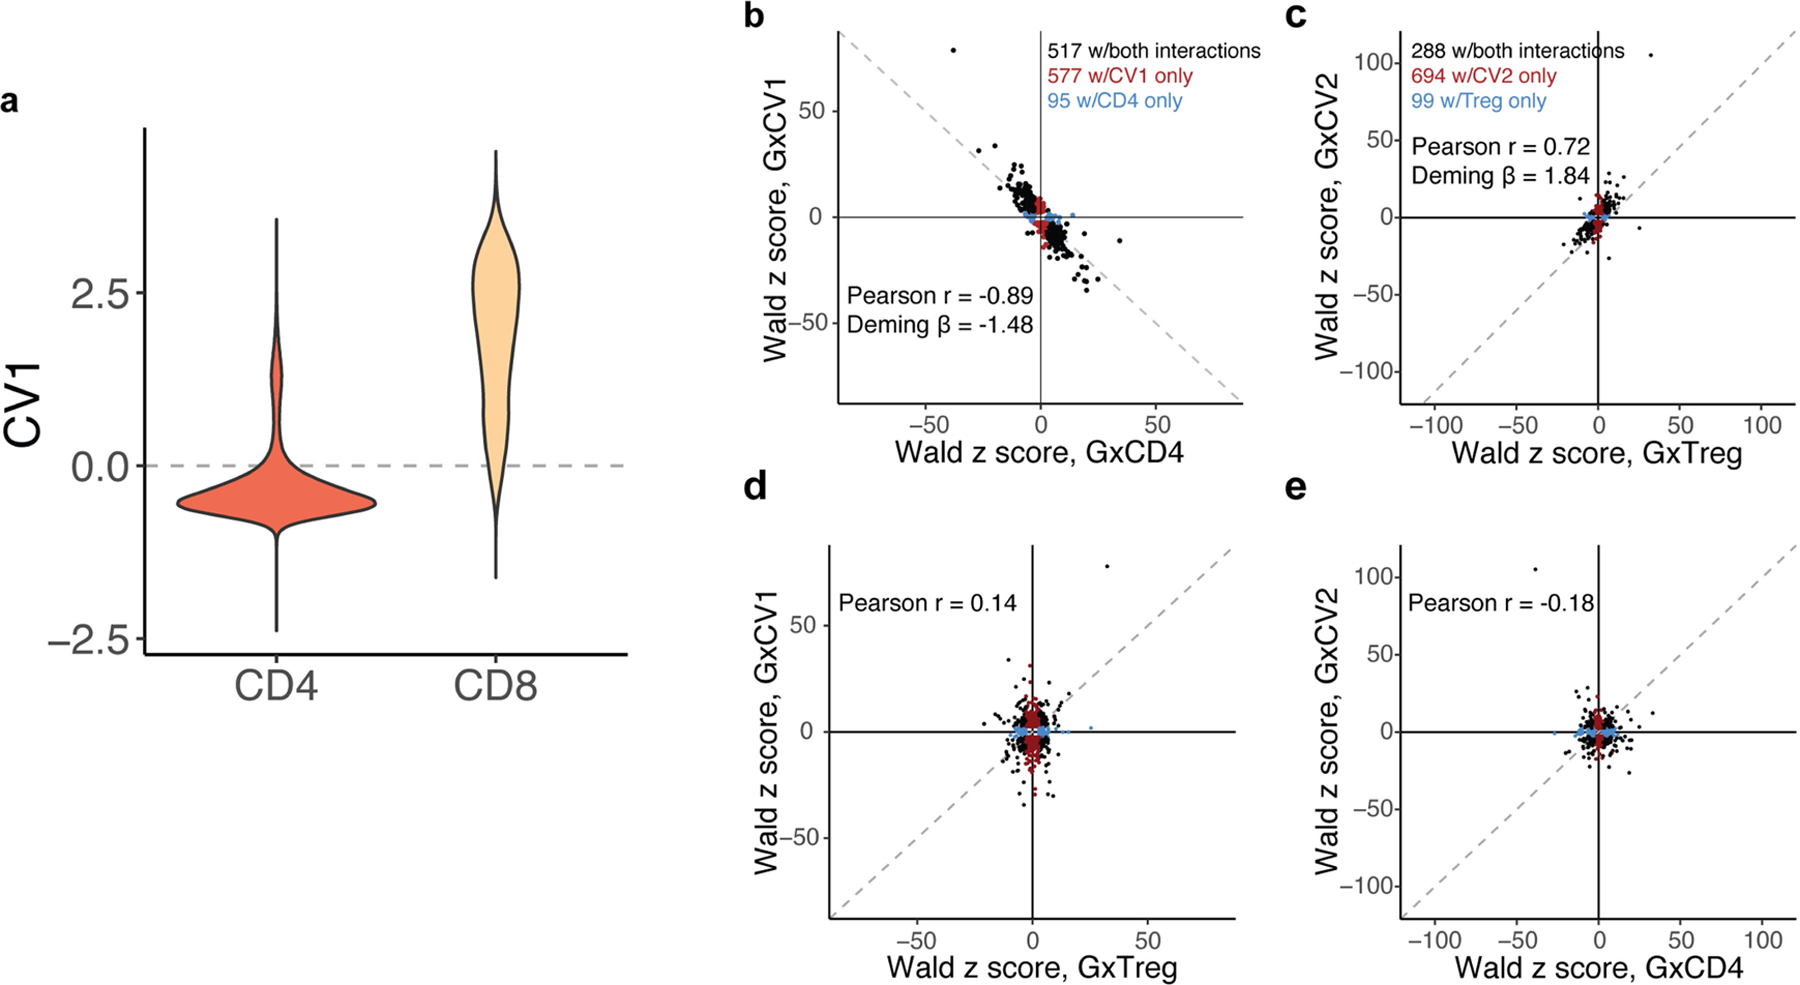
a, Distribution of CV1 scores for cells in CD4+ and CD8+ gates. Dashed line represents CV1 = 0. b-e, Dot plots of eGenes’ Wald z scores of genotype interactions with b, CV1 and CD4+, c, CV2 and Treg, d, CV1 and Treg, or CV2 and CD4+. Dashed line represents the identity line. Only eGenes with significant interaction (LRT q < 0.05) are plotted in b and c. Black dots represent eGenes significantly interacting with both continuous and discrete states, red dots are only significantly interacting with continuous state, and blue dots are only significantly interacting with discrete state. r is calculated as the Pearson correlation coefficient.
Extended Data Fig. 5 |. Cell-state-dependent eQTL interactions with continuous CVs.
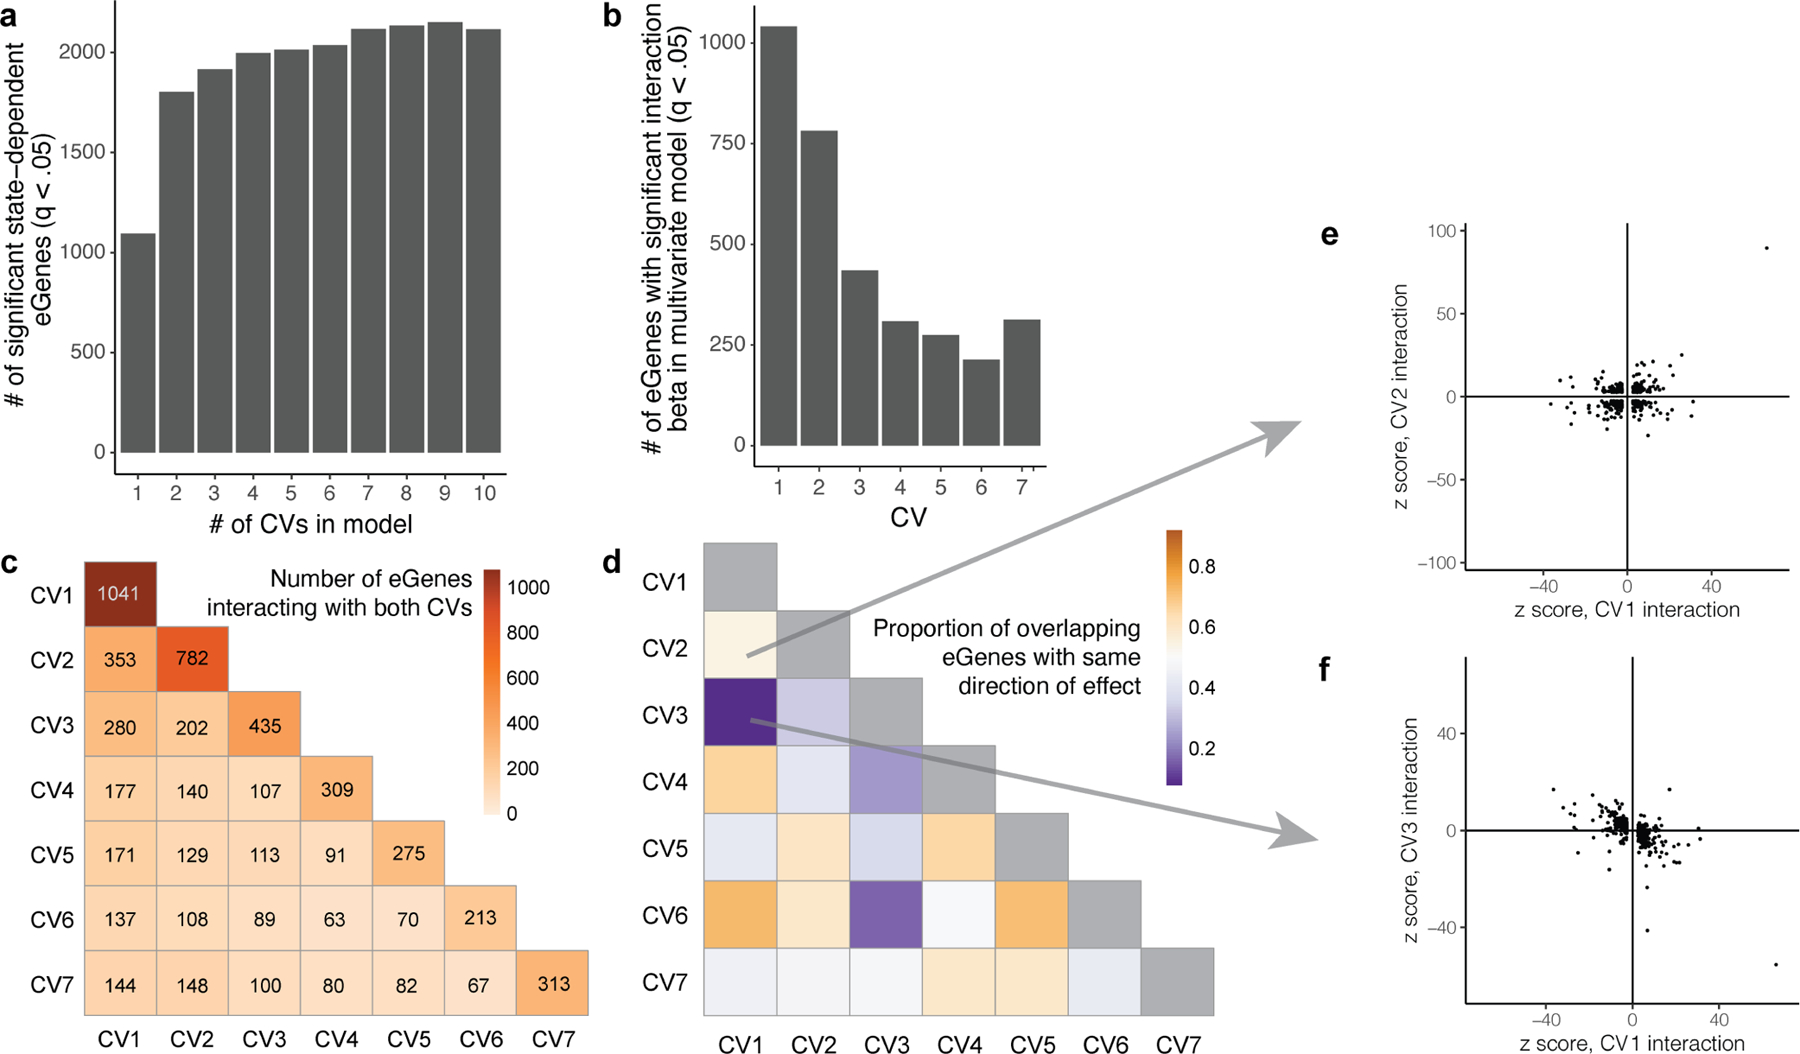
a, Number of significant eGenes (LRT q < 0.05) detected by PME interaction models with increasing numbers of CVs. b, Number of eGenes with significant interaction with each CV in a multivariate PME model with 7 CVs. c, Heat map of the number of eGenes with significant interactions with pairs of CVs in the multivariate model. Boxes along the diagonal reflect the total number of eGenes interacting with the corresponding CV. d, Proportion of eGenes in c with the same direction of effect. e, eGenes with significant interactions with either CV1 or CV2 plotted based on Wald z scores with CV2 and CV1. f, eGenes with significant interactions with either CV1 or CV3 plotted based on Wald z scores with CV3 and CV1.
Extended Data Fig. 6 |. Opposite interaction directions for independent variants in a locus.
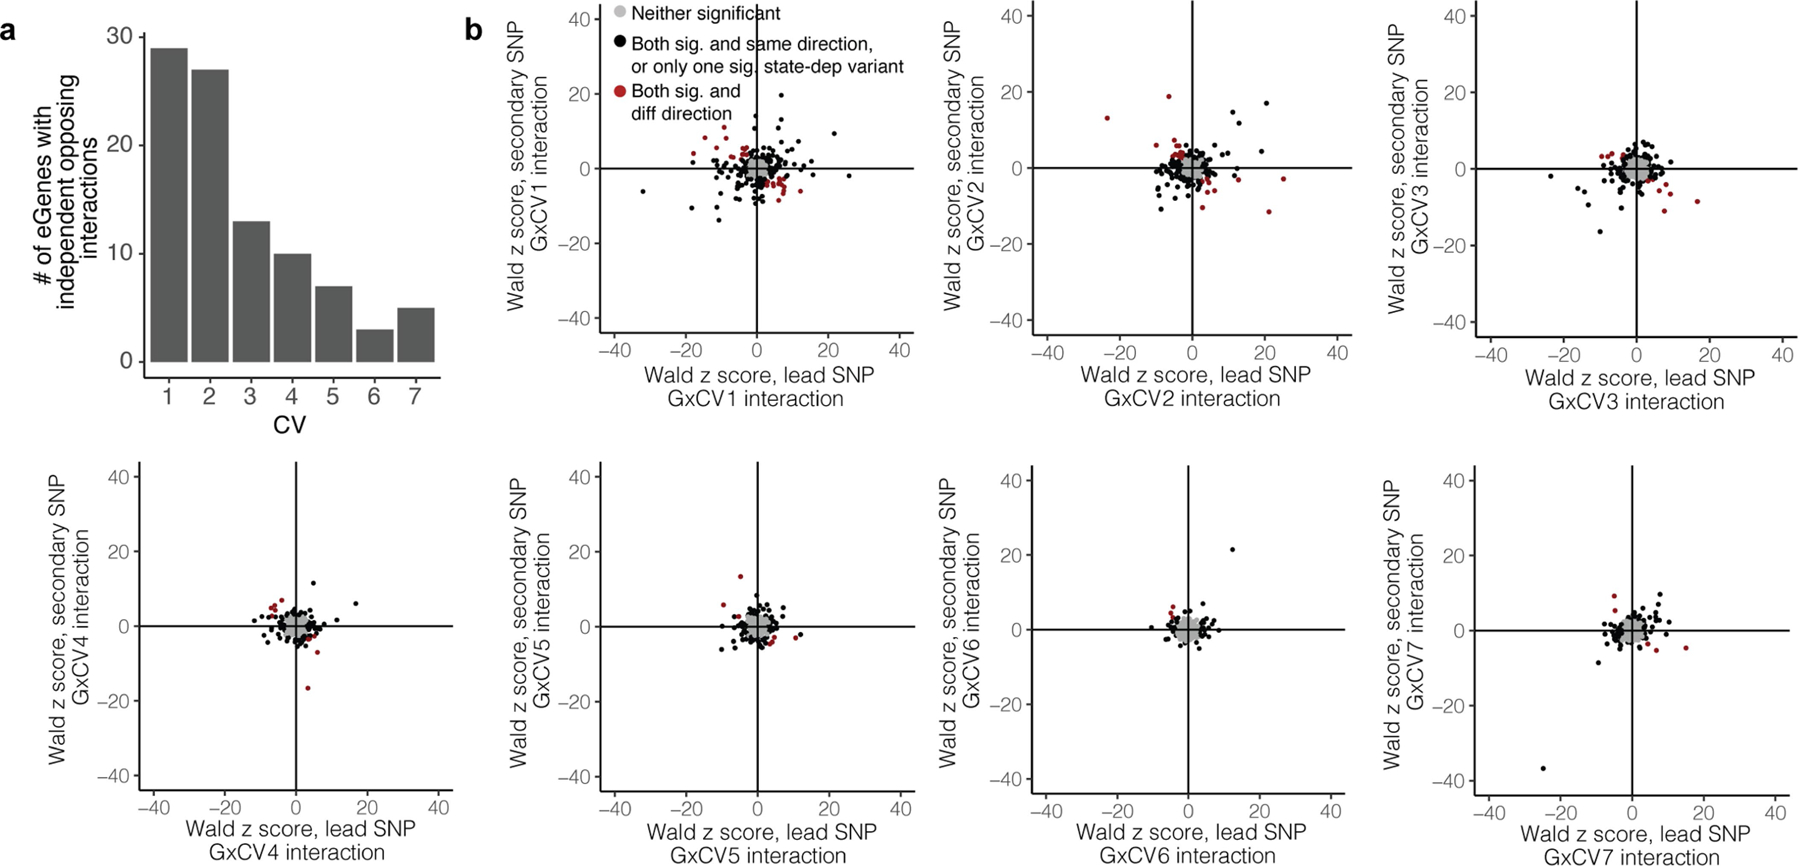
a, Bar plot of the number of eGenes for which the lead and secondary variants have opposite directions of interaction effect for each of the seven CVs. b, Comparison of interaction effect direction for lead and secondary variants for each of 436 eGenes with 2+ independent eQTLs. Each plot corresponds to one CV, from CV1 to CV7. Each point represents an eGene. For eGenes in grey, neither lead nor secondary variant was significantly dependent on the given CV state. For eGenes in black, either only one of the two eQTLs was significantly dependent on the CV, or both were significantly state-dependent with the same direction of effect. For eGenes in red, both lead and secondary variants were significantly state-dependent but with different directions of interaction with the given CV.
Extended Data Fig. 7 |. Enrichment of eQTLs in disease-associated variants.

a, Dot plot of traits from the GWAS catalogue plotted based on the −log(Fisher p value) and odds ratio of the enrichment test comparing the proportion of GWAS variants colocalizing with memory-T cell eQTLs for one trait compared to all other traits. Labelled traits have p < 10−5. b, Dot plot of traits from the GWAS catalogue plotted based on the number of GWAS variants overlapping state-dependent eQTLs compared to the total number of GWAS variants overlapping eQTLs. Overlap was defined by r2 > 0.5. The dashed line represents the overall proportion of state-dependent eQTLs (2,117/6,511 = 0.33) and labelled traits have Fisher p < 0.005. c, Dot plot of traits plotted based on the number of GWAS variants colocalizing with state-dependent eQTLs compared to the total number of GWAS variants colocalizing with eQTLs under the Bayesian coloc model. The dashed line represents the overall proportion of state-dependent eQTLs (2,117/6,511 = 0.33) and traits outlined in red are significantly enriched at Fisher p < 0.01. AD=Atopic dermatitis, AS=Ankylosing spondylitis, SLE=Systemic lupus erythematosus, T(1/2)D=Type 1/2 diabetes, RA=Rheumatoid arthritis, CAD=Coronary artery disease, MS=Multiple sclerosis, IBD=Inflammatory bowel disease, CD=Crohn’s disease.
Extended Data Fig. 8 |. Additional regulatory region enrichment of eQTL effects.
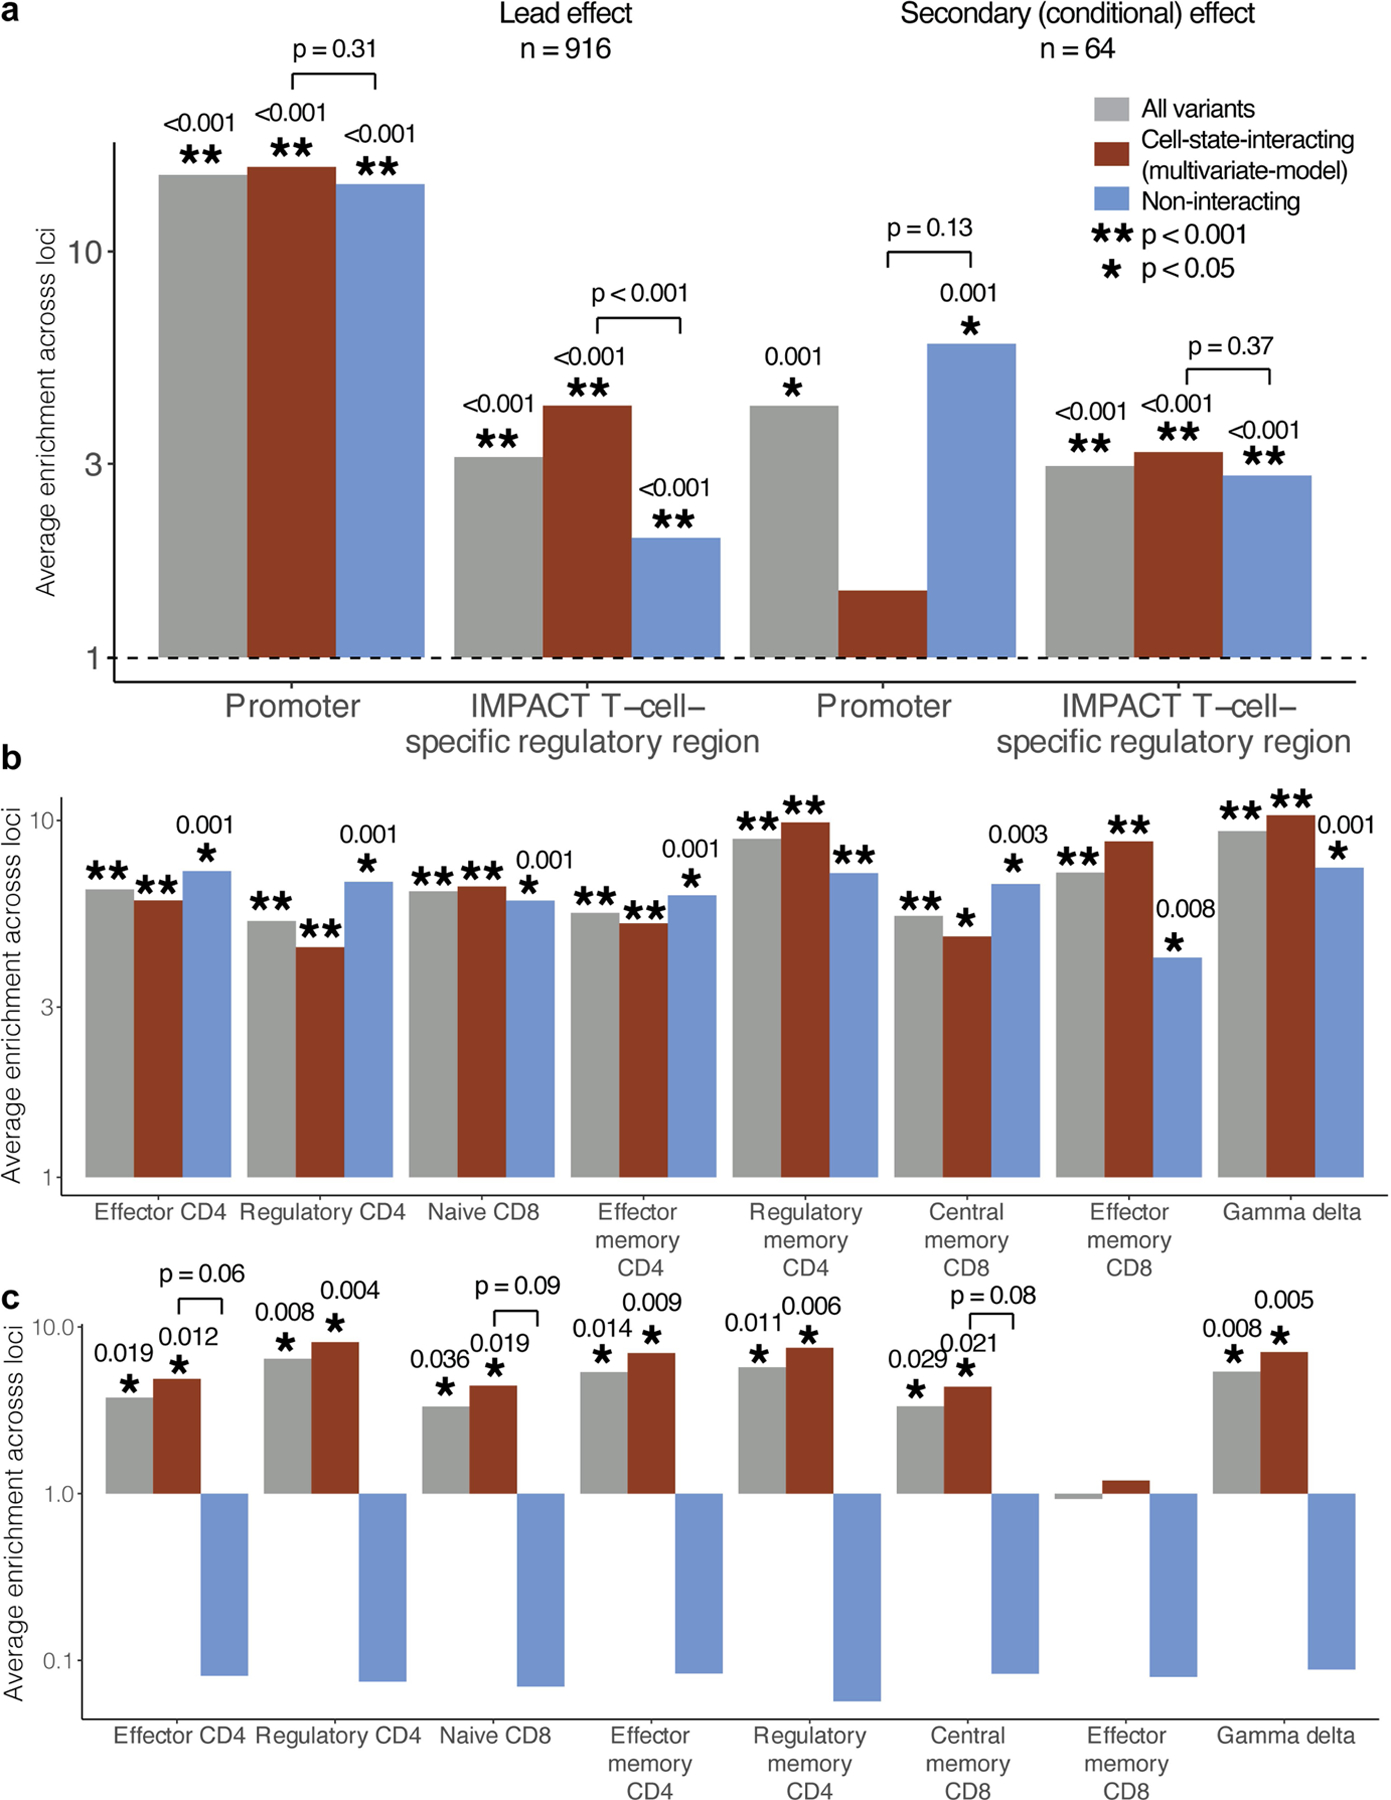
a, We calculated the enrichment of lead effects or independent secondary (conditional) effects in promoter or T-cell-specific regulatory regions. Analysis was limited to loci that were also significant eGenes in Peruvian analysis and where at least one variant had PIP > = 0.5. b, We calculated the enrichment of lead effects and c, secondary effects in ATAC-seq peaks from Calderon, et al. 2019. Peaks were binarized as present or not in each sample at a threshold of > 5 CPM. In all plots, the height of the grey bar corresponds to the average enrichment calculated across all loci containing a variant with PIP < 0.05, red bar corresponds to the subset with significant cell-state interaction (LRT q < 0.05 in multivariate model with 7 CVs), and the blue bar corresponds to the subset without significant cell-state interaction. Bars with p > = 0.001 (limit of 1,000 permutations) are labelled with their one-sided p-value and with corresponding asterisks. Each pair of interacting/non-interacting bars is labelled with a one-sided permutation p value for the difference (interacting minus non-interacting; only labelled if p < 0.1 for the ATAC-seq analysis). The grey dotted line indicates enrichment statistic = 1.
Supplementary Material
Acknowledgements
We thank H. E. Randolph and L. B. Barreiro for sharing insights and access to and the influenza PBMC dataset. This work is supported in part by funding from the National Institutes of Health (U19AI111224, UH2AR067677, T32HG002295, T32AR007530, U01HG009379, R01AI049313, R01AR063759 and U01HG012009)
Footnotes
Online content
Any methods, additional references, Nature Research reporting summaries, source data, extended data, supplementary information, acknowledgements, peer review information; details of author contributions and competing interests; and statements of data and code availability are available at https://doi.org/10.1038/s41586-022-04713-1.
Reporting summary
Further information on research design is available in the Nature Research Reporting Summary linked to this paper.
Code availability
Scripts to reproduce analyses are available on GitHub (https://github.com/immunogenomics/sceQTL) and Zenodo (https://doi.org/10.5281/zenodo.6216850).
Additional information
Supplementary information The online version contains supplementary material available at https://doi.org/10.1038/s41586-022-04713-1.
Peer review information Nature thanks Benjamin Fairfax and the other, anonymous, reviewer(s) for their contribution to the peer review of this work. Peer reviewer reports are available.
Competing interests The authors declare no competing interests.
Data availability
The single-cell mRNA and surface protein data that support the findings of this study were published previously and are available in the Gene Expression Omnibus (GSE158769) and in dbGaP (phs002467). Genotype data were also previously published and are available in the Database of Genotypes and Phenotypes (dbGaP) (phs002025, for authorized general research use). We also used published datasets for validation and additional analyses: DICE (https://dice-database.org/downloads), BLUEPRINT (http://dcc.blueprint-epigenome.eu/), ref. 48 (GSE118189), ref. 24 (https://doi.org/10.5281/zenodo.4273999) and ref. 49 (Single Cell Portal accession SCP259).
References
- 1.Wei K et al. Notch signalling drives synovial fibroblast identity and arthritis pathology. Nature 582, 259–264 (2020). [DOI] [PMC free article] [PubMed] [Google Scholar]
- 2.Cembrowski MS & Menon V Continuous variation within cell types of the nervous system. Trends Neurosci 41, 337–348 (2018). [DOI] [PubMed] [Google Scholar]
- 3.Maurano MT et al. Systematic localization of common disease-associated variation in regulatory DNA. Science 337, 1190–1195 (2012). [DOI] [PMC free article] [PubMed] [Google Scholar]
- 4.Chun S et al. Limited statistical evidence for shared genetic effects of eQTLs and autoimmune-disease-associated loci in three major immune-cell types. Nat. Genet 49, 600–605 (2017). [DOI] [PMC free article] [PubMed] [Google Scholar]
- 5.Umans BD, Battle A & Gilad Y Where are the disease-associated eQTLs? Trends Genet 37, 109–124 (2021). [DOI] [PMC free article] [PubMed] [Google Scholar]
- 6.Gutierrez-Arcelus M et al. Allele-specific expression changes dynamically during T cell activation in HLA and other autoimmune loci. Nat. Genet 52, 247–253 (2020). [DOI] [PMC free article] [PubMed] [Google Scholar]
- 7.Davenport EE et al. Discovering in vivo cytokine–eQTL interactions from a lupus clinical trial. Genome Biol 19, 168 (2018). [DOI] [PMC free article] [PubMed] [Google Scholar]
- 8.Strober BJ et al. Dynamic genetic regulation of gene expression during cellular differentiation. Science 364, 1287–1290 (2019). [DOI] [PMC free article] [PubMed] [Google Scholar]
- 9.Cuomo ASE et al. Single-cell RNA-sequencing of differentiating iPS cells reveals dynamic genetic effects on gene expression. Nat. Commun 11, 810 (2020). [DOI] [PMC free article] [PubMed] [Google Scholar]
- 10.Zhernakova DV et al. Identification of context-dependent expression quantitative trait loci in whole blood. Nat. Genet 49, 139–145 (2017). [DOI] [PubMed] [Google Scholar]
- 11.Moore R et al. A linear mixed-model approach to study multivariate gene-environment interactions. Nat. Genet 51, 180–186 (2019). [DOI] [PMC free article] [PubMed] [Google Scholar]
- 12.Kim-Hellmuth S et al. Cell type-specific genetic regulation of gene expression across human tissues. Science 369, eaaz8528 (2020). [DOI] [PMC free article] [PubMed] [Google Scholar]
- 13.Raj T et al. Polarization of the effects of autoimmune and neurodegenerative risk alleles in leukocytes. Science 344, 519–523 (2016). [DOI] [PMC free article] [PubMed] [Google Scholar]
- 14.Trynka G et al. Chromatin marks identify critical cell types for fine mapping complex trait variants. Nat Genet 45, 124–130 (2013). [DOI] [PMC free article] [PubMed] [Google Scholar]
- 15.Farh KH et al. Genetic and epigenetic fine mapping of causal autoimmune disease variants. Nature 518, 337–343 (2014). [DOI] [PMC free article] [PubMed] [Google Scholar]
- 16.Wambre E et al. A phenotypically and functionally distinct human TH2 cell subpopulation is associated with allergic disorders. Sci. Transl. Med 9, eaam9171 (2017). [DOI] [PMC free article] [PubMed] [Google Scholar]
- 17.Arlehamn CL et al. Transcriptional profile of tuberculosis antigen-specific T cells reveals novel multifunctional features. J. Immunol 193, 2931–2940 (2014). [DOI] [PMC free article] [PubMed] [Google Scholar]
- 18.Eizenberg-Magar I et al. Diverse continuum of CD4+ T-cell states is determined by hierarchical additive integration of cytokine signals. Proc. Natl Acad. Sci. USA 114, E6447–E6456 (2017). [DOI] [PMC free article] [PubMed] [Google Scholar]
- 19.Annunziato F, Cosmi L, Liotta F, Maggi E & Romagnini S Defining the human T helper 17 cell phenotype. Trends Immunol 33, 505–512 (2012). [DOI] [PubMed] [Google Scholar]
- 20.Kiner E et al. Gut CD4+ T cell phenotypes are a continuum molded by microbes, not by TH archetypes. Nat. Immunol 22, 216–228 (2021). [DOI] [PMC free article] [PubMed] [Google Scholar]
- 21.van der Wijst MGP et al. Single-cell RNA sequencing identifies celltype-specific cis-eQTLs and co-expression QTLs. Nat. Genet 50, 493–497 (2018). [DOI] [PMC free article] [PubMed] [Google Scholar]
- 22.Jerber J et al. Population-scale single-cell RNA-seq profiling across dopaminergic neuron differentiation. Nat. Genet 53, 304–312 (2021). [DOI] [PMC free article] [PubMed] [Google Scholar]
- 23.Neavin D et al. Single cell eQTL analysis identifies cell type-specific genetic control of gene expression in fibroblasts and reprogrammed induced pluripotent stem cells. Genome Biol 22, 76 (2021). [DOI] [PMC free article] [PubMed] [Google Scholar]
- 24.Randolph HE et al. Genetic ancestry effects on the response to viral infection are pervasive but cell type specific. Science 374, 1127–1133 (2021). [DOI] [PMC free article] [PubMed] [Google Scholar]
- 25.Nathan A et al. Multimodally profiling memory T cells from a tuberculosis cohort identifies cell state associations with demographics, environment and disease. Nat. Immunol 22, 781–793 (2021). [DOI] [PMC free article] [PubMed] [Google Scholar]
- 26.Luo Y et al. Early progression to active tuberculosis is a highly heritable trait driven by 3q23 in Peruvians. Nat. Commun 10, 3765 (2019). [DOI] [PMC free article] [PubMed] [Google Scholar]
- 27.Chen L et al. Genetic drivers of epigenetic and transcriptional variation in human immune cells. Cell 167, 1398–1414 (2016). [DOI] [PMC free article] [PubMed] [Google Scholar]
- 28.Kasela S et al. Pathogenic implications for autoimmune mechanisms derived by comparative eQTL analysis of CD4+ versus CD8+ T cells. PLoS Genet 13, e1006643 (2017). [DOI] [PMC free article] [PubMed] [Google Scholar]
- 29.GTEx Consortium. The GTEx Consortium atlas of genetic regulatory effects across human tissues. Science 369, 1318–1330 (2020). [DOI] [PMC free article] [PubMed] [Google Scholar]
- 30.The 1000 Genomes Project Consortium. A global reference for human genetic variation. Nature 526, 68–74 (2015). [DOI] [PMC free article] [PubMed] [Google Scholar]
- 31.Schmiedel BJ et al. Impact of genetic polymorphisms on human immune cell gene expression. Cell 175, 1701–1715 (2018). [DOI] [PMC free article] [PubMed] [Google Scholar]
- 32.Rothenberg EV & Taghon T Molecular genetics of T cell development. Annu. Rev. Immunol 23, 601–649 (2005). [DOI] [PubMed] [Google Scholar]
- 33.Townes FW, Hicks SC, Aryee MJ & Irizarry RA Feature selection and dimension reduction for single-cell RNA-seq based on a multinomial model. Genome Biol 20, 295 (2019). [DOI] [PMC free article] [PubMed] [Google Scholar]
- 34.Sarkar A & Stephens M Separating measurement and expression models clarifies confusion in single-cell RNA sequencing analysis. Nat. Genet 53, 770–777 (2021). [DOI] [PMC free article] [PubMed] [Google Scholar]
- 35.Hafemeister C & Satija R Normalization and variance stabilization of single-cell RNA-seq data using regularized negative binomial regression. Genome Biol 20, 296 (2019). [DOI] [PMC free article] [PubMed] [Google Scholar]
- 36.Heinz S et al. Simple combinations of lineage-determining transcription factors prime cis-regulatory elements required for macrophage and B cell identities. Mol. Cell 38, 576–589 (2010). [DOI] [PMC free article] [PubMed] [Google Scholar]
- 37.Dobbyn A et al. Landscape of conditional eQTL in dorsolateral prefrontal cortex and co-localization with schizophrenia GWAS. Am. J. Hum. Genet 102, 1169–1184 (2018). [DOI] [PMC free article] [PubMed] [Google Scholar]
- 38.Buniello A et al. The NHGRI-EBI GWAS Catalog of published genome-wide association studies, targeted arrays and summary statistics 2019. Nucleic Acids Res 47, D1005–D1012 (2019). [DOI] [PMC free article] [PubMed] [Google Scholar]
- 39.Okada Y et al. Genetics of rheumatoid arthritis contributes to biology and drug discovery. Nature 506, 376–381 (2014). [DOI] [PMC free article] [PubMed] [Google Scholar]
- 40.Giambartolomei C et al. Bayesian test for colocalisation between pairs of genetic association studies using summary statistics. PLoS Genet 10, e1004383 (2014). [DOI] [PMC free article] [PubMed] [Google Scholar]
- 41.Laufer VA et al. Genetic influences on susceptibility to rheumatoid arthritis in African-Americans. Hum. Mol. Genet 28, 858–874 (2019). [DOI] [PMC free article] [PubMed] [Google Scholar]
- 42.Liu JZ et al. Association analyses identify 38 susceptibility loci for inflammatory bowel disease and highlight shared genetic risk across populations. Nat. Genet 47, 979–986 (2015). [DOI] [PMC free article] [PubMed] [Google Scholar]
- 43.Stahl EA et al. Genome-wide association study meta-analysis identifies seven new rheumatoid arthritis risk loci. Nat. Genet 42, 508–514 (2010). [DOI] [PMC free article] [PubMed] [Google Scholar]
- 44.Heintzman ND et al. Histone modifications at human enhancers reflect global cell type-specific gene expression. Nature 459, 108–112 (2009). [DOI] [PMC free article] [PubMed] [Google Scholar]
- 45.Hormozdiari F, Kostem E, Kang EY, Pasaniuc B & Eskin E Identifying causal variants at loci with multiple signals of association. Genetics 198, 497–508 (2014). [DOI] [PMC free article] [PubMed] [Google Scholar]
- 46.Amariuta T et al. IMPACT: genomic annotation of cell-state-specific regulatory elements inferred from the epigenome of bound transcription factors. Am. J. Hum. Genet 104, 879–895 (2019). [DOI] [PMC free article] [PubMed] [Google Scholar]
- 47.Zaitlen N, Pasaniuc B, Gur T, Ziv E & Halperin E Leveraging genetic variability across populations for the identification of causal variants. Am. J. Hum. Genet 86, 23–33 (2010). [DOI] [PMC free article] [PubMed] [Google Scholar]
- 48.Calderon D et al. Landscape of stimulation-responsive chromatin across diverse human immune cells. Nat. Genet 51, 1494–1505 (2019). [DOI] [PMC free article] [PubMed] [Google Scholar]
- 49.Smillie CS et al. Intra- and inter-cellular rewiring of the human colon during ulcerative colitis. Cell 178, 714–730 (2019). [DOI] [PMC free article] [PubMed] [Google Scholar]
- 50.Reshef YA et al. Co-varying neighborhood analysis identifies cell populations associated with phenotypes of interest from single-cell transcriptomics. Nat. Biotechnol 40, 355–363 (2022). [DOI] [PMC free article] [PubMed] [Google Scholar]
- 51.Burkhardt DB et al. Quantifying the effect of experimental perturbations at single-cell resolution. Nat. Biotechnol 39, 619–629 (2021). [DOI] [PMC free article] [PubMed] [Google Scholar]
- 52.Ben-David E et al. Whole-organism eQTL mapping at cellular resolution with single-cell sequencing. eLife 10, e65857 (2021). [DOI] [PMC free article] [PubMed] [Google Scholar]
- 53.Cuomo ASE et al. Optimizing expression quantitative trait locus mapping workflows for single-cell studies. Genome Biol 22, 188 (2021). [DOI] [PMC free article] [PubMed] [Google Scholar]
- 54.van der Wijst M et al. The single-cell eQTLGen consortium. eLife 9, e52155 (2020). [DOI] [PMC free article] [PubMed] [Google Scholar]
- 55.Oelen R et al. Single-cell RNA-sequencing reveals widespread personalized, context-specific gene expression regulation in immune cells. Preprint at bioRxiv 10.1101/2021.06.04.447088 (2021). [DOI]
- 56.Kotliar D et al. Identifying gene expression programs of cell-type identity and cellular activity with single-cell RNA-seq. eLife 8, e43803 (2019). [DOI] [PMC free article] [PubMed] [Google Scholar]
Associated Data
This section collects any data citations, data availability statements, or supplementary materials included in this article.
Supplementary Materials
Data Availability Statement
The single-cell mRNA and surface protein data that support the findings of this study were published previously and are available in the Gene Expression Omnibus (GSE158769) and in dbGaP (phs002467). Genotype data were also previously published and are available in the Database of Genotypes and Phenotypes (dbGaP) (phs002025, for authorized general research use). We also used published datasets for validation and additional analyses: DICE (https://dice-database.org/downloads), BLUEPRINT (http://dcc.blueprint-epigenome.eu/), ref. 48 (GSE118189), ref. 24 (https://doi.org/10.5281/zenodo.4273999) and ref. 49 (Single Cell Portal accession SCP259).


