Abstract
Protein language models, trained on millions of biologically observed sequences, generate feature-rich numerical representations of protein sequences. These representations, called sequence embeddings, can infer structure-functional properties, despite protein language models being trained on primary sequence alone. While sequence embeddings have been applied toward tasks such as structure and function prediction, applications toward alignment-free sequence classification have been hindered by the lack of studies to derive, quantify and evaluate relationships between protein sequence embeddings. Here, we develop workflows and visualization methods for the classification of protein families using sequence embedding derived from protein language models. A benchmark of manifold visualization methods reveals that Neighbor Joining (NJ) embedding trees are highly effective in capturing global structure while achieving similar performance in capturing local structure compared with popular dimensionality reduction techniques such as t-SNE and UMAP. The statistical significance of hierarchical clusters on a tree is evaluated by resampling embeddings using a variational autoencoder (VAE). We demonstrate the application of our methods in the classification of two well-studied enzyme superfamilies, phosphatases and protein kinases. Our embedding-based classifications remain consistent with and extend upon previously published sequence alignment-based classifications. We also propose a new hierarchical classification for the S-Adenosyl-L-Methionine (SAM) enzyme superfamily which has been difficult to classify using traditional alignment-based approaches. Beyond applications in sequence classification, our results further suggest NJ trees are a promising general method for visualizing high-dimensional data sets.
Keywords: protein language models, sequence classification, hierarchical clustering, manifold visualization, deep learning, representation learning
Introduction
Recent advances in natural language processing have yielded deep learning models capable of parsing and understanding human language. Adapting these methods toward biological data, protein language models are trained on millions of biologically observed protein sequences in a self-supervised manner, without annotations [1, 2]. Despite being trained on sequences alone, these models are capable of learning protein representations which encode structural, functional and evolutionary features [3]. These representations are stored in the hidden states—typically referred to as embedding vectors, a representation of raw protein sequences as large numerical matrices. Taking advantage of these feature-rich representations, protein language models can be applied toward a wide variety of tasks such as secondary structure prediction, contact prediction, homology detection [4], and sequence conservation [ID: BIB-22-2012, 5]. However, applications toward unsupervised sequence clustering have not been systematically explored.
With the growing diversity of protein sequence databases, there is a need for new unsupervised methods for protein classification alongside traditional alignment-based methods [6, 7] to overcome the unique challenges in accurately aligning large divergent sequence datasets. Within the protein kinase family, for example, while alignment-based methods have provided a robust classification of the  500 protein kinase sequences encoded in the human genome, their connection to distantly related Atypical kinases has been difficult to infer due to uncertainty in aligning regions of high structural divergence. Likewise, the relationships connecting different phosphatase enzymes which adopt different folds as well as the structurally diverse radical S-Adenosyl-L-Methionine (SAM) enzymes have been difficult to study due to the challenges in aligning divergent sequences. Recent deep learning methods for protein classification have shown promising results in enzyme class prediction [8, 9]; however, broader applications are limited due to the necessity for supervised training and curated labels. Unsupervised models for classification have been proposed for individual families, but these family-centric models are not generalizable across the proteome [10, 11]. Overcoming these drawbacks, protein language models, pre-trained at the protein universe scale, provide unbiased representations for any protein sequence and offer new possibilities with embedding-based sequence classification. However, to more broadly apply these representations for sequence classification, new benchmarks and workflows need to be developed.
Here, we define standard methods for deriving, quantifying and evaluating relationships between fixed-size protein sequence embeddings. Inspired by techniques in phylogenetic inference, we show that tree-based visualizations facilitate highly accurate depictions of high-dimensional manifolds—outperforming widely used dimensionality reduction methods in preserving global structure while providing comparable performance in preserving local structure. Trees also inherently propose hierarchical clustering schemes. Using a variational autoencoder (VAE), we further developed a resampling strategy for assigning confidence values to each hierarchical cluster. We also defined multiple methods for representing unaligned protein sequences as fixed-size vectors. When applied to the human phosphatases and human protein kinase superfamily, our embedding-based clustering remains consistent with and extends upon previous alignment-based classifications. For the radical SAM superfamily, an embedding-based clustering corroborates many structure-functional similarities noted in previous experimental studies while also suggesting new groupings.
Materials and Methods
Sequence datasets
We benchmark the performance of various manifold visualization methods using protein domain sequence datasets from Pfam (retrieved 10 April 2022) [12]. First, we downloaded all Pfam alignments which were labeled as ‘Domain’ for a total of 6909 alignments. Then, we filtered each alignment to 90% similarity to reduce redundancy and removed all alignments with less than 100 sequences. Afterwards, each alignment was randomly subsampled to contain a maximum of 500 sequences each. Finally, we revert all protein sequences in each dataset to unaligned sequences. After filtering, we were left with 2685 566 sequences across 6048 protein domain datasets. These unaligned sequences were later converted into embedding vectors using a protein language model.
After benchmarking, we demonstrate our methods using case studies on three enzyme groups. The human protein kinase data consist of 558 catalytic domain sequences [13]. The human phosphatase dataset consists of 204 catalytic domain sequences [13]. The radical SAM enzyme dataset consists of 179 catalytic domain sequences curated from a representative set of model organisms [14]; core domain segments were manually identified and trimmed based on available crystal structures and AlphaFold2 [15] models.
Protein sequence embeddings
Protein language models learn the underlying grammar of biological sequences by training on large, universal proteome databases such as UniProt [16]. These models are trained by masked language modeling in which a random subset of residues in each sequence is replaced with blanks and the model is trained to fill in these blanks using contextual information. While general protein language models have been shown to infer structure, functional and evolutionary information from primary sequences alone [17, 18], they typically require prohibitively expensive computational resources to train.
Given a protein sequence of any size, a protein language model can generate an embedding vector of size  where each residue is represented by a token and the contextual information for each residue is encoded in
  dimensions. In addition to ‘residue tokens’, most protein language models also add additional ‘special tokens’ which can be used to denote the beginning or end of the protein sequence. These are commonly referred to as the beginning-of-sequence and end-of-sequence tokens. For a sequence embedding of size
  ,
,  represents the total number of residue tokens and special tokens. The number and usage of special tokens may vary depending on the specific protein language model.
Benchmarks show that ESM-1b [1] demonstrates superior performance in generating feature-rich embeddings which capture diverse structure-function properties [19]. All embeddings were generated from ESM-1b, unless noted otherwise. All sequence embeddings generated from ESM-1b have two special tokens, while contextual information for each token is encoded in 1280 dimensions.
Evaluating methods for quantifying embedding distance
In order to facilitate comparisons, embeddings must be reduced to a standard fixed-size. This is accomplished by representing the full-size embedding of size  as a smaller fixed-size embedding of size
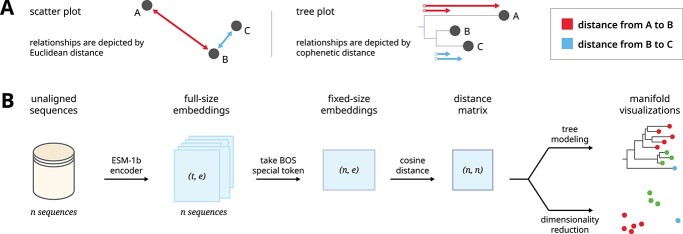
  . The most common strategy for quantifying the similarity between two embeddings is to calculate the cosine distance between the beginning-of-sequence tokens of the two full-size embedding (Figure 1 B). This strategy uses the beginning-of-sequence token as a common frame of reference because the token appears in all sequence embeddings and can be used to represent the full-size embedding.
Figure 1.
A graphical overview shows our pipeline for generating manifold visualizations for protein sequence embeddings. (A) Scatter plots and trees can both be used as general strategies for visualizing manifolds. (B) A dataset of unaligned protein sequences is encoded into embedding vectors using the ESM-1b protein language model. The dimensions of the full embedding vector, and the direct output of the encoder, depend on the length of the encoded sequences. In order to facilitate comparisons between sequences, we generated fixed-size embeddings using the beginning-of-sequence special token of each full-sized embedding. Finally, we calculated an all-versus-all distance matrix between each sequence representation which was subsequently used to generate manifold visualizations.
In addition, we also defined alternative strategies for generating fixed-size representations for a full-sized embedding. These included using the beginning-of-sequence special token, using the end-of-sequence special token, taking the mean of both special tokens and taking the mean of all residue tokens. In order to compare fixed-size embeddings, we also tried a diverse range of distance metrics, namely cosine distance, Euclidean distance, Manhattan distance, Jensen–Shannon divergence and Triangle Similarity-Sector Similarity (TS-SS) [20].
Overall, embedding-based comparisons between protein sequences depend on three major parameters: (1) the protein language model used to generate full-sized embeddings, (2) the method of deriving fixed-size embeddings and (3) the distance metric used to compare between fixed-size embeddings. In order to evaluate different methods of calculating embedding distances, we quantify the degree to which the calculated distances are biologically meaningful. We quantified this using the silhouette score [21] given a set of classification labels. Although the silhouette score is highly dependent on user-defined labels, it is a useful heuristic for identifying parameters that are more likely to produce biologically meaningful results. We apply this method for identifying the optimal parameters for three case studies.
Manifold visualizations
High-dimensional datasets typically adopt complex structures which are difficult to capture [22]. Thus, it is challenging to generate a visualization that accurately depicts these complex relationships in a human-readable way with minimal distortion. For instance, the underlying structure of two- or three-dimensional data may be discerned using a scatter plot; however, this method does not scale to higher dimensional data. Consequently, many methods have been developed toward creating simplified depictions of high-dimensional data which preserve the underlying structure.
Dimensionality reduction-based methods: These (non)linear methods project high-dimensional data into low-dimensional linear space while typically prioritizing the preservation of local neighborhood structures. The low-dimensional embedding is subsequently visualized using a scatter plot (Figure 1 A). We tested widely used algorithms such as Uniform Manifold Approximation and Projection (UMAP) (umap-learn v0.5.1) [23] and t-Distributed Stochastic Neighbor Embedding (t-SNE) (sklearn v0.24.2) [24]. UMAP projections shown in the main text utilize the DensMAP algorithm [25]. In order to test various distance metrics, we set the distance metric to "precomputed" which allows us to use precomputed distance matrices as input. Otherwise, default parameters were used.
Tree-based methods: These methods can model the (non)linear relationships between high-dimensional data using an acyclic, bifurcating tree structure where each data point is modeled as a leaf node. Although trees are typically used for hierarchical clustering, they also excel at depicting the underlying structure of high-dimensional datasets. While relationships between data points in a scatter plot are interpreted by Euclidean distance, relationships within a tree are interpreted by cophenetic distance (Figure 1 A). Tree-based methods directly model the distances between data points, avoiding the need for dimensionality reduction. We tested widely used algorithms such as the Unweighted Pair Group Method with Arithmetic Mean (UPGMA) (sklearn v1.5.4) [26] and Neighbor Joining (NJ) [27]. Both algorithms do not require specification of parameters (Figure 1 B).
Evaluating manifold visualization accuracy
The performance of a given manifold visualization method can be quantified by how well it preserves pairwise distances between the original data points [28]. We quantify how well each manifold visualization method preserves local structure using trustworthiness, a metric that measures how well the nearest neighbors of each data point are retained in the visualization.
 |
(1) |
We quantify how well each method preserves the global structure in each data set by calculating the Spearman rank correlation of all pairwise distances (d) between data points (n) in the original dataset versus all pairwise distances in the visualization.
 |
(2) |
Evaluating tree clustering confidence
Tree-based manifold visualizations also inherently propose hierarchical clustering schemes. We developed a method to quantify the confidence of each unique cluster (denoted by each branch) by resampling the original data set using a generative model, then measuring how frequently each cluster is observed across replicate trees generated from resampled data. This process is conceptually similar to bootstrap resampling used in phylogenetic inference.
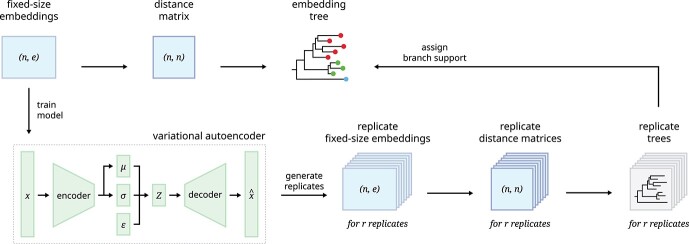
In order to assign clustering confidence to each branch of a given tree, we propose a method called VAE Implemented Branch support Estimation (VIBE) (Figure 2). Given a high-dimensional dataset of protein sequence embedding, the VAE was trained for 15 000 epochs where the loss term was defined as a weighted combination of mean squared error (MSE), Kullback–Leibler divergence (KLD) and TS-SS Error (TSE), where KLD weight was controlled by a cosine annealing scheduler [29].
 |
(3) |
 |
(4) |
 |
(5) |
 |
(6) |
Figure 2.
A graphical overview shows our VIBE pipeline for evaluating tree clustering confidence. The top row shows our general procedure for calculating a tree-based visualization given a dataset of fixed-size representation vectors. We train a VAE to learn the latent distribution of the representations, allowing us to resample the representation vectors which are subsequently used to calculate replicate trees. These replicate trees are used to assign branch support values to the original tree.
The trained VAE model was used to generate 500 replicates of the original datasets which were subsequently used to generate replicate trees. For a given tree, each branch corresponds to a bipartition which defines a unique split for data points inside or outside of the branch. For each branch of the original tree, the confidence score is measured by the percentage of replicate trees which exhibited the same corresponding bipartition.
Results and Discussion
Trees enable faithful depictions of high-dimensional data
We compare the performance of various manifold visualization methods in generating faithful depictions of high-dimensional data. Each data point will be a fixed-size protein sequence embedding containing 1280 dimensions. From the Pfam sequence database of curated protein domains, we sampled 6048 unique datasets containing a total of 2685 566 protein sequences across all datasets. Sequences were converted into embedding vectors using a pLM. As a result, each dataset is a matrix of size  , where
  is the number of sequences in a given dataset.
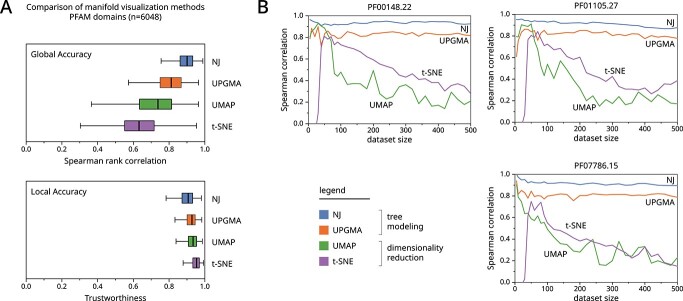
Utilizing our sequence embedding datasets, a comparison of manifold visualization methods reveals that tree-based methods outperform popular dimensionality reduction methods such as UMAP, t-SNE and UPGMA in accurately preserving global distances (Figure 3A, top), also showing comparable accuracy in preserving local neighbors (Figure 3A, bottom). These results suggest that these dimensionality reduction-based algorithms may sometimes yield misleading visualizations which do not reflect the underlying data. Example cases are demonstrated in the following sections. While the performance of dimensionality reduction methods could potentially be improved by optimizing parameters for each individual dataset, this is not feasible given the number of benchmark datasets.
Figure 3.
We benchmark the performance of various manifold visualization methods using 6048 protein domain sequence datasets from Pfam. (A) Boxplots show the accuracy of manifold visualization methods shown across the y-axis. The top graph shows Spearman rank correlation which measures how well global distances are preserved in the visualization. The bottom graph shows trustworthiness which measures how well local neighborhoods (k=10) are preserved in the visualization. Expanded benchmarks are provided in Supplemental Figure S1. (B) We show the effect of dataset size on three poorly performing datasets across dimensionality reduction methods.
We further investigate the worst-performing datasets and find that the performance of dimensionality reduction-based methods almost monotonically decreases as the dataset size increases (Figure 3B). Dimensionality reduction methods do not scale well with dataset size, while tree-based methods maintain stable performance across variable dataset sizes.
Embedding trees capture functional similarities in phosphatases
In order to demonstrate how new insights can be gained from tree-based manifold visualizations, we performed sequence embedding analyses on the human phosphatase enzymes—a diverse class of proteins that regulates cellular signaling. A sequence-structural clustering study has shown that phosphatases are classified into 10 distinct structural folds (Table 1) which subdivide into families [30]. We compare these results against our embedding-based classification.
Table 1.
Phosphatase folds and families included in this study.
| Name | Description |
|---|---|
| CC1 | Cysteine-based class 1 |
| DSP | Dual-specific protein phosphatases (part of CC1) |
| PTEN | Phosphatase and tensin homologs (part of CC1) |
| PTP | Protein tyrosine phosphatases (part of CC1) |
| CC2 | Cysteine-based class 2 |
| CC3 | Cysteine-based class 3 |
| RTR1 | Rtr1 homologs |
| HAD | Haloacid dehalogenases |
| HP | Histidine phosphatases |
| PHP | Protein histidine phosphatases |
| AP | Alkaline phosphatases |
| PPPL | Phosphoprotein phosphatase (PPP)-like |
| PPM | Metal-dependent protein phosphatases |
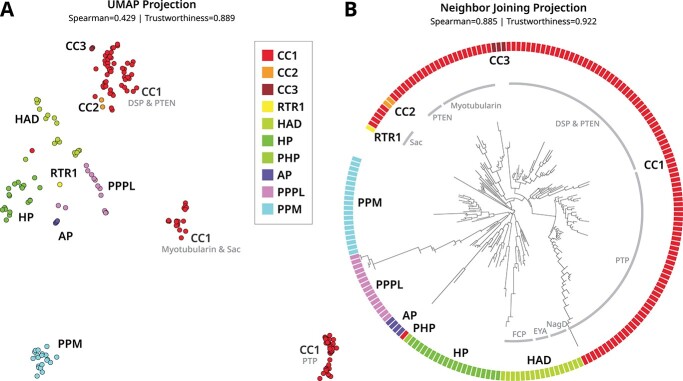
We generated equivalent manifold visualizations using a UMAP scatterplot (Figure 4A) and NJ tree (Figure 4B). Embedding distances were quantified using the cosine distances between the averages of all residue tokens within each full-size embedding. We measured the global accuracy of these visualizations and found that distances between tree leaves are highly correlated with the original embedding distances (R=0.885), while the distances between points in the scatterplot are modestly correlated (R=0.429).
Figure 4.
Comparison of two manifold visualizations for embeddings generated from catalytic domain sequences of human phosphatases. Phosphatase abbreviations and names are described in Table 1. Visualizations were generated using (A) UMAP and (B) neighbor joining. The global and local accuracy of these visualizations is quantified by Spearman correlation and trustworthiness, respectively. The colors denote the structural fold as indicated by the legend, while the light gray text indicates a distinct family within a structural fold group. The full tree is provided in Supplemental Figure S3.
Although both visualizations show separation between phosphatases which adopt different protein folds, the tree visualization captures more nuances from the original embeddings. For example, CC1, CC2 and CC3 phosphatases share a conserved cysteine-based catalytic motif despite adopting three different structural folds [30]. The UMAP visualization splits the CC1 phosphatases into three separate clusters, each corresponding to different families, and places CC2 and CC3 phosphatases near the CC1 cluster which contains the DSP and PTEN families. Given the same data, the NJ tree places all CC1-3 phosphatases into a single cluster which further subdivides into distinct families. Not observed in the UMAP projection, the NJ tree clusters PPPL, PPM and AP phosphatases together. We speculate that this is a biologically meaningful grouping that reflects similarities in functions such as substrate binding—PPPL and PPM phosphatases are specific to phosphoserine and phosphothreonine [31], while AP can bind phosphoserine and phosphothreonine substrates [32] but catalyzes phosphotyrosine dephosphorylation [33].
Trees simultaneously depict distances between data points and a hierarchical clustering scheme. While the distances are evaluated by global and local accuracy, we evaluate the robustness of a given clustering scheme using VIBEs which show the frequency in which each unique cluster appears across 500 replicate trees. We observed high clustering confidence upon removing three outliers—a divergent CC1 phosphatase, as well as RTR1 and PHP which contained only one sequence each (Figure 5). For instance, the filtered tree places all CC1 phosphatases on a single branch, whereas the original tree places them in a paraphyletic group. These results indicate that outlier sequences can negatively impact clustering.
Figure 5.
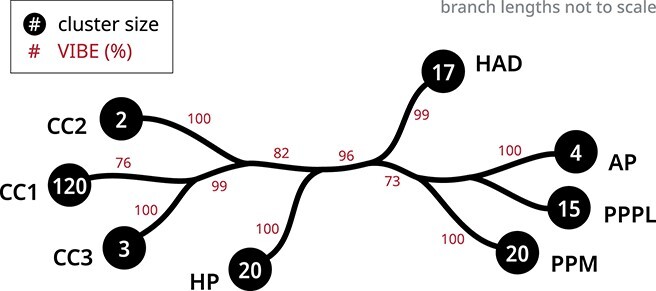
A condensed tree shows a hierarchical clustering scheme for human phosphatase enzymes. The black circles at each tip indicate the number of sequences within each phosphatase fold. The clustering confidence of each branch was quantified using VIBEs (500 replicates) shown as percentages in red. The unlabeled branches indicate paraphyletic groups. The full tree is provided in Supplemental Figure S4.
Overall, we observed high confidence for clusters associated with the major folds (Figure 5). For example, 120 CC1 phosphatases were placed into the same group in 76% of replicates. The clustering of CC1, CC2 and CC3 phosphatases was observed in 82% of replicates, while the clustering of PPPL, PPM and AP phosphatases was observed in 73% of replicates.
Embedding trees capture evolutionary relationships in protein kinases
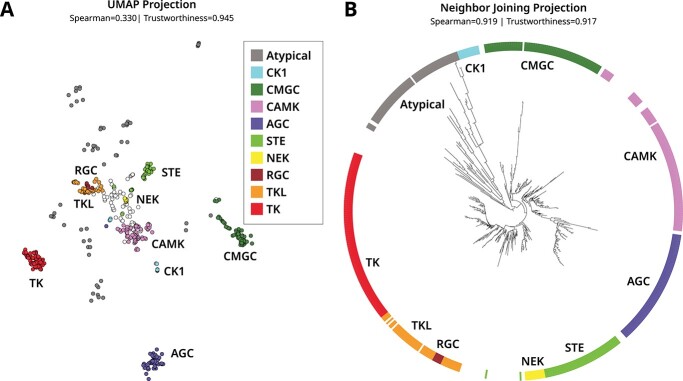
We further demonstrate sequence embedding analyses on an evolutionarily related superfamily—protein kinases, a structurally conserved and biomedically relevant class of cell signaling enzymes. Multiple sequence-structure clustering studies and evolutionary studies have shown that protein kinases are classified into distinct groups [13, 34]. The canonical protein kinases broadly fall within major groups (TK, TKL, STE, AGC, CAMK, CK1, CMGC, NEK, RGC) (Table 2) and these canonical protein kinases are distantly related to Atypical and eukaryotic-like kinases such as lipid and aminoglycoside kinases [35–37]. For the purposes of this analysis, we collectively refer to these distantly related kinases as Atypical. We compare these results against our embedding-based classification. Using a dataset of all human protein kinases, we generated equivalent manifold visualizations using UMAP (Figure 6A) and NJ (Figure 6B). Embedding distances were calculated using the TS–SS distances between the averages of the beginning-of-sequence and end-of-sequence special tokens within each full-size embedding.
Table 2.
Protein kinase groups were included in this study.
| Name | Description |
|---|---|
| Atypical | Atypical and eukaryotic-like kinases |
| CK1 | Casein kinase 1 |
| CMGC | CDK, MAPK, GSK3 and CLK-related families |
| CAMK | Calmodulin/calcium-regulated kinases |
| AGC | Protein kinase A, G, and C related families |
| STE | STE homologs |
| NEK | NimA-related kinases |
| RGC | Receptor guanylate cyclases |
| TKL | Tyrosine kinase-like |
| TK | Tyrosine kinases |
Figure 6.
Comparison of two manifold visualizations for embeddings generated from catalytic domain sequences of human protein kinases. Kinase abbreviations and names are described in Table 2. Visualizations were generated using (A) UMAP and (B) neighbor joining. The global and local accuracy of these visualizations is quantified by Spearman correlation and trustworthiness, respectively. The colors denote the kinase group as indicated by the legend. The uncategorized protein kinases in the ‘Others’ category are not colored (white). The full tree is provided in Supplemental Figure S5.
Similar to the previous section, the tree visualization is more faithful to the original data in that it captures known relationships by grouping closely related kinases together, while the UMAP projection proposes false neighbors. For example, the UMAP projection intersperses Atypical kinases with protein kinases, while the NJ tree correctly separates the two. We speculate that this behavior results from the Atypical kinases being less densely populated compared with the protein kinase data points.
Within the protein kinase superfamily, both methods are able to distinguish the major groups. However, the NJ tree further defines two hierarchical clusters RGC-TKL-TK and AGC-CAMK, both of which are evolutionary groups observed in phylogenetic studies [34]. Our tree also places CK1 closest to the Atypical kinases. Given that our embedding tree corroborates known evolutionary relationships, this suggests CK1 as the most ancestral protein kinase group that connects distantly related Atypical kinases with canonical protein kinases. Consistent with this view, CK1 lacks some of the canonical protein kinase conserved motifs in the substrate binding lobe [38] and displays substrate promiscuity and constitutive activity [39] similar to Atypical kinases such as aminoglycoside kinases [40].
We next evaluated the robustness of our clustering scheme using VIBEs. The placement of unclassified kinases in the ‘Others’ category was highly unstable across 500 replicate trees, preventing the assignment of confidence values. In other words, these sequences would move in and out and between groups across replicates. This behavior was expected as these are intermediates that do not classify into any of the major evolutionary groups. The removal of these kinases resulted in a high confidence tree with the same overall relationships between groups (Figure 7).
Figure 7.
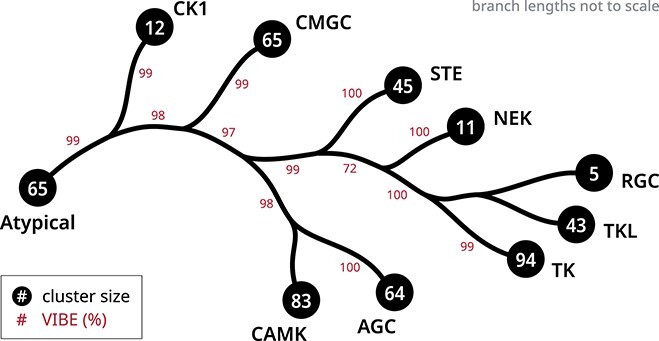
A condensed tree shows a hierarchical clustering scheme for human protein kinase enzymes. The black circles at each tip indicate the number of sequences in each kinase group. The clustering confidence of each branch was quantified using VIBEs (500 replicates) shown as percentages in red. The unlabeled branches indicate paraphyletic groups. The full tree is provided in Supplemental Figure S6.
Embedding trees propose a novel classification for radical SAM enzymes
Finally, we demonstrate how embedding trees may be applied toward a functional classification of enzyme superfamilies. Radical S-Adenosyl-L-Methionine (SAM) enzymes are present in all domains of life, catalyzing radical chemistry toward a wide variety of essential biological functions [14]. The catalytic core domain of radical SAM enzymes adopts a TIM barrel ( /
/ barrel) fold with varying numbers of
  /
/ pairs, and a conserved iron–sulfur cluster binding motif [41]. Family-specific insertions and deletions add additional structural variance—all factors which introduce challenges in defining a reliable large-scale alignment. Thus, we utilize embeddings to perform alignment-independent hierarchical clustering.
We curated a dataset of diverse radical SAM enzyme families (Table 3), then established a common frame of reference by trimming each sequence to the core catalytic domain, removing any domain extensions or accessory domains. Curated sequences were converted to embedding vectors and embedding distances were calculated using the cosine distances between the beginning-of-sequence tokens of each embedding.
Table 3.
Radical SAM enzyme families were included in this study.
| Name | Description |
|---|---|
| LipA | Lipoyl synthases |
| MTTase | Methylthiotransferases |
| MTaseA | Class A Methyltransferase |
| B12-binding | B12-binding domain containing |
| HemN | HemN (Coproporphyrinogen III oxidase) homologs |
| Elp3 | Elp3 (Elongator complex subunit) homologs |
| BATS | BATS domain containing |
| Viperin | Antiviral proteins |
| SPASM | SPASM or twitch auxiliary domain containing |
| Activating Enzyme | Activating enzymes |
| QueE | QueE (7-carboxy-7-deazaguanine synthase) homologs |
| TYW1 | TYW1 homologs |
| PLP-dependent | Pyridoxal 5’-phosphate dependent |
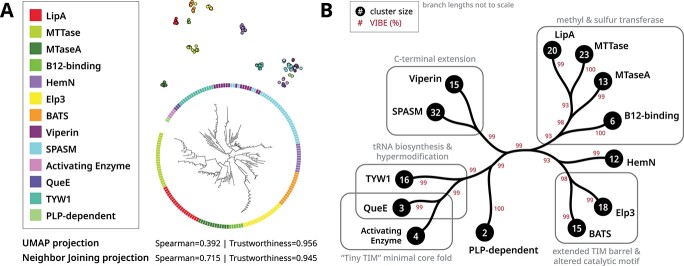
Despite only utilizing the core domain sequence, the embedding tree groups functionally related enzymes together (Figure 8B). Families which specialize in methyl or sulfur transfer (B12-binding, MTaseA, LipA and MTTase families) [41] were placed in a single cluster. On the neighboring cluster, some HemN enzymes also catalyze methyl transfer [42, 43]. The HemN and Elp3 families have reported sequence similarity [44], while Elp3 and BATS families both conserve extended TIM barrel folds. Additionally, many Elp3 and BATS enzymes contain alterations to the canonical iron–sulfur cluster binding motif [41]. Viperin and SPASM families both conserve a C-terminal extension which facilitates family-specific functionalities [45]. Viperin is placed closest to the MoaA subfamily (within the SPASM family), both of which act on nucleotide substrates [46]. Activating enzymes and QueE family members sometimes adopt a ‘Tiny TIM’ minimal core fold [47]. QueE and TYW1 families are also closely grouped together, both families are involved in tRNA biosynthesis and hypermodification [48].
Figure 8.
Manifold visualizations for radical SAM enzymes using embeddings generated from the core catalytic domain. Radical SAM abbreviations and names are described in Table 3. (A) Comparison of visualizations generated from UMAP (top) and NJ (bottom). The global and local accuracy of these visualizations are quantified by Spearman correlation and trustworthiness respectively. Colors denote the structural fold as indicated by the legend. (B) A condensed tree shows a hierarchical clustering scheme. The black circles at each tip indicate the number of sequences within each family. The clustering confidence of each branch was quantified using VIBEs (500 replicates) shown as percentages in red. Unlabeled branches indicate paraphyletic groups. The full tree is provided in Supplemental Figure S7.
Conclusion
In this work, we develop and demonstrate new strategies leveraging sequence embedding for hierarchical protein classification. Sequence embeddings were generated using a pre-trained protein language models without fine-tuning. Not only does this make our methods more computationally accessible and generalizable to any protein superfamily, but also avoids potential biases which may arise from training on a small region of the larger protein universe [49]. Based on our analyses, our alignment-independent classification broadly captures known relationships while also revealing new insights such as (1) suggesting functional similarity between PPPL, PPM and AP phosphatases, (2) inferring CK1 as the most ancestral protein kinase and (3) proposing the first hierarchical classification of the radical SAM superfamily. The quality of embedding-based methods for sequence clustering will continue to improve with the development of more advanced protein language models.
Beyond applications in sequence classification, NJ trees can also be used as a general method for analyzing and visualizing high-dimensional data—typically accomplished with (non)linear dimensionality reduction such as UMAP. For example, dimensionality reduction methods are widely used for visualizing single-cell transcriptomics data [50]. Tree-based visualizations may provide additional insights by more accurately capturing global relationships. Although the tree-based algorithms outperform dimensionality reduction methods in terms of global accuracy, tree-based algorithms are also more computationally expensive [23, 51]. Consequently, tree-based methods may not scale as well to larger datasets.
Tree-based methods are already widely used in data science; however, they are typically viewed as a hierarchical clustering method [52] with little mention of applications in manifold visualization. In contrast, phylogenetics utilizes trees as a framework for both clustering sequences and visualizing evolutionary space. Consequently, many methods have been developed for analyzing evolutionary trees [53, 54] which can be generalized toward describing complex structures within high-dimensional manifolds. The further adaptation of existing methods in phylogenetic tree analysis will provide new avenues for analyzing and visualizing relationships within data.
Key Points
Protein sequence embeddings generated from pre-trained protein language models can be used for alignment-independent sequence clustering without fine-tuning.
In addition to applications in hierarchical clustering, Neighbor Joining (NJ) trees are a general method for visualizing high-dimensional datasets.
Generative models can be used to generate replicate samples for the purposes of evaluating clustering confidence within a given dataset.
When analyzing representations, it is important to consider (1) how the fixed-size embedding vector is derived, (2) what distance metric is used to quantify relationships between fixed-size embeddings and (3) how these relationships are visualized (e.g. dimensionality reduction or tree-based methods).
The accuracy of manifold visualizations methods such as UMAP, t-SNE and NJ can be assessed using Spearman’s correlation (global accuracy) and trustworthiness (local accuracy).
Supplementary Material
Acknowledgments
This research was supported by funding from ARO to SL (W911NF-21-1-0028) and from the National Institutes of Health (NIH) to WL (R01 GM124203) and NK (R35 GM139656). We also thank Dr. Liang Liu for his valuable feedback and discussions.
Author Biographies
Wayland Yeung is a postdoctoral associate at the Institute of Bioinformatics at the University of Georgia. He obtained his Ph.D. from the University of Georgia. His research includes deep learning, bioinformatics, evolutionary biology and structural biology.
Zhongliang Zhou is a Ph.D. student at the School of Computing at the University of Georgia. His research focuses on Machine Learning, and Deep learning with application in bioinformatics and sequential data.
Liju Mathew is a postdoctoral associate at the Department of Microbiology at the University of Georgia. He obtained his Ph.D. from the University of Georgia. His research includes structural biology, enzymology and metalloenzyme chemistry.
Nathan Gravel is a Ph.D. student at the Institute of Bioinformatics at the University of Georgia, USA. His research includes deep learning and bioinformatics.
Rahil Taujale is a research consultant at the University of Georgia. He obtained his Ph.D. from the University of Georgia. His research includes bioinformatics, genomics, proteomics and metabolomics.
Brady O’Boyle is a Ph.D. student at the Institute of Bioinformatics at the University of Georgia, USA. His research includes bioinformatics, evolutionary biology and structural biology.
Mariah Salcedo is a Ph.D. student in the Department of Biochemistry and Molecular Biology at the University of Georgia. Her research includes transcriptomics, patient data integration and machine learning.
Aarya Venkat is a Ph.D. student at the Department of Biochemistry and Molecular Biology at the University of Georgia. His research includes structural biology, quantum chemistry and glycobiology.
William Lanzilotta is a professor at the Department of Biochemistry and Molecular Biology at the University of Georgia. His research includes the mechanism of metalloproteins involved in radical generation and radical-catalyzed chemical conversions.
Sheng Li is an assistant professor at the School of Data Science at the University of Virginia. His research includes trustworthy representation learning, visual intelligence, user modeling, natural language understanding, bioinformatics and biomedical informatics.
Natarajan Kannan is a professor at the Institute of Bioinformatics and the Department of Biochemistry and Molecular Biology at the University of Georgia. His research focuses on using computational and experimental approaches to understand how natural sequence variation contributes to functional variation in different enzyme superfamilies, and how non-natural variation contributes to disease.
Contributor Information
Wayland Yeung, Institute of Bioinformatics, University of Georgia, 30602, Georgia, USA.
Zhongliang Zhou, School of Computing, University of Georgia, 30602, Georgia, USA.
Liju Mathew, Department of Microbiology, University of Georgia, 30602, Georgia, USA.
Nathan Gravel, Institute of Bioinformatics, University of Georgia, 30602, Georgia, USA.
Rahil Taujale, Institute of Bioinformatics, University of Georgia, 30602, Georgia, USA.
Brady O’Boyle, Department of Biochemistry and Molecular Biology, University of Georgia, 30602, Georgia, USA.
Mariah Salcedo, Department of Biochemistry and Molecular Biology, University of Georgia, 30602, Georgia, USA.
Aarya Venkat, Department of Biochemistry and Molecular Biology, University of Georgia, 30602, Georgia, USA.
William Lanzilotta, Department of Biochemistry and Molecular Biology, University of Georgia, 30602, Georgia, USA.
Sheng Li, School of Data Science, University of Virginia, 22903, Virginia, USA.
Natarajan Kannan, Institute of Bioinformatics, University of Georgia, 30602, Georgia, USA; Department of Biochemistry and Molecular Biology, University of Georgia, 30602, Georgia, USA.
Data availability
The datasets and code are freely available for download at https://github.com/esbgkannan/chumby.
Author contributions statement
W.Y., Z.Z., S.L. and N.K. conceived the project. W.Y. and Z.Z. implemented algorithms and methods. W.Y., Z.Z., L.M., N.G., R.T., B.O., M.S. and A.V. curated sequence datasets, analyzed results and tested code. W.Y. drafted the manuscript with edits from Z.Z., L.M., B.O., M.S., S.L., and N.K.. N.K., S.L. and W.L. provided funding. All authors read and approved the manuscript.
References
- 1. Rives A, Meier J, Sercu T, et al. Biological structure and function emerge from scaling unsupervised learning to 250 million protein sequences. Proc Natl Acad Sci 2021;118(15):e2016239118. [DOI] [PMC free article] [PubMed] [Google Scholar]
- 2. Elnaggar A, Heinzinger M, Dallago C, et al. Prottrans: towards cracking the language of lifes code through self-supervised deep learning and high performance computing. IEEE Trans Pattern Anal Mach Intell 2021;14(8):7112–27. [DOI] [PubMed] [Google Scholar]
- 3. Bepler T, Berger B. Learning the protein language: evolution, structure, and function. Cell systems 2021;12(6):654–69. [DOI] [PMC free article] [PubMed] [Google Scholar]
- 4. Rao R, Bhattacharya N, Thomas N, et al. Evaluating protein transfer learning with tape. Advances in neural information processing systems 2019;32:9689–9701. [PMC free article] [PubMed] [Google Scholar]
- 5.Céline M, Michael H, Tobias O, et al. Embeddings from protein language models predict conservation and variant effects, Hum Genet. 2022 141(10):1629–47. Epub 2021 Dec 30. 10.1007/s00439-021-02411-y. [DOI] [PMC free article] [PubMed] [Google Scholar]
- 6. Zou Q, Lin G, Jiang X, et al. Sequence clustering in bioinformatics: an empirical study. Brief Bioinform 2020;21(1):1–10. [DOI] [PubMed] [Google Scholar]
- 7. Yang Z, Rannala B. Molecular phylogenetics: principles and practice. Nat Rev Genet 2012;13(5):303–14. [DOI] [PubMed] [Google Scholar]
- 8. Szalkai B, Grolmusz V. Seclaf: a webserver and deep neural network design tool for hierarchical biological sequence classification. Bioinformatics 2018;34(14):2487–9. [DOI] [PubMed] [Google Scholar]
- 9. Strodthoff N, Wagner P, Wenzel M, et al. Udsmprot: universal deep sequence models for protein classification. Bioinformatics 2020;36(8):2401–9. [DOI] [PMC free article] [PubMed] [Google Scholar]
- 10. Lee T, Lee S, Kang M, et al. Deep hierarchical embedding for simultaneous modeling of gpcr proteins in a unified metric space. Sci Rep 2021;11(1):1–11. [DOI] [PMC free article] [PubMed] [Google Scholar]
- 11. Taujale R, Zhou Z, Yeung W, et al. Mapping the glycosyltransferase fold landscape using interpretable deep learning. Nat Commun 2021;12(1):1–12. [DOI] [PMC free article] [PubMed] [Google Scholar]
- 12. Mistry J, Chuguransky S, Williams L, et al. Pfam: the protein families database in 2021. Nucleic Acids Res 2021;49(D1):D412–9. [DOI] [PMC free article] [PubMed] [Google Scholar]
- 13. Manning G, Whyte DB, Martinez R, et al. The protein kinase complement of the human genome. Science 2002;298(5600):1912–34. [DOI] [PubMed] [Google Scholar]
- 14. Holliday GL, Akiva E, Meng EC, et al. Atlas of the radical sam superfamily: Divergent evolution of function using a “plug and play” domain. In: Vahe Bandarian (ed). Methods in enzymology, Vol. 606. Cambridge, Massachusetts: Elsevier, 2018, 1–71. [DOI] [PMC free article] [PubMed] [Google Scholar]
- 15. Jumper J, Evans R, Pritzel A, et al. Highly accurate protein structure prediction with alphafold. Nature 2021;596(7873):583–9. [DOI] [PMC free article] [PubMed] [Google Scholar]
- 16. Uniprot: the universal protein knowledgebase in 2021. Nucleic Acids Res 2021;49(D1):D480–9. [DOI] [PMC free article] [PubMed] [Google Scholar]
- 17. Weißenow K, Heinzinger M, Rost B. Protein language-model embeddings for fast, accurate, and alignment-free protein structure prediction. Structure 2022;30:1169–77. [DOI] [PubMed] [Google Scholar]
- 18. Thumuluri V, Armenteros JJA, Johansen AR, et al. Deeploc 2.0: multi-label subcellular localization prediction using protein language models. Nucleic Acids Res 2022;50:W228–W234. [DOI] [PMC free article] [PubMed] [Google Scholar]
- 19. Xu M, Zhang Z, Lu J, et al. Peer: a comprehensive and multi-task benchmark for protein sequence understanding. NeurIPS 2022 Dataset and Benchmark Track, arXiv preprint arXiv:2206.02096. 2022.
- 20. Heidarian A, Dinneen MJ. A hybrid geometric approach for measuring similarity level among documents and document clustering. In: 2016 IEEE Second International Conference on Big Data Computing Service and Applications (BigDataService). Manhattan, New York: IEEE, 2016, 142–51. [Google Scholar]
- 21. Rousseeuw PJ. Silhouettes: a graphical aid to the interpretation and validation of cluster analysis. Journal of computational and applied mathematics 1987;20:53–65. [Google Scholar]
- 22. Köppen M. The curse of dimensionality. In: 5th online world conference on soft computing in industrial applications (WSC5), Vol. 1, 2000, 4–8. [Google Scholar]
- 23. McInnes L, Healy J, Saul N, et al. Umap: uniform manifold approximation and projection. Journal of Open Source Software 2018;3(29):861. [Google Scholar]
- 24. Van der Maaten L, Hinton G. Visualizing data using t-sne. Journal of machine learning research 2008;9(11):2579–2605. [Google Scholar]
- 25. Narayan A, Berger B, Cho H. Assessing single-cell transcriptomic variability through density-preserving data visualization. Nat Biotechnol 2021;39(6):765–74. [DOI] [PMC free article] [PubMed] [Google Scholar]
- 26. Sokal RR. A statistical method for evaluating systematic relationships. Univ Kansas, Sci Bull 1958;38:1409–38. [Google Scholar]
- 27. Saitou N, Nei M. The neighbor-joining method: a new method for reconstructing phylogenetic trees. Mol Biol Evol 1987;4(4):406–25. [DOI] [PubMed] [Google Scholar]
- 28. Rieck B, Leitte H. Agreement analysis of quality measures for dimensionality reduction. In: Topological Methods in Data Analysis and Visualization. Berlin/Heidelberg, Germany: Springer, 2015, 103–17. [Google Scholar]
- 29. Hao F, Li C, Liu X, et al. Cyclical annealing schedule: a simple approach to mitigating kl vanishing. In Proceedings of NAACL-HLT 2019; 1:240–50. [Google Scholar]
- 30. Chen MJ, Dixon JE, Manning G. Genomics and evolution of protein phosphatases. Sci Signal 2017;10(474):eaag1796. [DOI] [PubMed] [Google Scholar]
- 31. Shi Y. Serine/threonine phosphatases: mechanism through structure. Cell 2009;139(3):468–84. [DOI] [PubMed] [Google Scholar]
- 32. Ghanshyam Swarup S, Cohen, and Garbers. David L. Selective dephosphorylation of proteins containing phosphotyrosine by alkaline phosphatases. J Biol Chem 1981;256(15):8197–201. [PubMed] [Google Scholar]
- 33. Chakrabartty A, Stinson RA. Properties of membrane-bound and solubilized forms of alkaline phosphatase from human liver. Biochimica et Biophysica Acta (BBA)-General Subjects 1985;839(2):174–80. [DOI] [PubMed] [Google Scholar]
- 34. Modi V, Dunbrack RL. A structurally-validated multiple sequence alignment of 497 human protein kinase domains. Sci Rep 2019;9(1):1–16. [DOI] [PMC free article] [PubMed] [Google Scholar]
- 35. Oruganty K, Kannan N. Design principles underpinning the regulatory diversity of protein kinases. Philosophical Transactions of the Royal Society B: Biological Sciences 2012;367(1602):2529–39. [DOI] [PMC free article] [PubMed] [Google Scholar]
- 36. Kannan N, Neuwald AF. Did protein kinase regulatory mechanisms evolve through elaboration of a simple structural component? J Mol Biol 2005;351(5):956–72. [DOI] [PubMed] [Google Scholar]
- 37. Leonard CJ, Aravind L, Koonin EV. Novel families of putative protein kinases in bacteria and archaea: evolution of the “eukaryotic” protein kinase superfamily. Genome Res 1998;8(10):1038–47. [DOI] [PubMed] [Google Scholar]
- 38. Yeung Wayland, Ruan Zheng, and Kannan Natarajan. Emerging roles of the ac-β4 loop in protein kinase structure, function, evolution, and disease. IUBMB Life, 72(6):1189–202, 2020. [DOI] [PMC free article] [PubMed] [Google Scholar]
- 39. Fulcher LJ, Sapkota GP. Functions and regulation of the serine/threonine protein kinase ck1 family: moving beyond promiscuity. Biochem J 2020;477(23):4603–21. [DOI] [PMC free article] [PubMed] [Google Scholar]
- 40. Fong DH, Berghuis AM. Substrate promiscuity of an aminoglycoside antibiotic resistance enzyme via target mimicry. EMBO J 2002;21(10):2323–31. [DOI] [PMC free article] [PubMed] [Google Scholar]
- 41. Broderick JB, Duffus BR, Duschene KS, et al. Radical s-adenosylmethionine enzymes. Chem Rev 2014;114(8):4229–317. [DOI] [PMC free article] [PubMed] [Google Scholar]
- 42. LaMattina JW, Nix DB, Lanzilotta WN. Radical new paradigm for heme degradation in escherichia coli o157: H7. Proc Natl Acad Sci 2016;113(43):12138–43. [DOI] [PMC free article] [PubMed] [Google Scholar]
- 43. Ding W, Li Y, Zhao J, et al. The catalytic mechanism of the class c radical s-adenosylmethionine methyltransferase nosn. Angewandte Chemie 2017;129(14):3915–9. [DOI] [PubMed] [Google Scholar]
- 44. Paraskevopoulou C, Fairhurst SA, Lowe DJ, et al. The elongator subunit elp3 contains a fe4s4 cluster and binds s-adenosylmethionine. Mol Microbiol 2006;59(3):795–806. [DOI] [PubMed] [Google Scholar]
- 45. Fenwick MK, Dan S, Dong M, et al. Structural basis of the substrate selectivity of viperin. Biochemistry 2020;59(5):652–62. [DOI] [PMC free article] [PubMed] [Google Scholar]
- 46. Bernheim A, Millman A, Ofir G, et al. Prokaryotic viperins produce diverse antiviral molecules. Nature 2021;589(7840):120–4. [DOI] [PMC free article] [PubMed] [Google Scholar]
- 47. Dowling DP, Bruender NA, Young AP, et al. Radical sam enzyme quee defines a new minimal core fold and metal-dependent mechanism. Nat Chem Biol 2014;10(2):106–12. [DOI] [PMC free article] [PubMed] [Google Scholar]
- 48. Berteau O, Benjdia A. Dna repair by the radical sam enzyme spore photoproduct lyase: from biochemistry to structural investigations. Photochem Photobiol 2017;93(1):67–77. [DOI] [PubMed] [Google Scholar]
- 49. Ma K, Ilievski F, Francis J, et al. Exploring strategies for generalizable commonsense reasoning with pre-trained models. In: Proceedings of the 2021 Conference on Empirical Methods in Natural Language Processing. Stroudsburg, Pennsylvania: Association for Computational Linguistics, 2021, 5474–83.
- 50. Huang H, Wang Y, Rudin C, et al. Towards a comprehensive evaluation of dimension reduction methods for transcriptomic data visualization. Communications biology 2022;5(1):1–11. [DOI] [PMC free article] [PubMed] [Google Scholar]
- 51. Simonsen M, Mailund T, Pedersen CNS. Rapid neighbour-joining. In: International Workshop on Algorithms in Bioinformatics. Berlin/Heidelberg, Germany: Springer, 2008, 113–22. [Google Scholar]
- 52. Cohen-Addad V, Kanade V, Mallmann-Trenn F, et al. Hierarchical clustering: objective functions and algorithms. Journal of the ACM (JACM) 2019;66(4):1–42. [Google Scholar]
- 53. Pavlopoulos GA, Soldatos TG, Barbosa-Silva A, et al. A reference guide for tree analysis and visualization. BioData mining 2010;3(1):1–24. [DOI] [PMC free article] [PubMed] [Google Scholar]
- 54. Huerta-Cepas J, Serra F, Bork P. Ete 3: reconstruction, analysis, and visualization of phylogenomic data. Mol Biol Evol 2016;33(6):1635–8. [DOI] [PMC free article] [PubMed] [Google Scholar]
Associated Data
This section collects any data citations, data availability statements, or supplementary materials included in this article.
Supplementary Materials
Data Availability Statement
The datasets and code are freely available for download at https://github.com/esbgkannan/chumby.


