

Abstract
Mitochondria are maternally inherited organelles that play critical tissue-specific roles, including hormone synthesis and energy production, that influence human development, health, and aging. However, whether mitochondria from women and men exhibit consistent biological differences remains unclear, representing a major gap in knowledge. This meta-analysis systematically examined four domains and six subdomains of mitochondrial biology (total 39 measures), including mitochondrial content, respiratory capacity, reactive oxygen species (ROS) production, morphometry, and mitochondrial DNA copy number. Standardized effect sizes (Hedge’s g) of sex differences were computed for each measure using data in 2258 participants (51.5% women) from 50 studies. Only two measures demonstrated aggregate binary sex differences: higher mitochondrial content in women’s WAT and isolated leukocyte subpopulations (g = 0.20, χ2 p = .01), and higher ROS production in men’s skeletal muscle (g = 0.49, χ2 p < .0001). Sex differences showed weak to no correlation with age or BMI. Studies with small sample sizes tended to overestimate effect sizes (r = −.17, p < .001), and sex differences varied by tissue examined. Our findings point to a wide variability of findings in the literature concerning possible binary sex differences in mitochondrial biology. Studies specifically designed to capture sex- and gender-related differences in mitochondrial biology are needed, including detailed considerations of physical activity and sex hormones.
Keywords: mitochondrion, mtDNAcn, respirometry, sex differences, sexual dimorphism
1 |. INTRODUCTION
Mitochondria are at the origin of multicellular life that gave rise to sexual reproduction in breathing, walking, and thinking animals, including homo sapiens.1 As a result, mitochondria influence human physiology via energy transformation through oxidative phosphorylation (OxPhos) and via multiple biochemical and signaling functions.2 Over the last four decades, mitochondria have been implicated as a cause of rare3 and common diseases including metabolic disorders, neurodegeneration, and cancer.4,5 Mitochondria may also regulate the aging process in animals and humans,6–10 and serve as biomarkers of stress and disease.11,12 Consequently, the mitochondrion has become the most studied organelle in the biomedical sciences.13 This growing scientific focus emphasizes the need to understand why and how much mitochondria differ between individuals (inter-individual variation) among the diverse human population. Remarkably, as a field, we still do not know if, and to what extent, mitochondria display systematic binary sex differences between women and men. Resolving this question is paramount to developing clinically useful metrics of mitochondrial biology and to build comprehensive models of human health that incorporate bioenergetics.
Mitochondria are complex, multi-functional organelles. Within the cell, they have a life cycle,14 interact with one another through fusion processes,15,16 and serve dozens of intracellular functions including ATP synthesis, reactive oxygen species (ROS) production, calcium handling, apoptotic signaling, redox homeostasis, hormone synthesis, and lipid and amino acid metabolism, among others.13 To accomplish specialized tasks in different cell types, mitochondria functionally specialize and acquire distinct tissue-specific proteomes and functional phenotypes.17,18 For these reasons, single static molecular measures, such as mitochondrial DNA (mtDNA) copy number (mtDNAcn), provide little to no information about their functional capacity or complex biological phenotypes.19 Functionally meaningful mitochondrial metrics are best captured by dynamic measurements of functional capacities, such as respiratory capacity and efficiency,20 or ROS emission in the presence of specific metabolic substrates.21 Moreover, because mitochondria are multifunctional, mitochondrial phenotyping is most accurately achieved by probing multiple metrics of mitochondrial content and specific functions in parallel (e.g., 22).
Recognizing the multiple roles and functions that mitochondria play within an organism highlights the inadequacy of the popular term “mitochondrial function.” By analogy, in human biomedical research, we do not speak of assessing “human function”—a category too imprecise to have empirical value—and instead rely on specific domains and subdomains of biology (locomotion, cognition, digestion), which are further operationalized by specific measures. Similarly, our current understanding of mitochondrial biology makes it clear that speaking of “mitochondrial function” lacks the required specificity to productively move the field forward. Operationalizing different domains of mitochondrial biology to cover the major properties and unique functions of mitochondria provides a framework to systematically explore sex differences with the required degree of specificity (Figure 1).
FIGURE 1.
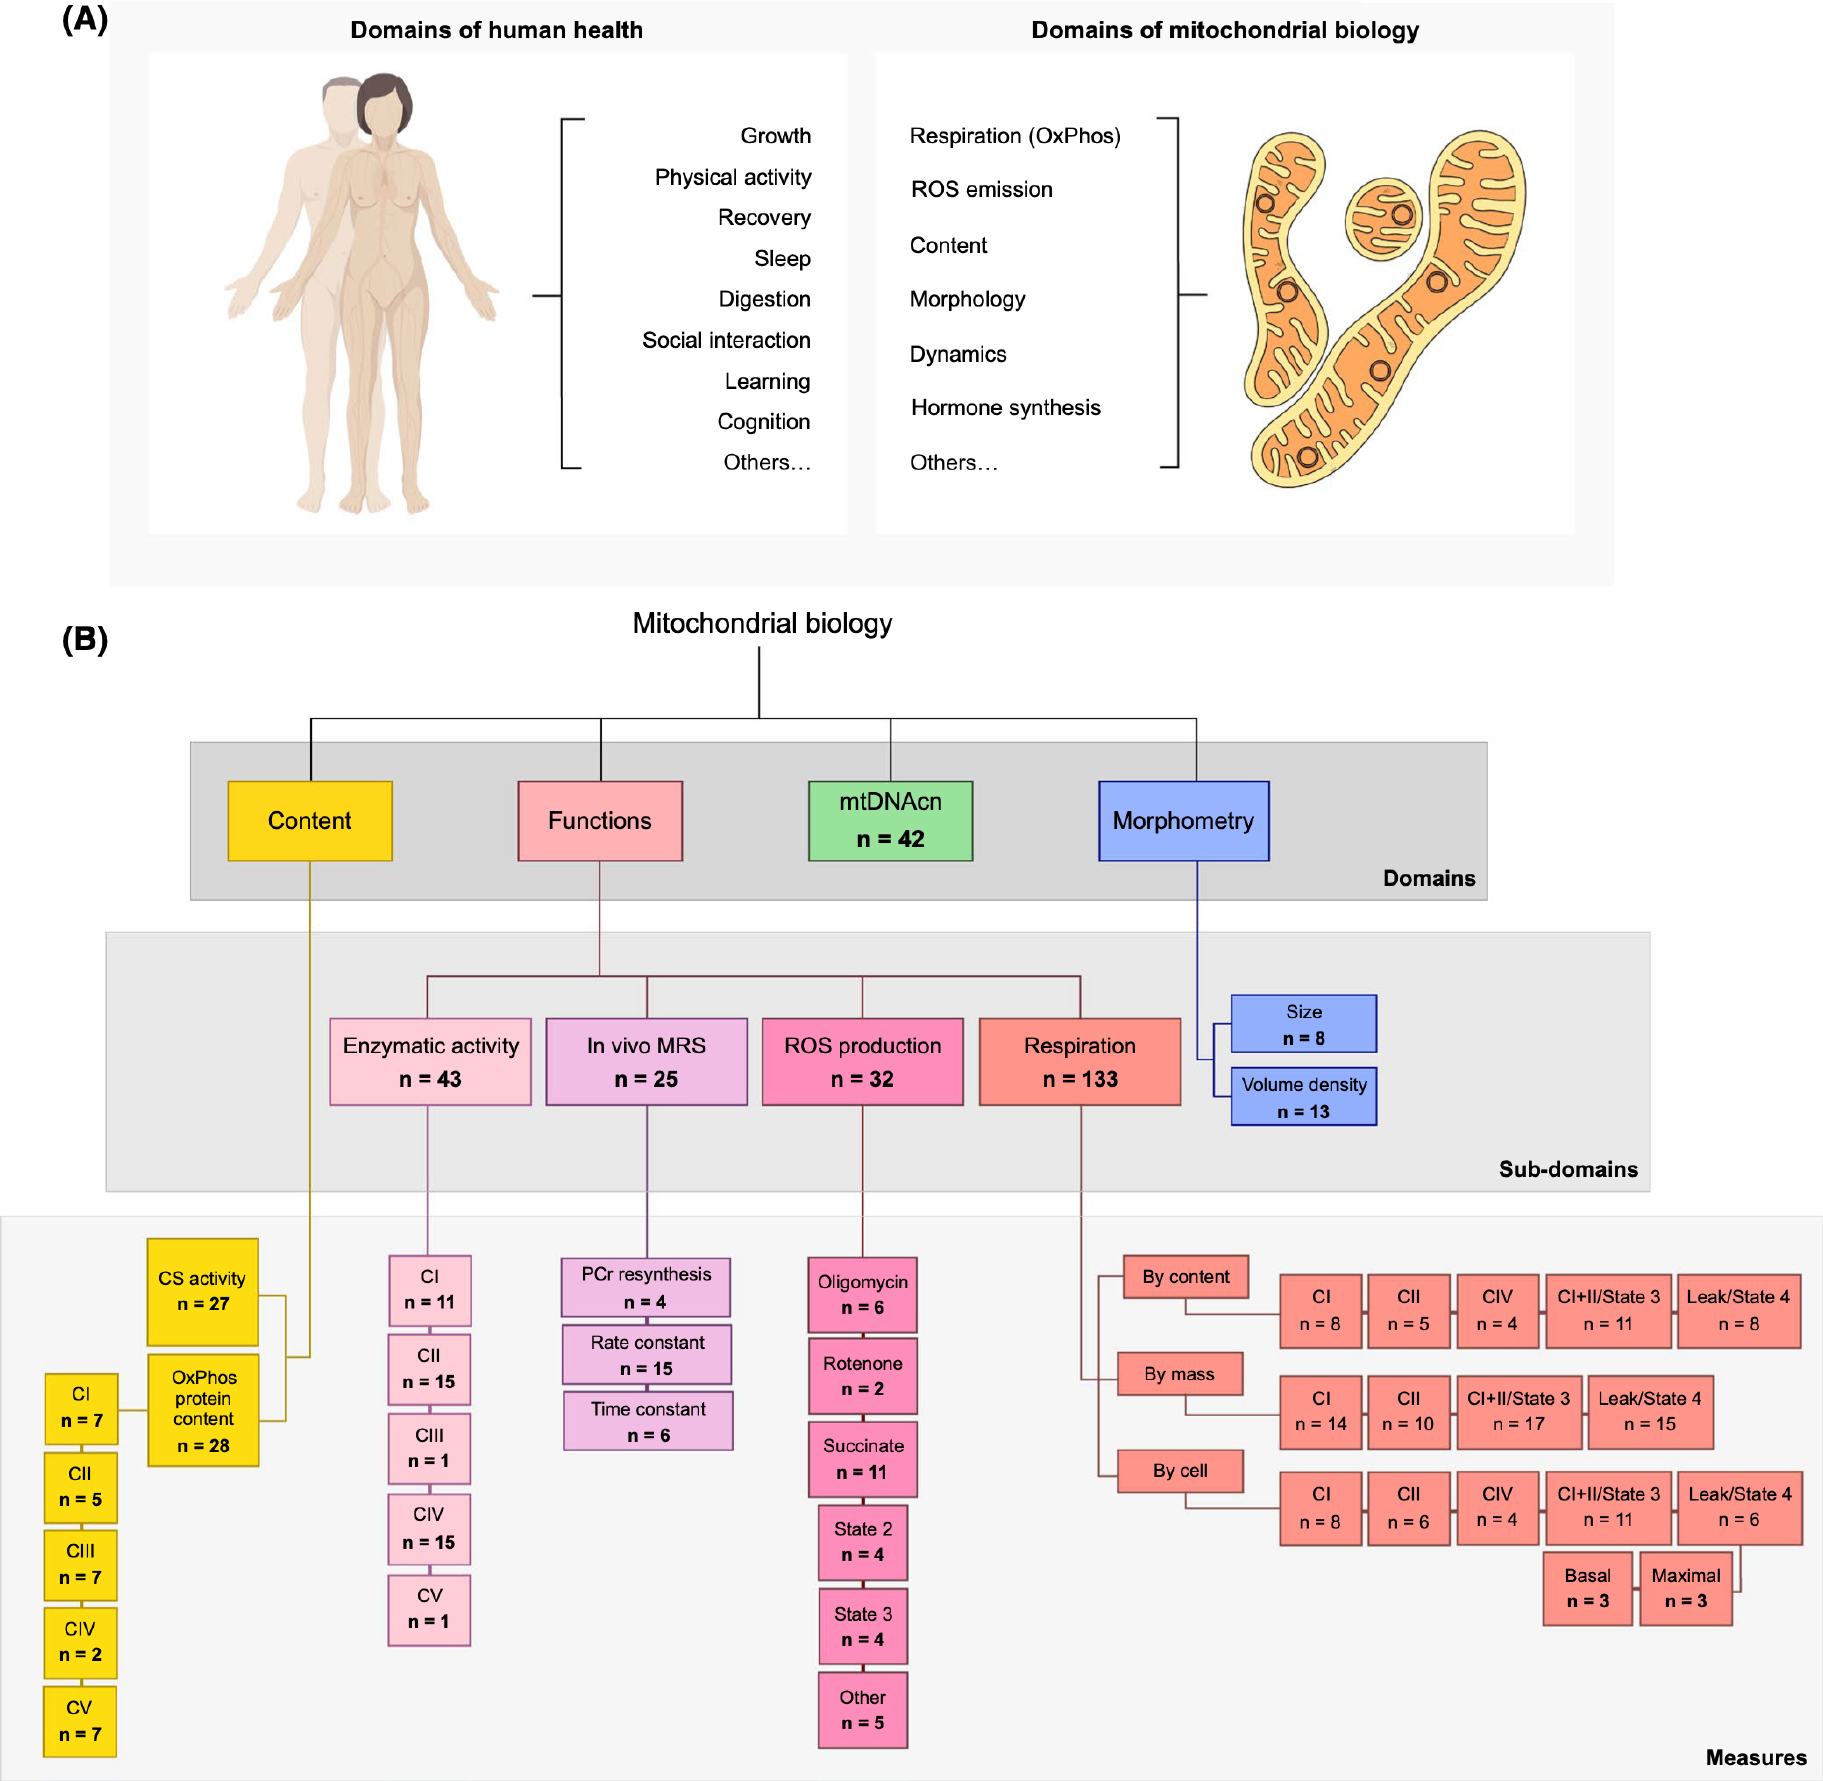
Mitochondrial biology encompasses a broad range of functions and characteristics. (A) Examples of biological domains measured in humans and mitochondria. (B) Mitochondrial perform several functions and exhibit features that inform their overall phenotypes. Abbreviated taxonomy of mitochondrial biological domains examined in this paper, n = total number of measures across all included papers. CI—complex I, NADH-ubiquinone oxidoreductase; CII—complex II, succinate-ubiquinone oxidoreductase (a.k.a. succinate dehydrogenase, SDH), CIII—complex III, ubiquinol-cytochrome c reductase; CIV—complex IV, cytochrome c oxidase; CV—complex V, F0F1 ATP synthase; CS, citrate synthase; MRS, magnetic resonance spectroscopy; mtDNAcn, mitochondrial DNA copy number; PCr, phosphocreatine; ROS, reactive oxygen species
Three factors highlight the deep-rooted biological links between mitochondria and sex as a biological attribute. First, mammalian mitochondria are maternally inherited—meaning they are passed down solely through the oocyte,23 a transmission pattern hypothesized, based on animal models, to differentially influence metabolism and lifespan in males and females.24–26 Second, an underappreciated fact is that the rate-limiting step in the synthesis of all sex hormones, including estrogens, progestins, and testosterone,27 takes place in mitochondria, predominantly within the ovaries and testes. The first enzymatic steps to the synthesis of all steroid hormones, which also includes glucocorticoids and mineralocorticoids, take place in the mitochondrial matrix.28 Third, mitochondria contain receptors for sex hormones. Both the estrogen receptor (ERβ),29 and the androgen receptor (AR)30 translocate to the mitochondrial matrix where they interact with mtDNA and influence multiple domains of mitochondrial biology. Thus, tissue-specific mitochondria contain the molecular machinery to (i) produce and (ii) sense the canonical hormones of sexual differentiation.
Previous studies have partially examined sex differences in mitochondria within different species, but we lack an overarching answer that considers the breadth of mitochondrial biology and sexual characteristics in humans. In rats and mice, compared to males, mitochondria from females produce more energy and fewer ROS (reviewed in Ref. [31]). However, it has been argued that the biological and social complexities of human gender/sex32–34 make animal studies inadequate to explore sex differences in human mitochondrial biology. Of the limited human studies designed to assess sex differences in some aspects of mitochondrial biology, some have reported higher citrate synthase (CS, a marker of mitochondrial content) activity and greater antioxidant capacity in women’s mitochondria,31,35 and comparable maximal respiration rates between binary sexes.36 Increasing evidence also suggests that sex hormones have a strong impact on mitochondrial biology independent of chromosomal sex and/or sex assigned at birth.37 Together, these limited findings highlight the need for a concerted community effort to systematically resolve the nature and magnitude of sex differences in mitochondrial biology among humans.
To address this need, we performed a quantitative, multivariate meta-analysis of available data on binary human sex differences, informed by a framework that incorporates multiple domains of human mitochondrial biology. This predominantly involved integrating studies that were not initially designed to examine sex differences, but which nevertheless contained relevant data from women and men. When possible, we also explored whether methodological approaches (energetic substrates, normalization approach, isolated mitochondria vs. permeabilized cells/fibers methods) and individual traits (physical activity, age, and BMI) moderate the observed sex differences.
2 |. METHODS
2.1 |. Outcomes
Mitochondrial biology was organized into four overarching domains: content, functions, mtDNAcn, and morphometry. Mitochondrial morphometry included two sub-domains, mitochondrial size, and mitochondrial volume density. Mitochondrial content was assessed as CS activity and OxPhos complex protein content (CI-CV). Mitochondrial functions included four subdomains: (i) OxPhos enzymatic activity (CI-CV), (ii) in vivo mitochondrial OxPhos capacity assessed through 31P-MRS, (iii) ROS production, and (iv) respiration. Mitochondrial respiratory capacity data were compared according to the normalization method (normalized to mitochondrial content, tissue mass, or per cell), type of preparation (permeabilized fibers/cells, or isolated mitochondria), and respiratory state (state 3 phosphorylating respiration, or Leak/State 4 respiration). This organization is depicted in Figure 1B.
2.2 |. Literature search
This meta-analysis was conducted according to the Preferred Reporting Strategies for Systematic Reviews and Meta-Analyses (PRISMA) guidelines.38 Authors J.W. and AJ. searched Medline via PubMed for eligible humans studies using two approaches: (1) A narrow search for studies that actively considered sex differences in mitochondrial biology, using the following search terms: mitochondria AND (“mitochondri* function” OR “functional capacity” OR respiration OR “ROS product*” OR “reactive oxygen species product*” OR “antioxidant activity” OR “ATP synthesis” OR “calcium uptake” OR “calcium handling” OR “electron transport chain” OR fusion OR fission OR “mitochondrial content”) AND (“men and women” OR “sex difference” OR “sex differences” OR “sexual dimorphism” OR “sex effects” OR “gender difference” OR “gender differences” OR “sex heterogeneity”); (2) a broad search for studies of mitochondrial biology, regardless of whether there was initial analysis by sex, using the following terms and filters: “mitochondrial function” NOT “review” (“muscle” OR “leukocytes” OR “brain”), and the filters Journal Articles, English, Human, Male, and Female. The last search was completed on July 17, 2020. Investigators of included studies were also asked to recommend other relevant publications. Finally, the meta-analysis was advertised on social media, and the community at large was asked to suggest studies for consideration of inclusion.
2.3 |. Inclusion/exclusion criteria
Criteria were established prior to searches and included only peer-reviewed articles, published in English, that examined at least one domain of mitochondrial biology (as defined above): mitochondrial content, OxPhos complex protein abundance or activity, in vivo magnetic resonance spectroscopy, respiration, ROS production, mtDNAcn, and mitochondrial volume or size. As calculations of standardized mean differences can be unreliable if the comparison group sample sizes are severely imbalanced,39 studies had to contain no more than three times as many participants of one sex as another. Only studies of women and men without known illnesses (i.e., healthy controls) were included. Review articles and studies in animal models or cell culture were excluded. Studies of post-mortem tissues were included for their unique ability to enable mitochondrial measurements in otherwise inaccessible tissues such as the brain and cardiac muscle.
2.4 |. Data extraction
The corresponding author(s) of each eligible article were contacted by email to request sex-disaggregated data (mean, n, and SD), using a standardized template (Supporting Information Data SI). Follow-up emails were sent biweekly; after the third nonresponse, the first or senior author was also contacted. Returned data was entered into the data log, organized by domains of mitochondrial biology. Additional information was gathered for each study, including (where applicable) respiratory substrates used, methodological details (e.g., isolated mitochondria or permeabilized cells/fibers), average group age, BMI, and race, as available. The compiled data used in this meta-analysis are available as a resource in Supporting Information Data S2 in the Open Research section of this article.
2.5 |. Characteristics of included studies
Our searches yielded 1212 publications in total. After screening abstracts, 275 full-text articles were evaluated for inclusion. Of these, 225 were excluded because they were either animal studies (n = 6), reviews (n = 7), lacked either women or men participants (n = 39), did not directly measure a functional or morphometric domain of mitochondrial biology (e.g., measured TFAM or UCP-1 protein abundance or gene expression) (n = 41), lacked healthy controls (n = 17), or had inadequate sample sizes (n = 98, see section “Inclusion/exclusion criteria”). An additional 17 studies were excluded because we failed to establish contact with the author, or sex-disaggregated data was not available. A detailed flowchart of the PRISMA-guided search process is available in Figure 2.
FIGURE 2.
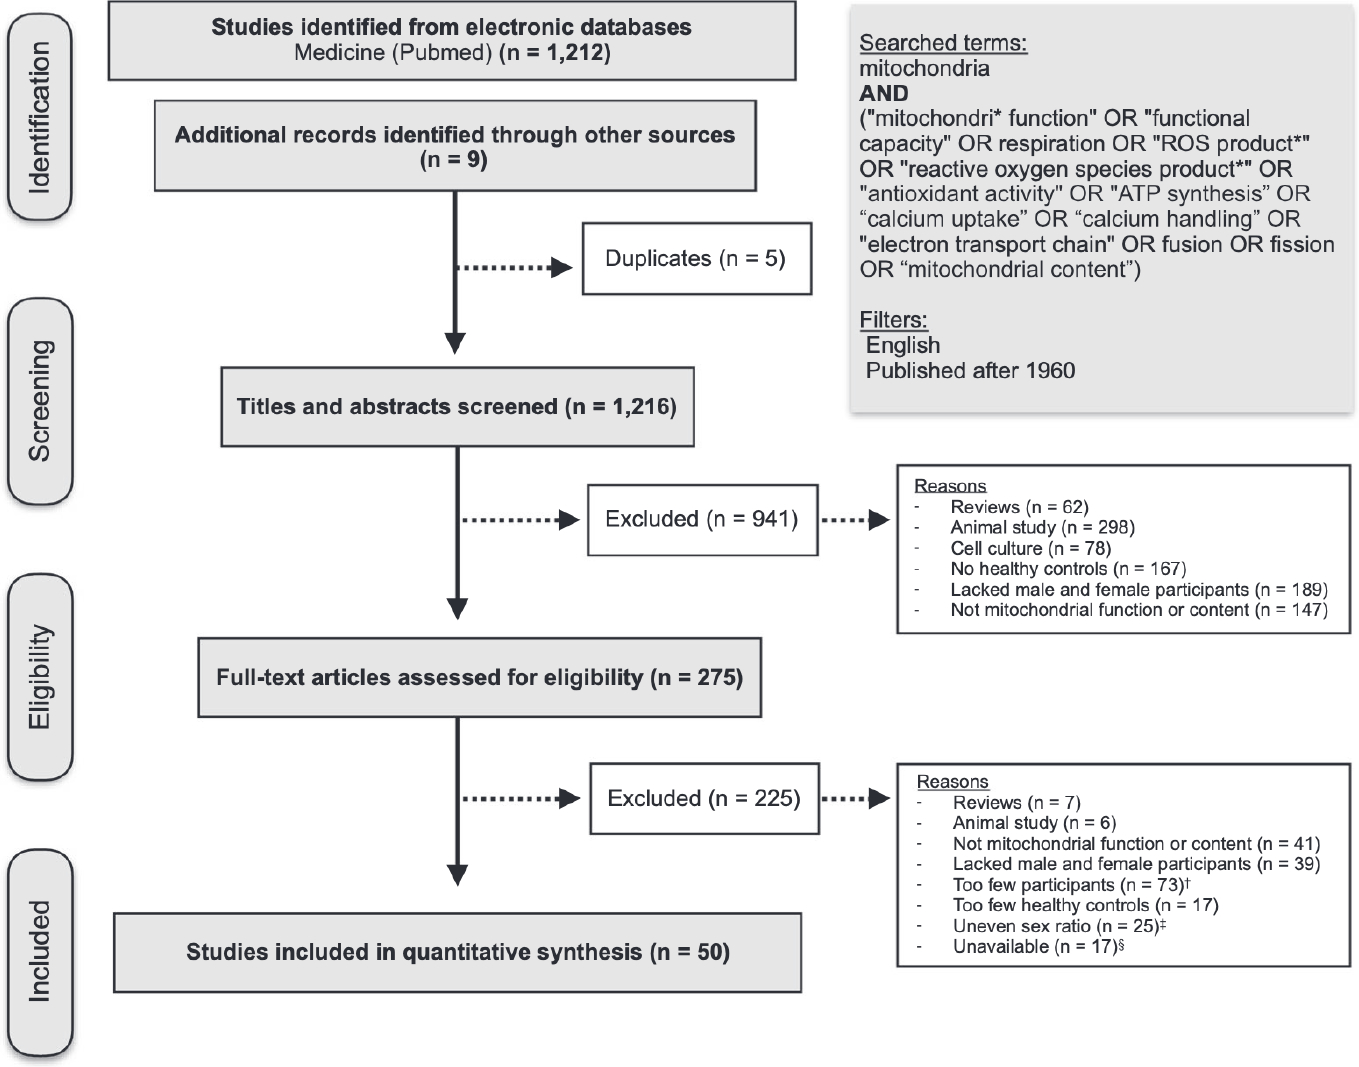
PRISMA flowchart of the study selection process. Preferred reporting strategies for systematic reviews and meta-analyses (PRISMA) guideline flowchart of study eligibility and study selection. A full list of eligible articles is included in the first tab of Supporting Information Data S2. †Studies were considered to have too few participants when the n for women or men was <3. ‡Studies were considered to have an uneven sex ratio when there were over three times as many participants of one binary sex as the other (e.g., 30 men and 2 women). These studies were excluded because large group imbalance can produce unreliable effect size estimates. §Studies were considered unavailable when we (1) failed to establish contact with the author or (2) the author was not able to access sex-disaggregated data
A total of 50 studies were included, resulting in a total of 2268 participants (1163 women and 1105 men). Publication dates ranged from 1992 to 2021, with 23 studies (46%) published within the past 5 years. The average year of publication for included studies was 2013, compared to 2008 for unavailable studies, showing that data was more difficult to obtain from older studies. The average participant age ranged from 4 to 85 years (group mean), with almost half the studies (47%) with an average age between 20 and 39 years. Average BMI was reported for 84% of studies and ranged from 22 to 34, with 55% of participant BMIs categorized as healthy under current guidelines (BMI < 25). Seventy-eight percent of studies did not report any data on race or ethnicity. Of the six studies reporting racial data, three reported the race of each participant, and three reported solely the percentage of white participants. In these studies, the racial composition of participants ranged from 60% to 93% white, 0%−30% Asian, 0%−10% Black, and 0%−5% Hispanic. No study reported gender/sex data beyond a binary sex designation (female or male) or discussed how data on sex were collected. It is assumed that the vast majority of participants in this dataset are cisgender (i.e., their gender identity aligns with their sex assigned at birth), although this cannot be ascertained from the available data. This design limitation precludes an interpretation of the relevance of these results for transgender and gender diverse (TGD) individuals.40 As all studies reported gender/sex data as either a female or male designation, analyses were limited to binary sex comparisons.
Physical activity directly influences several domains of mitochondrial biology.41,42 Physical activity was available as a variable in 5 studies, yielding 4 comparisons of mitochondrial biology pre- vs. post-exercise interventions, and 2 comparisons of individuals with different activity levels (e.g., sedentary vs. active).
2.6 |. Data synthesis and statistical analysis
PRISMA guidelines were consulted throughout the meta-analysis process to ensure standardized methodology. Effect sizes for each subdomain and individual measures were calculated as the standardized mean difference (Hedge’s g) between binary sexes for each measure of mitochondrial biology. A g value of ±1.0 indicates that the two sexes differed by one standard deviation (SD). Hedge’s g was used as it includes a correction factor that outperforms Cohen’s d for small sample sizes (under n = 20).39 As no field-specific effect size interpretation guidelines yet exist for mitochondrial biology, guidelines were adapted from a recent meta-analysis on metabolic syndrome components,43 whose cutoffs are comparable to those in other fields.44,45 Effect sizes were considered negligible when falling between ±0 and 0.19, small between ±0.20 and 0.39, medium between ±0.40 and 0.79, large between ±0.8 and 0.99, and very large > ±1.00.
Forest plots show Hedge’s g with 95% confidence intervals (C.I.) with distinct background colors to indicate large effect sizes (g > ±0.8; yellow for higher in women, blue for higher in men). Results are organized by the domain of mitochondrial biology, and secondarily by OxPhos complex, methodological approach, and specific measure, as appropriate. Effect sizes are displayed as calculated for all measures excluding MRS measures of phosphocreatine (PCr) time constant, for which the displayed effect size is the inverse of the calculated value. Since the time constant is considered roughly inverse to mitochondrial function, displaying the inverse of the measure allows higher values to be interpreted as a “better” function, aligning its interpretation with the rest of the forest plot.
For articles containing multiple reported measures with high biologic similarity (e.g., OxPhos CI+II and ETS CI+II measured in the same participants and tissues using the same methods), only one measure was included, selected based on methodological compatibility with other studies, which helps keep relative study weights comparable. As study sample sizes varied by more than two orders of magnitude, we chose to calculate an unweighted pooled estimate for each metric. Using this approach, each study has an equal weight on the overall estimate, rather than reflecting only the largest studies. Of the 50 original articles included, only 7 (14%) reported sex differences as a primary outcome, thus minimizing the risk of publication bias (i.e., studies showing significant sex differences would be preferentially published, and studies with non-significant ones would remain unpublished) for our primary outcome of sex differences.
For each sub-domain, the proportion of studies/measurements that were either “higher in women” or “higher in men” was compared using χ2 tests of equal proportions where the null hypothesis is that an equal number of studies fall on either side of the g = 0. Ah statistical tests were performed in Prism (version 8.4.3) or Excel (version 16.52) using two-sided distributions. Each domain of mitochondrial biology was measured separately for between 1 and 3 comparisons; the a was set at 0.05 but adjusted where appropriate and reported as such in the text. Figures report unadjusted p-values.
3 |. RESULTS
3.1 |. Mitochondrial content is higher in women
Mitochondrial content was measured in 13 studies for a total of 27 measures (26 CS, 1 cardiolipin) across 264 participants (126 women) and 13 tissues (Figure 3A). Women had higher mitochondrial content in most studies (20 of 26, χ2 p = .01) for an overall estimate slightly higher in women (average g = 0.20).
FIGURE 3.
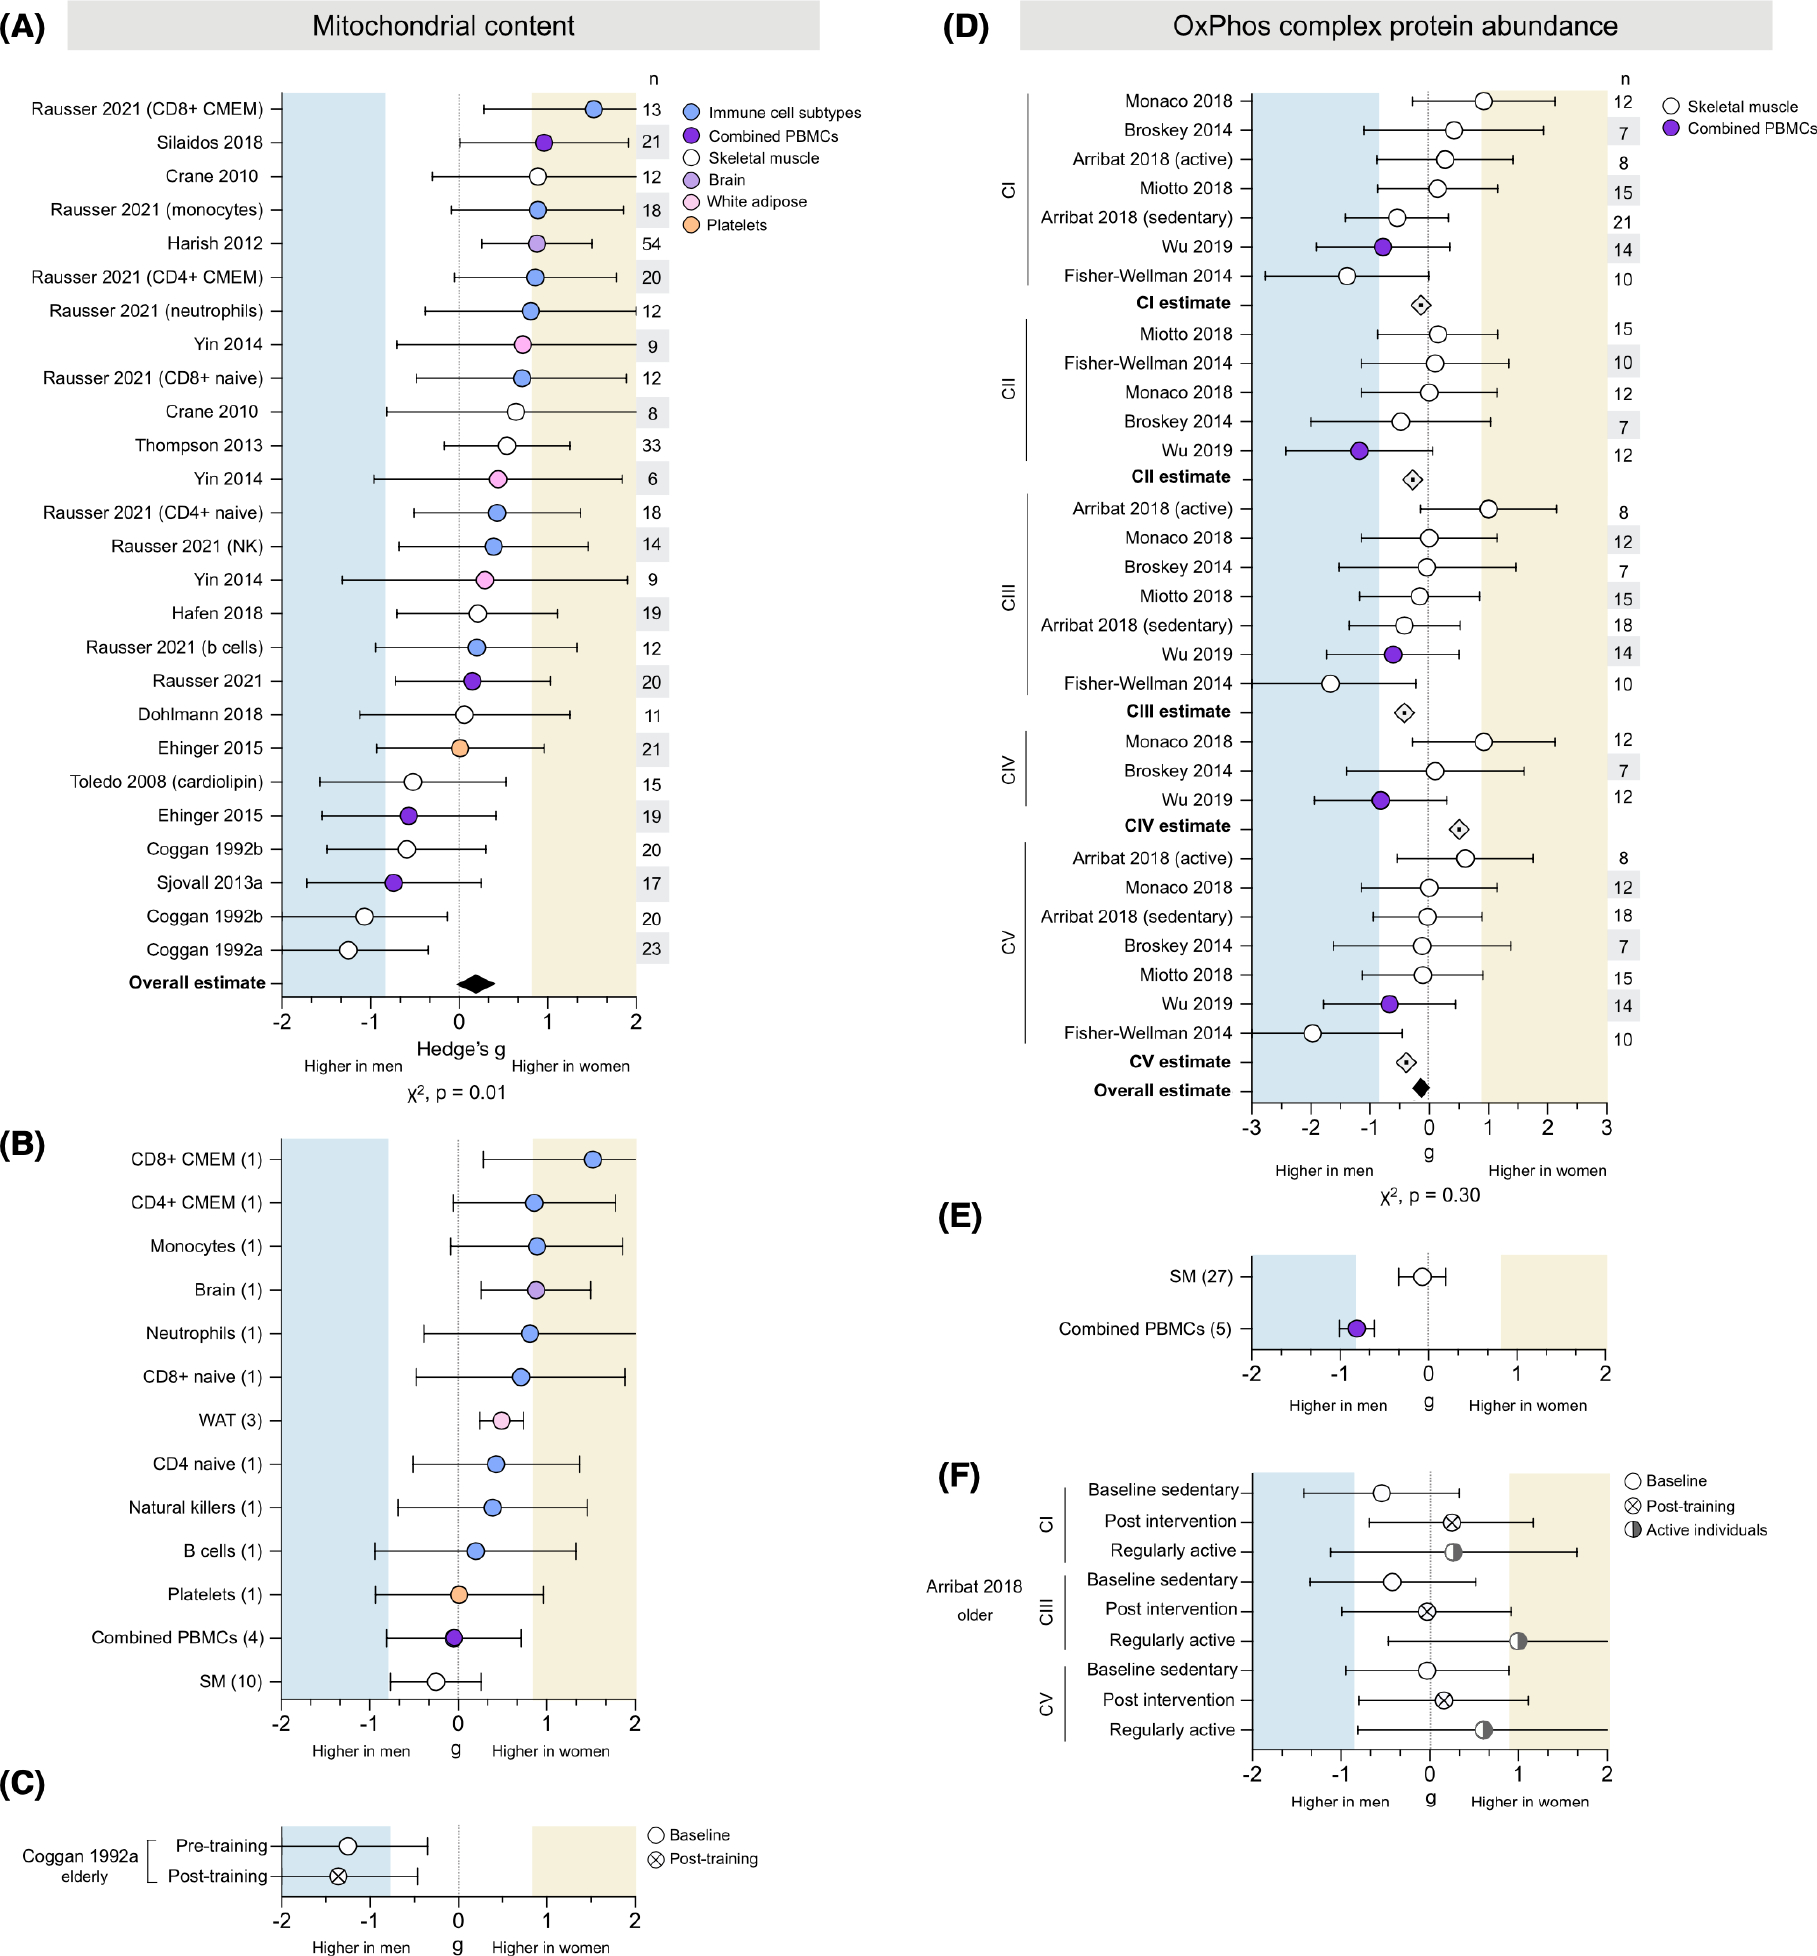
Mitochondrial content is consistently higher in women, but OxPhos complex protein abundance shows no consistent sex difference. (A) Forest plots of standardized mean difference (Hedge’s g) and pooled overall effect estimate (♦) for mitochondrial content (CS activity unless otherwise noted), color-coded by tissue. Values >0 indicate higher average production in women, and values <0 indicate higher production in men. Study n (women and men combined) is noted in the table to the right of the plot. (B) The tissue-specific average effect size for mitochondrial content; the number of measures (papers combined) are noted on the left. (C) Standardized mean difference (Hedge’s g) and pooled effect estimate for CS activity before and after exercise training. (D) Hedge’s g, complex-specific average estimate (⟐), and pooled effect estimate (♦) for oxidative phosphorylation (OxPhos) protein abundance, ordered by OxPhos complex. (E) The tissue-specific average effect size for OxPhos protein abundance (all complexes combined). (F) OxPhos complex protein abundance in sedentary individuals (baseline and post-exercise intervention) compared to regularly active individuals. Unadjusted p-values from Chi-square
3.1.1 |. Tissue specificity
Mitochondrial content demonstrated potential tissue-specificity (Figure 3B). All isolated leukocyte cell types showed higher CS activity in women (from g = 0.20 to 1.52). Women also had higher CS activity in white adipose tissue (WAT) and brain tissue, (g = 0.49 and 0.88, respectively). However, each of these tissues (isolated leukocytes, WAT, and brain tissue) was measured in one study. Tissues measured across multiple studies, such as combined peripheral blood mononuclear cells (PBMCs) and skeletal muscle, demonstrated mixed-sex effects by study and no overall sex differences (g = −0.05 and −0.20, respectively). Platelets were measured in one study and showed almost equal content in women and men (g = 0.01).
3.1.2 |. Exercise
One study assessing exercise in elderly individuals found that men had higher CS activity than women pre-exercise (g = −1.25, very large effect size), a difference marginally accentuated post-exercise (g = −1.37, very large) (Figure 3C).
3.2 |. OxPhos protein abundance does not exhibit consistent sex difference
OxPhos complex protein abundance was measured in six studies for a total of 32 measures (CI, 8; CII, 5; CIII, 8; CIV, 3; CV, 8) across 87 people (42 women) and two tissues (Figure 3D). The measures were evenly distributed between higher in women or men for a negligible overall effect (average g = −0.19, χ2 p = .30). Most studies found higher CI abundance in women, but studies reporting higher CI abundance in men had larger effect sizes, resulting in a negligible CI-specific estimate (average g = −0.14). Similarly, measures of CII abundance were split between higher in women or men, for an overall estimate slightly higher in men (g = −0.28). A stronger effect was observed in both CIII and CV abundance, which was higher in men (g = −0.42 and g = −0.39, respectively). In contrast, CIV abundance was approximately equal in women and men (g = 0.07), indicating potential OxPhos complex-specific sex differences.
3.2.1 |. Tissue specificity
Skeletal muscle OxPhos abundance showed wide variation in both strength and direction of differences, for every OxPhos complex, resulting in a skeletal muscle-specific effect size of −0.27 (small, higher in men) (Figure 3E). In contrast, PBMC protein abundance was higher in men for all OxPhos complexes (from g = −0.61 to g = −1.18), resulting in a large leukocyte-specific effect size of −0.81 (higher in men). However, all PBMC measures came from one study, making it impossible to disentangle tissue-specific from method-specific factors.
3.2.2 |. Exercise
One study found higher protein abundance in active women than active men across all complexes (from g = 0.27 to g = 1.00) (Figure 3F). Sedentary men had higher protein abundance than sedentary women at baseline (from g = −0.03 to g = −0.48), but post-exercise intervention measures showed protein abundance was comparable between sexes (from g = −0.03 to g = 0.25).
3.3 |. OxPhos enzyme activities do not exhibit consistent sex differences
Respiratory chain complex enzymatic activity was measured in 6 studies for a total of 40 measures (CI, 11; CII, 15; CIII, 1; CIV, 12; CV, 1) across 145 people (63 women) and 11 tissues (Figure 4A). The measures were evenly distributed between those higher in women or men and showed no overall effect (g = −0.01; χ2 p = .31). In analyses disaggregated by OxPhos complexes, CI activity measures showed no overall effect. Measures higher in women tended to demonstrate stronger effect sizes (up to g = 1.36), but the even distribution of values resulted in OxPhos complex-specific average effect sizes only negligibly higher in either women or men.
FIGURE 4.
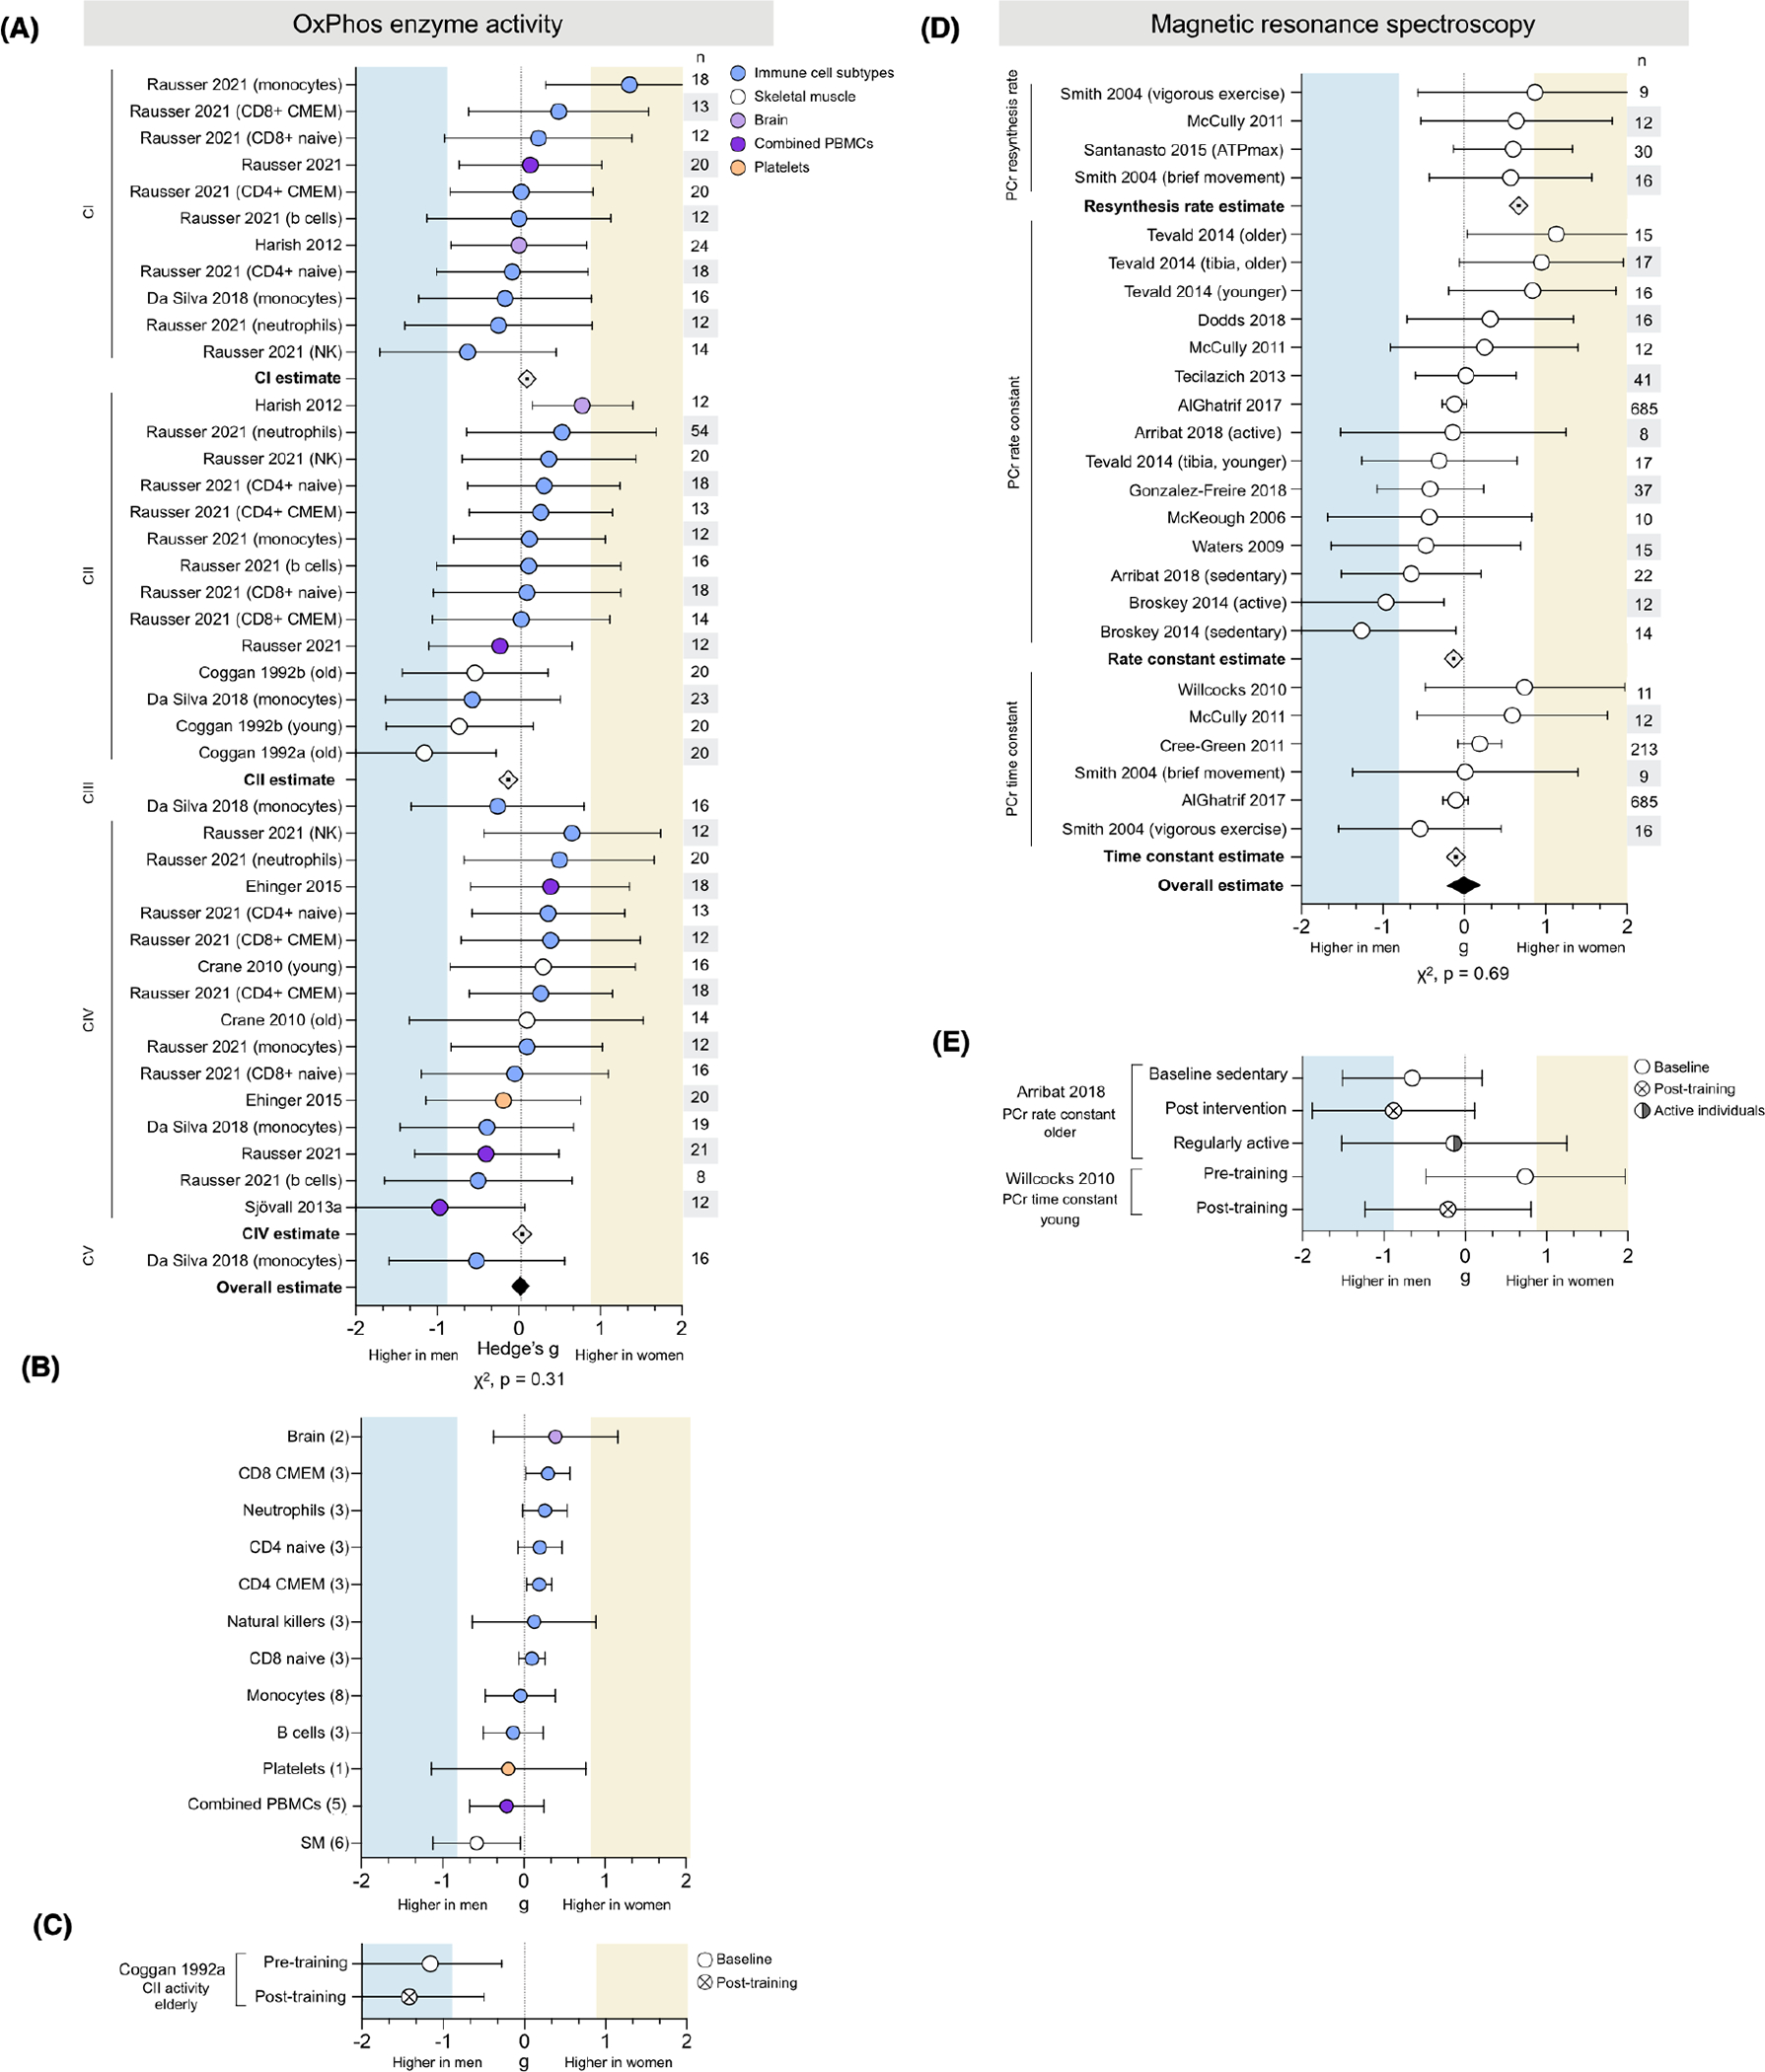
Neither oxidative phosphorylation enzyme activity nor in vivo MRS measures demonstrate consistent sex differences. (A) Forest plots of standardized mean difference (Hedge’s g), oxidative phosphorylation (OxPhos) complex-specific average estimate (⟐), and pooled overall effect estimate (♦) for OxPhos enzymatic activity, ordered by complex and color-coded by tissue. Values >0 indicate higher average production in women, and values <0 indicate higher production in men. Study n (women and men combined) is noted in the table to the right of the plot. (B) The tissue-specific average effect size for OxPhos enzyme activity; the number of measures (papers combined) are noted on the left. (C) Hedge’s g for CII activity before and after exercise training. (D) Hedge’s g, measure-specific average estimate (⟐), and pooled effect estimate (♦) for in vivo MRS, ordered by measurement. (E) In vivo MRS measures in sedentary individuals (baseline and post-exercise intervention), compared to themselves and/or to regularly active individuals. Unadjusted p-values from Chi-square
3.3.1 |. Tissue specificity
CII activity in isolated leukocyte subtypes was consistently higher activity in women (Figure 4A). Cell subtype data available from one study included both naïive and memory states of CD4+ and CD8+ T cells, two states well known to have different mitochondrial profiles.46 Tissue-specific average effect sizes concur, with six of the eight leukocyte subtypes showing higher activity in women (Figure 4B). In contrast, mixed PBMCs (a mixture of lymphocytes and monocytes) were only negligibly higher in men (g = −0.16). Skeletal muscle OxPhos enzyme activity was moderately higher in men (g = −0.58), while brain tissue was slightly higher in women (g = 0.39).
3.3.2 |. Exercise
One study of physical activity found that an exercise intervention tended to accentuate the higher skeletal muscle CII enzymatic activity (g = −1.16 and −1.42, respectively) (Figure 4C).
3.4 |. Sex differences of in vivo mitochondrial OxPhos capacity may depend on the MRS metric used
In vivo phosphorus magnetic resonance spectroscopy (31P-MRS) was used to assess mitochondrial oxidative phosphorylation capacity in 14 studies for a total of 27 measures (PCr resynthesis rate, 4; PCr rate constant, 16; PCr time constant, 6) in skeletal muscle across 1163 people (611 women) (Figure 4C). There was no data available for tissues other than skeletal muscle, or exercise-related analyses. Across all metrics, there is no evidence of sex differences (average g = 0.00, χ2 p = .78). Considered independently, both PCr rate constant and time constant showed negligible sex differences (average g = −0.13 and 0.10, respectively). In contrast, all measures of PCr resynthesis rate were higher in women ranging from medium to large effect sizes (g = 0.57 and 0.87, respectively), for a measure-specific average effect size of g = 0.67 (medium). Studies of PCr rate and time constant had significantly larger sample sizes (up to 685 people per measure) compared to studies of PCr resynthesis rate (n = 9 to 30 participants), which may contribute to the discrepancy in reported effect sizes.
3.5 |. Mitochondrial ROS production is higher in men’s skeletal muscle
Mitochondrial ROS production was measured in 6 studies for a total of 31 measures across 152 people (90 women) (Figure 5A). There was an overall medium effect size showing greater ROS production in men than women (g = −0.49, χ2 p < .0001). The vast majority of measures were higher in men (88%), with effect sizes ranging from negligible (g = −0.03) to very large (g = −1.61). This effect was consistent across several experimental conditions, including in the presence of oligomycin (g = −0.47), rote-none (g = −0.07), succinate (g = −0.49), or other assorted carbohydrate or lipid substrates (g = −0.56).
FIGURE 5.
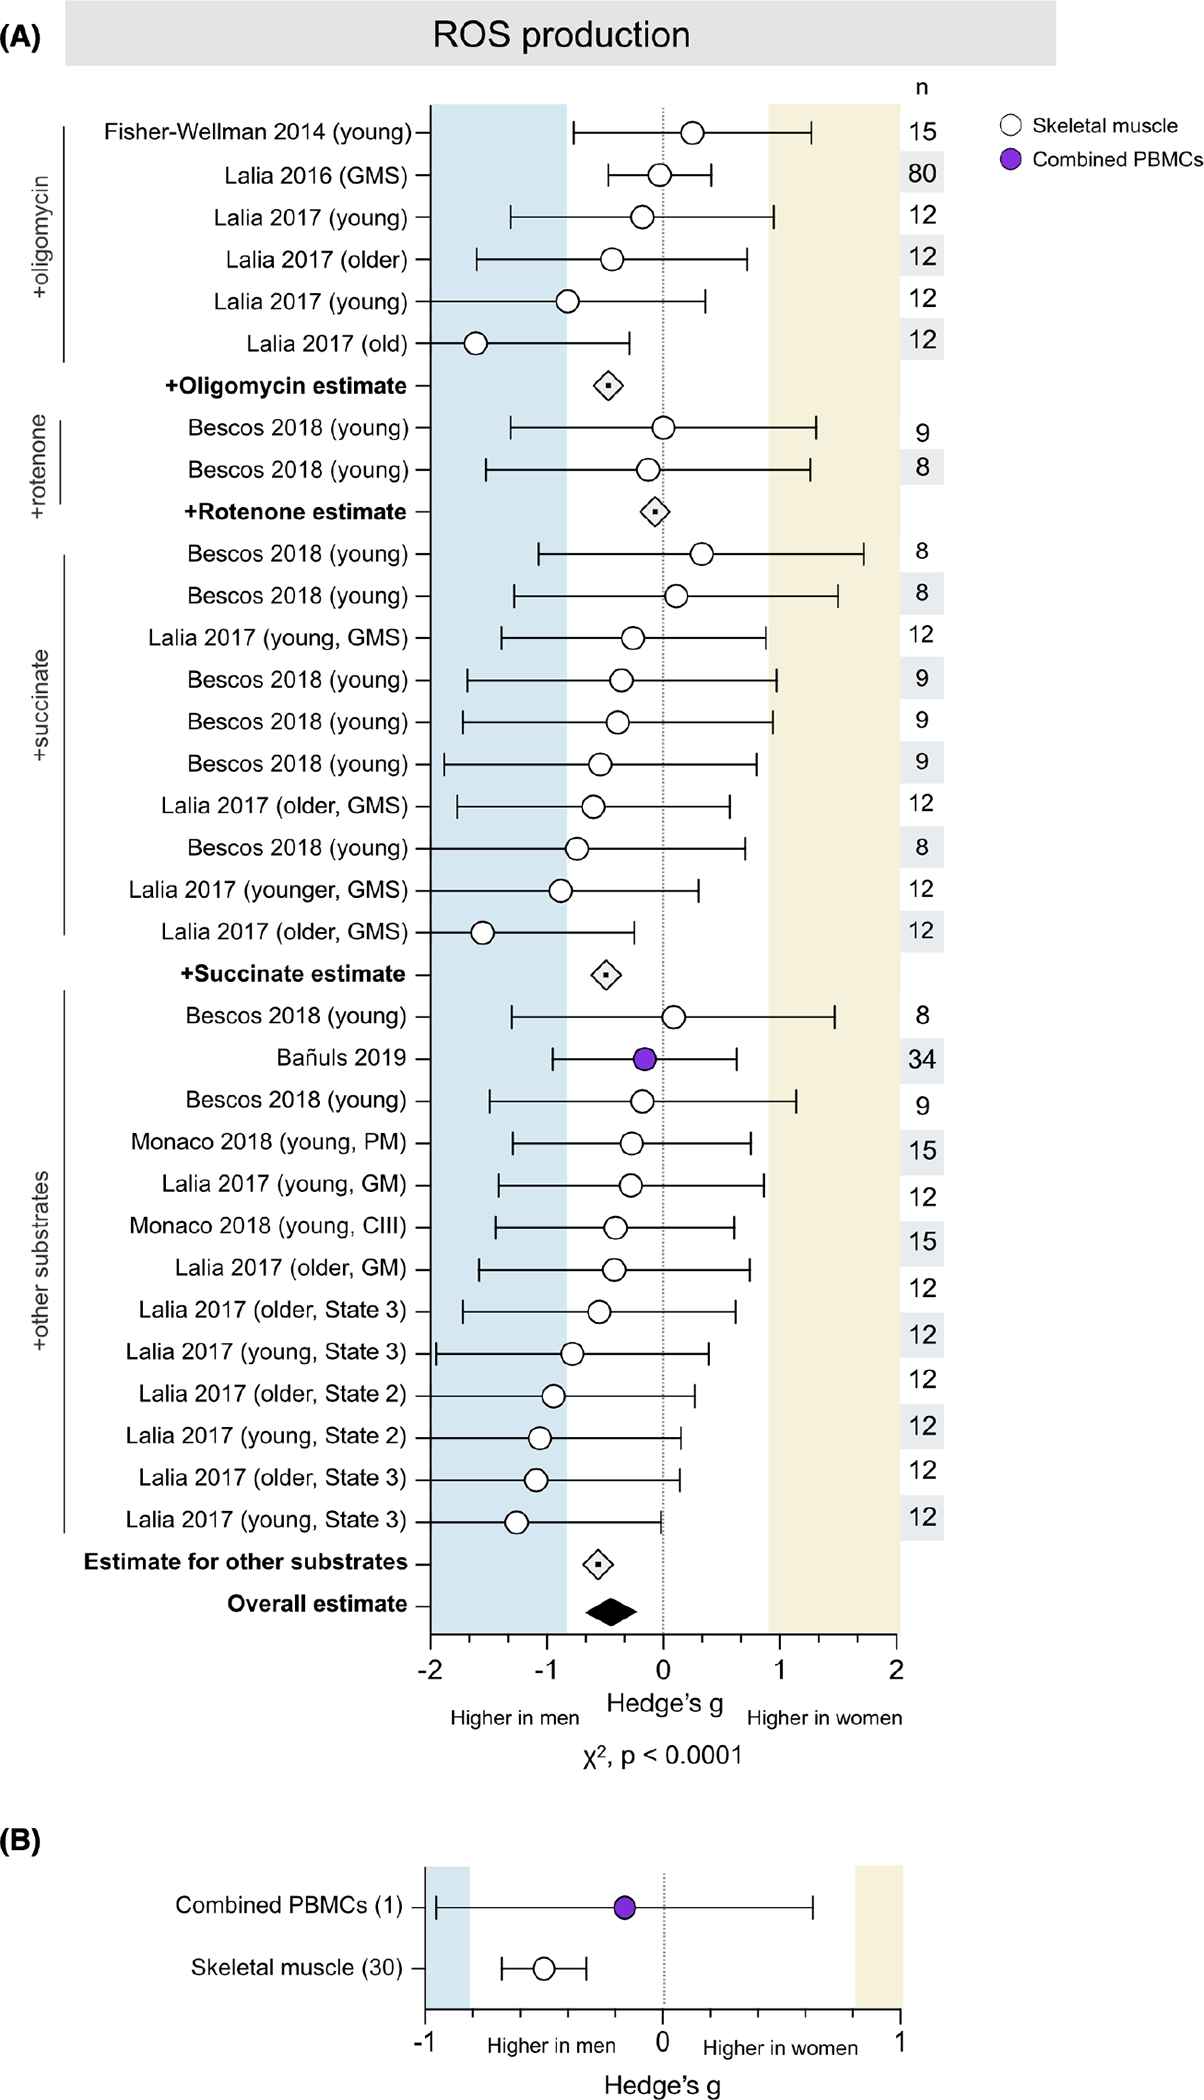
ROS production is consistently higher in men’s skeletal muscle. (A) Forest plot of standardized mean difference (Hedge’s g), substrate-specific average estimate (⟐), and pooled effect estimate (♦) for ROS production, color-coded by tissue and ordered by substrate (oligomycin, rotenone, succinate, and assorted carbohydrate and lipid). Values >0 indicate higher average production in women, and values <0 indicate higher production in men. Study n (women and men combined) is noted in the table to the right of the plot. (B) Tissue-specific averages for ROS production; the number of measures (papers combined) are noted on the left. Unadjusted p-value from Chi-square
3.5.1 |. Tissue specificity
Only one study measured ROS in combined PBMCs, finding negligibly higher production in men (g = −0.16) (Figure 5B). The remaining measures (30 of 31) were performed in skeletal muscle and yielded an average medium effect size (g = −0.50) indicating higher ROS production in men.
3.6 |. Sex differences in phosphorylating respiration are sensitive to tissue and methodology
A total of 22 studies measured phosphorylating (state 3) respiration, utilizing a range of methodological and analytic approaches. Phosphorylating respiration was normalized to CS in 6 studies, resulting in 27 measures across 120 people (63 women) and 3 tissues (Figure 6A). The majority of these (27 of 37, 72%) were measured in permeabilized cells and myofibers and showed negligible sex differences in CI-stimulated (0.10), CII-stimulated (−0.07), and CI+II (−0.03) respiration, for no sex difference overall (average g = 0.06). The remaining 10 measures were evaluated in mitochondria isolated from skeletal muscle. Women had higher respiration for CI+II and CI-stimulated state 3 respiration (g = 0.26 and 0.56, respectively). In contrast, men had higher CII-driven respiration (g = −0.68), indicating that sex differences may be specific to OxPhos complexes. Overall, measures of respiration normalized to CS show no sex difference whether collected in permeabilized fibers or isolated mitochondria (g = 0.16), for no substantial sex difference (g = 0.10, χ2 P = .31, adjusted α = 0.017). Non-phosphorylating respiration is depicted in Supporting Information Figure SI.
FIGURE 6.
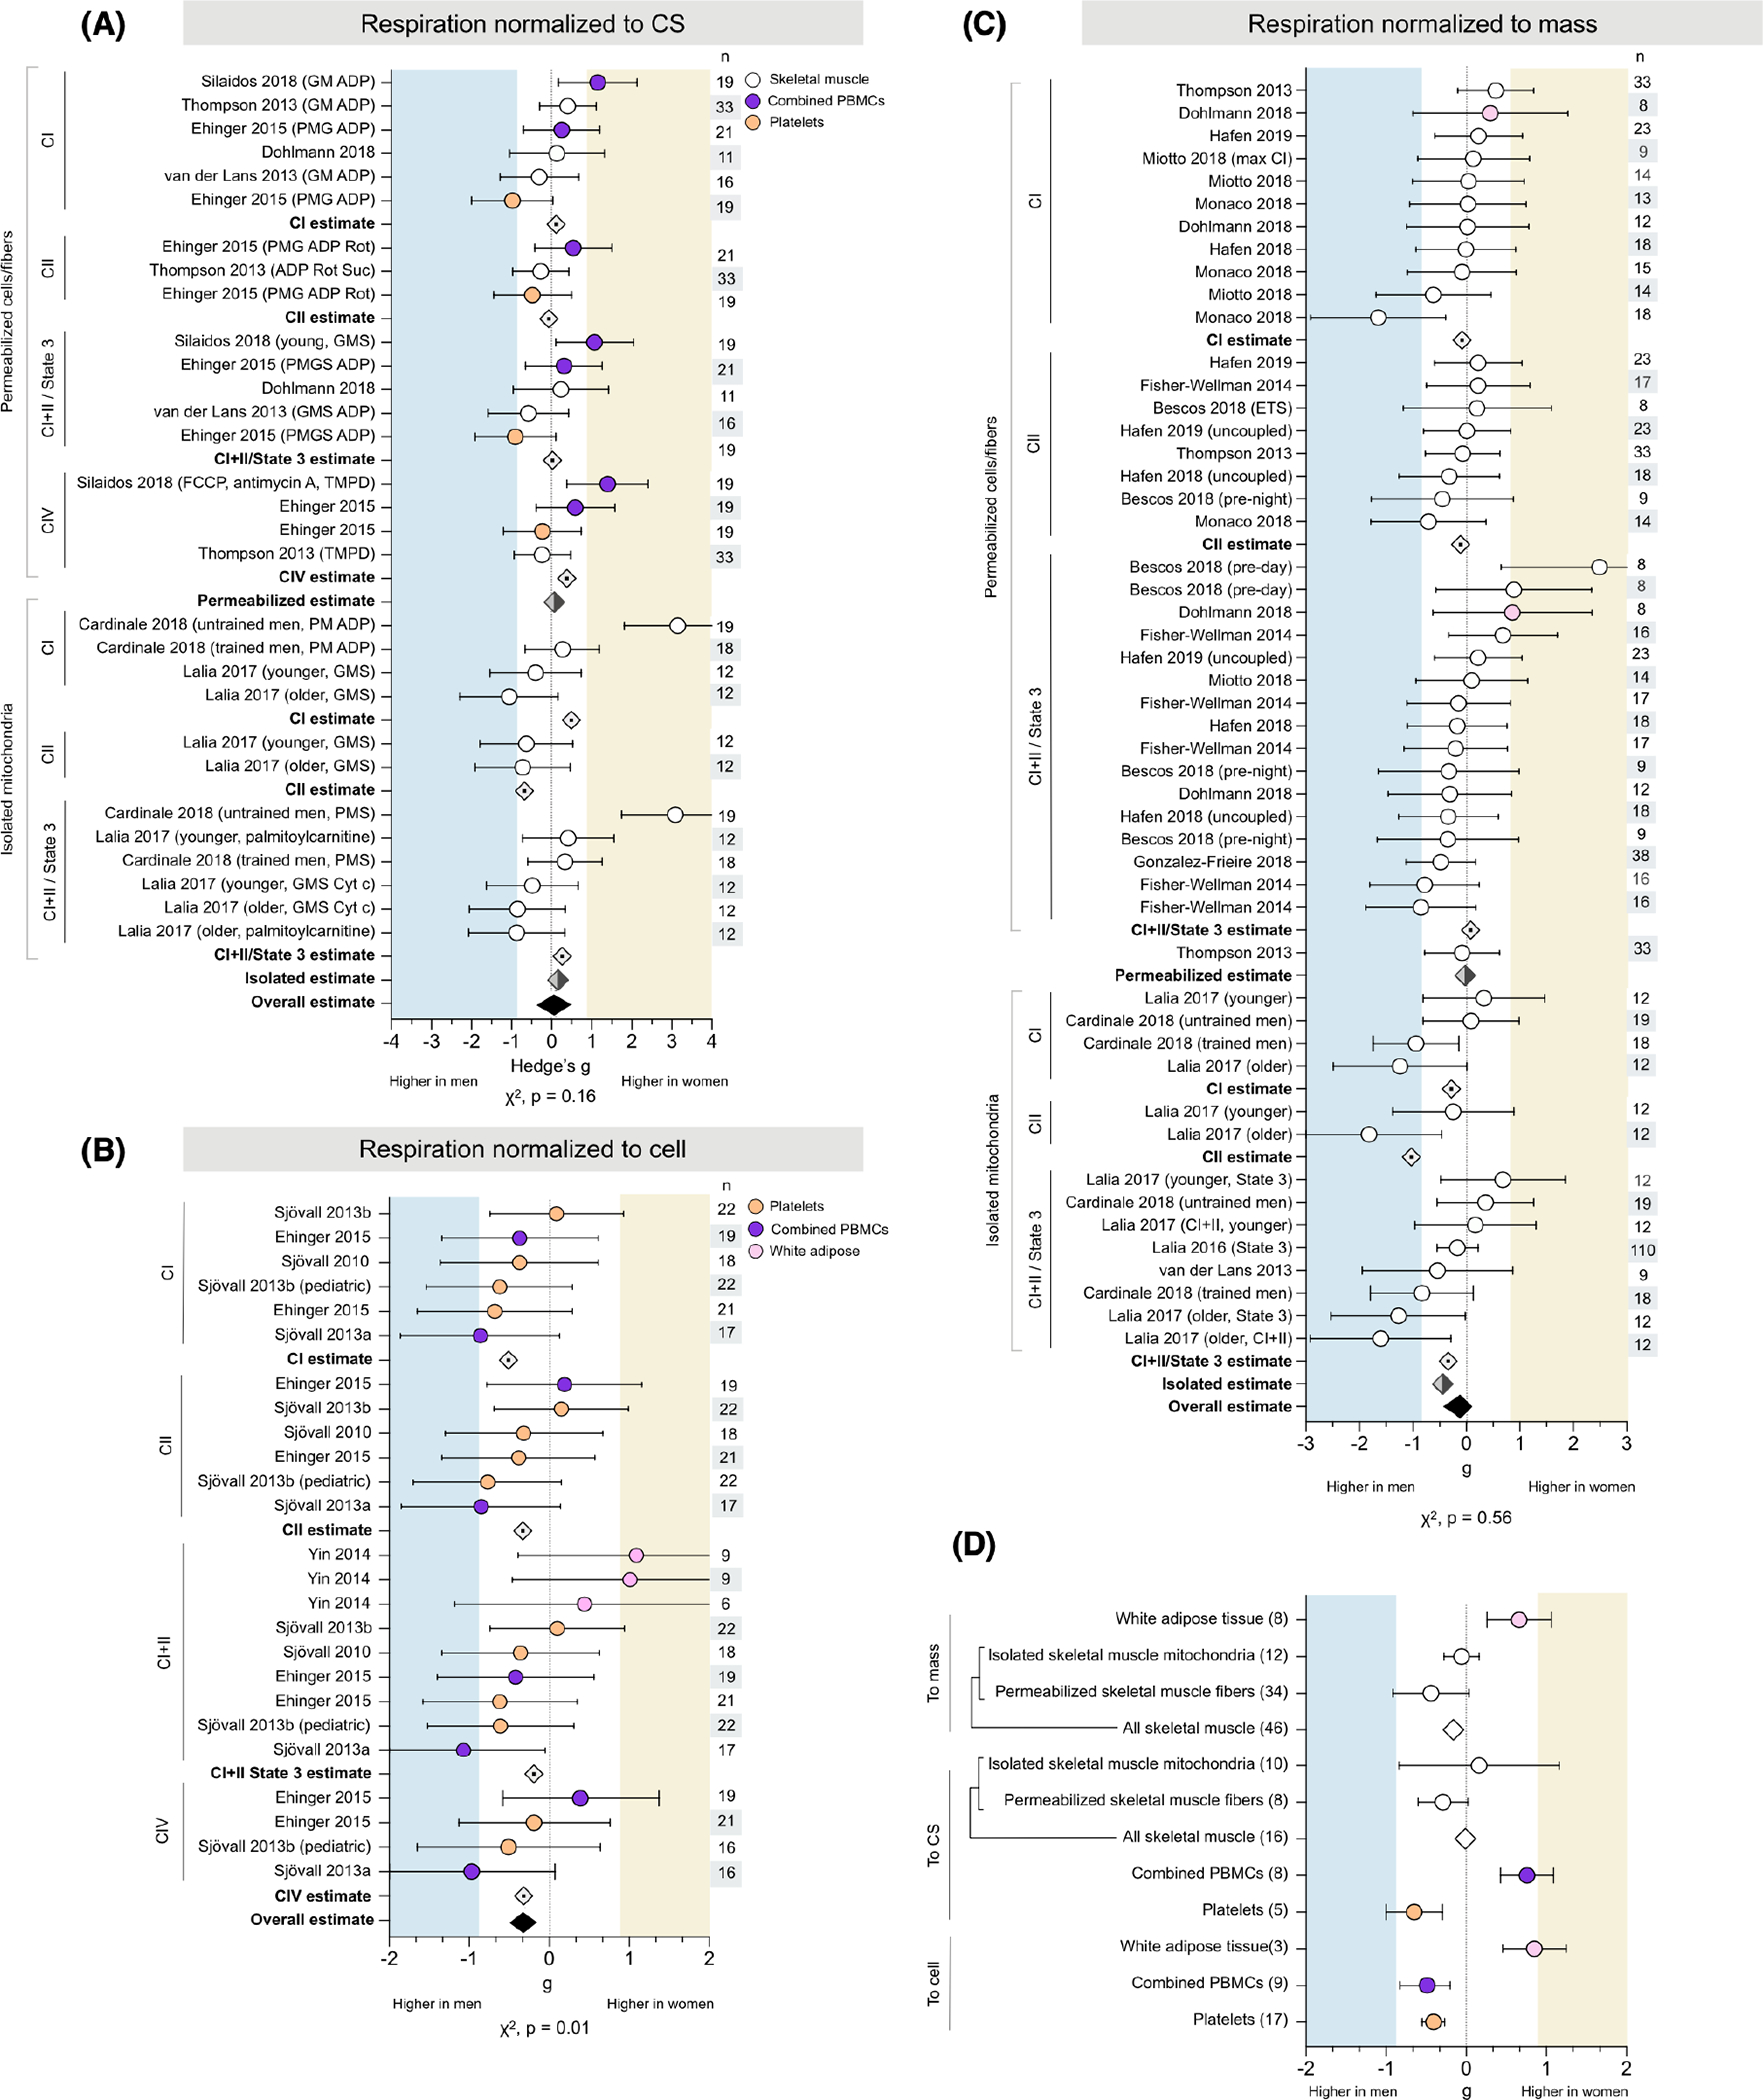
Sex differences in phosphorylating respiration are sensitive to tissue and methodology. Forest plots of standardized mean difference (Hedge’s g) for phosphorylating mitochondrial respiration normalized to (A) CS, (B) cell, or (C) mass, ordered by methodological approach (permeabilized cells/fibers vs. isolated mitochondria) and OxPhos complex, and color-coded by tissue. Including oxidative phosphorylation (OxPhos) complex-specific average estimates (⟐), method-specific estimates (⬗), and pooled overall effect estimate (♦). Values >0 indicate higher average production in women, and values <0 indicate higher production in men. Study n (women and men combined) is noted in the table to the right of the plot. (D) Tissue-specific average effect sizes for phosphorylating respiration, normalized to mass, CS, or cell. The number of measures noted to the left of the plot. Unadjusted p-values from Chi-square; adjusted α = 0.017
An additional 5 studies normalized phosphorylating respiration to cell count, resulting in 29 measures (CI, 8; CII, 6; CI+II, 11; CIV, 4; 26) from 87 participants (46 women) and three tissues (Figure 6B). Respiration was predominantly higher in men across all states, with average effect sizes ranging from negligible (g = −0.13, CI+II) to moderate (g = −0.51, CI), for an overall estimate slightly, but significantly, higher in men (g = −0.30, χ2 p = .013, adjusted α = 0.017).
Phosphorylating respiration was normalized to tissue mass in 12 studies, resulting in 45 measures across 302 participants (161 women) and two tissues (Figure 6C). Most of these measures (36 of 45, 80%) were collected from respirometry performed in permeabilized myofibers or WAT cells and demonstrated no sex differences in CI-, CII-, or CI+II-stimulated respiration (g = −0.08, −0.11, and 0.08, respectively), for an overall absence of sex differences (average g = −0.02). The remaining 9 measures were from 3 studies that performed respirometry in mitochondria isolated from skeletal muscle. Average respiration was higher in men across all states, with effect sizes ranging from small to very large (CI, g = −0.28; CII, −1.03; CI+II, −0.34). Overall, phosphorylating respiration normalized to mass was moderately higher in men when measured in isolated mitochondria (g = −0.44), but not in permeabilized cells/fibers, for a combined lack of sex differences (g = −0.12, χ2 p = .56, adjusted α = 0.017).
3.6.1 |. Tissue specificity
These measures of phosphorylating respiration demonstrated potential tissue-specific sex differences (Figure 6D). Regardless of methodological approach, women had higher phosphorylating respiration in WAT (g = 0.66, permeabilized cells; g = 0.85, isolated mitochondria). Platelet respiration was higher in men across all normalizations (g = −0.61, to CS; g = −0.41, to cell). However, sex differences in other tissues differed by the method: women had higher respiration in PBMCs when normalized to CS (average g = 0.73), but men had higher respiration when normalized to cell count (average g = −0.49). Skeletal muscle respiration normalized to CS tended to be negligibly higher in women when measured in isolated mitochondria (average g = 0.16), but measures in permeabilized myofibers were higher in men (average g = −0.29, small effect size). In contrast, all measures of skeletal muscle respiration normalized to mass were higher in men (ranging from g = −0.06 to g = −0.44). When measures from both permeabilized fibers and isolated mitochondria are considered together, overall skeletal muscle respiration does not differ between binary sexes (from g = −0.01 to g = −0.16).
3.7 |. Sex differences in mtDNAcn are tissue-specific
The number of mtDNA copies per cell, or mtDNAcn, was measured in 10 studies for a total of 42 measures across 308 people (146 women) and a wide range of tissues (Figure 7A). There were no consistent binary sex differences in mtDNAcn (average g = 0.01, χ2 p = .75) and, in contrast to other domains, there were 0 measures with strong sex effects for either women or men (g ≥ 0.8).
FIGURE 7.
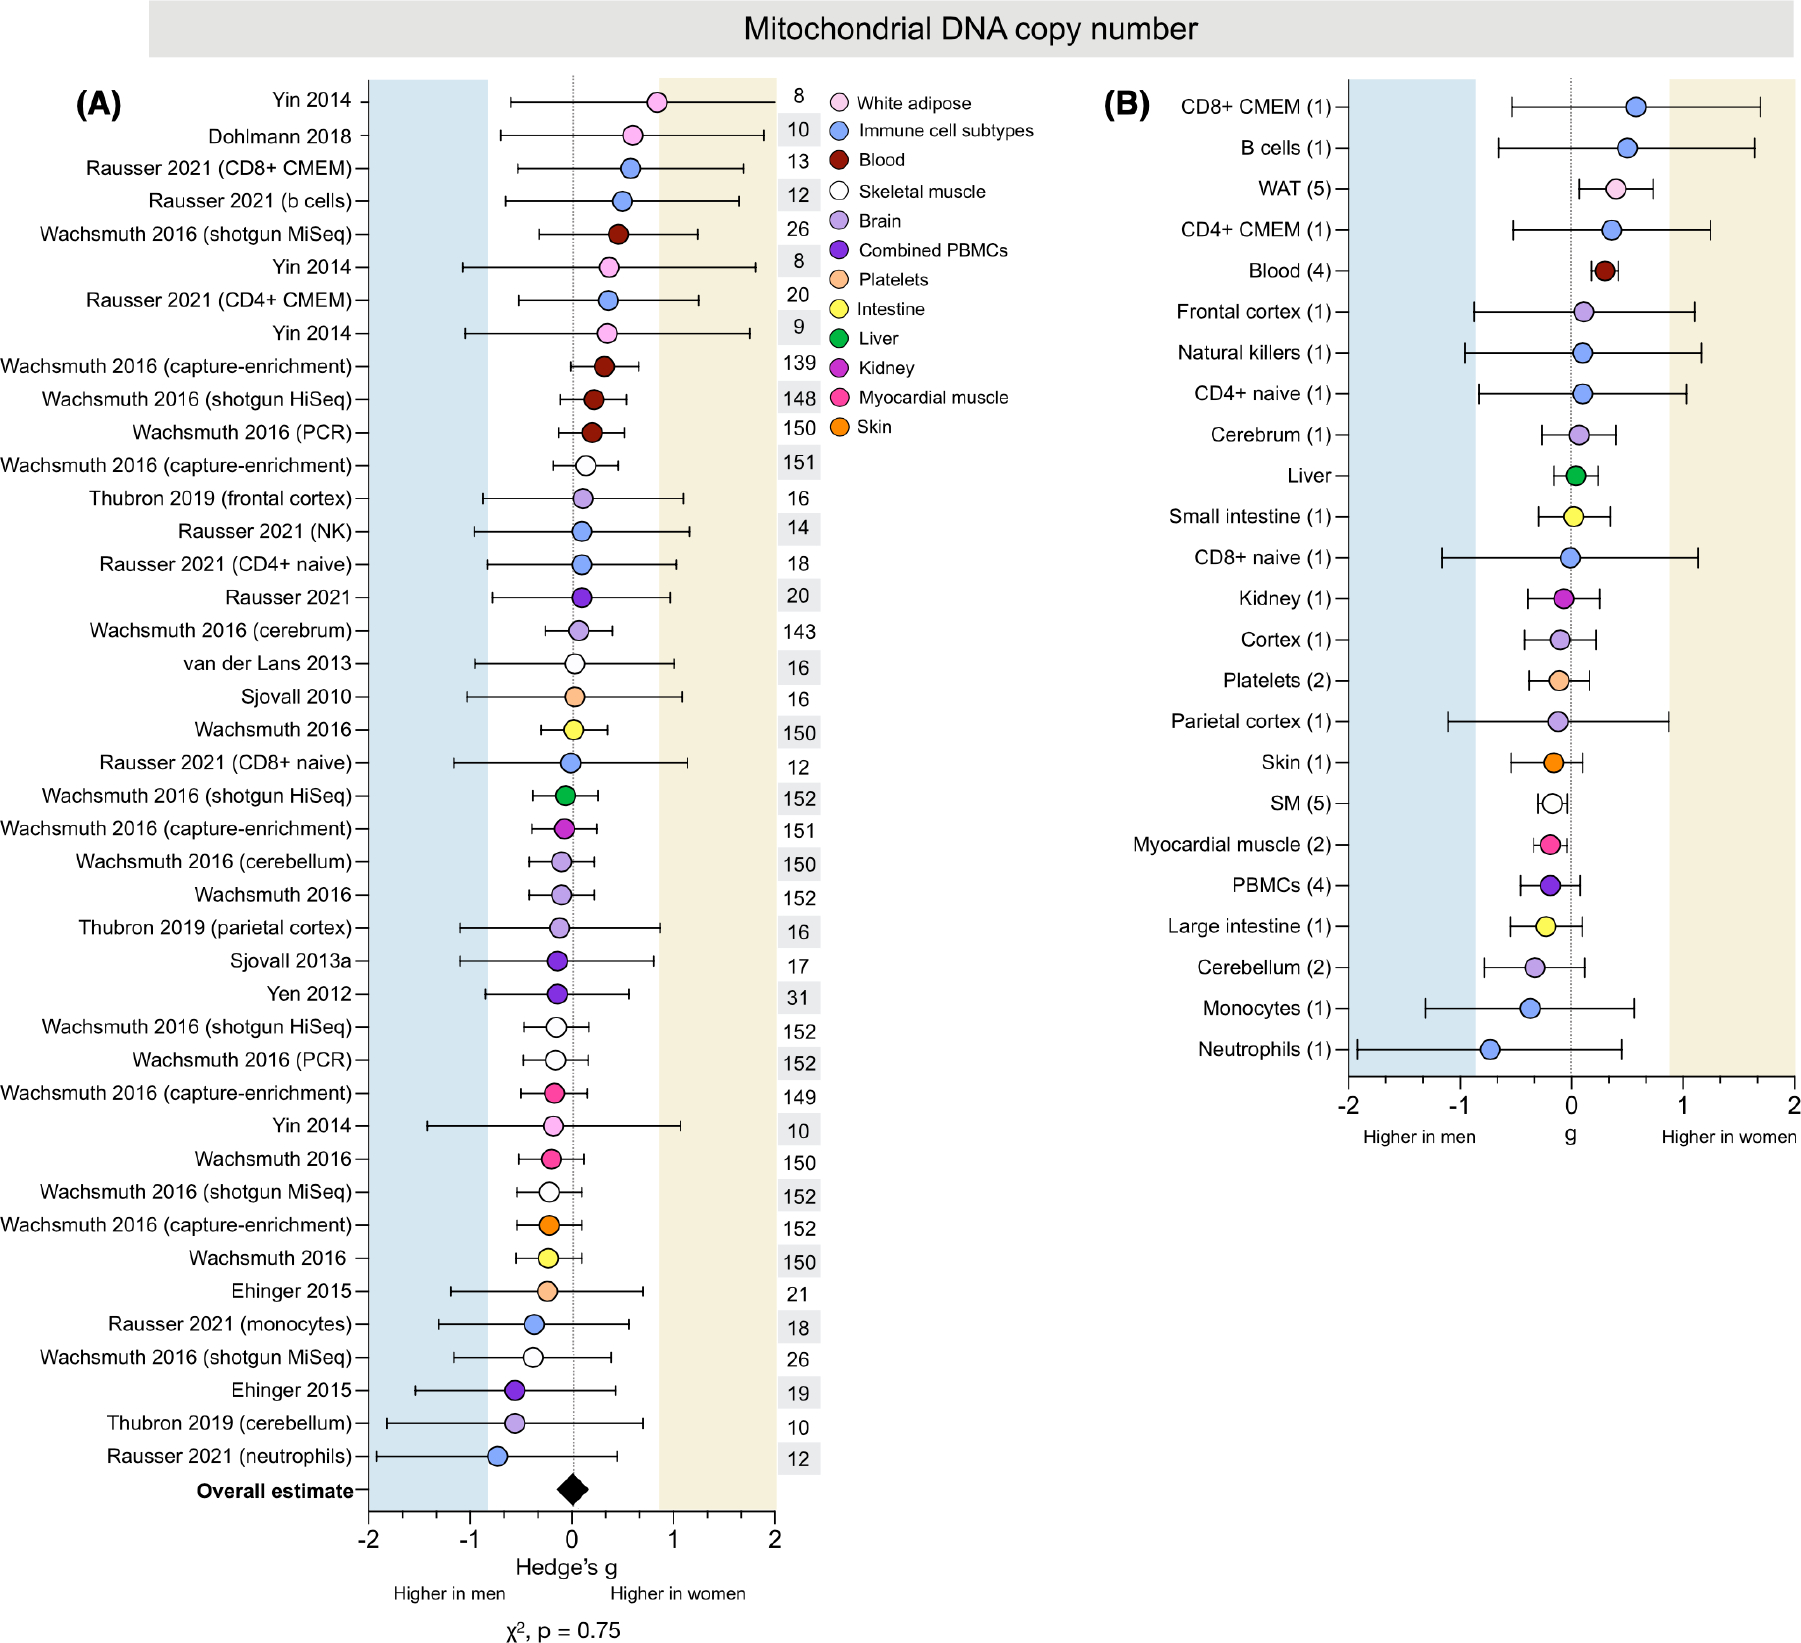
Sex differences in mtDNAcn are tissue-specific. (A) Forest plot of standardized mean difference (Hedge’s g) and pooled overall effect estimate (♦) for mitochondrial DNA copy number (mtDNAcn), color-coded by tissue. Values >0 indicate higher average production in women, and values <0 indicate higher production in men. Study n (women and men combined) is noted in the table to the right of the plot. (B) Tissue-specific average effect sizes for mtDNAcn; the number of measures is noted in the table to the left of the plot. Unadjusted p-value from Chi-square
3.7.1 |. Tissue specificity
Women had higher mtDNAcn across WAT and whole blood (g = 0.40 and 0.30, respectively; Figure 7B). Several immune cell subtypes also showed higher mtDNAcn in women, including B cells (g = 0.50) and CD8+ & CD4+ CMEM cells (g = 0.58 and 0.36, respectively). In contrast, men had higher mtDNAcn for both neutrophils (g = −0.73) and monocytes (−0.37). However, all measures of mtDNAcn in immune cell subtypes came from one study, precluding interpretation on the effects of tissue-specific or method-specific factors.
3.8 |. Skeletal muscle mitochondrial morphometry does not exhibit sex differences
Skeletal muscle mitochondrial volume density was measured in 7 studies for a total of 13 measures across 224 people (121 women) (Figure 8A). Only one measure showed substantially higher volume density in women (g = 1.15), while four measures demonstrated substantially higher volume density in men (ranging from g = −0.96 to −4.98). Overall, mitochondrial volume density appeared to be higher in men’s skeletal muscle (g = −0.60, χ2 p = .28, adjusted α = 0.025). However, this difference may be exaggerated by the presence of an outlier with an effect size almost three times larger than any other measure of volume density (g = −4.98). When this measure is removed, the average overall mitochondrial volume density decreases by almost half but remains higher in men (g = −0.31).
FIGURE 8.
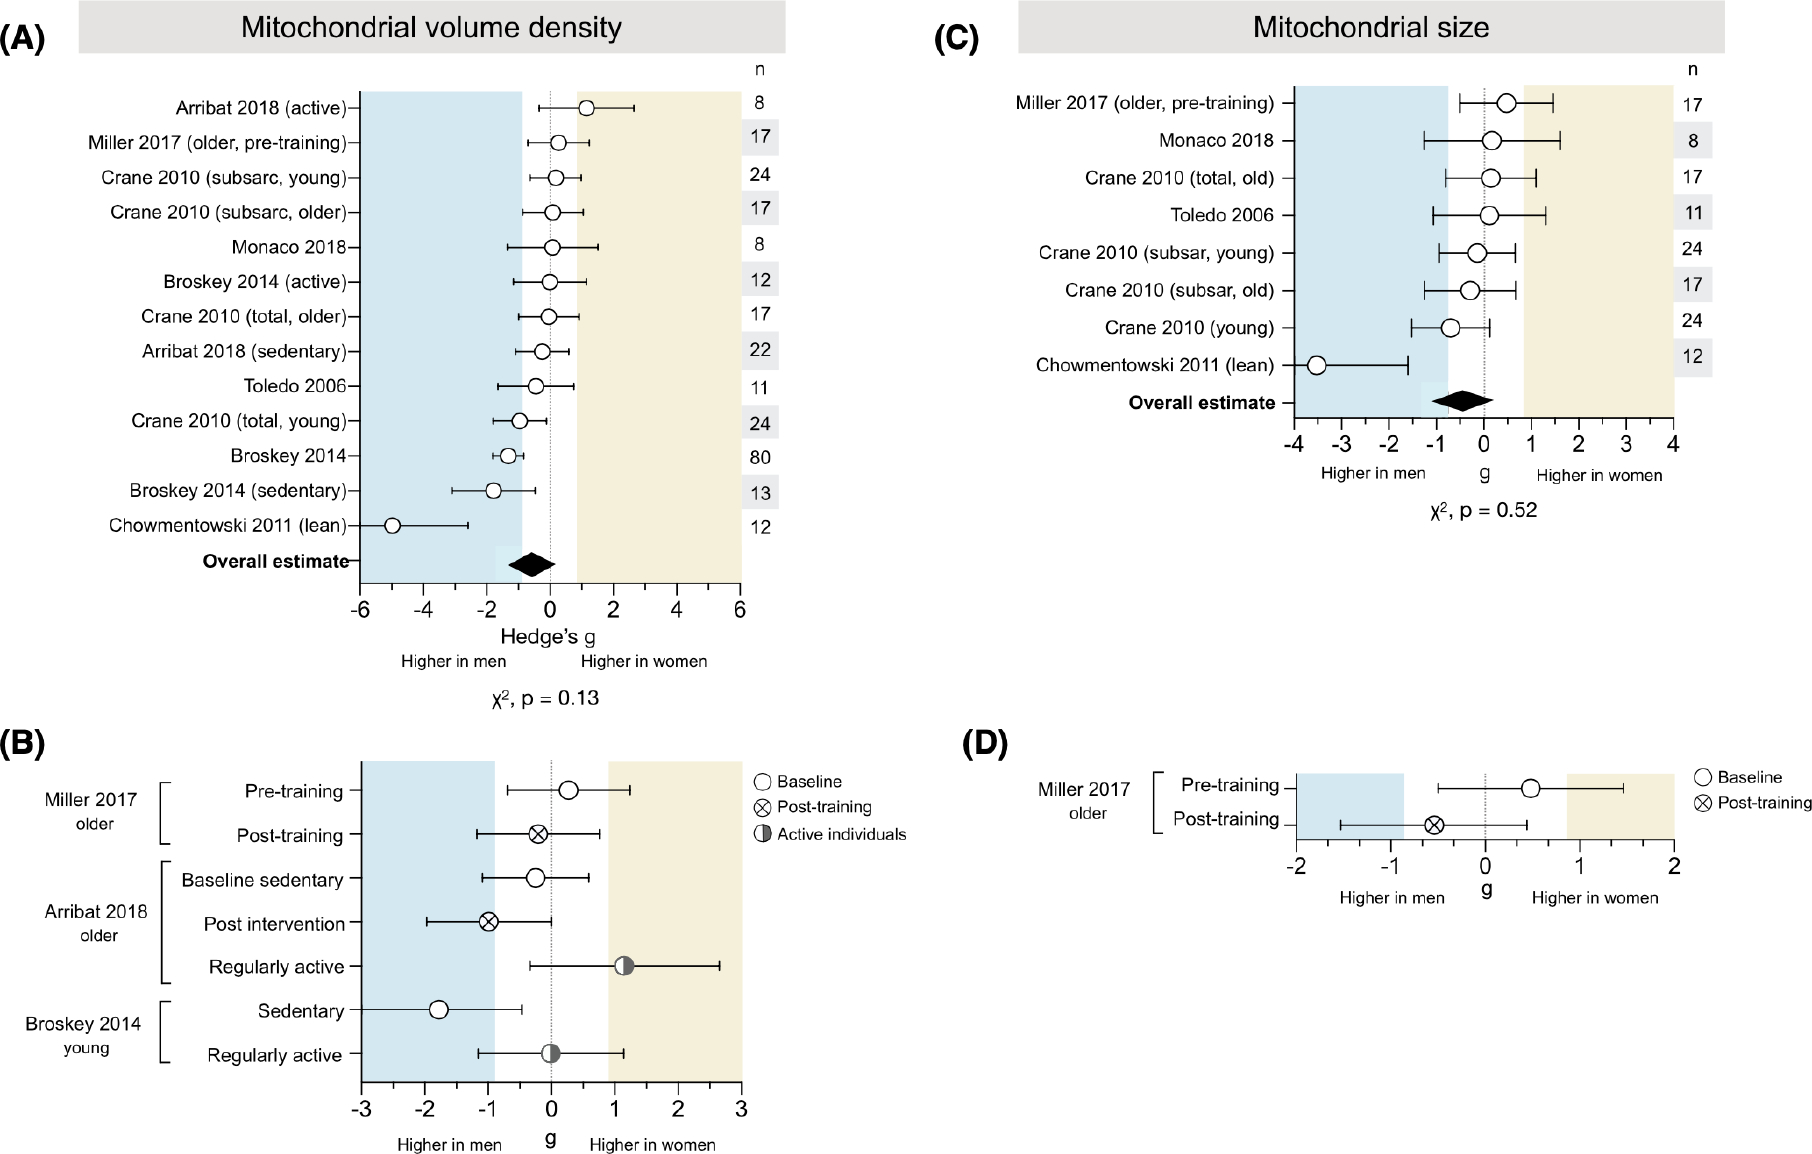
Skeletal muscle mitochondrial volume density and size lack consistent sex differences. (A) Forest plot of standardized mean difference (Hedge’s g) and pooled overall effect estimate (♦) for mitochondrial volume density. Values >0 indicate higher average production in women, and values <0 indicate higher production in men. Study n (women and men combined) is noted in the table to the right of the plot. (B) Measures of mitochondrial volume density in sedentary individuals (baseline and post-exercise intervention), compared to themselves and/or to regularly active individuals. (C) Hedge’s g and pooled effect estimate (♦) for mitochondrial size. (D) Measures of mitochondrial size in sedentary individuals (baseline and post-exercise intervention). Unadjusted p-values from Chi-square; adjusted α = 0.025
Skeletal muscle mitochondrial size was measured using electron microscopy in 5 studies for a total of 8 measures across 89 people (49 women) (Figure 8C). The measures were evenly distributed between being higher in women or men (χ2 p = .52, adjusted α = 0.025). The overall estimate was higher in men (g = −0.44), likely due to one measure with a very large effect size (g = −3.52). When this measure is removed, there is no sex difference in mitochondrial size (average g = −0.10).
3.8.1 |. Exercise
Two studies found higher volume density in men when assessed post-exercise intervention (g = −0.21 to −0.99) (Figure 8B), but pre-exercise measures varied, with one showing higher density in women (g = 0.27) and one showing higher density in men (g = −0.25). A third study found higher volume density in men among sedentary individuals (g = −1.78), but comparable density between sexes in active individuals (g = −0.01). One study assessed mitochondrial size in older individuals and found that women had larger mitochondria pre-training (g = 0.48), but men had larger size post-training (g = .0.54) (Figure 8D).
3.9 |. Binary sex differences in mitochondrial biology show weak to no association with age and BMI
We systematically evaluated a potential moderating role of age and BMI on all domains of mitochondrial biology described above. Only two domains showed a statistically significant correlation with age: as a study group’s average age increased, (i) ROS production became higher in men compared to women, and (ii) respiration per cell changed from higher in men to showing no sex difference (Figure 9A). However, this dataset is limited in its ability to address this question. Most mitochondrial domains exhibited poor age resolution across the lifespan: for example, most studies of ROS production were conducted in individuals aged 20–30 or 70–80, making our analysis functionally more of a two-group comparison than a true correlation. This poor resolution, along with analyzing multiple tissues and methods together, makes it difficult to interpret whether sex differences in mitochondrial biology are moderated by age.
FIGURE 9.
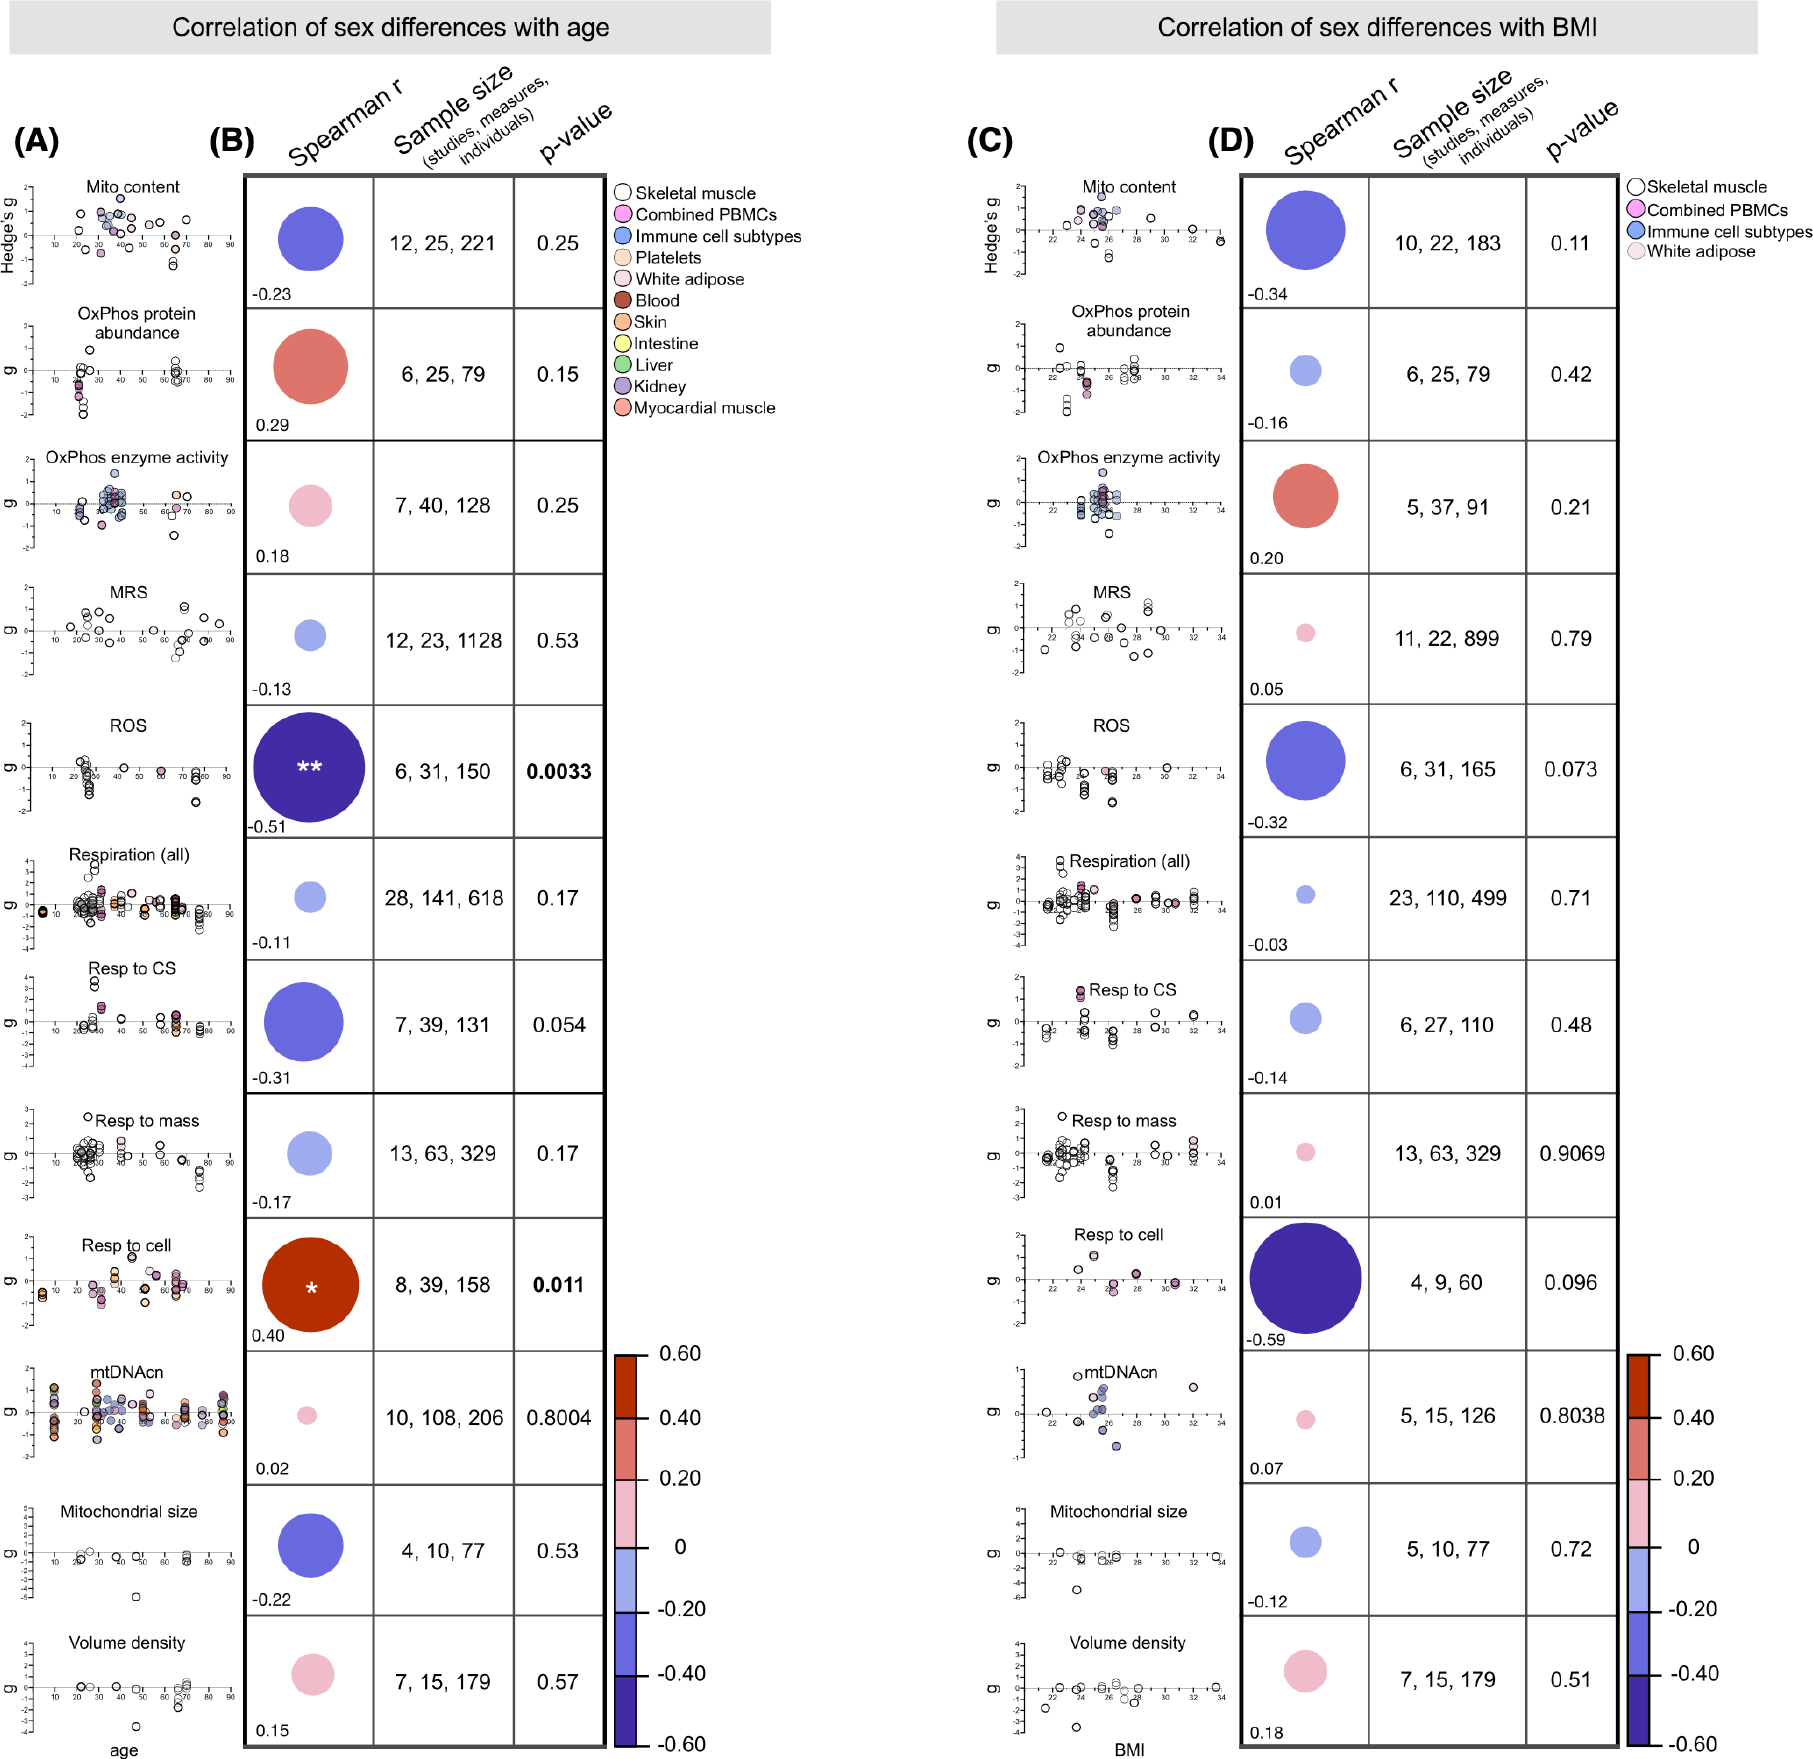
Binary sex differences in mitochondrial biology show weak to no association with age and BMI. (A) Effect size of mitochondrial sex differences (positive g reflects higher in women, negative g higher in men) as a function of average group age per measure, color-coded by tissue. Each datapoint is a single measure from one study, and each graph contains all available studies that reported a particular measure and average age. The strength of the association was determined with a linear correlation (Spearman r). (B) The slope and strength of the correlation is represented by the size and color of the circle. Significantly significant correlations (p < .05) are noted with an asterisk. The sample size is provided in terms of the number of studies, measures, and individuals. (C) Effect size of mitochondrial sex differences (positive g reflects higher in women, negative g higher in men) as a function of average group BMI per measure, color-coded by tissue. Each datapoint is a single measure from one study, and each graph contains all available studies that reported a particular measure and average BMI. The strength of the association was determined with a linear correlation (Spearman r). (D) The slope and strength of the correlation is represented by the size and color of the circle represent the slope and strength of the correlation. Significantly significant correlations (p < .05) are noted with an asterisk. The sample size is provided in terms of the number of studies, measures, and individuals. p-Values are unadjusted for multiple comparisons
There were no significant correlations between mitochondrial biology and average group BMI, a limited and imperfect surrogate for body composition or obesity47 (Figure 9B). The strongest negative correlation was for respiration to cell (r = −.59, p = −.096), suggesting that as BMI increases, the moderately higher respiration per cell in younger women approaches the null hypothesis. However, the relatively few measures on this analysis9 provide poor resolution and little confidence in this conclusion. Near-continuous coverage in average BMI was only present for analysis of in vivo MRS and the combined respiration plot, hoof which showed almost no correlation (r = .05 and −.03, respectively). Adjusting the significance threshold for multiple comparisons (n = 12 domains, adjusted α = 0.0042), we find no evidence that age or BMI moderate sex differences in mitochondrial biology.
3.10 |. Influence of sample sizes on sex differences
To systematically assess the extent to which sample sizes may have influenced effect size estimates of sex differences across domains of mitochondrial biology, we plotted effect sizes as a function of sample size (Figure 10A). For each available measure, as expected,48 studies with smaller sample sizes yielded larger effect size estimates compared with larger studies particularly for three subdomains: MRS (r = −.36, p-value = .04), mitochondrial respiration (r = −.26, p-value = .006), and mtDNAcn (r = −.38, p-value = .01). A similar association between sample size and effect size (r = −.17, p-value < .001) was observed when all measures of mitochondrial biology were analyzed together (Figure 10B).
FIGURE 10.
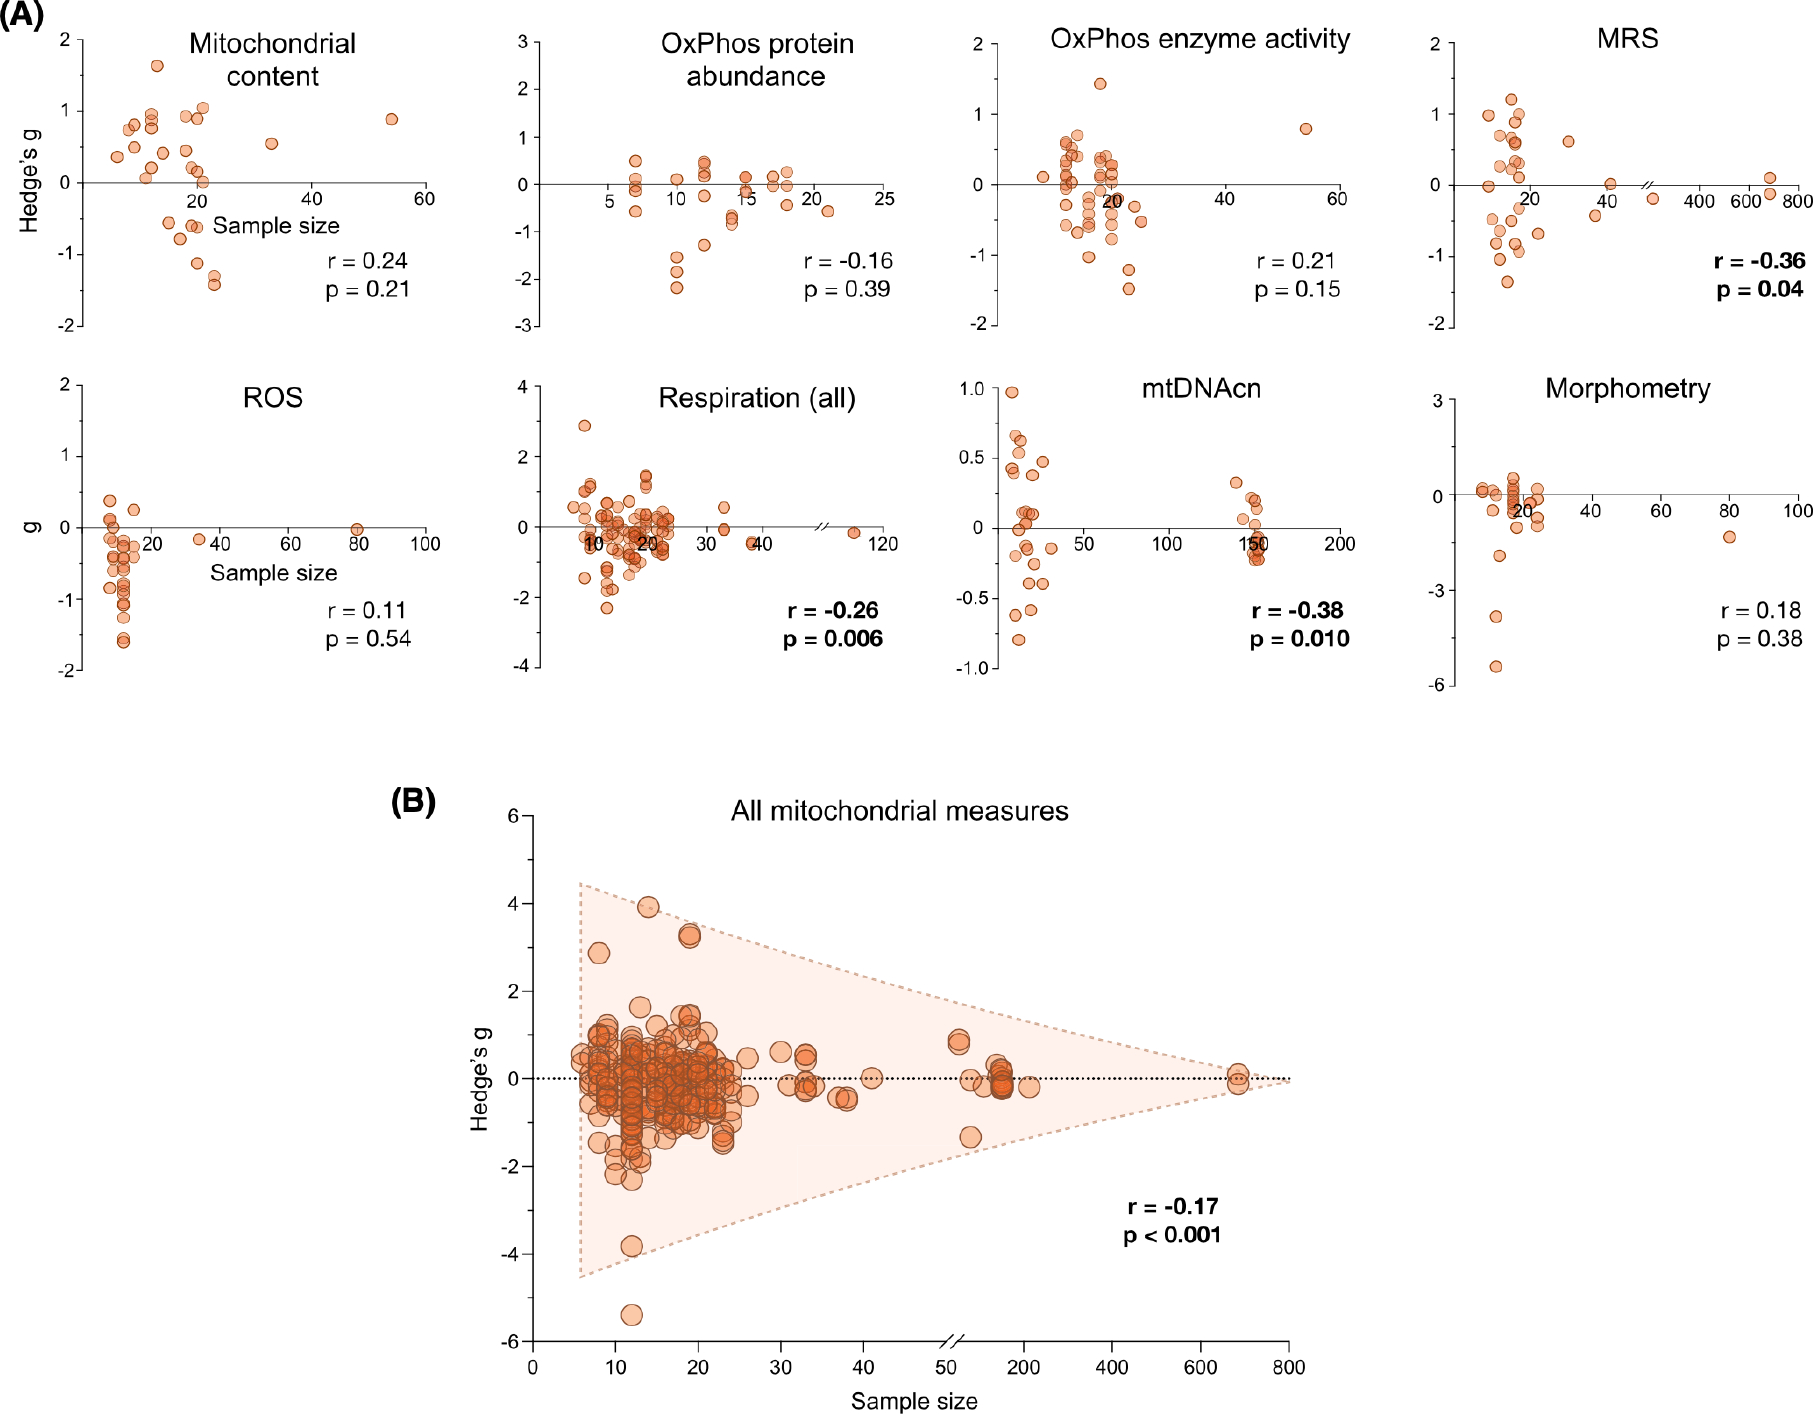
Observed sex differences in mitochondrial biology are negatively correlated with sample size. (A) Effect size of mitochondrial sex differences as a function of sample size, per domain of mitochondrial biology. Each point is a measure from a study, previously represented by a row on a forest plot; measures >0 indicate higher values in women, and measures <0 indicate higher values in men. The strength of the association was determined with a linear correlation (Spearman r) between the sample size and the absolute value of the effect size. (B) Effect size of mitochondrial sex differences as a function of sample size for all included measures of mitochondrial biology. The strength of the association was determined with a linear correlation (Spearman r) between the sample size and the absolute value of the effect size
4 |. DISCUSSION
In this meta-analysis of 39 distinct measures of mitochondrial biology from 50 studies combining 2258 individuals, only two measures demonstrated consistent binary sex differences: higher mitochondrial content in women’s WAT and isolated leukocyte subpopulations, and higher ROS production in men’s skeletal muscle. Other measures showed inconsistent sex differences with large divergences in strength and direction across studies, experimental conditions (e.g., metabolic substrates), and the tissues assessed. Sex differences across domains of mitochondrial biology showed weak to no interactions with BMI or age, although the available data offered sparse coverage of BMI and of the lifespan, limiting the interpretation of these findings. Overall, these results indicate a lack of binary sex differences across most domains of mitochondrial biology, with the exception of some domains, thus highlighting the need for adequately powered studies specifically designed to define the nature and magnitude of gender/sex and inter-individual differences in mitochondrial biology, and their relation to human health.
Three limitations of the current literature emphasize outstanding gaps in knowledge that poses challenges for the field. First, sex differences in mitochondrial health are heavily dependent on the tissue examined. For instance, women had higher respiration in WAT, while respiration appeared higher for men in platelets. This aligns with ongoing work characterizing biological sex variation within specific organ systems, such as the brain.49–51 Most available data included in this meta-analysis were derived from easily accessible tissues including blood, or biopsied skeletal muscle, or adipose tissue; thus, whether less-studied tissues exhibit sex differences remains largely unknown. Sex differences may further vary between short-lived (certain blood leukocytes) and long-lived cells (neurons) due to their unequal cumulative exposure to sex hormones or other gendered influences. Second, little remains known about the interaction of sex and age on mitochondria. While the average ages among included studies ranged from 4 to 95 years, ~50% of included studies predominantly covered the third and fourth decades of life. Human aging involves well-documented changes in both sex hormone levels52 and mtDNA quality53–55 but the relative paucity of data on older individuals in this analysis precludes definitive conclusions about whether sex differences are moderated by age. Additional work, particularly longitudinal studies, is, therefore, needed to characterize mitochondrial sex differences across the lifespan. Third, our results suggest that sex differences in mitochondrial biology may be sensitive to methodological (isolated mitochondria vs. permeabilized cells/fibers) and analytic (normalization to CS, cell, or mass) approaches. This sensitivity aligns with previous research showing that the effect of aging on mitochondrial respiratory capacity, ROS emission, and calcium retention capacity was exaggerated in isolated mitochondria compared to permeabilized myofibers,56 suggesting that inherent differences can be revealed or masked by different experimental preparations.
In designing future studies, the dynamic nature of mitochondrial biology should also be considered. For several psychophysiological phenotypes, within-person variation can be equal and up to four times larger than between-person differences shown at the group level.57 Thus, the biological significance of group differences, such as those meta-analyzed here, should be considered in light of how much natural variation in mitochondrial parameters can occur over time within individuals. However, most available studies measured mitochondrial biology at a single time point; repeated-measures were only available in a small number of intervention studies (usually exercise), such that observed changes were attributed to the intervention’s effects. One proof-of-concept n-of-1 study with weekly measures documented 20%−30% week-to-week variation in OxPhos enzymatic activities in sorted circulating leukocytes, suggesting substantial within-person variation in mitochondrial biology.22 We also previously found that up to 15% of the variance in PBMC mitochondrial OxPhos enzymatic activity normalized to mitochondrial content was predicted by psychological states the night before the blood draw,12 suggesting that mitochondria may dynamically adapt over short time frames and in response to more diverse factors than previously conceived. Overall, the natural variation in mitochondrial biology over time largely remains to be defined. Future studies specifically examining sex-related group differences in the context of intra-individual variation are needed to better understand the interplay of mitochondrial biology with different aspects of sex and gender.
Human sex is a complex system of biological features including, but not limited to, hormones, chromosomes, and tissues. Historically, these attributes have been reduced to a binary categorization of sex assigned at birth. Reducing this complexity into “female or male” is a convenient binary categorization, but growing knowledge indicates that this binary construct occludes our understanding of the complexity of human sex and gender (often defined as socially-constructed roles and norms).58,59 For example, one study following transmasculine people on gender-affirming hormone therapy (GHT) found that they had higher ROS production after three months of taking testosterone.37 This finding suggests that variation in hormone levels—including between individuals with the same chromosomal sex—could influence mitochondrial behavior regardless of sex assigned at birth. Moreover, independent of biological sex, gender (e.g., identifying as a woman, man, or another identity; being more traditionally masculine or feminine) influences diet,60–62 physical activity,63–66 sleep,67–69 and other health behaviors.70–72 In turn, these factors can drive physiological differences in mitochondrial biology. Therefore, when only binary sex differences are considered, potential gender-driven mitochondrial differences are otherwise (mis)attributed to binary biological sex.32,73 Further, sexual characteristics can vary within a single person over time: sex hormones are altered with parental role transitions,74 with common conditions like polycystic ovary syndrome (PCOS),75 and due to menopause or andropause.52,76 Gender role-related health behaviors also change with marital status.77–79 On the one hand, it is possible that these gender-related factors simply add noise to the binary analyses reported above, reducing the effect sizes of binary sex differences. On the contrary, the influence of these factors on mitochondrial health could supersede that of sex assigned at birth, making the binary classification of limited use and possibly obscuring meaningful gender/sex-related variation. Research findings guided solely by a binary sex construct also are of limited applicability to TGD individuals, who represent a non-negligible and increasing fraction of the general population,40 and to intersex individuals.80,81 A complete discussion of the limitations of binary sex constructs is beyond the scope of this meta-analysis but is explored elsewhere.32–34,82,83
In summary, characterizing human sex differences in mitochondrial biology remains an important frontier and a collective challenge for biomedical scientists. While our meta-analysis reveals small-to-moderate binary sex differences among specific domains of mitochondrial biology, available evidence highlights the need for future adequately-powered, repeated-measures studies informed by a more nuanced and accurate understanding of gender/sex influences on mitochondria and cellular bioenergetics.
Supplementary Material
ACKNOWLEDGMENTS
This meta-analysis was a group effort from investigators across multiple fields including metabolism/diabetes, exercise physiology, skeletal muscle biology, gerontology, and others. We are grateful to investigators and their team who provided sex-disaggregated data for this cross-disciplinary effort. The work of the authors was supported by FRQS grant 297877 to G.G., the Wharton Fund to AJ. and M.P., and NIH grants R01MH119336, R01AG066828, R01MH122706, and R21MH123927 to M.P.
Abbreviations:
- CI
complex I, NADH dehydrogenase
- CII
complex II, succinate dehydrogenase
- CIII
complex III, ubiquinol-cytochrome c reductase
- CIV
complex IV, cytochrome c oxidase
- CS
citrate synthase
- CV
complex V, ATP synthase
- GHT
gender-affirming hormone therapy
- MRS
magnetic resonance spectroscopy
- mtDNA
mitochondrial DNA
- mtDNAcn
mitochondrial DNA copy number
- OxPhos
oxidative phosphorylation
- PBMCs
peripheral blood mononuclear cells
- ROS
reactive oxygen species
- TGD
transgender and gender diverse.
Footnotes
DISCLOSURES
None of the authors have a conflict of interest that could be perceived to bias their work and all funding sources have been disclosed.
SUPPORTING INFORMATION
Additional supporting information may be found in the online version of the article at the publisher’s website.
REFERENCES
- 1.Lane N The Vital Question: Energy, Evolution, and the Origins of Complex Life. Profile Books; 2015. [Google Scholar]
- 2.Mottis A, Herzig S, Auwerx J. Mitocellular communication: shaping health and disease. Science. 2019;366:827–832. [DOI] [PubMed] [Google Scholar]
- 3.Gorman GS, Chinnery PF, DiMauro S, et al. Mitochondrial diseases. Nat Rev Dis Primers. 2016;2:16080. [DOI] [PubMed] [Google Scholar]
- 4.Yonova-Doing E, Calabrese C, Gomez-Duran A, et al. An atlas of mitochondrial DNA genotype-phenotype associations in the UK Biobank. Nat Genet. 2021;53:982–993. [DOI] [PMC free article] [PubMed] [Google Scholar]
- 5.Wallace DC. Mitochondria and cancer. Nat Rev Cancer. 2012;12:685–698. [DOI] [PMC free article] [PubMed] [Google Scholar]
- 6.Jang JY, Blum A, Liu J, Finkel T. The role of mitochondria in aging. J Clin Invest. 2018;128:3662–3670. [DOI] [PMC free article] [PubMed] [Google Scholar]
- 7.Latorre-Pellicer A, Moreno-Loshuertos R, Lechuga-Vieco AV, et al. Mitochondrial and nuclear DNA matching shapes metabolism and healthy ageing. Nature. 2016;535:561–565. [DOI] [PubMed] [Google Scholar]
- 8.Trifunovic A, Wredenberg A, Falkenberg M, et al. Premature ageing in mice expressing defective mitochondrial DNA polymerase. Nature. 2004;429:417–423. [DOI] [PubMed] [Google Scholar]
- 9.Kujoth G, Hiona A, Pugh TD, et al. Mitochondrial DNA mutations, oxidative stress, and apoptosis in mammalian ageing. Science. 2005;309:481–484. [DOI] [PubMed] [Google Scholar]
- 10.Ferrucci L, Gonzalez-Freire M, Fabbri E, et al. Measuring biological aging in humans: a quest. Aging Cell. 2020;19:e13080. [DOI] [PMC free article] [PubMed] [Google Scholar]
- 11.Hill BG, Shiva S, Ballinger S, Zhang J, Darley-Usmar VM. Bioenergetics and translational metabolism: implications for genetics, physiology and precision medicine. Biol Chem. 2019;401:3–29. [DOI] [PMC free article] [PubMed] [Google Scholar]
- 12.Picard M, Prather AA, Puterman E, et al. A mitochondrial health index sensitive to mood and caregiving stress. Biol Psychiatry. 2018;84:9–17. [DOI] [PMC free article] [PubMed] [Google Scholar]
- 13.Picard M, Wallace DC, Burelle Y. The rise of mitochondria in medicine. Mitochondrion. 2016;30:105–116. [DOI] [PMC free article] [PubMed] [Google Scholar]
- 14.Twig G, Elorza A, Molina AJ, et al. Fission and selective fusion govern mitochondrial segregation and elimination by autophagy. EMBO J. 2008;27:433–446. [DOI] [PMC free article] [PubMed] [Google Scholar]
- 15.Labbé K, Murley M, Nunnari J. Determinants and functions of mitochondrial health. Annu Rev Cell Dev Biol. 2014;30:357–391. [DOI] [PubMed] [Google Scholar]
- 16.Porat-Shliom N, Harding OJ, Malec L, Narayan K, Weigert R. Mitochondrial populations exhibit differential dynamic responses to increased energy demand during exocytosis in vivo. iScience. 2019;11:440–449. [DOI] [PMC free article] [PubMed] [Google Scholar]
- 17.Rath S, Sharma R, Gupta R, et al. MitoCarta 3.0: an updated mitochondrial proteome now with suborganelle localization and pathway annotations. Nucl Acids Res. 2021;49:D1541–D1547. [DOI] [PMC free article] [PubMed] [Google Scholar]
- 18.Picard M, Hepple RT, Burelle Y. Mitochondrial functional specialization in glycolytic and oxidative muscle fibers: tailoring the organelle for optimal function. Am J Physiol Cell Physiol. 2012;302:C629–C641. [DOI] [PubMed] [Google Scholar]
- 19.Picard M Blood mitochondrial DNA copy number: what are we counting? Mitochondrion. 2021;60:1–11. [DOI] [PMC free article] [PubMed] [Google Scholar]
- 20.McLaughlin KL, Hagen JT, Coalson HS, et al. Novel approach to quantify mitochondrial content and intrinsic bioenergetic efficiency across organs. Sci Rep. 2020;10:17599. [DOI] [PMC free article] [PubMed] [Google Scholar]
- 21.Anderson EJ, Neufer PD. Type II skeletal myofibers possess unique properties that potentiate mitochondrial H(2)O(2) generation. Am J Physiol Cell Physiol. 2006;290:C844–C851. doi: 10.1152/ajpcell.00402.2005 [DOI] [PubMed] [Google Scholar]
- 22.Rausser S, Trumpff C, McGill MA, et al. Mitochondrial phenotypes in purified human immune cell subtypes and cell mixtures. eLife. 2021;10. doi: 10.7554/elife.70899 [DOI] [PMC free article] [PubMed] [Google Scholar]
- 23.Giles RE, Blanc H, Cann HM, Wallace DC. Maternal inheritance of human mitochondrial DNA. Proc Natl Acad Sci USA. 1980;77:6715–6719. [DOI] [PMC free article] [PubMed] [Google Scholar]
- 24.Patel MR, Miriyala GK, Littleton AJ, et al. A mitochondrial DNA hypomorph of cytochrome oxidase specifically impairs male fertility in Drosophila melanogaster. eLife. 2016;5. doi: 10.7554/elife.l6923 [DOI] [PMC free article] [PubMed] [Google Scholar]
- 25.Innocenti P, Morrow EH, Dowling DK. Experimental evidence supports a sex-specific selective sieve in mitochondrial genome evolution. Science. 2011;332:845–848. [DOI] [PubMed] [Google Scholar]
- 26.Marais GAB, Gaillard JM, Vieira C, et al. Sex gap in aging and longevity: can sex chromosomes play a role? Biol Sex Differ. 2018;9. doi: 10.1186/s13293-018-0181-y [DOI] [PMC free article] [PubMed] [Google Scholar]
- 27.Selvaraj V, Stocco DM, Clark BJ. Current knowledge on the acute regulation of steroidogenesis. Biol Reprod. 2018;99:13–26. [DOI] [PMC free article] [PubMed] [Google Scholar]
- 28.Picard M, McEwen BS, Epel ES, Sandi C. An energetic view of stress: focus on mitochondria. Front Neuroendocrinol. 2018;49:72–85. [DOI] [PMC free article] [PubMed] [Google Scholar]
- 29.Ventura-Clapier R, Piquereau J, Veksler V, Garnier A. Estrogens, estrogen receptors effects on cardiac and skeletal muscle mitochondria. Front Endocrinol (Lausanne). 2019;10:557. [DOI] [PMC free article] [PubMed] [Google Scholar]
- 30.Bajpai P, Koc E, Sonpavde G, Singh R, Singh KK. Mitochondrial localization, import, and mitochondrial function of the androgen receptor. J Biol Chem. 2019;294:6621–6634. [DOI] [PMC free article] [PubMed] [Google Scholar]
- 31.Ventura-Clapier R, Moulin M, Piquereau J, et al. Mitochondria: a central target for sex differences in pathologies. Clin Sci (Land). 2017;131:803–822. [DOI] [PubMed] [Google Scholar]
- 32.Fausto-Sterling A Sex/Gender: Biology in a Social World. Routledge; 2012. [Google Scholar]
- 33.Richardson S Sex contextualism. Philos Theor Pract Biol. 2021;13. doi: 10.3998/ptpbio.16039257.0013.009 [DOI] [Google Scholar]
- 34.Ritz SA, Antle DM, Côté J, et al. First steps for integrating sex and gender considerations into basic experimental biomedical research. FASEB J. 2014;28(1):4–13. [DOI] [PubMed] [Google Scholar]
- 35.Silaidos C, Pilatus U, Grewal R, et al. Sex-associated differences in mitochondrial function in human peripheral blood mononuclear cells (PBMCs) and brain. Biol Sex Differ. 2018;9. doi: 10.1186/sl3293-018-0193-7 [DOI] [PMC free article] [PubMed] [Google Scholar]
- 36.Miotto PM, McGlory C, Holloway TM, Phillips SM, Holloway GP. Sex differences in mitochondrial respiratory function in human skeletal muscle. Am J Physiol Regul Integr Comp Physiol. 2018;314:R909–R915. [DOI] [PMC free article] [PubMed] [Google Scholar]
- 37.Victor VM, Rocha M, Banuls C, Rovira-Llopis S, Gomez M, Hernandez-Mijares A. Mitochondrial impairment and oxidative stress in leukocytes after testosterone administration to female-to-male transsexuals. J Sex Med. 2014;11:454–461. [DOI] [PubMed] [Google Scholar]
- 38.Moher D, Liberati A, Tetzlaff J, Altman DG. Preferred reporting items for systematic reviews and meta-analyses: the PRISMA statement. PLoS Med. 2009;6:e1000097. [DOI] [PMC free article] [PubMed] [Google Scholar]
- 39.Goulet-Pelletier JC, Cousineau D. A review of effect sizes and their confidence intervals, part I: the Cohen’s d family. Quant Methods Psychol. 2018;14:242–265. [Google Scholar]
- 40.Zhang QI, Goodman M, Adams N, et al. Epidemiological considerations in transgender health: a systematic review with focus on higher quality data. Int J Transgend Health. 2020;21:125–137. [DOI] [PMC free article] [PubMed] [Google Scholar]
- 41.Memme J, Erlich AT, Phukan G, Hood DA. Exercise and mitochondrial health. J Physiol. 2019;599:803–817. [DOI] [PubMed] [Google Scholar]
- 42.Neufer PD, Bamman MM, Muoio DM, et al. Understanding the cellular and molecular mechanisms of physical activity-induced health benefits. Cell Metab. 2015;22:4–11. [DOI] [PubMed] [Google Scholar]
- 43.Faris ME, Jahrami HA, Alsibai J, Obaideen AA. Impact of Ramadan diurnal intermittent fasting on the metabolic syndrome components in healthy, non-athletic Muslim people aged over 15 years: a systematic review and meta-analysis. Br J Nutr. 2020;123:1–22. doi: 10.1017/S000711451900254X [DOI] [PubMed] [Google Scholar]
- 44.Brydges CR. Effect size guidelines, sample size calculations, and statistical power in gerontology. Innov Aging. 2019;3:igz036. [DOI] [PMC free article] [PubMed] [Google Scholar]
- 45.Gaeta L, Brydges CR. An examination of effect sizes and statistical power in speech, language, and hearing research. J Speech Lang Hear Res. 2020;63:1572–1580. [DOI] [PubMed] [Google Scholar]
- 46.Bektas A, Schurman SH, Gonzalez-Freire M, et al. Age-associated changes in human CD4(+) T cells point to mitochondrial dysfunction consequent to impaired autophagy. Aging (Albany NY). 2019;11:9234–9263. [DOI] [PMC free article] [PubMed] [Google Scholar]
- 47.Okorodudu DO, Jumean MF, Montori VM, et al. Diagnostic performance of body mass index to identify obesity as defined by body adiposity: a systematic review and meta-analysis. Int J Obes (Land). 2010;34:791–799. [DOI] [PubMed] [Google Scholar]
- 48.Anderson SF, Kelley K, Maxwell SE. Sample-size planning for more accurate statistical power: a method adjusting sample effect sizes for publication bias and uncertainty. Psychol Sci. 2017;28:1547–1562. [DOI] [PubMed] [Google Scholar]
- 49.McCarthy M, Arnold A. Reframing sexual differentiation of the brain. Nat Neurosci. 2011;14:677–683. [DOI] [PMC free article] [PubMed] [Google Scholar]
- 50.de Vries GJ, Forger NG. Sex differences in the brain: a whole body perspective. Biol Sex Differ. 2015;6. [DOI] [PMC free article] [PubMed] [Google Scholar]
- 51.Pearse RV 2nd, Young-Pearse TL. Lost in translational biology: understanding sex differences to inform studies of diseases of the nervous system. Brain Res. 2019;1722. [DOI] [PMC free article] [PubMed] [Google Scholar]
- 52.van den Beld AW, Kaufman J-M, Zillikens MC, Lamberts SWJ, Egan JM, van der Lely AJ. The physiology of endocrine systems with ageing. Lancet Diabetes Endocrinol. 2018;6:647–658. [DOI] [PMC free article] [PubMed] [Google Scholar]
- 53.Tian QU, Moore AZ, Oppong R, et al. Mitochondrial DNA copy number and heteroplasmy load correlate with skeletal muscle oxidative capacity by P31 MR spectroscopy. Aging Cell. 2021;20. [DOI] [PMC free article] [PubMed] [Google Scholar]
- 54.Zhang R, Wang Y, Ye K, et al. Independent impacts of aging on mitochondrial DNA quantity and quality in humans. BMC Genom. 2017;18. [DOI] [PMC free article] [PubMed] [Google Scholar]
- 55.Ye K, Lu J, Ma F, Keinan A, Gu Z. Extensive pathogenicity of mitochondrial heteroplasmy in healthy human individuals. PNAS. 2014;111:10654–10659. [DOI] [PMC free article] [PubMed] [Google Scholar]
- 56.Picard M, Ritchie D, Wright KJ, et al. Mitochondrial functional impairment with aging is exaggerated in isolated mitochondria compared to permeabilized myofibers. Aging Cell. 2010;9:1032–1046. [DOI] [PubMed] [Google Scholar]
- 57.Fisher AJ, Medaglia JD, Jeronimus BF. Lack of group-to-individual generalizability is a threat to human subjects research. PNAS. 2018;115:E6106–E6115. [DOI] [PMC free article] [PubMed] [Google Scholar]
- 58.Joel D Beyond the binary: rethinking sex and the brain. Neurosci Biobehav Rev. 2021;122:165–175. [DOI] [PubMed] [Google Scholar]
- 59.Joel D, Fausto-Sterling A. Beyond sex differences: new approaches for thinking about variation in brain structure and function. Philos Trans R Soc Lond B Biol Sci. 2016;371:20150451. [DOI] [PMC free article] [PubMed] [Google Scholar]
- 60.Rothgerber H Real men don’t eat (vegetable) quiche: masculinity and the justification of meat consumption. Psychol Men Masc. 2013. [Google Scholar]
- 61.VanKim NA, Corliss HL, Jun HJ, Calzo JP, AlAwadhi M, Austin SB. Gender expression and sexual orientation differences in diet quality and eating habits from adolescence to young adulthood. J Acad Nutr Diet. 2019;119:2028–2040. [DOI] [PMC free article] [PubMed] [Google Scholar]
- 62.Fidolini V Eating like a man. Food, masculinities and self-care behavior. Food Cult Soc. 2021. [Google Scholar]
- 63.Bauman A, Bull F, Chey T, et al. The international prevalence study on physical activity: results from 20 countries. Int J Behav Nutr Phys Act. 2009;6. [DOI] [PMC free article] [PubMed] [Google Scholar]
- 64.Spencer RA, Rehman L, Kirk SF. Understanding gender norms, nutrition, and physical activity in adolescent girls: a scoping review. Int J Behav Nutr Phys Act. 2015;12:6. [DOI] [PMC free article] [PubMed] [Google Scholar]
- 65.Sharara E, Akik C, Ghattas H, Makhlouf Obermeyer C. Physical inactivity, gender and culture in Arab countries: a systematic assessment of the literature. BMC Public Health. 2018;18. [DOI] [PMC free article] [PubMed] [Google Scholar]
- 66.Tcymbal A, Whiting M, Rakovac B. Prevalence of physical inactivity and sedentary behavior among adults in Armenia. Front Public Health. 2020;8. [DOI] [PMC free article] [PubMed] [Google Scholar]
- 67.Venn S, Arber S, Meadows R, Hislop J. The fourth shift: exploring the gendered nature of sleep disruption among couples with children. Bri J Sociol. 2008;59:79–97. [DOI] [PubMed] [Google Scholar]
- 68.Harry-Hernandez S, Reisner SL, Schrimshaw EW, et al. Gender dysphoria, mental health, and poor sleep health among transgender and gender nonbinary individuals: a qualitative study in New York City. Transgender Health. 2020;5:59–68. [DOI] [PMC free article] [PubMed] [Google Scholar]
- 69.Butler ES, McGlinchey E, Juster R-P, et al. Sexual and gender minority sleep: a narrative review and suggestions for future research. J Sleep Res. 2019. [DOI] [PubMed] [Google Scholar]
- 70.Courtenay WH. Constructions of masculinity and their influence on men’s well-being: a theory of gender and health. Soc Sci Med. 2000;50:1385–1401. [DOI] [PubMed] [Google Scholar]
- 71.Courtenay WH. Health factors associated with disease, injury, and death among men: evidence and implications for prevention. J Mens Stud. 2000. [Google Scholar]
- 72.Perrotte JK, Shattuck EC, Daniels CL, et al. A latent profile analysis of the link between sociocultural factors and health-related risk-taking among U.S. adults. BMC Public Health. 2021;21. [DOI] [PMC free article] [PubMed] [Google Scholar]
- 73.Richardson SS. Sex Itself: The Search for Male and Female in the Human Genome. University of Chicago Press; 2013. [Google Scholar]
- 74.Gettler LT, McDade TW, Feranil AB, Kuzawa CW. Longitudinal evidence that fatherhood decreases testosterone in human males. PNAS. 2011;108:16194–16199. [DOI] [PMC free article] [PubMed] [Google Scholar]
- 75.Azziz R, Carmina E, Chen ZiJiang, et al. Polycystic ovary syndrome. Nat Rev Dis Primers. 2016. [DOI] [PubMed] [Google Scholar]
- 76.Martelli M, Zingaretti L, Salvio G, Bracci M, Santarelli L. Influence of work on andropause and menopause: a systematic review. Int J Environ Res Public Health. 2021;18. [DOI] [PMC free article] [PubMed] [Google Scholar]
- 77.Lee S, Cho E, Grodstein F, Kawachi I, Hu FB, Colditz GA. Effects of marital transitions on changes in dietary and other health behaviours in US women. Int J Epidemiol. 2005;34:69–78. [DOI] [PubMed] [Google Scholar]
- 78.Tian J, Smith KJ, Cleland V, Gall S, Dwyer T, Venn AJ. Partnering and parenting transitions in Australian men and women: associations with changes in weight, domain-specific physical activity and sedentary behaviours. Int J Behav Nutr PhysAct. 2020;17:87. [DOI] [PMC free article] [PubMed] [Google Scholar]
- 79.Kutob RM, Yuan NP, Wertheim BC, et al. Relationship between marital transitions, health behaviors, and health indicators of postmenopausal women: results from the women’s health initiative. J Womens Health. 2017;26:313–320. [DOI] [PMC free article] [PubMed] [Google Scholar]
- 80.Zeeman L, Aranda K. A systematic review of the health and healthcare inequalities for people with intersex variance. Int J Environ Res Public Health. 2020;17. [DOI] [PMC free article] [PubMed] [Google Scholar]
- 81.Rosenwohl-Mack A, Tamar-Mattis S, Baratz AB, et al. A national study on the physical and mental health of intersex adults in the U.S. PLoS One. 2020;15:e0240088. doi: 10.1371/journal.pone.0240088 [DOI] [PMC free article] [PubMed] [Google Scholar]
- 82.Fausto-Sterling A The bare bones of sex: part 1—sex and gender. Signs. 2005;30:1491–1527. [Google Scholar]
- 83.Johnson J, Repta R. Sex and gender: beyond the binaries. In: Oliffe JL, Greaves L, eds. Designing and Conducting Gender, Sex, & Health Research. SAGE Publications; 2012:17–38. [Google Scholar]
- 84.AlGhatrif M, Zane A, Oberdier M, et al. Lower mitochondrial energy production of the thigh muscles in patients with low-normal ankle-brachial index. J Am Heart Assoc. 2017;6:e006604. [DOI] [PMC free article] [PubMed] [Google Scholar]
- 85.Arribat Y, Broskey NT, Greggio C, et al. Distinct patterns of skeletal muscle mitochondria fusion, fission and mitophagy upon duration of exercise training. Acta Physiol (Oxf). 2019;225:e13179. [DOI] [PubMed] [Google Scholar]
- 86.Bañuls C, de Marañon AM, Veses S, et al. Malnutrition impairs mitochondrial function and leukocyte activation. Nutr J. 2019;18:89. [DOI] [PMC free article] [PubMed] [Google Scholar]
- 87.Bescos R, Boden MJ, Jackson ML, et al. Four days of simulated shift work reduces insulin sensitivity in humans. Acta Physiol (Oxf). 2018;223:e13039. doi: 10.UU/apha.13039 [DOI] [PubMed] [Google Scholar]
- 88.Broskey NT, Greggio C, Boss A, et al. Skeletal muscle mitochondria in the elderly: effects of physical fitness and exercise training. J Clin Endocrinol Metab. 2014;99:1852–1861. [DOI] [PubMed] [Google Scholar]
- 89.Cardinale DA, Larsen FJ, Schiffer TA, et al. Superior intrinsic mitochondrial respiration in women than in men. Front Physiol. 2018;9:1133. [DOI] [PMC free article] [PubMed] [Google Scholar]
- 90.Chomentowski P, Coen PM, Radiková Z, Goodpaster BH, Toledo FG. Skeletal muscle mitochondria in insulin resistance: differences in intermyofibrillar versus subsarcolemmal subpopulations and relationship to metabolic flexibility. J Clin Endocrinol Metab. 2011;96:494–503. [DOI] [PMC free article] [PubMed] [Google Scholar]
- 91.Coggan AR, Spina RJ, King DS, et al. Histochemical and enzymatic comparison of the gastrocnemius muscle of young and elderly men and women. J Gerontol. 1992;47:B71–B76. [DOI] [PubMed] [Google Scholar]
- 92.Coggan AR, Spina RJ, King DS, et al. (1992) Skeletal muscle adaptations to endurance training in 60- to 70-yr-old men and women. J Appl Physiol. 1985;72:1780–1786. [DOI] [PubMed] [Google Scholar]
- 93.Crane JD, Devries MC, Safdar A, Hamadeh MJ, Tarnopolsky MA. The effect of aging on human skeletal muscle mitochondrial and intramyocellular lipid ultrastructure. J Gerontol A Biol Sci Med Sci. 2010;65:119–128. [DOI] [PubMed] [Google Scholar]
- 94.Cree-Green M, Cai N, Pyle L, et al. Insulin resistance in youth without diabetes is not related to muscle mitochondrial dysfunction. J Clin Endocrinol Metab. 2017;102:1652–1660. [DOI] [PMC free article] [PubMed] [Google Scholar]
- 95.Da Silva T, Wu A, Laksono I, et al. Mitochondrial function in individuals at clinical high risk for psychosis. Sci Rep. 2018;8:6216. [DOI] [PMC free article] [PubMed] [Google Scholar]
- 96.DeConne TM, Muñoz ER, Sanjana F, Hobson JC, Martens CR. Cardiometabolic risk factors are associated with immune cell mitochondrial respiration in humans. Am J Physiol Heart Circ Physiol. 2020;319:H481–H487. [DOI] [PMC free article] [PubMed] [Google Scholar]
- 97.Dodds RM, Davies K, Granic A, et al. Mitochondrial respiratory chain function and content are preserved in the skeletal muscle of active very old men and women. Exp Gerontol. 2018;113:80–85. [DOI] [PMC free article] [PubMed] [Google Scholar]
- 98.Dohlmann TL, Hindsø M, Dela F, Helge JW, Larsen S. High-intensity interval training changes mitochondrial respiratory capacity differently in adipose tissue and skeletal muscle. Physiol Rep. 2018;6:e13857. [DOI] [PMC free article] [PubMed] [Google Scholar]
- 99.Ehinger JK, Morota S, Hansson MJ, Paul G, Elmér E. Mitochondrial dysfunction in blood cells from amyotrophic lateral sclerosis patients. J Neurol. 2015;262:1493–1503. [DOI] [PubMed] [Google Scholar]
- 100.Fisher-Wellman KH, Weber TM, Cathey BL, et al. Mitochondrial respiratory capacity and content are normal in young insulin-resistant obese humans. Diabetes. 2014;63:132–141. [DOI] [PMC free article] [PubMed] [Google Scholar]
- 101.Gonzalez-Freire M, Scalzo P, D’Agostino J, et al. Skeletal muscle ex vivo mitochondrial respiration parallels decline in vivo oxidative capacity, cardiorespiratory fitness, and muscle strength: the Baltimore longitudinal study of aging. Aging Cell. 2018;17. [DOI] [PMC free article] [PubMed] [Google Scholar]
- 102.Hafen PS, Abbott K, Bowden J, Lopiano R, Hancock CR, Hyldahl RD. Daily heat treatment maintains mitochondrial function and attenuates atrophy in human skeletal muscle subjected to immobilization. J Appl Physiol (1985). 2019;127:47–57. [DOI] [PubMed] [Google Scholar]
- 103.Hafen PS, Preece CN, Sorensen JR, Hancock CR, Hyldahl RD. (2018) Repeated exposure to heat stress induces mitochondrial adaptation in human skeletal muscle. J Appl Physiol. 1985;125:1447–1455. [DOI] [PubMed] [Google Scholar]
- 104.Harish G, Venkateshappa C, Mahadevan A, Pruthi N, Bharath MM, Shankar SK. Mitochondrial function in human brains is affected by pre- and post mortem factors. Neuropathol Appl Neurobiol. 2013;39:298–315. [DOI] [PubMed] [Google Scholar]
- 105.Lalia AZ, Dasari S, Johnson ML, et al. Predictors of whole-body insulin sensitivity across ages and adiposity in adult humans. J Clin Endocrinol Metab. 2016;101:626–634. [DOI] [PMC free article] [PubMed] [Google Scholar]
- 106.Lalia AZ, Dasari S, Robinson MM, et al. Influence of omega-3 fatty acids on skeletal muscle protein metabolism and mitochondrial bioenergetics in older adults. Aging (Albany NY). 2017;9:1096–1129. [DOI] [PMC free article] [PubMed] [Google Scholar]
- 107.McCully KK, Mulcahy TK, Ryan TE, Zhao Q. (2011) Skeletal muscle metabolism in individuals with spinal cord injury. J Appl Physiol. 1985;111:143–148. [DOI] [PMC free article] [PubMed] [Google Scholar]
- 108.McKeough ZJ, Alison JA, Bye PT, et al. Exercise capacity and quadriceps muscle metabolism following training in subjects with COPD. Respir Med. 2006;100:1817–1825. [DOI] [PubMed] [Google Scholar]
- 109.Miller MS, Callahan DM, Tourville TW, et al. (2017) Moderate-intensity resistance exercise alters skeletal muscle molecular and cellular structure and function in inactive older adults with knee osteoarthritis. J Appl Physiol. 1985;122:775–787. [DOI] [PMC free article] [PubMed] [Google Scholar]
- 110.Monaco CMF, Hughes MC, Ramos SV, et al. Altered mitochondrial bioenergetics and ultrastructure in the skeletal muscle of young adults with type 1 diabetes. Diabetologia. 2018;61:1411–1423. [DOI] [PubMed] [Google Scholar]
- 111.Panee J, Gerschenson M, Chang L. Associations between microbiota, mitochondrial function, and cognition in chronic marijuana users. J Neuroimmune Pharmacol. 2018;13:113–122. [DOI] [PMC free article] [PubMed] [Google Scholar]
- 112.Santanasto AJ, Glynn NW, Jubrias SA, et al. Skeletal muscle mitochondrial function and fatigability in older adults. J Gerontol A Biol Sci Med Sci. 2015;70:1379–1385. [DOI] [PMC free article] [PubMed] [Google Scholar]
- 113.Sjövall F, Ehinger JK, Marelsson SE, et al. Mitochondrial respiration in human viable platelets—methodology and influence of gender, age and storage. Mitochondrion. 2013;13:7–14. [DOI] [PubMed] [Google Scholar]
- 114.Sjövall F, Morota S, Hansson MJ, Friberg H, Gnaiger E, Elmér E. Temporal increase of platelet mitochondrial respiration is negatively associated with clinical outcome in patients with sepsis. Crit Care. 2010;14:R214. [DOI] [PMC free article] [PubMed] [Google Scholar]
- 115.Sjövall F, Morota S, Persson J, Hansson MJ, Elmér E. Patients with sepsis exhibit increased mitochondrial respiratory capacity in peripheral blood immune cells. Crit Care. 2013;17:R152. [DOI] [PMC free article] [PubMed] [Google Scholar]
- 116.Smith SA, Montain SJ, Zientara GP, Fielding RA. (2004) Use of phosphocreatine kinetics to determine the influence of creatine on muscle mitochondrial respiration: an in vivo 31P-MRS study of oral creatine ingestion. J Appl Physiol. 1985;96:2288–2292. [DOI] [PubMed] [Google Scholar]
- 117.Tecilazich F, Dinh T, Lyons TE, et al. Postexercise phosphocreatine recovery, an index of mitochondrial oxidative phosphorylation, is reduced in diabetic patients with lower extremity complications. J Vase Surg. 2013;57:997–1005. [DOI] [PMC free article] [PubMed] [Google Scholar]
- 118.Tevald MA, Foulis SA, Kent JA. Effect of age on in vivo oxidative capacity in two locomotory muscles of the leg. Age (Dordr). 2014;36:9713. [DOI] [PMC free article] [PubMed] [Google Scholar]
- 119.Thompson JR, Swanson SA, Casale GP, et al. Gastrocnemius mitochondrial respiration: are there any differences between men and women? J Surg Res. 2013;185:206–211. [DOI] [PMC free article] [PubMed] [Google Scholar]
- 120.Thubron EB, Rosa HS, Hodges A, et al. Regional mitochondrial DNA and cell-type changes in post-mortem brains of non-diabetic Alzheimer’s disease are not present in diabetic Alzheimer’s disease. Sci Rep. 2019;9:11386. [DOI] [PMC free article] [PubMed] [Google Scholar]
- 121.Toledo FG, Menshikova EV, Azuma K, et al. Mitochondrial capacity in skeletal muscle is not stimulated by weight loss despite increases in insulin action and decreases in intramyo-cellular lipid content. Diabetes. 2008;57:987–994. [DOI] [PubMed] [Google Scholar]
- 122.Toledo FG, Watkins S, Kelley DE. Changes induced by physical activity and weight loss in the morphology of intermyofibrillar mitochondria in obese men and women. J Clin Endocrinol Metab. 2006;91:3224–3227. [DOI] [PubMed] [Google Scholar]
- 123.Tyrrell DJ, Bharadwaj MS, Van Horn CG, Kritchevsky SB, Nicklas BJ, Molina AJ. Respirometric profiling of muscle mitochondria and blood cells are associated with differences in gait speed among community-dwelling older adults. J Gerontol A Biol Sci Med Sci. 2015;70:1394–1399. [DOI] [PMC free article] [PubMed] [Google Scholar]
- 124.van der Lans AA, Hoeks J, Brans B, et al. Cold acclimation recruits human brown fat and increases nonshivering thermogenesis. J Clin Invest. 2013;123:3395–3403. [DOI] [PMC free article] [PubMed] [Google Scholar]
- 125.Wachsmuth M, Hübner A, Li M, Madea B, Stoneking M. Age-related and heteroplasmy-related variation in human mtDNA copy number. PLoS Genet. 2016;12:e1005939. [DOI] [PMC free article] [PubMed] [Google Scholar]
- 126.Waters DL, Mullins PG, Qualls CR, Raj DS, Gasparovic C, Baumgartner RN. Mitochondrial function in physically active elders with sarcopenia. Mech Ageing Dev. 2009;130:315–319. [DOI] [PMC free article] [PubMed] [Google Scholar]
- 127.Willcocks RJ, Williams CA, Barker AR, Fulford J, Armstrong N. Age- and sex-related differences in muscle phosphocreatine and oxygenation kinetics during high-intensity exercise in adolescents and adults. NMR Biomed. 2010;23:569–577. [DOI] [PubMed] [Google Scholar]
- 128.Wu A, Da Silva T, Jacobson M, et al. Validating mitochondrial electron transport chain content in individuals at clinical high risk for psychosis. Sci Rep. 2019;9:12695. [DOI] [PMC free article] [PubMed] [Google Scholar]
- 129.Yen HH, Shih KL, Lin TT, Su WW, Soon MS, Liu CS. Decreased mitochondrial deoxyribonucleic acid and increased oxidative damage in chronic hepatitis C. World J Gastroenterol. 2012;18:5084–5089. [DOI] [PMC free article] [PubMed] [Google Scholar]
- 130.Yin X, Lanza IR, Swain JM, Sarr MG, Nair KS, Jensen MD. Adipocyte mitochondrial function is reduced in human obesity independent of fat cell size. J Clin Endocrinol Metab. 2014;99:E209–E216. [DOI] [PMC free article] [PubMed] [Google Scholar]
Associated Data
This section collects any data citations, data availability statements, or supplementary materials included in this article.