Abstract
Cellular diversification is critical for specialized functions of the brain including learning and memory1. Single cell RNA-sequencing facilitates transcriptomic profiling of distinct major types of neurons2-4, but divergence of transcriptomic profiles within a neuronal population and their link to function remain poorly understood. Here, we isolate nuclei tagged5 in specific cell types followed by single nuclear RNA sequencing to profile Purkinje neurons and map their responses to motor activity and learning. We find that two major subpopulations of Purkinje neurons, identified by the genes Aldoc and Plcb4, bear distinct transcriptomic features. Plcb4+, but not Aldoc+, Purkinje neurons display robust plasticity of gene expression in mice subjected to sensorimotor and learning experience. In vivo calcium imaging and optogenetic perturbation reveal that Plcb4+ Purkinje neurons play a crucial role in associative learning. Integrating single nuclear RNA-seq datasets with weighted gene network analysis uncovers a learning gene module that includes components of FGFR2 signaling in Plcb4+ Purkinje neurons. Knockout of Fgfr2 in Plcb4+ Purkinje neurons in mice by a CRISPR approach disrupts motor learning. Our findings define how diversification of Purkinje neurons links to their responses in motor learning and provide a foundation for understanding their differential vulnerability to neurological disorders.
Transcriptomics of Purkinje neurons
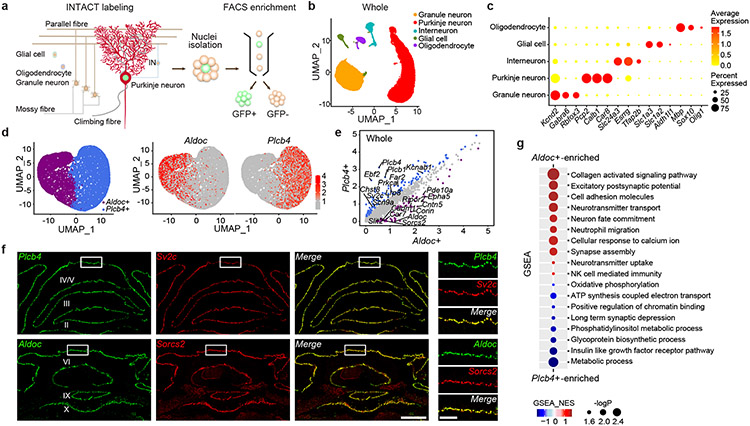
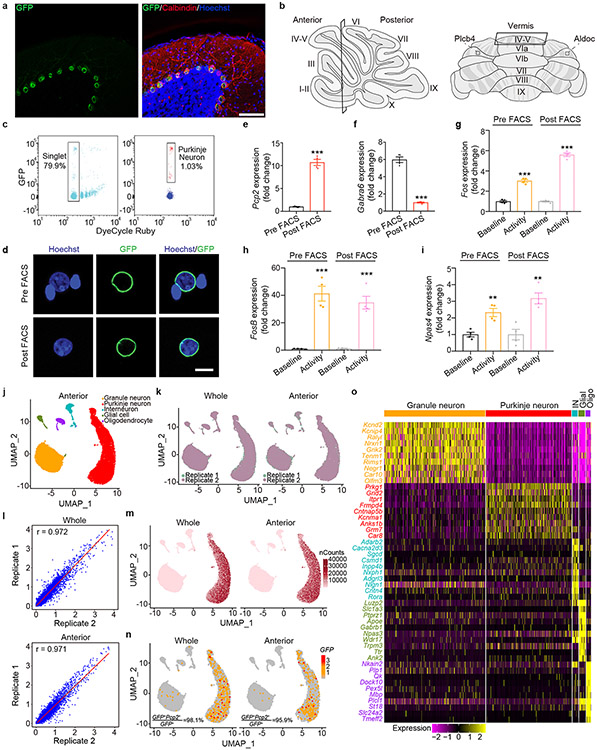
Although Purkinje neurons represent the sole output of the cerebellar cortex, their architecture and relative low numbers pose limitations to standard single-cell transcriptomic profiling (Fig. 1a). We deployed isolation of nuclei tagged in specific cell types (INTACT) using Pcp2-Cre/Sun1fl/wt mice to label Purkinje neuron nuclear membrane with green fluorescent protein (GFP) followed by fluorescence activated cell sorting (FACS) (Fig. 1a and Extended Data Fig. 1a-c). The morphology and size of sorted nuclei were appropriate for Purkinje neurons (Extended Data Fig. 1d), and qPCR analyses revealed that the Purkinje neuron marker Pcp2 was enriched, whereas the granule neuron marker Gabra6 was de-enriched (Extended Data Fig. 1e, 1f). Activity-dependent gene expression was intact in sorted Purkinje neuron nuclei from mice after rotarod experience6 (Extended Data Fig. 1g-i), highlighting the method’s fidelity to detect regulated gene expression in vivo.
Figure 1. INTACT-FACS-snRNA-seq for transcriptomics of Purkinje neurons in mice.
(a) Schematic representation of the cellular constructions, INTACT genetic labeling of Purkinje nuclei. (b) 34,336 nuclei from whole cerebellum assigned into five clusters. (c) Molecular signatures of each population by their percentage and average gene expressions. (d) Two primary categories, Aldoc+ and Plcb4+ Purkinje neurons. (e) Scatter plot depicting the expression of DEGs in Plcb4+ and Aldoc+ Purkinje neurons in the whole cerebellum. (f) RNA ISH analyses using fluorescence-labeled Aldoc or Plcb4 RNA probes and probes for newly defined Purkinje neuron subtypes. Scale bars, 800 μm for the left panel and 200 μm for the right panel. Similar results were found in 3 animals for representative data. (g) Biological functions of featured genes enriched in either Plcb4+ or Aldoc+ Purkinje neurons.
To analyze transcriptomic profiles within the cerebellum, we combined GFP− and GFP+ nuclei followed by single nuclear RNA-seq (snRNA-seq) (data avialible as Supplementary Table 1). Read counts (nCounts) and feature expressed genes (nFeatures) retained 52,487 high quality nuclei for analyses. Unsupervised clustering led to identification of Purkinje neuron, granule cell, interneuron, glial cell, and oligodendrocyte clusters (Fig. 1b), and was recapitulated in two biological replicates (Extended Data Fig. 1k, 1l). Purkinje neuron nuclei displayed 2-4-fold higher nCounts than other cell nuclei (Extended Data Fig. 1m). GFP transcripts5 were found almost exclusively in Purkinje neurons, and differential expression analyses revealed genes specific to each cell type in the cerebellum (Fig. 1c and Extended data Fig. 1n, 1o) (data avialible as Supplementary Table 2).
Because the anterior lobes of the cerebellum participate in motor learning, we also subjected the anterior vermis to INTACT-FACS-snRNA-seq analyses, which exhibited similar global cell clustering as in the whole cerebellum (Extended Data Fig. 1b, 1j-k). Along the cerebellar mediolateral axis, Purkinje neurons expressing Aldolase C (Aldoc) and phospholipase C beta 4 (Plcb4) arrange into symmetric Zebrin II+ and Zebrin II− parasagittal stripes7, and display distinct physiological properties including firing rate8, glutamate uptake9, and synaptic plasticity. Whether distinct transcriptomic profiles underlying Aldoc+ and Plcb4+ Purkinje neurons link to their different functions has remained unexplored.
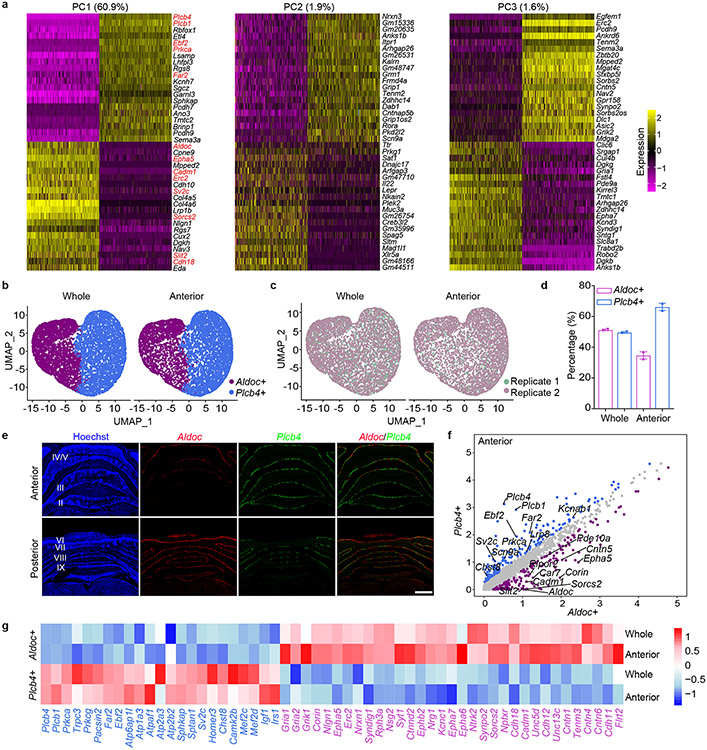
Upon subjecting transcriptomic data from 20,814 single nuclei of Purkinje neurons to principal component analysis (PCA), the first component (PC1, 60.9%) revealed two major populations of Purkinje neurons expressing the genes Aldoc and Plcb4 (Fig. 1d and Extended Data Fig. 2a-c). The Plcb4+ population was enriched in the anterior vermis, validated by RNA in situ hybridization (ISH) analyses, which also showed that Aldoc+ Purkinje neurons were overrepresented in posterior cerebellar lobules (Extended Data Fig. 2d, 2e).
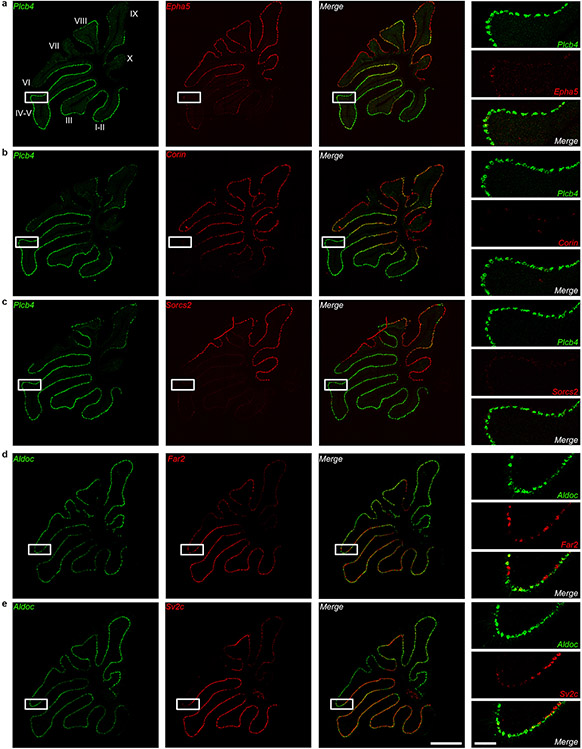
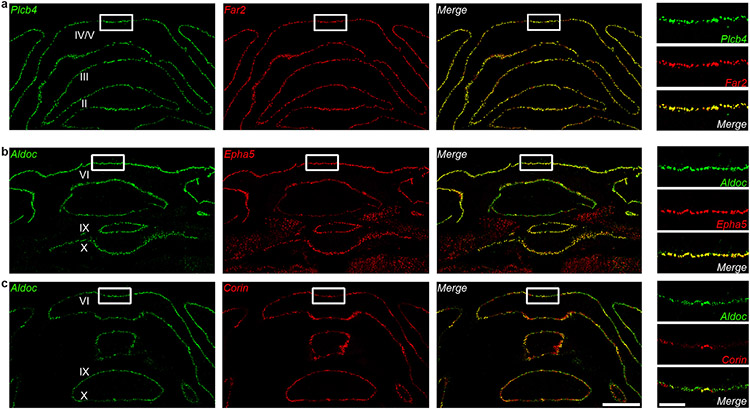
We identified 229 Plcb4+ Purkinje neuron-enriched differentially expressed genes (DEGs) and 243 Aldoc+ Purkinje neuron-enriched DEGs (data avialible as Supplementary Table 3). The Plcb4, Plcb1, Ebf2 and Kcnab1 genes were enriched in the Plcb4+ cluster, whereas the Aldoc, Car7 and Cntn5 genes were found in the Aldoc+ cluster10 (Fig. 1e). These analyses unraveled new molecular features of each population, including the lipid metabolism genes Far2 and Lrp8, synaptic vesicle gene Sv2c, protein kinase gene Prkca in Plcb4+ neurons and the transmembrane protein genes Epha5, Corin and Sorcs2 in Aldoc+ neurons (Fig. 1e). ISH analyses validated the stripe-like pattern of expression of newly identified cluster genes in Plcb4+ or Aldoc+ Purkinje neurons (Fig. 1f and Extended Data Fig. 3a-e and Extended Data Fig. 4a-c). Similar DEG clusters were observed in anterior vermal Aldoc+ and Plcb4+ Purkinje neurons (Extended Data Fig. 2f). Gene set enrichment analysis (GSEA) showed enriched genes related to neurotransmitter transport, cell adhesion, synapse assembly and immune pathways in Aldoc+ neurons, whereas genes serving insulin-like growth factor receptor signaling, long-term depression, chromatin binding, and ATP coupled metabolism were enriched in Plcb4+ neurons (Fig. 1g and Extended Data Fig. 2g). These results reveal distinct molecular signatures of Plcb4+ and Aldoc+ Purkinje neurons in the mouse brain.
Transcriptional plasticity in Plcb4+ neurons
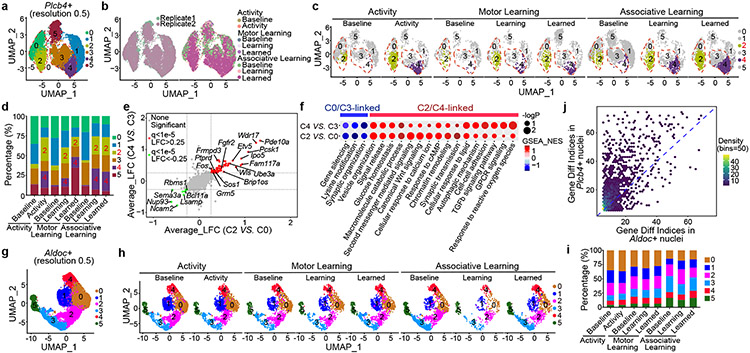
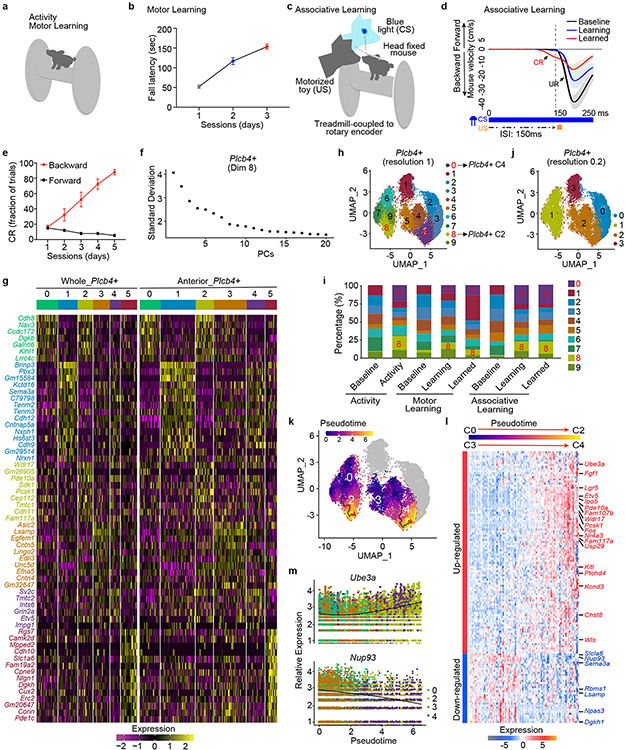
We next asked whether the two subpopulations of Purkinje neurons have differential responses to sensorimotor experience. We subjected mice to three behavioral paradigms: accelerating rotarod for 1 hour (motor activity)6, progressive accelerating rotarod (motor learning)11, and delay tactile startle conditioning (DTSC, associative learning)12 (Extended Data Fig. 5a-e and Supplementary Video). In motor learning and associative learning, session/day 1 was termed a learning state, and session/day 3 or 5 was termed a learned state (Extended Data Fig. 5a-e). Samples from whole cerebellum for motor activity and learning and the anterior vermis for associative learning were collected and subjected to INTACT-FACS-snRNA-seq analyses. Plcb4+ Purkinje neurons were categorized into six clusters at cluster resolution 0.5 (Fig. 2a, 2b and Extended data Fig. 5f, 5g). Motor activity, motor learning, and associative learning increased the percentage of C4 and C2 clusters and reduced the percentage of C3 and C0 clusters among Plcb4+ neurons (Fig. 2c, 2d). The same pattern was observed at a higher cluster resolution of 1.0 (Extended Data 5h, 5i). Single cell trajectory analysis of Plcb4+ neuron clusters revealed that C4 is derived from C3, and C2 derived from C0, which was also reflected by the organization of C4/C3 and C2/C0 into identical clusters, respectively, at the lower cluster resolution of 0.2 (Extended Data Fig. 5j, 5k). Along a pseudo-time course, 103 genes were upregulated reflecting motor activity/learning genes in C2/C4, and 26 genes were downregulated reflecting genes in C0/C3 (Extended Data Fig. 5l, 5m). These results suggest that Plcb4+ Purkinje neurons respond robustly to sensorimotor experience and learning.
Figure 2. Plcb4+ Purkinje neurons undergo transcriptomic plasticity upon exposure to motor activity and learning.
(a) 22,205 Plcb4+ Purkinje nuclei isolated from cerebellum upon motor activity, motor learning and associative learning were sorted into six clusters. (b) Landscape of Plcb4+ nuclei in different training paradigms. (c) Plcb4+ clusters under baseline, activity, learning or learned conditions. (d) Percentages of all six clusters described in c. (e) Scatter plot comparing the DEGs of C4 vs. C3 and C2 vs. CO, in Plcb4+ clusters. (f) GSEA analysis showing enriched biological functions of DEGs of C4 vs. C3 and C2 vs. C0. (g) 19,424 Aldoc+ Purkinje nuclei isolated from whole cerebellum and anterior vermis under different training conditions grouped into six clusters. (h) Aldoc+ clusters under baseline, activity, learning or learned conditions in different training paradigms. (i) Percentages of all six clusters described in h. (j) Differential expression indices for each DEG in Aldoc+ or Plcb4+ Purkinje neurons upon activity or learning.
We next retrieved DEGs between C0/C3 and motor activity/learning-linked (C2/C4) Plcb4+ Purkinje neuron clusters. We found 129 and 158 DEGs between C0 and C2, and between C3 and C4, respectively (Fig. 2e). Motor activity and learning triggered upregulation of 100 genes in C2 and 93 genes in C4, of which 66 genes overlapped, accounting for 66% of C2 and 71% of C4 upregulated genes (Fig. 2e). The Fos, Pde10a, Grm5, and Ube3a genes were among the common upregulated DEGs in the motor activity/learning-linked clusters (C2/C4). GSEA further demonstrated that the C2/C4 clusters were enriched for genes in metabolism, glucose homeostasis, signaling release and vesicle organization, whereas gene silencing, lysine modification, and synaptic organization genes were downregulated in the C0/C3 clusters (Fig. 2f).
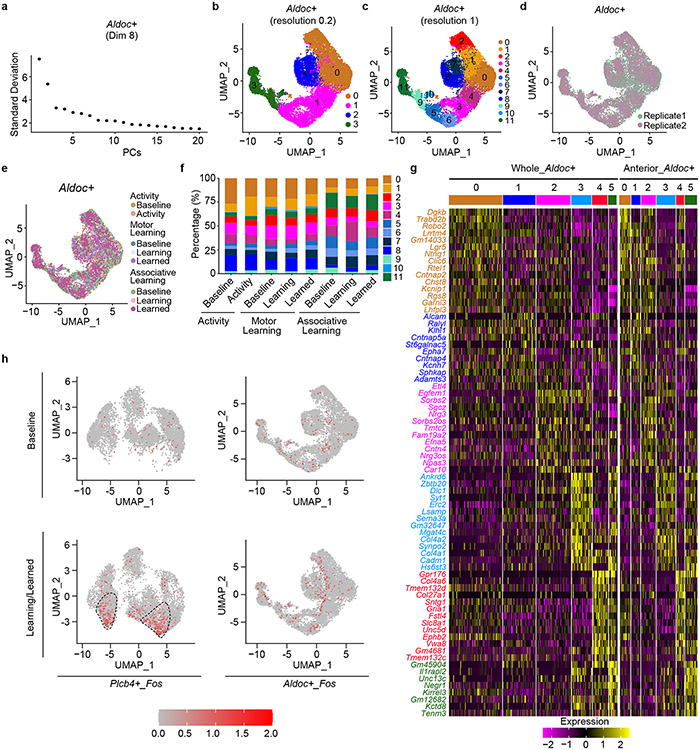
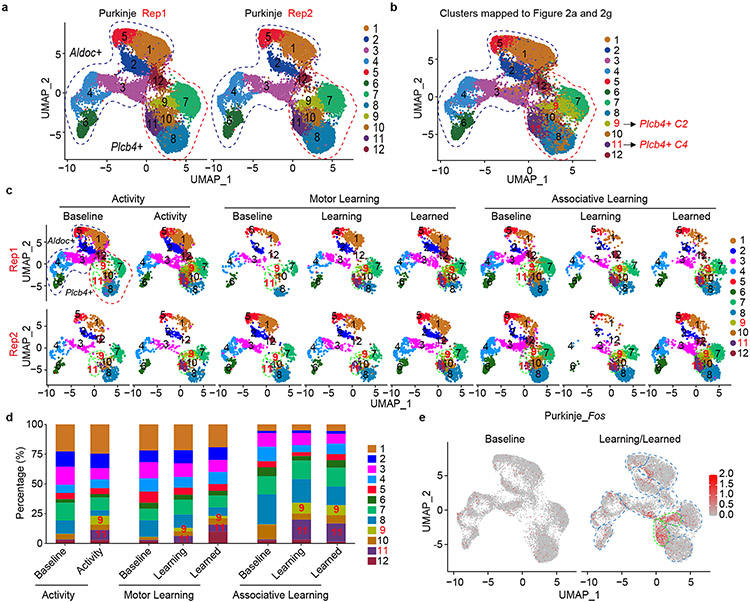
In contrast to Plcb4+ neurons, Aldoc+ Purkinje neurons showed no obvious inter-cluster shift after motor activity or learning at cluster resolutions 0.2, 0.5 or 1.0 (Fig. 2g-i and Extended Data Fig. 6a-g). Plcb4+ Purkinje neurons showed higher differential expression indices under activity and learning conditions than those in Aldoc+ Purkinje neurons (Fig. 2j). The Fos gene was specifically found in the activity/learning-linked C2/C4 clusters of Plcb4+ neurons (Extended Data Fig. 6h). In other analyses in which Plcb4+ and Aldoc+ data were pooled and subjected to unsupervised clustering, inter-cluster shifts and enriched Fos gene expression were consistently observed in Plcb4+, but not Aldoc+ neurons (Extended Data Fig. 7a-e), excluding clustering bias as a cause of Plcb4+ cluster shifts. Together, these results suggest that motor activity and learning robustly induce plasticity of gene expression selectively in Plcb4+ Purkinje neurons.
Plcb4+ Purkinje activity drives learning
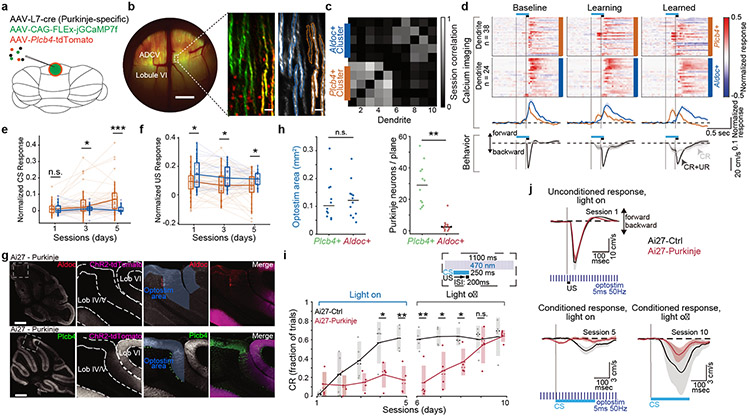
We next asked whether the two subpopulations of Purkinje neurons might play distinct roles in motor learning. We first determined whether these neurons might be differentially activated by climbing fiber inputs. To visualize climbing fiber-driven complex spikes in dendrites in Plcb4+ and Aldoc+ neurons, the calcium indicator jGCaMP7f13 was expressed in Purkinje neurons using L7-cre14 in cerebellar vermis lobules IV/V, which are required for associative learning12. Population identity (Plcb4+ or Aldoc+) was determined by relative expression of tdTomato under the control of a Plcb4-specific promoter and confirmed by correlation structure of complex spike activity within each population (Fig. 3a-c and Extended Data Fig. 8a). Purkinje neuron dendrites across both populations responded similarly to the unconditional stimulus (US) across sessions (Fig. 3d). Plcb4+ neurons developed a robust response to the conditional stimulus (CS) that increased in amplitude in conjunction with the performance of animals in the task, whereas Aldoc+ neurons exhibited a small and consistent response to the CS across all sessions (Fig. 3d-f). Thus, activity in Plcb4+ Purkinje neurons is selectively modified during cerebellar-dependent learning.
Figure 3. Plcb4+ Purkinje neuron activity is required for associative motor learning.
(a) Schematic of viral delivery for imaging. (b) Representative window with epifluorescent (left panel) and two-photon images (middle and right panels) showing Plcb4-specific tdTomato and Purkinje neuron-specific GCaMP expression. Scale bar, 0.5 mm for left panel and 50 μm for other panels. (c) Session correlations Aldoc+ or Plcb4+ Purkinje neurons. (d) Heat map and average traces showing trial-averaged GCaMP responses of Plcb4+ and Aldoc+ populations. Mean behavior in response to an isolated CS (CR) or paired CS and US (CR+UR). Data for 38 Plcb4+ cells and n=24 Aldoc+ were obtained from 4 mice. (e) Mean amplitude of responses of Plcb4+ and Aldoc+ neurons from d across sessions 100-200 ms after conditioned stimulus (CS) onset. p=0.049, 8.2e-4 for day3 and day5. (f) Mean amplitude of responses of Plcb4+ and Aldoc+ neurons across sessions 0-100 ms after unconditioned stimulus (US) onset. p=0.01, 0.02, 0.03 for day1, 3, 5. (g) Mid-sagittal cerebellar sections from Ai27-PC mice stained with anti-Aldoc or anti-Plcb4. Purkinje neurons expressing ChR2 were labeled with tdTomato. Scale bars, 0.5 mm for the whole cerebellum image. (h) Measurement of optostimulated areas and number of Aldoc+ and Plcb4+ Purkinje neurons within the area. Data from 12 sections in 4 mice. p=2.0e-6 (right panel). (i) Fraction of trials with a CR during sessions with light-on or light-off optostimulation. Data from 4 animals in each cohort. p=0.043, 0.005, 0.006, 0.019, 0.022 for days4-8. (j) Average UR on session 1 (upper left panel), CR by session 5 (lower left panel) and CR with light-off optostimulation by session 10 (lower right panel). Average traces are presented as mean ± s.e.m. All pairwise comparisons were made by two-tailed t-test. n.s. indicates not significant, *p < 0.05, **p < 0.01, ***p < 0.001.
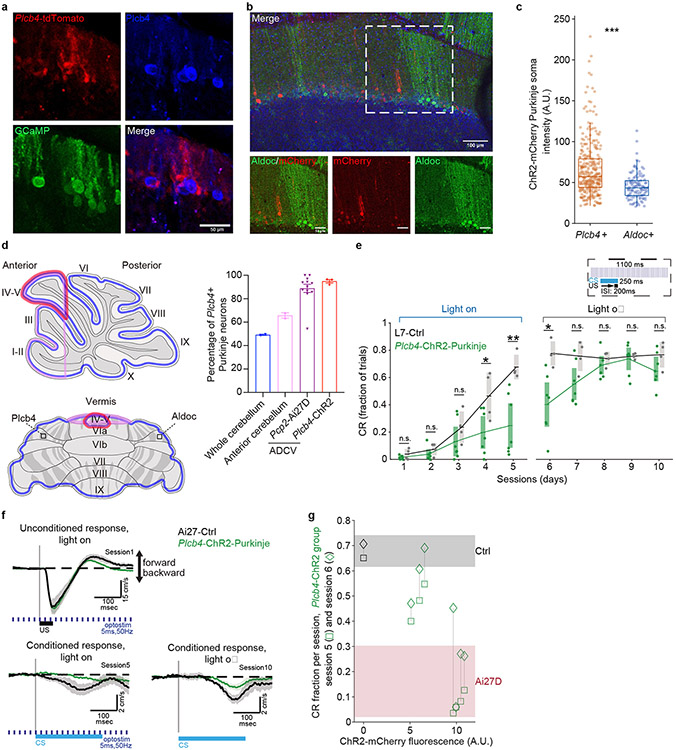
To determine whether Plcb4+ Purkinje neuron activity is required for associative learning, we expressed channelrhodopsin-2 (ChR2) in Purkinje neurons and perturbed their activity using light spatially targeted in the anterior dorsal cerebellar vermis, where Plcb4+ neurons comprise the majority of Purkinje neurons15 (Fig. 3g, 3h). We applied pulsed excitation light starting before and ending after each CS/US presentation (Fig. 3i). ChR2+ animals failed to respond to CS across an initial five sessions, whereas ChR2− littermates exposed to the same light stimulus normally acquired the CS response (Fig. 3i). This difference was not due to opsin expression because in subsequent training sessions with no optogenetic perturbation, ChR2+ animals learned the CS/US contingency comparably to ChR2− littermates (Fig. 3i, 3j). Likewise, both conditional response (CR) and unconditional response (UR) were similar across ChR2+ and ChR2− cohorts (Fig. 3i, 3j). In other experiments, associative motor learning was impaired upon optogenetic perturbation in Plcb4-ChR2 mice in which ChR2-mCherry was expressed under control of a Plcb4-specific promoter in cerebellar vermis lobules IV/V (Extended Data Fig. 8b-f). Expression of Plcb4 promoter-driven ChR2 was correlated with task performance (Extended Data Fig. 8g). Together, these findings show that Plcb4+ Purkinje neurons are required for associative motor learning.
Requirement for FGFR2 in motor learning
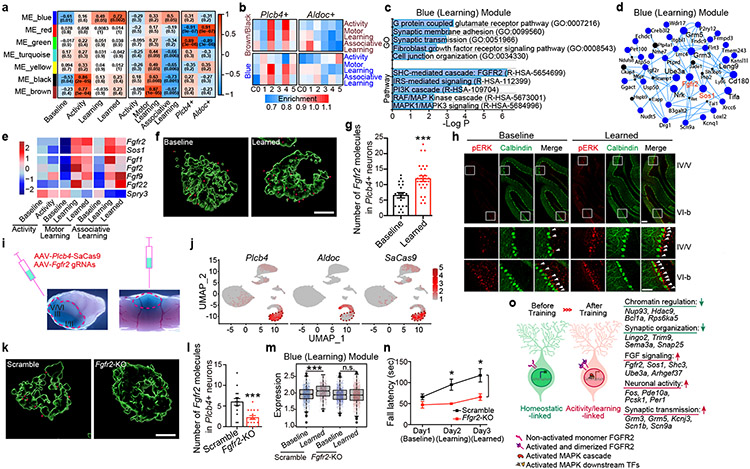
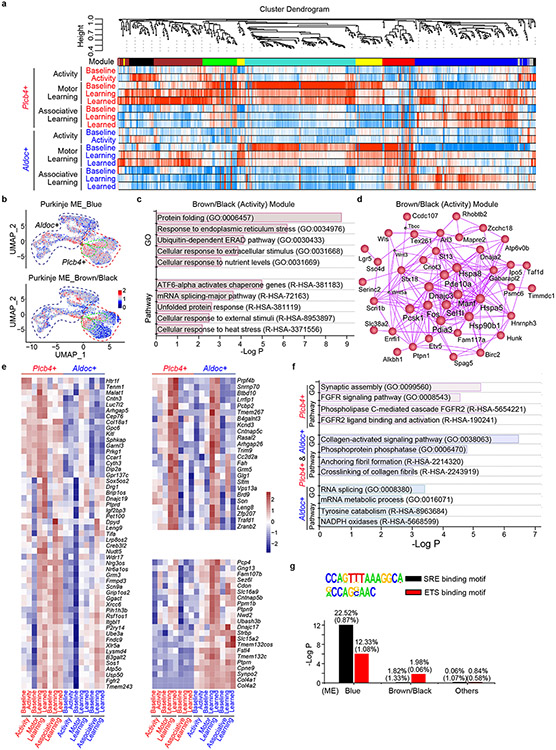
To elucidate the role of specific gene classes in Plcb4+ Purkinje neuron function, we next characterized the network dynamics of single-cell gene expression in Purkinje neurons upon motor activity and learning. Applying unbiased weighted gene co-expression network analysis (WGCNA)16 to pooled DEGs between Plcb4 and Aldoc clusters revealed seven gene-network modules (Extended Data Fig. 9a) (data avialible as Supplementary Table 4). The brown/black and blue modules, preferentially prominent in Plcb4+ neurons, were highly correlated with motor activity and learning, respectively, and their eigengenes were enriched in the C2/C4 clusters in Plcb4+ neurons (Fig. 4a, 4b and Extended Data Fig. 9a, 9b). Gene Ontology (GO), pathway, and hub-gene network analyses demonstrated that the brown/black module eigengenes were predominantly related to protein folding and responses to stimuli (Extended Data Fig. 9c, 9d), whereas the blue module eigengenes were enriched for synaptic transmission and FGFR2 signaling17 (Fig. 4c), which were predominantly in Plcb4+, but not Aldoc+, neurons (Extended Data Fig. 9e, 9f). Network analysis showed that the Fgfr2, Sos1, Nrk, and Ube3a genes, FGF signaling components were in the hub center (Fig. 4d).
Figure 4. FGFR2 signaling in Plcb4+ Purkinje neurons is required for learning-dependent transcription and motor learning.
(a) Module-trait correlation analysis. (b) Enrichment of learning and activity module genes in Plcb4+ or Aldoc+ neuron clusters. (c) Gene Ontology and Pathway analyses of the blue module genes. (d) Hub-gene network analysis of the blue module genes. (e) Average gene expression under different conditions, presented as normalized Z-scores. (f) RNA ISH analyses of Fgfr2 mRNA in Plcb4+ neurons. Scale bar, 5μm. (g) The number of Fgfr2 positive signals per Plcb4+ Purkinje neuron, presented as mean ± s.e.m, ***p=0.0002, n=20 (baseline) and 28 (learned) Plcb4+ neurons from 5 mice, two-tailed t-test. (h) Representative images of pERK and Calbindin in lobules IV/V and VI-b in sagittal cerebellar sections. Scale bars, 100 μm (upper panel) and 50 μm (lower panel). (i) Stereotaxic injection of AAV-Plcb4-SaCas9 and AAV-Fgfr2 gRNAs into the anterior vermis. (j) FeaturePlot showing the co-localization of SaCas9 with Plcb4, but not with Aldoc. (k) ISH of Fgfr2 mRNA in Plcb4+ neurons two weeks following CRISPR-induced knockout or control. Scale bar, 5μm. (l) Number of Fgfr2 positive signals per Plcb4+ neuron is presented as mean ± s.e.m, ***p=0.0004, n=15 Plcb4+ Purkinje neurons from 3 mice, two-tailed t-test. (m) Blue module genes were reduced upon Fgfr2 knockout in Plcb4+ cells. ***p=1.42e-09 for scramble in Plcb4+ neurons, two-sided un-paired t-test. n=2 in biologically independent snRNA-seq. 977 and 637 nuclei in scramble baseline and learned samples. 974 and 1514 nulcei in Fgfr2-KO baseline and learned samples. (n) Fall latency from mice upon Fgfr2 knockout in Plcb4+ neurons or control is presented as mean ± s.e.m. *p=0.018, 0.021 for days 2-3, n=6 mice, ANOVA followed by Fisher's PLSD post hoc test. (o) A model of Plcb4+ Purkinje neurons from baseline to activity/learning-linked state.
Expressions of Fgfr2, Sos1 and the ligands Fgf1, Fgf2, Fgf9 and Fgf22 were increased, whereas Spry3, an intracellular negative regulator of FGF signaling, was reduced in Plcb4+ Purkinje neurons upon motor learning (Fig. 4e). ISH studies confirmed that Fgfr2 mRNA was significantly increased in mice upon motor learning (Fig. 4f, 4g). Motor learning induced phosphorylated ERK (pERK) expression in cerebellar lobules IV/V (Fig. 4h), enriched in Plcb4+ Purkinje neurons (Fig. 1f, 3g and Extended Data Fig. 3), and only modestly in lobule VI-b (Fig. 4h), enriched in Aldoc+ neurons (Fig. 1f, 3g and Extended Data Fig. 9). Binding sites for the FGFR2-regulated transcription factors SRF and ETS18 were enriched in the blue module (Extended Data Fig. 9g).
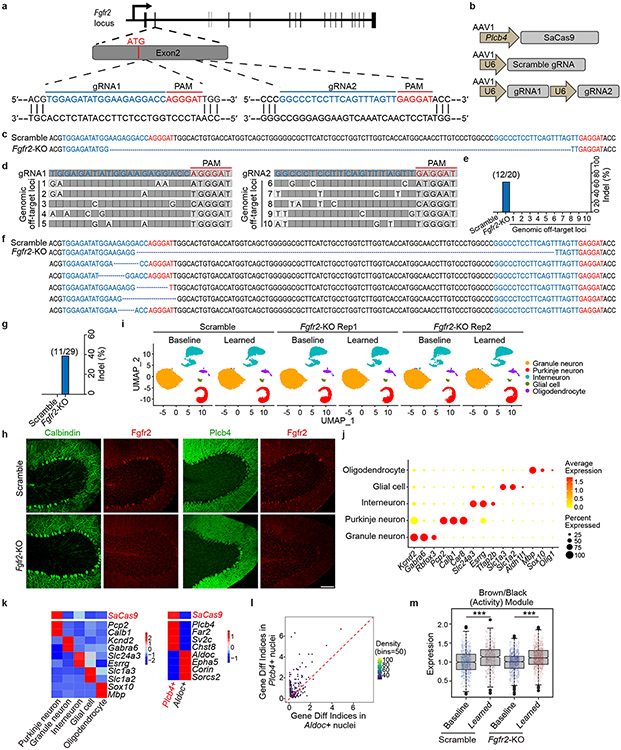
To characterize the role of FGFR2 signaling in Plcb4+ Purkinje neurons, we generated AAV viruses encoding SaCas9 downstream of the Plcb4 promoter and guide RNAs (gRNAs) targeting mouse Fgfr2, and validated their targeting efficiency and specificity in primary cells (Extended Data Fig. 10a-e). AAV-Plcb4-SaCas9 and AAV-Fgfr2-gRNAs or scrambled gRNA viruses were stereotactically injected into the anterior vermis of Pcp2-Cre/Sun1fl/wt mice for 3 weeks, followed by motor learning training and INTACT-FACS-snRNA-seq analyses (Fig. 4i). Targeting efficiency and specificity of Fgfr2 in Plcb4+ Purkinje neurons was confirmed in vivo (Fig. 4j-l and Extended Data Fig. 10f-k). CRISPR/SaCas9-induced Fgfr2 knockout triggered robust gene expression changes selectively in Plcb4+ Purkinje neurons (Extended Data Fig. 10l). Fgfr2 knockout diminished the induction of learning-related blue module genes, but not of the motor activity-related brown/black module genes (Fig. 4m and Extended Data Fig. 10m), suggesting a pivotal role FGFR2 signaling in expression of genes relevant to motor learning. Importantly, conditional CRISPR-induced knockout of Fgfr2 in Plcb4+ Purkinje neurons in the anterior vermis in mice impaired motor learning (Fig. 4n). Together, these results demonstrate that FGFR2 signaling in Plcb4+ Purkinje neurons is required for learning-dependent transcription and motor learning.
In this study, we have mapped the genome wide transcriptomic profiles of Purkinje neurons and defined their responses to motor activity and learning in mice. Our findings provide insights into the molecular and functional diversification of Purkinje neurons, and define gene modules and pathways that contribute to neuronal plasticity in the brain.
We have found that the two subpopulations of Plcb4+ and Aldoc+ Purkinje neurons bear distinct transcriptomic features, and surprisingly Plcb4+ neurons respond more robustly to motor activity and learning (see model in Fig. 4o). Accordingly, Plcb4+ Purkinje neurons selectively respond to sensory stimuli that induce associative learning in adult mice, and optogenetic perturbation of Plcb4+ Purkinje neurons impairs associative motor learning in mice. We also find that FGFR2 signaling is required for learning-dependent transcription and motor learning in mice. In future studies, how FGFR2 signaling regulates electrophysiological properties of Plcb4+ Purkinje neurons and motor learning should be explored.
Subpopulations of Purkinje neurons may bear distinct vulnerabilities in neurological diseases. Plcb4+ Purkinje neurons preferentially degenerate in mice carrying a voltage-gated calcium channel mutation19 and in mice used for studies of the disorder Niemann–Pick type C20. Future studies in the human brain may lead to identification of potential therapeutic targets in neurological diseases that selectively impact subpopulations of Purkinje neurons.
Online-only Methods
Animals
Mice were maintained under pathogen-free conditions. All animal experiments were performed according to protocols approved by the Animal Studies Committee of Washington University School of Medicine and Princeton University in accordance with the National Institutes of Health guidelines. Pcp2-Cre, lsl-Sun1-GFP (Sun1fl/fl) and Ai27D mice were purchased from Jackson laboratory. Sun1fl/fl mice were bred with Pcp2-cre driver mice to generate Pcp2-cre/Sun1fl/wt mice to label the nuclei membrane of Purkinje neurons with GFP. Ai27D mice were bred with Pcp2-cre mice to generate Purkinje neuron specific channelrhodopsin-2 expressing mice for optogenetic experiment. Both male and female mice were used for behavior studies and only male mice were used for profiling studies. All animals were housed under 12/12 regular light cycle for breeding and transferred to reverse light-cycle conditions with 14 hours of dark and 10 hours of light conditions a few weeks before behavioral procedures. Animals were kept under 72 degree F temperature and 50% relative humidity.
Adeno-associated virus design and packaging
To express Staphylococcus aureus Cas9 (SaCas9)21 in Plcb4+ Purkinje neurons, a 1.9 kb promoter of mouse Plcb4 (135499388-135501292, chromosome 2) was synthesized and homology recombined into GPAAV-MCS-CW3SL vector. The recombined GPAAV-Plcb4-MCS-CW3SL vector was further homology recombined with the PCR amplified SV40 NLS-SaCas9-Nuceoplasmin NLS. Adeno-associated virus (AAV) was packaged and concentrated in HEK293 cells (ATCC, CRL-1573). Virus were packaged at Hope Center Viral Vector core at Washington Univeristy School of Medicine and Genomeditech Co., LTD.
For Fgfr2 knockout, the 166 bp sequences in exon 2 downstream of the ATG start codon were sent to the website http://crispor.tefor.net/ for gRNAs design, yielding two gRNAs with NGRRT protospacer-adjacent motif (PAM). Five predicted off-target sites for each gRNA were also yielded. To increase the targeting efficacy, we used one vector system to express the two designed adjacent gRNAs (close to each other within 200bp)22,23. The synthesized gRNA1-SaCas9 sgRNA scaffold-terminator-Linker-human U6 Promoter-gRNA2-SaCas9 gRNA scaffold-terminator was homology recombined with GPAAV-human U6-WPRE vector. The AAV-U6-Fgfr2 gRNA1-U6-Fgfr2 gRNA2 and AAV-U6-Scramble gRNA were then used for AAV packaging. To validate the targeting efficiency and specificity of the designed gRNAs, CMV promoter driven SaCas9 was cloned into a lentiviral vector. Mouse embryonic fibroblast primary cultures were infected with lentiviruses encoding SaCas9 and AAV-Fgfr2 gRNAs or AAV-Scramble gRNA control. Targeting and predicted off-targeting loci were amplified by genomic DNA PCR, and the PCR amplified fragments were ligated into T-vector for sequencing validation. Primers sets are provided in online Supplementary Table 5.
Surgeries
For all surgeries, adult mice (4-7 weeks old) were anesthetized with isoflurane (5% induction, 1-2% maintenance) or ketamine/xylazine (100 or 10 mg kg-1 intraperitoneal). Dexamethasone (2 mg kg-1 intramuscular) and carprofen (5 mg kg-1 subcutaneous) were administrated to minimize swelling of the brain and inflammation and to provide analgesia before and during the post-operative period. The head was shaved from the frontal bone to the occipital bone and eye ointment was applied. The surgical area was sterilized by wiping the skin with three alternating swipes of 70% ethanol and betadine.
For head plate implantation, the scalp overlaying the skull was removed. Under a surgical microscope, the fascia was removed, the skull surface was dried, and a custom titanium head plate was placed over the skull bregma and secured using cyanoacrylate and Metabond cement (Parkell).
For cranial window implantation, a 3 mm cranial window was created centered above the primary fissure at the midline of the cerebellum using a pneumatically driven dental drill (House Brand). A drop of saline solution was applied over the dura and a 3 mm glass cranial window consisting of a 5 mm coverslip cured to two 3 mm coverslips was implanted on top of the dura as described24. The coverslip stack was secured in place using cyanoacrylate and Metabond cement (Parkell).
For optogenetic stimulation, a single small craniotomy (~500 μm diameter) was drilled directly on the midline and ~6.5 mm posteriorly from bregma. Ferrule implants25,26 were constructed with 400-μm-diameter optical fiber (Thorlabs FT400EMT). Ferrules were positioned over each craniotomy with the fiber tip at the surface of the dura mater, and Kwik-Sil adhesive was applied surrounding the exposed fiber. Dental cement (C&B Metabond, Parkell Inc.) was then applied to secure the ferrule and the headplate to the skull. Implants were cleaned before each behavior session using a fiber optic cleaning kit (Thorlabs CKF).
For viral delivery in mice, a 0.5 mm hole in the skull was drilled over the anterior cerebellum. A fine glass pipette connected to a microinjector system (Nanoinject II, Drummond) and mounted in the stereotaxic frame (Kopf) was used for injections. For imaging experiments, 0.5 μL AAV-CAG-Flex-jGCaMP7f (512 genomic counts/mL), AAV-L7-cre (111 genomic counts/mL), and AAV-Plcb4-tdTomato (113 genomic counts/mL) was delivered to the midline of lobules IV/V at a depth of 0.5 mm. For Fgfr2 knockout, 1 μL AAV-Plcb4-SaCas9 and AAV-Scramble gRNA or AAV-Fgfr2 gRNAs mixture (113 genomic counts/mL for both) were microinjected. Knockout efficiencies were analyzed by genomic DNA PCR amplification followed by sequencing, in situ hybridization, and immunohistochemistry.
Two-photon calcium imaging
Calcium imaging was acquired with Scanimage 2015 on a commercial two-photon microscope. Excitation light was provided by a Mai Tai Sapphire laser (Spectra-Physics) at 920 nm. Samples were imaged through a 16x objective lens (Zeiss, 20X Plan apochromat, 421452-9900) with a 1:1 mix of deionized water and ultrasound gel (Sonigel, Mettler Electronics) as the immersion medium. Emission light from GCaMP and tdTomato was collected onto green and red channel multi-alkali PMTs (Hamamatsu, R3896), respectively. Images were acquired at 29 Hz with 512 x 512 pixel resolution. Laser power (20–100 mW after the objective) was controlled with Pockels cells (Conoptics). Head-fixed mice were subjected to delay tactile startle conditioning using an ultraviolet LED (Edgelec, 395 nm) as CS and a motorized tactile stimulus as US. A black balloon was fitted over the microscope objective and above the mouse cranial window to block LED light from entering the objective. To visualize Purkinje neuron activity, cells were transduced by AAV-L7-cre and AAV-hSyn1-FLEx-jGCaMP7f. Plcb4+ and Aldoc+ neurons were differentiated by tdTomato expression in Plcb4+ neurons transduced by AAV-Plcb4-tdTomato. Purkinje neuron dendrites were identified as parasagittally elongated structures lying superficial to the Purkinje cell layer.
Calcium imaging analyses
GCaMP channel data were pre-processed using the CaImAn27 python package for large-scale calcium imaging analysis. To reliably track neurons across days, active neurons were extracted from data from each imaging session and then all ROIs from all sessions were registered against one another. ROIs missing in any session were not considered for further analysis.
Datasets from each day were corrected for motion using the NormCorre28 algorithm as implemented in CaImAn. The first five trials of every dataset were used to create a template to align all subsequent trials from the same session. Aligned data were then concatenated and downsampled in time and space by a factor of 5 and 2, respectively. Spatial footprints of active sources (ROIs) were then extracted using the constrained nonnegative matrix factorization algorithm applied on spatial patches. Spatiotemporal sources were then extracted using sparse nonnegative matrix initialization with spatial and temporal correlation thresholds set as 0.7 and 0.9, respectively and expected ROI half-size set as 30 by 5 pixels to align with the imaging orientation of the Purkinje neuron dendrites. The temporal profile of each source was then transformed to ΔF/F.
ROI extractions were exported as MATLAB structures and aligned to trial data including animal speed and trial type. For each neuron, ΔF/F signals were normalized to the maximum response across the entire recording, and then averaged across all trials of delay tactile startle conditioning. In any frame, neurons were considered active if the normalized neuronal response was greater than 0.2. Average CS and US responses were calculated by taking the mean of each neuron’s response in the time window 100-200 msec and 200-300 msec following onset of the CS, respectively.
To register components across imaging sessions, the motion transformation between the fields of view across sessions was computed. This transformation was then applied to the binarized components. Only those components with overlap of >60% across all days were considered for further analysis. To calculate the magnitude of red fluorescence within each spatial component, the tdTomato channel was aligned the GCaMP channel by applying the same motion displacement field estimated for the green channel. The average fluorescence value within each aligned and binarized component was then calculated and normalized to the highest value for each field of view to account for differences in illumination and expression across different fields of view. A histogram of the normalized averaged tdTomato fluorescence values was constructed and fit by a three component Gaussian mixture model. The minima of the resultant model were then used to delineate individual cells as Plcb4+, unspecified, or Aldoc+.
Optogenetic stimulation
For optogenetic stimulation of Purkinje neurons in the cerebellum, a Pcp2-cre::Ai27D cross was used. For optogenetic stimulation of Plcb4+ Purkinje neurons, the AAV-Plcb4-ChR2-mCherry virus was injected into anterior vermis. Light for optogenetic stimulation was produced by one 470-nm LEDs (Thorlabs M470F3, one for each implant) each powered by an LED driver (Thorlabs LEDD1B). Fiber optic patch cables (Thorlabs M98L01) carried light from the LEDs to the ferrule implants, where they were connected via custom-machined black Delrin sleeves. Light was delivered through 400-μm diameter optical fibers in 5-ms pulses at 50 Hz (generated by Master-8, A.M.P.I.) with an intensity of 3–15 mW/mm^2. Light delivery was triggered during the whole period of CS-US paired, CS-only and US-only trials via electrical signals sent by the behavioral control software through a microcontroller (Arduino Due).
To recover the optogenetic area of activation, tdTomato conjugated to channelrhodopsin-2 in the Ai27D mice was bleached through the optical fiber. After completion of the optogenetic delay tactile startle conditioning experiments, mice remained head-fixed on the treadmill. Light for tdTomato bleaching was delivered constantly for 45 minutes through the optical fiber used in optogenetic stimulation experiment and produced by 532 nm laser (MGL-III-532-200, OptoEngine LLC) with an intensity of 50 mW/mm^2 at the fiber tip. Right after photobleaching, animals were deeply anesthetized and then transcardially perfused using a peristaltic pump with phosphate buffered saline (PBS) followed by chilled 10% formalin (Fisher Scientific). Brains were extracted from the skull after perfusion, postfixed overnight at 4°C and preserved in 30% sucrose in PBS before sectioning. 90-μm thick sagittal sections were cut with a vibratome (Leica VT1000S). Sections were fluorescently imaged at 5x and at 20x with 3 μm z steps (Leica SP8 confocal laser-scanning microscope).
Immunohistochemical analyses
The cerebellum from animals perfused with 4% PFA was further post-fixed overnight, cryoprotected in 15% sucrose followed by 30% sucrose, frozen in tissue optimal cutting temperature embedding medium (Fisher) and cut into 15 μm sagittal sections. Sections were subjected to antigen retrieval followed by blocking (0.3% TritonX-100, 10% donkey serum, 3% BSA). Primary antibodies were applied in staining buffer (0.3% TritonX-100, 1% donkey serum, 1% BSA) with overnight incubation at 4°C. The next day, sections were washed and incubated in secondary antibodies for 1h at room temperature. Sections were counterstained with DNA dye bisbenzimide (Hoechst), mounted with Fluoromount-G, and visualized using Zeiss LSM 880II Airyscan FAST confocal microscope. Primary antibodies were as follows: GFP (Abcam ab13970, 1:500), Phospho-ERK (Cell signaling 4370, 1:200), Calbindin (Abcam ab82812, 1:500), RFP (Thermo Fisher 600-401-379, 1:300), Aldoc (Thermo Fisher PA512317, 1:100), Plcb4 (Santa Cruz Biotech sc-166131, 1:300) and Fgfr2 (Cell signaling 23328, 1:200). Secondary antibodies were as follows: Goat anti-Chicken IgY (H+L) Secondary Antibody, Alexa Fluor 488 (Thermo Fisher A11039, 1:500); Goat anti-Mouse IgG (H+L) Cross-Adsorbed Secondary Antibody, Alexa Fluor 568 (Thermo Fisher A11004, 1:500);Donkey anti-Rabbit IgG (H+L) Highly Cross-Adsorbed Secondary Antibody, Alexa Fluor 568 (Thermo Fisher A10042, 1:500); Donkey anti-Mouse IgG (H+L) Highly Cross-Adsorbed Secondary Antibody, Alexa Fluor 488 (Thermo Fisher A21202, 1:500); Goat anti-Mouse IgG2a Cross-Adsorbed Secondary Antibody, Alexa Fluor 647 (Thermo Fisher A-21241, 1:1000).
qRT-PCR
Reverse transcription reactions were performed with Superscript III (Invitrogen) according to the manufacture’s protocol. PCRs were performed using Quantstudio (ABI). Primer29 sets are provided in online Supplementary Table 6.
RNA in situ hybridization
The fixed frozen sections were prepared with cryostat at 15 μm thickness and RNA in situ was performed using RNAscope technology (Advanced Cell Diagnostics) following the manufacturer's protocol (RNAscope Multiplex Fluoresencent Assay). Briefly, after fixation, target retrieval and dehydration, the slides were treated with protease III for 20 min at room temperature. RNAscope probes were hybridized for 2 hours at 40°C and then fluorescence staining was done through a signal amplification system. Probes used were Plcb4 (52082-C3), Aldoc (429531-C4), Sv2C (545001), Sorcs2 (473411), Epha5 (508441), Corin (524471), Far2 (418141) and Fgfr2 (443501-C2). Images were acquired on a Zeiss LSM 800 microscope. Quantification was performed using Imaris 9.7.0 software (Bitplane). Fgfr2 signals were labeled and detected with TSA Plus Cyanine 3 using XY size of 0.8 μm, a Z size of 1.8 μm, spot function. Plcb4+ Purkinje neurons were labeled and detected with TSA Plus Cyanine 5 fluorophores using surface area function.
Activity rotarod assay
The activity rotarod assay was performed as described6. Six to seven week old sex-matched Pcp2-cre/Sun1fl/wt mice were trained on an accelerating rotarod (5-15 rpm) for 30 min. On the second day, mice were placed on the rotarod for 1 h to stimulate neuronal activity.
Accelerating rotarod assay
The accelerating rotarod assay was performed as described11. Six to seven week-old sex-matched PcP2-Cre/Sun1fl/wt mice or wild type mice were used. Mice were habituated followed by three consecutive days of training. The Rotarod apparatus (EzRod) was programmed to accelerate to 15 rpm over 1 min, hold at 15 rpm for 1min 50 sec, then decelerate to 0 during the last 10 sec.
Delay tactile startle conditioning
Animals underwent headplate implantation as described above. At least five days following recovery from surgery, head-fixed mice were habituated on a cylindrical treadmill for 30 min session followed by delay tactile startle conditioning test in a dark enclosure and noise restricted room. Mice learned to elicit a startle (backward) movement in response to an initially neutral conditional stimulus (CS; blue LED) that was paired with a startle-eliciting unconditional stimulus (US, 20 ms tactile stimulus on the nose by a fox plush toy) that was secured on a motorized wheel; CS-US inter-stimulus interval, 150 or 200 ms); 80-100 trials of CS and US pairing were performed each day, and the mouse locomotion was tracked using a rotary encoder read by a High-speed Data Acquisition device (DI-2108, Dataq Instruments) or Arduino Due (A000062, Arduino).
INTACT nuclei isolation and fluorescence-activated nuclei sorting for snRNA-seq
Whole cerebellum was dissected from mice upon activity (baseline, activity) and motor learning (baseline, learning, learned) training conditions. In associative motor learning (baseline, learning and learned) training conditions, anterior vermis lobules were microdissected, which included the major central vermis from lobules IV-V and parts from I-III. Dissected samples were rapidly transferred to a chilled homogenizer and dounced in 1.5 ml homogenization buffer containing 0.25 M sucrose, 150 mM KCl, 5 mM MgCl2, 20 mM Tricine-KOH pH 7.8, 1 mM DTT, 0.15 mM spermine, 0.5 mM spermidine and protease inhibitor to release nuclei. Each sample was mixed with 1.5 ml 50% iodixanol (Sigma) and layered onto 29% iodixanol. The gradient was centrifuged at 10,000 g for 30 min at 4°C. Nuclei were diluted in 10% BSA with Dyecycle Ruby for FACS. Dyecycle Ruby and GFP were used for sorting singlet Purkinje nuclei. To analyze gene expression profiles of all cell types within the cerebellum, we combined GFP− and GFP+ nuclei after FACS with a ratio of 1:1. After counting and analyzing nuclear integrity, 8,000-16,000 individual nuclei per sample were loaded onto a 10X Genomics Chromium platform for Gel Beads-in-emulsion (GEM) and cDNA generation carrying cell- and transcript-specific barcodes and sequencing libraries constructed using the Chromium Single Cell 3’library & Gel Bead Kit V3. Libraries were sequenced on the Illumina NovaSeq6000.
Processing of raw snRNA-seq data
Raw sequencing reads were aligned using the Cell Ranger v3.1.0 pipeline. The cellranger mkref command was used to build the reference with the GRCm38/ENSEMBL FASTA including two transgenic genes GFP and SaCas9. The cellranger count command was used to map the reads to the reference and to obtain feature-barcode matrices. Cellranger aggr pipeline was applied to equalize the read depth between samples.
Quality control
Low-quality nuclei that had total number of UMIs (nCounts) <500, unique detected genes (nFeatures) <200 and a mitochondrial content >5% were eliminated. Any nuclei that had 3 standard deviations above the mean of nCounts or the outliers in fitting a loess curve between nFeatures and nCounts were removed. The genes that were expressed in less than 5 nuclei were also removed.
snRNA-seq data clustering and analysis
Clustering of single nuclei was performed using Seurat v3.1.230. The SCTransform algorithm was used to perform normalization and variance stabilization31. Then, a principal component analysis (PCA) was performed, and the optimal number of principal components (PCs) were chosen by using the ElbowPlot and DimHeatmap functions. Dimensionality reduction was performed with RunUMAP function and visualized at cluster resolutions from 0.01 to 1.0. FindIntegrationAnchors and IntegrateData functions based on canonical correlation analysis (CCA) were used for integration of datasets from different training paradigms and biological replicates.
Marker gene identification and cell-type annotation
Cell type-specific gene signatures were identified with the FindAllMarkers function in Seurat default settings. For any given comparison, we retained genes with an average expression log2 fold change (LFC) greater than 0.25 expression in at least 25% of nuclei in either population. Cell clusters were annotated using canonical markers of known cell types in combination with the distinct marker signatures identified.
Identification of differentially expressed genes
We used the FindMarkers function in Seurat (Wilcoxon rank sum test) to detect differentially expressed genes between two groups. Genes with adjusted p-value < 1e-5 and LFC > 0.25 were considered differentially expressed. In addition, the differentialGeneTest function in the R package Monocle.v2.12.0 was used to measure the differential expression index. Genes with adjusted p-value < 1e-5 were considered differentially expressed and the negative Log-adjusted p-values were presented as differential expression index.
Definition of learning genes in Aldoc+ or Plcb4+ Purkinje neurons
Learning genes in Aldoc+ or Plcb4+ Purkinje neurons were defined by using the following criteria: 1) differential expressed gene analyses were performed between two samples (baseline vs. activity, baseline vs. learning, baseline vs. learned for each cluster of Aldoc+ (C0, C1, C2, C3, C4, C5, All) or Plcb4+ (C0/2, C1, C3/4, C5, All) Purkinje neurons for each behavior paradigm. All genes up-regulated upon learning were selected, excluding the genes that were upregulated in the activity paradigm, as they likely represent a response specific to activity; 2) Aldoc+ or Plcb4+ specific genes were excluded from learning genes.
Single cell trajectory analysis
To construct single-cell pseudotime trajectories and identify dynamic gene expressions along cell state transition, Monocle3 v0.2.2 was applied to cell clusters C0, C2, C3, C4 in Plcb4+ Purkinje neurons. Monocle3 places the cells along a trajectory corresponding to biological processes via the reversed graph embedding technique. Here, cells transit from the homeostatic to activity/learning state. C0/C3 were defined as the earliest principal node. Function graph_test was applied to define trajectory-variable genes at a resolution of 0.01.
Gene set enrichment analysis
Gene set enrichment analysis (GSEA) in R Package clusterProfiler 3.14.3 was used to identify the significantly differential enrichment of annotated gene sets between two groups (Plcb4+ vs. Aldoc+ cells, C0 vs. C2 in Plcb4+ Purkinje neurons, C3 vs. C4 in Plcb4+ Purkinje neurons) using c5.all.v6.2.symbols.gmt as a reference set. NES (normalized enrichment scores) were calculated, and gene sets with a p-value < 0.05 were considered significant.
Weighted gene correlation network analysis (WGCNA)
The R package WGCNA 1.70-3 was used to construct a co-expression network for all the DEGs between any of two samples. All 16 samples were used to calculate Pearson’s correlation matrices representing co-expression similarity of genes, and different paradigms (activity, motor learning, associative learning) related to status (baseline, activity, learning, learned) and cell types (Plcb4+ and Aldoc+) were loaded as “traits”. The weighted adjacency matrix was created using Pearson Correlation Cofficient test between each paired DEGs and transformed into a topological overlap measure (TOM) matrix to minimize effects of noise and spurious associations. Average linkage hierarchical clustering of the TOM matrix was used to construct a clustering dendrogram of the genes. The minimal gene module size was set to 30 and the threshold to merge similar modules was set to 0.25. The gene with the highest module membership (kME) value was identified as a hub gene. To assess the enrichment of ETS and SRE binding to module genes, we first mapped the known ETS and SRE binding motifs separately to the promoter regions (within −1kB and +1kB of TSS) of module genes and random genome DNA sequence as control by using the findMotifsGenome.pl program in Homer v4.11. Gene Ontology (GO) term enrichment analyses for the module genes were performed by using PANTHER'S Gene List Analysis Tool32 (adjusted p-value< 0.01 and Fold Enrichment >1.75). Enriched pathways for module genes were calculated by using the R package ReactomePA 1.30.0 (adjusted p-value< 0.01).
Protein-protein interaction (PPI) network construction
The networks of the hub genes in the modules were built by using the GeneMANIA Cytoscape plugin (version 3.5.1). The weighted average of the individual networks is calculated to generate a composite output network displaying the interactions between hub genes and the likelihood of functionally related genes represented by a grey scale.
Statistics
Statistical analyses for qPCR analyses and behavior were done using Grapdhpad Prism 7.0 and R3.6. For experiments in which only two groups were analyzed, the t test was used. Pairwise comparisons with multiple groups were done by ANOVA. Boxplots indicate median, interquartile range and whiskers 1.5 times the interquartile range. GSEA adopted permutation-test (two-sided) to calculate the p-value and Benjamini-Hochberg test for adjusted p-value. GO terms and Pathways analyses were performed by Fisher’s exact test (one-sided) to calculate the p-value and Bonferroni test for adjusted p-value. Genes listed in Supplementary tables 2 and 3 adopted Wilcoxon Rank Sum test (two-sided) to calculate the p-value and Bonferroni test for adjusted p-value.
Extended Data
Extended Data Figure 1. An INTACT-FACS-snRNA-seq system for high throughput transcriptomic analysis of cell types in adult mouse cerebellum.
a, Adult Pcp2-Cre/Sun1fl/wt mouse cerebellum was subjected to immunohistochemical analyses with antibodies labeling Calbindin (red), GFP (green) and the DNA dye bisbenzimide (Hoechst). INTACT labeling was restricted to Calbindin+ Purkinje neurons. Scale bar, 100 μm. Similar results were found in 4 animals for representative data. b, Schematic representation of the sagittal view of lobules across the central vermis and top view of the whole cerebellum. Parasagittal Zebrin II+ strips are labeled in light color and anatomically dissected anterior vermis lobules are boxed. c, Adult mouse cerebellum was subjected to INTACT gradient nuclei isolation followed by FACS purification. GFP positive or negative while DyeCycle Ruby labeled single nuclei were sorted and defined as qualified for future sequencing analysis. d, Nuclei from pre- and post-FACS were subjected to DNA dye bisbenzimide analysis under the confocal microscope. Preserved intact nuclei after FACS were observed. Scale bar, 10 μm. Similar results were found in 2 animals for representative data. e, f, Nuclei from pre- and post-FACS were subjected to qRT-PCR analyses, and the mRNA expressions of Pcp2 and Gabra6 were either enriched or de-enriched in post-FACS nuclei samples. Data are presented as mean ± s.e.m. ***p=6.9e-6, 5.6e-6, by two-tailed unpaired t-test, n=4 mice. g, h, i, Pre- and post-FACS nuclei from cerebellum of baseline mice or mice with rotarod activation were subjected to qRT-PCR analysis of the Fos, FosB and Npas4 expressions. Data are presented as mean ± s.e.m. ***p=1.9e-5, 2.7e-7 for pre- and post-FACS Fos expression; ***p=3.0e-4, 3.7e-4 for pre- and post-FACS FosB expression, **p=0.003, 0.003 for pre- and post-FACS Npas4 expression, n=4 mice, two-tailed unpaired t-test. j, 18,151 nuclei from anterior vermis lobules assigned into granule neurons, Purkinje neurons, interneurons, glial cells and oligodendrocytes based on unsupervised clustering and UMAP plot visualization. k, l, Nuclei of two biological replicates and sequencing batches from the whole cerebellum or anterior vermis lobules showed similar cell type clustering and high correlation of gene expression. m, Feature plot demonstrated the number of nCounts in each categorized nuclei isolated from the whole cerebellum or anterior vermis lobules. n, Feature plot demonstrated that the GFP transcripts almost exclusively enriched in Pcp2 featured Purkinje neurons. 98.1% GFP+ cells in the whole cerebellum and 95.9% in the anterior vermis lobules were clustered with the Purkinje neuron population. o, Heat map showing identified marker genes in each categorized cell types.
Extended Data Figure 2. Aldoc+ and Plcb4+ Purkinje neurons show distinct molecular and cellular features.
a, 20,814 single nuclei of Purkinje neurons were subjected to principal component analysis. Heat map showed that the first principal component (60.9%) clustered Purkinje neurons into Plcb4+ and Aldoc+ populations. b, UMAP plot showing grouped Purkinje nuclei from the whole cerebellum or anterior vermis lobules into two primary categories, Aldoc+ and Plcb4+ Purkinje neurons. c, Nuclei of two biological replicates and sequencing batches from the whole cerebellum or anterior vermis lobules showed similar cell type clustering. d, Bar plot showing the percentages of Aldoc+ and Plcb4+ Purkinje neurons in the whole cerebellum and anterior vermis lobules. Data are presented as mean ± s.e.m. n=2 in biologically independent snRNA-seq. 5870 Aldoc+ and 5675 Plcb4+ neurons in whole cerebellum; 3243 Aldoc+ and 6026 Plcb4+ neurons in anterior vermis lobules. e, The coronal sections through the anterior (up panel) or posterior (lower panel) cerebellar lobules were subjected to ISH analyses using fluorescence-labeled Aldoc (red) or Plcb4 (green) RNA probes. Scale bar, 800 μm. Similar results were found in 3 animals for representative data. f, Scatter plot depicting the expressions of DEGs in Plcb4+ and Aldoc+ Purkinje neurons in the anterior vermis lobules. Blue dots showing representative genes highly expressed in Plcb4+, while purple ones were those in Aldoc+ Purkinje neurons. g, Heat map showing the representative functional genes specifically expressed in Plcb4+ or Alodc+ Purkinje neurons isolated from the whole cerebellum or anterior vermis lobules. Expression values are presented as normalized Z-scores.
Extended Data Figure 3. ISH validation of the expression patterns of newly identified cluster genes for Purkinje neurons in sagittal sections.
a, b, c, d, e, ISH analyses using fluorescence-labeled Aldoc or Plcb4 RNA probes (green) and probes for newly identified cluster genes (red) in cerebellar sagittal sections through the central vermis. Scale bars, 800 μm for the left panel and 200 μm for the right panel. Similar results were found in 3 animals for representative data.
Extended Data Figure 4. ISH validation of the expression pattern of newly identified cluster genes for Purkinje neurons in coronal sections.
a, b, c, ISH analyses using fluorescence-labeled Aldoc or Plcb4 RNA probes (green) and probes for newly identified cluster genes (red) in cerebellar coronal sections. Scale bars, 800 μm for the left panel and 200 μm for the right panel. Similar results were found in 3 animals for representative data.
Extended Data Figure 5. Plcb4+ Purkinje neurons undergo transcriptomic plasticity upon exposure to activity and learning experiences.
a, Schematic representation of the training paradigms for activity and motor learning. b, Cerebellar motor learning paradigm was performed on Pcp2-cre/sun1fl/wt mice. Data are presented as mean ± s.e.m. n=9 mice. c, Schematic representation of the delay tactile startle conditioning training paradigm for associative motor learning. CS, conditional stimuli with blue light; US, unconditional stimuli with a motorized toy. d, e, Cerebellar associative motor learning paradigm was performed on Pcp2-cre/sun1fl/wt mice. Data are presented as mean ± s.e.m. n=11 mice. f, ElbowPlot showing the ordered standard deviations of principal components (PCs) for identification of significant dimension that begins to plateau. Dim 8 was chosen at the standard deviations of 2. g, Heat map showing the representative marker genes of each cluster of Plcb4+ Purkinje neurons isolated from the whole cerebellum or anterior vermis lobules. Expression values are presented as normalized Z-scores. h, 22,205 Plcb4+ Purkinje nuclei isolated from the whole cerebellum or anterior lobules under control, activity, motor learning or associative learning conditions were grouped into 10 clusters based on marker gene expression with cluster resolution of 1.0. i, Bar plot showing the percentages of all 10 clusters with cluster resolution at 1.0 under different conditions described in h. j, 22,205 Plcb4+ Purkinje nuclei isolated from the whole cerebellum or anterior lobules under control, activity, motor learning or associative learning conditions were grouped into 4 clusters based on marker gene expression with cluster resolution of 0.2. k, Monocle analysis showing C3/C4 and C0/C2 were clearly demarcated into two major paths: C4 derived from C3 and C2 derived from C0. l, 103 upregulated genes along the pseudo-time course referring to activity/learning-linked genes in C2/C4 and 26 downregulated genes linked with C0/C3 were identified, respectively. m, Dynamic expression changes of C2/C4 representative gene, Ube3a, and C0/C3 representative gene, Nup93, along the pseudo-time course.
Extended Data Figure 6. Aldoc+ Purkinje neurons show no obvious transcriptomic plasticity upon exposure to activity and learning experiences.
a, ElbowPlot showing the ordered standard deviations of principal components (PCs) for identification of significant dimension that begins to plateau. Dim 8 was chosen at the standard deviations of 2. b, 19,424 Aldoc+ Purkinje nuclei isolated from the whole cerebellum or anterior vermis lobules under control, activity, motor learning or associative learning conditions were grouped into 4 clusters based on marker gene expression with cluster resolution of 0.2. c, 19,424 Aldoc+ Purkinje nuclei isolated from the whole cerebellum or anterior vermis lobules under control, activity, motor learning or associative learning conditions were grouped into 12 clusters based on marker gene expression with cluster resolution of 1.0. d, e, UMAP plot showing the grouped cluster landscape of Aldoc+ nuclei of different training paradigms under baseline, activity, learning or learned conditions. f, Bar plot showing the percentages of all 12 clusters with cluster resolution of 1.0 under different conditions described in c. g, Heat map showing the representative marker genes of each cluster (resolution of 0.5) of Aldoc+ Purkinje neurons isolated from the whole cerebellum or anterior vermis lobules. Expression values are presented as normalized Z-scores. h, Fos expression in the clusters of Plcb4+ and Aldoc+ Purkinje neurons at baseline or learning/learned condition.
Extended Data Figure 7. Plcb4+, but not Aldoc+ Purkinje neurons undergo transcriptomic plasticity upon exposure to activity and learning experiences.
a, Two biological replicates of combined Aldoc+ and Plcb4+ Purkinje nuclei were grouped into 12 clusters based on marker gene expression with cluster resolution of 1.0 (Dim 12). b, Projection of 6 clusters of Plcb4+ neurons in Fig. 2a and 6 clusters of Aldoc+ neurons in Fig. 2g to the combined dataset. Cluster 9 and cluster 11 were respectively categorized with C2 and C4, those two Plcb4+ clusters enriched in activity and learning experiences. c, Split visualization of the 12 clusters of Aldoc+ and Plcb4+ Purkinje neurons isolated from the whole cerebellum or anterior vermis lobules from two replicates under activity, motor learning or associative learning conditions. d, Bar plot showing the percentages of all 12 clusters of Aldoc+ and Plcb4+ Purkinje neurons isolated from the whole cerebellum or anterior vermis lobules as demonstrated in c. e, Fos expression in the clusters of combined Plcb4+ and Aldoc+ Purkinje neurons at baseline or learning/learned condition.
Extended Data Figure 8. Plcb4+ Purkinje neuron activity is required for associative learning.
a, AAV-Plcb4-tdTomato labels Plcb4+ Purkinje neurons transduced by Purkinje neuron-specific GCaMP (AAV-L7-cre + rAAV-CAG-FLEx-jGCaMP7f). Scale bar, 50 μm. Similar results were found in 2 animals for representative data. b, AAV-Plcb4-ChR2-mCherry representative histology. Scale bars, 100 μm for the top panel and 50 μm for the lower panels. Similar results were found in 2 animals for representative data. c, Quantification analysis of mCherry intensities in Plcb4+ and Aldoc+ Purkinje neurons as in b. Data are presented as standard box and whisker plots. ***p=1.2e-9, by two-tailed unpaired t-test. n=301 Plcb4+ and 113 Aldoc+ Purkinje neurons derived from 3 mice. d, (Left panel) Schematic representation of the whole cerebellum, anterior cerebellum and light-spatially-targeted ADCV. (Right panel) Comparison of the ratio of Plcb4+ to all Purkinje neurons extracted in whole cerebellum (0.49 ± 0.005, n=2 biologically independent experiments), ADCV (0.65 ± 0.02, n=2 biologically independent experiments) (as shown in Extended Data figure 2d), excited by spatially directed optogenetic light (PcP2-Ai27D targeted light, 0.89 ± 0.04, 12 slices derive from 4 mice) and Plcb4-specific optogenetic experiments (Plcb4-ChR2-mCherry, 0.95 ± 0.01, cell counts from 3 mice). Data are presented as mean ± s.e.m. e, Fraction of trials with a CR during sessions with light-on or light-off optostimulation for animals transduced by Plcb4-ChR2 with L7-cre (n=7 mice) or L7-Cre alone (controls, n=4 mice). As evidenced by CR performance during the first five training sessions, daily optostimulation of Plcb4+ Purkinje neurons in lobules IV/V impairs associative learning in mice. During optostimulation light off sessions, Plcb4-ChR2 mice show gradual increase in CR performance similar to L7-control mice. Data are presented as mean ± s.e.m. p=0.03, 0.005, 0.01 for days 4-6, by two-tailed unpaired t-test. f, Average UR on session 1 (upper left panel). Unlike Plcb4-ChR2 mice, control mice learned to make well-timed CRs by session 5 despite equivalent exposure to light-on optostimulation (lower left panel). Both groups exhibit well-timed CRs with light-off optostimulation by session 10 (lower right panel). g, The correlation of ChR2 expression with CR success rate at training section 5 and 6.
Extended Data Figure 9. Motor activity- and learning-associated gene modules in Purkinje neurons.
a, Weighted gene co-expression network analysis (WGCNA) dendrogram indicating clustering of different gene modules in Plcb4+ and Aldoc+ nuclei upon activity, motor learning or associative learning training. b, FeaturePlot showing the average expression of the activation (brown/black) and learning (blue) module genes in clusters of Plcb4+ and Aldoc+ Purkinje neurons. c, Gene ontology (GO) and Pathway analyses of the activity (brown/black) modules. d, Hub-gene network analysis of the activity (brown/black) modules. e, Enrichment of the learning genes in Plcb4+ (left panel), Plcb4+ and Aldoc+ (right up panel), or Aldoc+ (right lower panel) Purkinje neurons under motor learning and associative learning paradigms. f, GO and Pathway analyses of Plcb4+, Plcb4+ and Aldoc+, or Aldoc+ Purkinje neurons-enriched learning genes. g, Enrichment of FGFR2 signaling regulated downstream transcription factor binding motifs, serum response element (SRE) and E-Twenty Six (ETS), in the learning (blue), activity (brown/black) and other module gene sets. Enrichment of SRE and ETS in random genome DNA sequences is used as control.
Extended Data Figure 10. Specificity and efficiency of Plcb4-SaCas9 expression and Fgfr2 gRNA targeting.
a, Schematic representation of the arrangement of mouse Fgfr2 exons and the two targeting gRNAs. b, Schematic representation of the AAV vectors of Plcb4-SaCas9, U6-Scramble gRNA and U6-Fgfr2 gRNAs. c, Sequencing analyses showing an example of insertion/deletions (indels) mediated by SaCas9/Fgfr2 gRNA1 and gRNA2 in mouse Fgfr2 genomic loci after co-expression of SaCas9 and Fgfr2 gRNAs in mouse embryonic fibroblasts. d, Predicted off-target sites of Fgfr2 gRNAs. e, Genomic DNA sequences surrounding the targeting or off-targeting loci were amplified by PCR and ligated to T vector. After transformation, colonies of each group were sequenced and the percentage of colonies showing indels were calculated. f, Sequencing analyses showing examples of indels in Fgfr2 genomic loci of INTACT-enriched Purkinje neuron nuclei after AAV-mediated expression of SaCas9 and Fgfr2 gRNAs. g, Percentage of indels introduced in mouse Fgfr2 genomic loci of Purkinje neurons after AAV-mediated expression of SaCas9 and Fgfr2 gRNAs. h, Representative immunofluorescence images of Fgfr2 and Calbindin or Plcb4 in lobules IV/V in cerebellar sagittal sections of scramble or Fgfr2-KO mice. Scale bar, 100 μm. i, Split UMAP plot visualization of granule neurons, Purkinje neurons, interneurons, glial cells and oligodendrocytes from anterior vermis lobules of scramble and Fgfr2-KO samples under baseline and learned conditions. j, Visualization of molecular signatures of each population by their percentage and average gene expressions. k, Heat map of INTACT-FACS-snRNA-seq data from the anterior vermis lobules of Fgfr2-KO or control mice, presented as normalized Z-scores. l, Scatter plot showing the differential expression indices for each DEG in Aldoc+ or Plcb4+ Purkinje neurons upon Fgfr2-KO in Plcb4+ Purkinje neurons. m, Brown/black module genes were not reduced upon Fgfr2-KO in Plcb4+ cells. p=1.08e-07 for scramble and p=2.2e-16 for Fgfr2-KO, two-sided unpaired t-test. n=2 in biologically independent snRNA-seq. 977 cells, 637 cells in scramble baseline and learned samples. 974 cells, 1514 cells in Fgfr2-KO baseline and learned samples.
Supplementary Material
Acknowledgements
This work was supported by NIH grant NS041021 (to A.B), National Key Research and Development Program of China grant 2018YFA0108000, 2019YFA0110300 (to X.Z), National Natural Science Foundation of China grant 82025020 (to X.Z), F32 MH120887 (to G.J.B.), and R01 NS045193 and R01 MH115750 (to S.W.), Children’s Discovery Institute of Washington University and St. Louis Children’s Hospital (CDI-CORE-2015-505 and CDI-CORE-2019-813) and the Foundation for Barnes-Jewish Hospital (3770 and 4642). Behavior Core was supported by funds provided by the McDonnell Center for Systems Neuroscience at Washington University in St. Louis.
Footnotes
Competing interests
The authors declare no competing interests.
Data availability
Sample information, cerebellum cluster maker gene list, differentially expressed genes of Plcb4+ and Aldoc+ Purkinje neurons and module significant genes are provided in online Supplementary Information. All source data, including sequencing reads and single-cell expression matrices are available from the Gene Expression Omnibus (GEO) under accession code GSE153184.
Code availability
Code for preprocessing of calcium imaging or optogenetics and single nuclei RNA-sequencing bioinformatic analysis are available from the authors on request.
References
- 1.Yap EL & Greenberg ME Activity-Regulated Transcription: Bridging the Gap between Neural Activity and Behavior. Neuron 100, 330–348, doi: 10.1016/j.neuron.2018.10.013 (2018). [DOI] [PMC free article] [PubMed] [Google Scholar]
- 2.Mayer C et al. Developmental diversification of cortical inhibitory interneurons. Nature 555, 457–462, doi: 10.1038/nature25999 (2018). [DOI] [PMC free article] [PubMed] [Google Scholar]
- 3.Kozareva V et al. A transcriptomic atlas of mouse cerebellar cortex comprehensively defines cell types. Nature 598, 214–219, doi: 10.1038/s41586-021-03220-z (2021). [DOI] [PMC free article] [PubMed] [Google Scholar]
- 4.Hrvatin S et al. Single-cell analysis of experience-dependent transcriptomic states in the mouse visual cortex. Nat Neurosci 21, 120–129, doi: 10.1038/s41593-017-0029-5 (2018). [DOI] [PMC free article] [PubMed] [Google Scholar]
- 5.Mo A et al. Epigenomic Signatures of Neuronal Diversity in the Mammalian Brain. Neuron 86, 1369–1384, doi: 10.1016/j.neuron.2015.05.018 (2015). [DOI] [PMC free article] [PubMed] [Google Scholar]
- 6.Yang Y et al. Chromatin remodeling inactivates activity genes and regulates neural coding. Science 353, 300–305, doi: 10.1126/science.aad4225 (2016). [DOI] [PMC free article] [PubMed] [Google Scholar]
- 7.De Zeeuw CI Bidirectional learning in upbound and downbound microzones of the cerebellum. Nat Rev Neurosci 22, 92–110, doi: 10.1038/s41583-020-00392-x (2021). [DOI] [PubMed] [Google Scholar]
- 8.Zhou H et al. Cerebellar modules operate at different frequencies. Elife 3, e02536, doi: 10.7554/eLife.02536 (2014). [DOI] [PMC free article] [PubMed] [Google Scholar]
- 9.Wadiche JI & Jahr CE Patterned expression of Purkinje cell glutamate transporters controls synaptic plasticity. Nat Neurosci 8, 1329–1334, doi: 10.1038/nn1539 (2005). [DOI] [PubMed] [Google Scholar]
- 10.Rodriques SG et al. Slide-seq: A scalable technology for measuring genome-wide expression at high spatial resolution. Science 363, 1463–1467, doi: 10.1126/science.aaw1219 (2019). [DOI] [PMC free article] [PubMed] [Google Scholar]
- 11.McConnell MJ, Huang YH, Datwani A & Shatz CJ H2-K(b) and H2-D(b) regulate cerebellar long-term depression and limit motor learning. Proc Natl Acad Sci U S A 106, 6784–6789, doi: 10.1073/pnas.0902018106 (2009). [DOI] [PMC free article] [PubMed] [Google Scholar]
- 12.Yamada T et al. Sensory experience remodels genome architecture in neural circuit to drive motor learning. Nature 569, 708–713, doi: 10.1038/s41586-019-1190-7 (2019). [DOI] [PMC free article] [PubMed] [Google Scholar]
- 13.Dana H et al. High-performance calcium sensors for imaging activity in neuronal populations and microcompartments. Nat Methods 16, 649–657, doi: 10.1038/s41592-019-0435-6 (2019). [DOI] [PubMed] [Google Scholar]
- 14.El-Shamayleh Y, Kojima Y, Soetedjo R & Horwitz GD Selective Optogenetic Control of Purkinje Cells in Monkey Cerebellum. Neuron 95, 51–62 e54, doi: 10.1016/j.neuron.2017.06.002 (2017). [DOI] [PMC free article] [PubMed] [Google Scholar]
- 15.Sarna JR, Marzban H, Watanabe M & Hawkes R Complementary stripes of phospholipase Cbeta3 and Cbeta4 expression by Purkinje cell subsets in the mouse cerebellum. J Comp Neurol 496, 303–313, doi: 10.1002/cne.20912 (2006). [DOI] [PubMed] [Google Scholar]
- 16.Langfelder P & Horvath S WGCNA: an R package for weighted correlation network analysis. BMC Bioinformatics 9, 559, doi: 10.1186/1471-2105-9-559 (2008). [DOI] [PMC free article] [PubMed] [Google Scholar]
- 17.Thomas GM & Huganir RL MAPK cascade signalling and synaptic plasticity. Nat Rev Neurosci 5, 173–183, doi: 10.1038/nrn1346 (2004). [DOI] [PubMed] [Google Scholar]
- 18.Spencer JA, Major ML & Misra RP Basic fibroblast growth factor activates serum response factor gene expression by multiple distinct signaling mechanisms. Mol Cell Biol 19, 3977–3988, doi: 10.1128/mcb.19.6.3977 (1999). [DOI] [PMC free article] [PubMed] [Google Scholar]
- 19.Herrup K & Wilczynski SL Cerebellar cell degeneration in the leaner mutant mouse. Neuroscience 7, 2185–2196, doi: 10.1016/0306-4522(82)90129-4 (1982). [DOI] [PubMed] [Google Scholar]
- 20.Sarna JR et al. Patterned Purkinje cell degeneration in mouse models of Niemann-Pick type C disease. J Comp Neurol 456, 279–291, doi: 10.1002/cne.10522 (2003). [DOI] [PubMed] [Google Scholar]
- 21.Ran FA et al. In vivo genome editing using Staphylococcus aureus Cas9. Nature 520, 186–191, doi: 10.1038/nature14299 (2015). [DOI] [PMC free article] [PubMed] [Google Scholar]
- 22.Zhu S et al. Genome-scale deletion screening of human long non-coding RNAs using a paired-guide RNA CRISPR-Cas9 library. Nat Biotechnol 34, 1279–1286, doi: 10.1038/nbt.3715 (2016). [DOI] [PMC free article] [PubMed] [Google Scholar]
- 23.Sun H et al. Development of a CRISPR-SaCas9 system for projection- and function-specific gene editing in the rat brain. Sci Adv 6, eaay6687, doi: 10.1126/sciadv.aay6687 (2020). [DOI] [PMC free article] [PubMed] [Google Scholar]
- 24.Andermann ML, Kerlin AM, Roumis DK, Glickfeld LL & Reid RC Functional specialization of mouse higher visual cortical areas. Neuron 72, 1025–1039, doi: 10.1016/j.neuron.2011.11.013 (2011). [DOI] [PMC free article] [PubMed] [Google Scholar]
- 25.Sparta DR et al. Construction of implantable optical fibers for long-term optogenetic manipulation of neural circuits. Nat Protoc 7, 12–23, doi: 10.1038/nprot.2011.413 (2011). [DOI] [PMC free article] [PubMed] [Google Scholar]
- 26.Deverett B, Kislin M, Tank DW & Wang SS Cerebellar disruption impairs working memory during evidence accumulation. Nat Commun 10, 3128, doi: 10.1038/s41467-019-11050-x (2019). [DOI] [PMC free article] [PubMed] [Google Scholar]
- 27.Giovannucci A et al. CaImAn an open source tool for scalable calcium imaging data analysis. Elife 8, doi: 10.7554/eLife.38173 (2019). [DOI] [PMC free article] [PubMed] [Google Scholar]
- 28.Pnevmatikakis EA & Giovannucci A NoRMCorre: An online algorithm for piecewise rigid motion correction of calcium imaging data. J Neurosci Methods 291, 83–94, doi: 10.1016/j.jneumeth.2017.07.031 (2017). [DOI] [PubMed] [Google Scholar]
- 29.Spiegel I et al. Npas4 regulates excitatory-inhibitory balance within neural circuits through cell-type-specific gene programs. Cell 157, 1216–1229, doi: 10.1016/j.cell.2014.03.058 (2014). [DOI] [PMC free article] [PubMed] [Google Scholar]
- 30.Butler A, Hoffman P, Smibert P, Papalexi E & Satija R Integrating single-cell transcriptomic data across different conditions, technologies, and species. Nat Biotechnol 36, 411–420, doi: 10.1038/nbt.4096 (2018). [DOI] [PMC free article] [PubMed] [Google Scholar]
- 31.Hafemeister C & Satija R Normalization and variance stabilization of single-cell RNA-seq data using regularized negative binomial regression. Genome Biol 20, 296, doi: 10.1186/s13059-019-1874-1 (2019). [DOI] [PMC free article] [PubMed] [Google Scholar]
- 32.Mi H, Muruganujan A, Casagrande JT & Thomas PD Large-scale gene function analysis with the PANTHER classification system. Nat Protoc 8, 1551–1566, doi: 10.1038/nprot.2013.092 (2013). [DOI] [PMC free article] [PubMed] [Google Scholar]
Associated Data
This section collects any data citations, data availability statements, or supplementary materials included in this article.
Supplementary Materials
Data Availability Statement
Sample information, cerebellum cluster maker gene list, differentially expressed genes of Plcb4+ and Aldoc+ Purkinje neurons and module significant genes are provided in online Supplementary Information. All source data, including sequencing reads and single-cell expression matrices are available from the Gene Expression Omnibus (GEO) under accession code GSE153184.
Code for preprocessing of calcium imaging or optogenetics and single nuclei RNA-sequencing bioinformatic analysis are available from the authors on request.


