Abstract
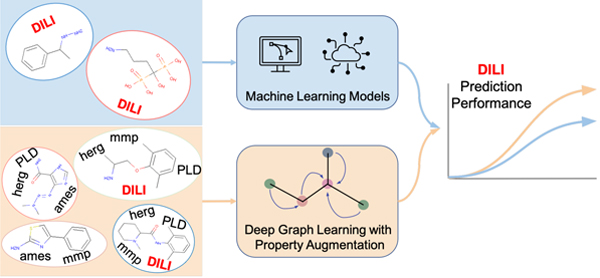
Drug-induced liver injury (DILI) is a crucial factor in determining the qualification of potential drugs. However, the DILI property is excessively difficult to obtain due to the complex testing process. Consequently, an in silico screening in the early stage of drug discovery would help to reduce the total development cost by filtering those drug candidates with high risk to cause DILI. To serve the screening goal, we apply several computational techniques to predict DILI property, including traditional machine learning methods and graph-based deep learning techniques. While deep learning models require large training data to tune huge model parameters, the DILI dataset only contains a few hundreds of annotated molecules. To alleviate the data scarcity problem, we propose a property augmentation strategy to include massive training data with other property information. Extensive experiments demonstrate that our proposed method significantly outperforms all existing baselines on DILI dataset by obtaining a 81.4% accuracy using cross-validation with random splitting, 78.7% using leave-one-out cross-validation, and 76.5% using cross-validation with scaffold splitting.
Graphical Abstract
Introduction
Drug discovery has been a critical research area for years. The development process of new drugs is extremely time consuming and resource costly since it usually requires a series of complicated in vitro and in vivo experiments.1–3 One major challenge is to identify the safety of the potential drug candidates, e.g. filtering the drugs that may cause human toxicity. Drug-induced liver injury (DILI) is one of the most fundamental toxicity concerns that are undesirable and unpredictable. Several research indicate that traditional hepatotoxicity testings on animal models may have distinct outcomes from humans.4–6 Since animal or human model testings are usually conducted in the late stage of drug development, the withdrawal or termination of such disqualified drug candidates would sacrifice lots of previous efforts. Therefore, a precise and accurate model to better predict DILI in the early stage would be a promising approach to facilitate the development progress.
Human toxicity data is extremely hard to collect, since in vivo and in vitro toxicological studies cannot provide adequate assessment when the drug candidates are applied on human.4–6 Several labeling schemes7–10 have been developed to annotate DILI label for certain drugs to provide predictive models with labeled data. Sakatis et al. is based on physician desk reference, while others7–9 are coming from case reports and literature. Although labeled DILI datasets are available in public, such datasets only contain one or two hundreds of drugs, and what is worse, the labeling standards are inconsistent. To tackle this problem, FDA develops an annotation scheme to label DILI risk of 1036 FDA-approved drugs, and announces the DILIrank11 dataset in 2016. The previous version of DILIrank annotates the drugs with Most-DILI concern, Less-DILI concern, and No-DILI concern, based on the regulatory professionals assessment.12 The new scheme establishes a more detailed verification process dividing the drugs into four categories: Most-DILI concern, Less-DILI concer, No-DILI concern, and Ambiguous DILI concern.11 DILIrank is the most widely used dataset to develop predictive models of DILI, and has been used in various studies.13–16 Lately, FDA further augments DILIrank to DILIst4 with other four literature datasets by applying concordance analysis across these five datsets. Until now, DILIst is the largest dataset with DILI classification, which contains 1279 drugs. These efforts4,11 provide invaluable resource for predicting DILI risk.
DILI prediction can be considered as the application of molecular property prediction, which is one of the oldest cheminformatics tasks. Many in silico methods have been applied to solve molecular property prediction problem.17–20 These approaches generally convert the molecule into a vector representation via different procedures, and then go through different machine learning models to predict the label information. The vector representation of a molecule is called fingerprints. Traditionally, fingerprints are either manually constructed by experts (hand-crafted biologist-guided fingerprints), or calculated by a fixed hash function (hash-based fingerprints). The former one is designed by specialists based on biological experiments and chemical knowledge. Specific substructures of the compounds are considered as functional groups, and their corresponding local features are determined based on their properties revealed during experiments or different states.17,18 E.g., CC(OH)CC appears to have solubility relevant characteristic; thus it has been isolated as local features to produce fingerprints on solubility related tasks. Hash-based fingerprints such as circular fingerprints employ a fixed hash function to extract each layer’s feature of a molecule based on the concatenated features of the neighborhood in the previous layer.19 This type of the fingerprints is non-invertible, so there is no way to check back and modify the quality of the fingerprints if the hash function cannot capture enough information, which might lead to poor performance in further predictive tasks. To tackle this problem, Le et al. recently proposes a reverse-engineering method to reconstruct the molecular structure from hash-based fingerprints such as ECFP.19
With the rapid increase of deep learning techniques, recent studies trend to address molecular property prediction with such novel models. One promising research interest is considering a molecule as a graph, since the atoms of the molecules can be referred as the vertexes, and the bonds between atoms as the edges. Neural fingerprints20 are the first attempt to learn molecular vector representation based on its graph structure. The difference between neural fingerprints and hash-based fingerprints is the replacement of the hash function. Neural fingerprints apply a non-linear activated densely connected layer to generate the fingerprints. Many other graph-based deep learning models can also be applied to represent a molecule by embedding the graph features to a continuous vector.22,23 Within them, the Message Passing Neural Networks (MPNN)24,25 have achieved notable prediction performance. MPNN models recursively update the atom or bond features by aggregating message/information from its adjacent atoms or bonds, then employ a readout function to pool all updated features of atoms to deliver the global representation of the molecule. However, these methods only focus on one single view of the graph topology, either atom-central or bond-central. Taking Figure 1 as an example, the left graph is the atom-oriented structure of caffeine, and the right one is its bond-oriented representation. It is observed that both atom and bond features should be taken into account when embedding a molecule graph, e.g., the double bond within the benzene N = C is distinct from bond C = O, atom N and C are notably different. Inspired by this insight, we propose a fresh perspective of viewing the graph from two aspects in our recent work MV-GNNcross,26 which involves both atom messages and bond messages. MV-GNNcross model takes the molecular SMILES as input, and use RDKit27 to extract the graph structure and the local features associated with each atom and bond. A graph encoder network then learns and converts such information into a vector representation of the input molecular SMILES. After that, the vector representation is fed into a prediction network to predict the property label. Our method outperforms all previous SOTAs on 11 commonly used molecular property prediction tasks. Therefore, we employ our graph-based deep learning model on DILIrank dataset to classify the DILI label, and have achieved superior prediction performance compared with other models including both graph-based deep learning models and traditional fingerprints-based models.
Figure 1:

Atom-oriented graph v.s. Bond-oriented graph.
Other than that, available labeled DILI drugs are still quite limited for data-hungry deep learning models. In order to get better and more stable prediction performance, several research have been done from different aspects. Thakkar et al. develops a new annotation scheme to augment the drug list with DILI risk. Minerali et al. employs different machine learning models on different human toxicity dataset to investigate the corresponding prediction performance. Ancuceanu et al. and Mora et al. propose to obtain better prediction results with ensemble computational models and various molecular descriptors. These attempts have earned certain achievement, but may still be restricted by the available labeled DILI data. To tackle this bottleneck and reinforce the expressive power of deep learning model, we propose a property augmentation strategy to utilize MV-GNNcross models along with more data by taking advantage of other property information. In particular, we create a larger training dataset by combining more drugs with other toxic properties, such as PLD28 which measures the organism-level toxicity of compounds. Since graph neural network is able to learn molecular vector representation only based on its graph structure and the underlying atom/bond level features, more input data shall help generate more accurate molecular representation. Moreover, for those properties with more available data, deep learning techniques are more likely to obtain better performance. Thus, the correct prediction would help promote the entire training including those properties with only few samples, such as DILI. In this fashion, we are able to increase the accuracy of DILI to 81.4% using cross-validation with random splitting, 78.7% using leave-one-out cross-validation, and 76.5% using cross-validation with scaffold splitting, which is regarded as the remarkable boost considering the challenges on DILI risk prediction. Detailed methodologies and experimental procedures are described in later sections.
Methodologies
We take our recent work MV-GNNcross model as the backbone to implement proposed property augmentation method, since MV-GNNcross outperforms other baseline models on DILI dataset in extensive experiments. As shown in Figure 2, MV-GNNcross contains two principal parts, the Encoder Network and the Prediction Network. The Encoder Network transforms the input molecular SMILES into a vector representation based on its graph structure, and the Prediction Network is responsible for classifying the binary label of certain properties, such as DILI. Beyond that, we employ deep multi-label learning to establish proposed method while involving more properties information along with DILI.
Figure 2:

Overview of MV-GNNcross models.
Molecular Graph Preliminaries
A molecule can be naturally represented as a graph based on its chemical structure, in particular, by taking the atoms as the nodes, and the bonds between atoms as the edges. Thus, the molecular graph is denoted as , where is a set of the atoms, and is a set of the bonds. Based on such graph structure, the initial features of atoms and bonds are extracted as the learning information, and referred as xa and yb. Figure 3 takes ethionamide as an example to illustrate how a molecule converts to its corresponding computational graph.
Figure 3:
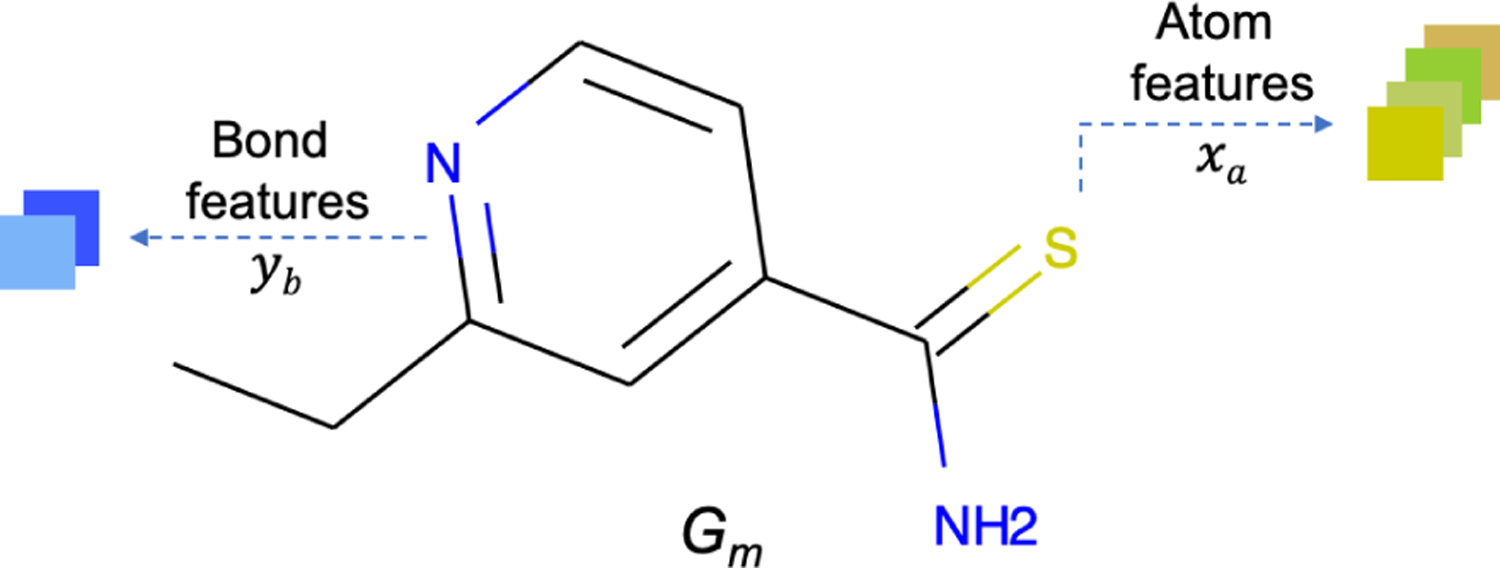
Graph definition of ethionamide. Gm represents the entire graph structure, xa and yb refer to the atom and bond features that associates with each atom and bond, respectively.
The initial features for each atom and bond is selected follow the same protocol of Yang et al., as shown in Table 1 and Table 2. All the features are one-hot encodings except the atomic mass, and are extracted using RDKit.27
Table 1:
Atom features selection.25
| Features | Size | Descriptions |
|---|---|---|
| atom type | 100 | type of atom (e.g., C, N, O), in the order of atomic number |
| formal charge | 5 | integer electronic charge assigned to atom |
| number of bonds | 6 | number of bonds the atom is connected |
| chirality | 4 | Unspecified, tetrahedral CW/CCW, or other |
| number of Hs | 5 | number of bonded hydrogen atoms |
| atomic mass | 1 | mass of the atom, divided by 100 |
| aromaticity | 1 | whether this atom is part of an aromatic system |
| hybridization | 5 | sp, sp2, sp3, sp3d, or sp3d2 |
Table 2:
Bond features selection.25
| Features | Size | Descriptions |
|---|---|---|
| bond type | 4 | single, double, triple, or aromatic |
| stereo | 6 | E/Z, cis/trans, any, or none |
| in ring | 1 | whether the bond is part of a ring |
| conjugated | 1 | whether the bond is conjugated |
Encoder Network
Molecules can be observed from two perspectives, one is that taking the atoms as the centers and bonds as the connections,24 while the other one is to consider bonds as the centers and atoms as connections.25 Inspired by multi-view learning,29 MV-GNNcross takes advantage of the two perspectives, and design a multi-view framework to generate more informative molecular representation. In specific, the encoder network is constructed by two streams, atom-oriented and bond-oriented, where each contains one Graph Neural Network (GNN). Next, a self-attentive readout mechanism is employed to convert the learned molecular feature matrix to a vector representation.
Atom-oriented GNN and Bond-oriented GNN
The Atom-oriented GNN learns the molecular representation by aggregating neighbor atoms recursively for several steps, while Bond-oriented GNN establishes similar procedure via a bond-central fashion. The generalized GNN can be defined as:
| (1) |
In (1), and represent the neighbor aggregation function and state update function respectively. and are the aggregated message and states vector for entity o at d + 1 step respectively. Entity o can be either atoms or bonds. is the neighborhood entity set of entity o. µattached is the attached features of entity o during aggregation. In Atom-oriented GNN, entity o represents the atoms, µattached denotes the features for the connected bonds. The Bond-oriented GNN is formed with a similar implementation by considering the bonds as passing centers, and atom features as attached. Specially, entity o represents the bonds, and the corresponding bond messages are constructed by bond states vector and attached atom features µattached.
Self-Attentive Readout
The outputs of the two GNN models are the learned feature matrices by regarding molecular graph as atom-oriented and bond-oriented. As demonstrated in Figure 2, in order to obtain the fixed length of molecular vector representation, a readout transformation is need to eliminate the obstacle of size variance and permutation variance. Other than commonly used mean-pooling or maxpooling, a self-attentive readout is employed here to generate molecular representation associated with different attention weights.30,31 Formally, take a output of Atom-oriented GNN Hn as an example, the self-attention over atoms is defined as:
| (2) |
where n is the number of atoms in the molecule. W1 and W2 are learnable matrices, which are shared between the two streams to enable message circulation during the multi-view training process. Thus, two molecular vectors are generated in a multi-view manner.
Prediction Network
In MV-GNNcross, we have generated two vectors from the two sub-modules: atom-oriented GNN and bond-oriented GNN. These two vectors are fed into two prediction networks to make the predictions. Since the two vectors generated via atom-oriented GNN and bond-oriented GNN are coming from the same input SMILES, so the predictions should be the same. Thus, we employ MSE loss to restrain the training, called disagreement loss. Formally, we formulate this molecular property prediction loss as follows:
| (3) |
where is the supervised loss for each prediction and is the disagreement loss between two classifiers.
Property Augmentation Learning
DILI dataset only contains a few hundreds of drugs, which is extremely small for deep learning. In order to take advantage of the expressive power of deep graph learning models such as MV-GNNcross, we demand more information to boost the training. Since DILI is a property of human toxicity, we compare it with other four available human toxicity datasets: herg,32,33 PLD,28 ames,34,35 and mmp.36,37 We notice there are overlapping molecules between DILI and these four toxicity datasets. We assume that such correlation may help the training of DILI. Hence, we propose to utilize these additional toxicity information to promote the prediction performance of DILI.
Multi-label Training
As shown in Figure 5, original DILI dataset contains only 479 SMILES. We take it with other four toxicity properties (herg, PLD, ames, and mmp) which are provided by NIH, to form a larger dataset. Specifically, we combine these five datasets based on the SMILES representation of the drugs. Thus, a large matrix contains 15,669 data samples is generated, where each row stands for one SMILES, and the five columns are the corresponding property labels. Each SMILES could have one or more property labels, and those properties which are not observed for each SMILES are marked as missing values, and are represented as NaN. The constructed Tox-DILIthen goes through MV-GNNcross model to classify the labels. We employ a multi-label training approach to establish the property augmentation learning process. During the training process, all property predictions share the same encoder network, and make prediction for each property label individually. Then, the average of all the prediction loss is used to update the neural network parameters. We treat each property equally important, and ignore the prediction for those NaN properties to avoid deviation.
Figure 5:
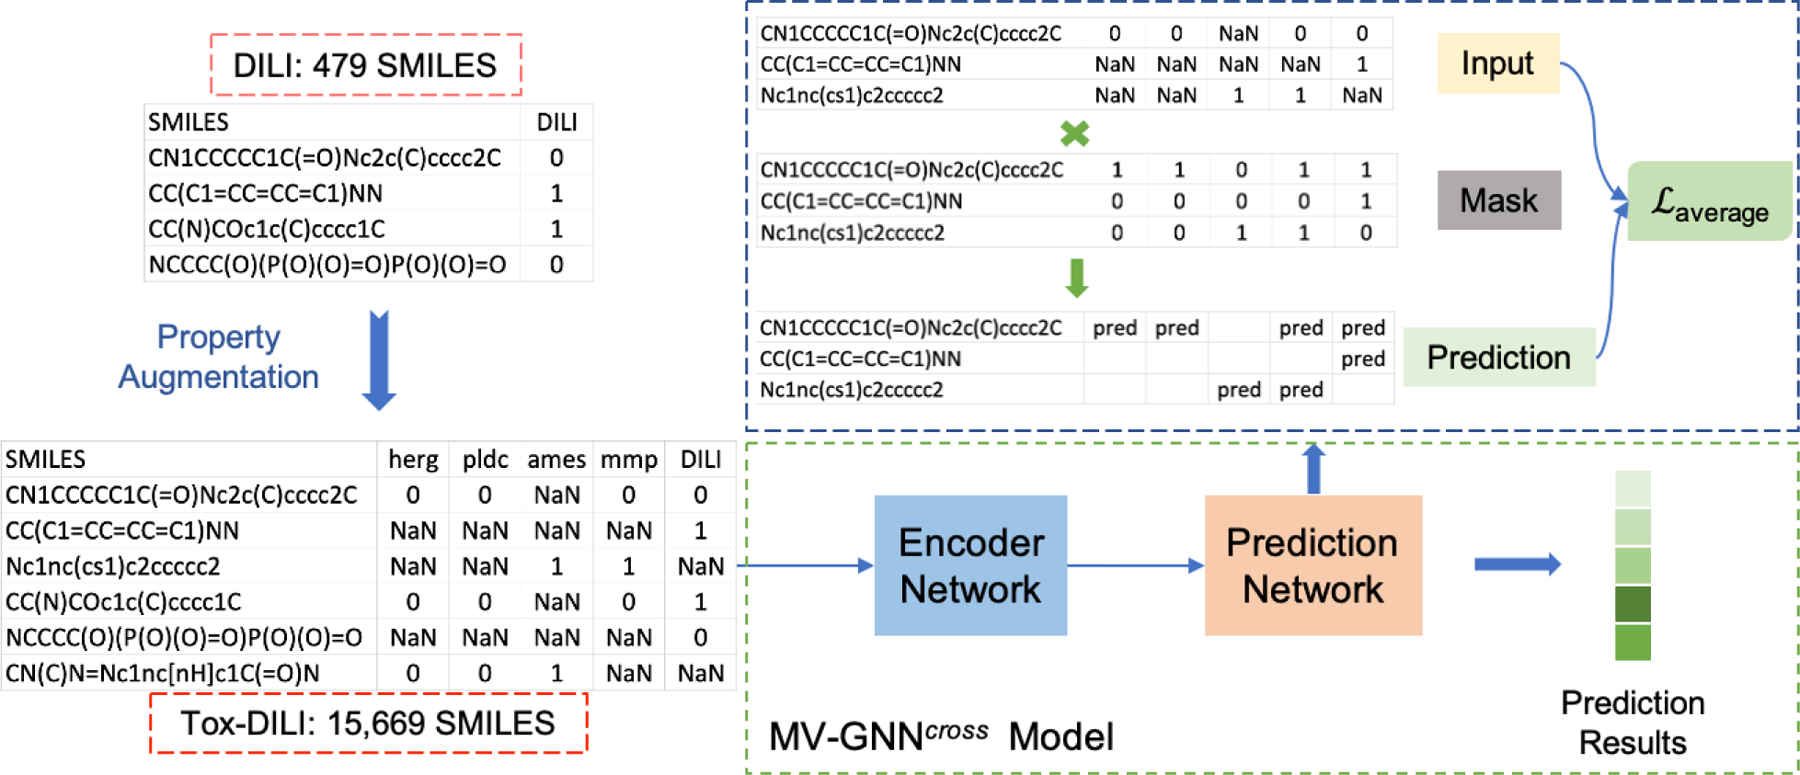
Property augmentation procedure. Original DILI dataset is augmented to Tox-DILI dataset. Tox-DILI is then fed into MV-GNNcross model for prediction. During the training period of the prediction network, a mask scheme is applied to handle the back-propagate of missing labels, and an average loss across all properties is used to restrain the entire training.
Missing Labels Handling
In order to eliminate the effects of the missing labels during the training period, we need to identify such labels for each SMILES, and ignore them during the back-propagation. In our experiments, a mask scheme is implemented as the filter. The mask is a matrix with exact same size of the input, which is applied in the prediction network. While the prediction is made by the prediction network, and the loss is calculated for each data sample, the mask is then multiplied with the loss values. The mask matrix is filled by 0s and 1s, as the corresponding positions with missing labels are recorded as 0, others as 1. Thus, any weights associated with those missing labels would have no influence on the further computation.
Since each SMILES may have multiple binary property labels at the same time, such task could be regarded as multiple binary classification problem. Hence, we employ the Binary Cross Entropy (BCE) loss as the prediction loss function, and compute the average loss across each property. Suppose the dataset contains molecules , formally, we formulate the final loss processed by the mask as follows:
| (4) |
where and are the output predictions produced by the two prediction networks, and are the corresponding computed loss. yi is the ground truth label, and N is the total number of properties, which is 5 in our experiments here.
Evaluation Criteria
Since our task is to predict the binary label of DILI by considering Most-DILI-Concern as the positive label and No-DILI-Concern as the negative label, we thoroughly evaluate the performance of each method by calculating the accuracy, sensitivity, specificity, F1-score, Matthews correlation coefficient and ROC-AUC. The accuracy score is the total percentage of the correct predictions of DILI label. Sensitivity is also called true positive rate, which measures the percentage that drugs with positive DILI labels are truly predicted as positive. Specificity is the true negative rate, which represents the rate that drugs without DILI risks are correctly predicted as negative labels. F1-score is the weighted average of precision and recall, where precision is the ratio of the correct positive predictions to all positive predictions, and recall is the ratio of the correct positive predictions to all ground truth positive labels. Matthews correlation coefficient (MCC) leverage the performance of all of the four confusion matrix categories (true positives, false negatives, true negatives, and false positives). ROC-AUC measures the separability of the model to correctly predict positive labels as positive, and negative labels of negative. In addition, we evaluate statistical significance using one-sided Wilcoxon signed-rank test.
Experiments
We have conducted extensive experiments using Circular-fp,19 Neural-fp,20 MPNN,24 DMPNN,25 and MV-GNNcross 26 on DILI to validate the performance. Beyond that, we take MV-GNNcrossas backbone, and employ our proposed property augmentation approach to involve more data, in order to further boost the prediction performance of DILI. Moreover, we conduct additional experiments using MPNN and DMPNN on augmented Tox-DILIdataset to proof the effectiveness of our method.
Dataset Description
Two datasets are used during the experiments, DILI and Tox-DILI1. DILI is the DILI dataset provided by NIH, which contains 479 molecules with DILI label. The original DILI dataset is coming from DILIrank11 dataset, which contains 197 molecules with Most-DILI-Concern, 282 molecules with No-DILI-concern, and 464 molecules with Less-DILI-Concern. We consider Most-DILI-Concern as label 1, and No-DILI-concern as label 0 to solve the classification problem. Thus, 479 molecules in total are selected to constitute DILI dataset. The Tox-DILI is formed by DILI and other four datasets with toxicity relevant properties: herg,32,33 PLD,28 ames,34,35 and mmp.36,37 The description of each property is stated in Table 3, and the label distribution is shown in Table 4.
Table 3:
Description of four toxicity properties used for augmentation.
| Category | Property | Description |
|---|---|---|
| Toxicity | herg32,33 | measures cardiotoxic effects of compounds. |
| PLD28 | stands for phospholipidosis, which measures organism-level toxicity of compounds. | |
| ames34,35 | measures mutagenicity, one of the most important end points of toxicity. | |
| mmp36,37 | The mitochondrial membrane potential (MMP) is a key parameter for evaluating mitochondrial function. |
Table 4:
Datasets statstics.
| Dataset | Dataset Size | Property | # Molecules | # Label 0 | # Label 1 |
|---|---|---|---|---|---|
| DILI | 479 | DILI | 479 | 282 | 197 |
|
| |||||
| Tox-DILI | 15,669 | herg | 3,024 | 2,541 | 483 |
| PLD | 4,159 | 3,777 | 382 | ||
| ames | 7,940 | 4,534 | 3,406 | ||
| mmp | 5,970 | 5,070 | 900 | ||
| DILI | 479 | 282 | 197 | ||
Comparison Experiments
Circular-fp.
Circular fingerprints (Circular-fp) is one of the traditional ways to generate a so-called fingerprints to represent the molecule. It is a vector representation that generated by a hand-crafted hash-based algorithm to define the local features. Circular-fp employs a fixed hash function to extract each layer’s features of a molecule and concatenate them together. The generated vector representations usually go through machine learning models to perform further predictions, we apply GradientBoost38 model here in the experiments.
Neural-fp.
Neural fingerprints (Neural-fp) is constructed on a supervised deep graph convolutional neural network.20 It applies convolutional neural networks on graphs directly. The difference between Neural-fp and Circular-fp is the replacement of the hash function. Neural-fp applies a non-linear activated densely connected layer to generate the fingerprints.
MPNN.
Another promising graph-based deep learning techniques is the Message Passing Neural Network24 (MPNN). It recursively updates the atom features by aggregating the feature information from its neighbors and adjacent bonds, then pools all updated features of the atoms to deliver the global representation of each molecule via a readout function. The generated representation is then fed into the downstream molecular property prediction network.
DMPNN.
Inspired by MPNN,24 DMPNN25 converts the passing process to bond-wise instead of atom-wise. Instead of aggregating the neighbor atoms’ messages, DMPNN proposes a directed message passing scheme to avoid unnecessary loop. It aggregates the information of neighbor bonds with same direction, and takes the starter atom features as attached features to implement message passing. The following network is used to predict the property label as well.
MV-GNNcross.
MV-GNNcross model extracts the atom messages and bond messages simultaneously. It considers atom message passing and bond message passing as two parallel streams, and allows the atom/bond messages to communicate during the passing phase. A self-attention readout mechanism and a disagreement loss are employed to restrain the model training.
MV-GNNcross with property augmentation.
The results of different models on DILI dataset empirically demonstrate MV-GNNcross has achieved the highest prediction accuracy. Considering the extremely limited availability of DILI data, we propose to involve more data in a property augmentation fashion to facilitate training the molecular representation. In this regard, we combine DILI with four more datasets with other toxicity labels to form Tox-DILIdataset, and apply MV-GNNcross model on it.
Additional experiments with property augmentation.
In order to further proof the effectiveness of proposed method, we conduct additional experiments on Tox-DILI dataset to compare the performance improvement from using DILI only. Since MPNN and DMPNN outperform circular-fp and neural-fp on DILI dataset, and both of them are graph-based message passing models, we then utilize them to assess the prediction performance of proposed property augmentation strategy.
Experimental Procedure
In order to thoroughly verify the superiority of proposed method and eliminate the randomness, we have conducted extensive experiments using three evaluation methods: 5-fold cross-validation with random splitting, 10-fold leave-one-out cross-validation, and 5-fold cross-validation with scaffold splitting. To make a fair comparison, we use the same dataset splits over DILI and Tox-DILI for all the models, repectively. For each cross-validation (CV) method, we first run all the models on DILI dataset, then apply property augmentation using MV-GNNcross on the Tox-DILI dataset to further boost the performance. Moreover, we take MPNN and DMPNN as backbones to implement property augmentation to confirm the effectiveness of our method. The pair-wise comparison between experiments w/o and w/ property augmentation are visualized with a p-value calculated through the Wilcoxon test.
Cross-validation with Random Splitting
We first apply 5-fold cross-validation with random seeds to evaluate the performance of each model. In each fold, the input dataset is randomly split into 8:1:1, while 80% is used for training, 10% is used for validation, and the last 10% is used for testing. For Tox-DILI, we ensure each data split contains balanced data for each property. We calculate the mean and standard deviation of the results from all folds as the final results.
Leave-one-out Cross-validation
Considering the randomness of dataset splits in the first evaluation method, we then apply the 10-fold leave-one-out cross-validation to evaluate the performance again. The input dataset is split into 10 folds equally, each fold has been used as the testing dataset in sequence. Within the remaining 9 folds, one fold is used as the validation dataset, and the rest are used for training. We take the average of the results from all folds as the final results too.
Cross-validation with Scaffold Splitting
Other than the two commonly used evaluation methods, we also conduct experiments with scaffold splitting, which is more practical and challenging than random splitting. Scaffold splitting splits the molecules with distinct two-dimensional structural frameworks into different subsets,39 which can be considered as a clustering process based on the molecular structure prior to the training process. We follow the process introduced in Yang et al..25 The molecules in the dataset are categorized into bins based on their Murcko scaffold, which are calculated by RDKit.27 The bins are then randomly put into train, validation and test dataset. We apply a 5 fold cross-validation here with 8:1:1 train/validation/test split too, and calculate the mean and standard deviation as the final results.
Results and Discussion
Other than the prediction accuracy, we also analysis the predicted labels with the ground truth labels in detail by computing the sensitivity, specificity, F-1 score, Matthews correlation coefficient (MCC) and ROC-AUC. All these evaluation criteria are important since we expect to find a model that can filter the drugs with potential DILI concern, as well as pick out the drugs without DILI risks, thus further experiments can be conducted on these approved drug candidates.
Cross-validation with Random Splitting
The prediction performance of cross-validation with random splitting are shown in Table 5, and visualized in Figure 6. As observed, graph-based message passing models generally perform better than other baselines on DILI dataset. Meanwhile, MV-GNNcross model outperforms other message passing methods, as well as equips with smaller various. The augmentation strategy that combines more data with other properties precisely improve the performance of DILI to 81.4%, which empirically proves that involving more property data to co-train the model indeed brings more information. In this fashion, MV-GNNcross model gains the accuracy boost by 2.6% compared with the vanilla MV-GNNcross. The p-values obtained from the Wilcoxon test may not be sufficiently small for some baselines considering the difficulty and challenge for DILI prediction problem, yet we believe our proposed method has accomplished remarkable improvement.
Table 5:
The performance of DILI models using cross-validation with random splitting (higher is better). Best score is marked as bold.
| Circular-fp | Neural-fp | MPNN | DMPNN | MV-GNNcross | Property Augmentation with Tox-DILI | |
|---|---|---|---|---|---|---|
| Accuracy | 0.688±0.051 | 0.704±0.091 | 0.738±0.094 | 0.750±0.098 | 0.788±0.077 | 0.814 ±0.047 |
| Sensitivity | 0.364±0.125 | 0.647±0.091 | 0.727±0.133 | 0.728±0.135 | 0.762±0.105 | 0.768 ±0.100 |
| Specificity | 0.879 ±0.086 | 0.740±0.087 | 0.752±0.129 | 0.764±0.172 | 0.809±0.092 | 0.849±0.097 |
| F1-score | 0.485±0.091 | 0.615±0.106 | 0.666±0.124 | 0.681±0.095 | 0.721±0.105 | 0.753 ±0.063 |
| MCC | 0.289±0.130 | 0.381±0.191 | 0.473±0.202 | 0.499±0.179 | 0.562±0.178 | 0.621 ±0.114 |
| ROC-AUC | 0.738±0.056 | 0.753±0.093 | 0.833±0.075 | 0.832±0.068 | 0.866±0.055 | 0.882 ±0.031 |
Figure 6:
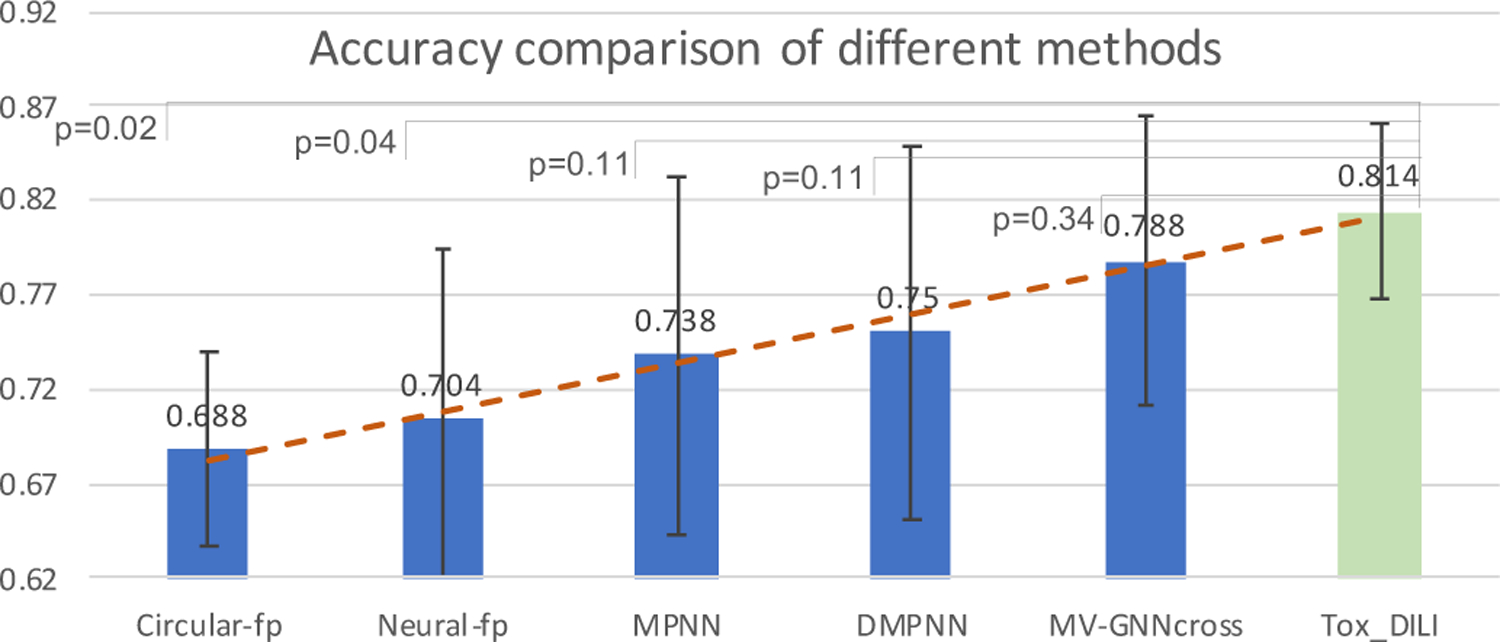
Performance comparison on accuracy of different methods using cross-validation with random splitting (higher is better). Light green color indicates our proposed method. P indicates the p-value calculated from the Wilcoxon test between our proposed method and other baselines.
As our goal is to identify drugs that might cause DILI, and sort out drugs without DILI, a model with high scores of all the evaluation metric, as well as a balanced sensitivity/specificity would be more helpful. As shown in Table 5, Circular-fp has a very high specificity but extremely low sensitivity, so it is more likely to identify drugs without DILI as positive. The lowest MCC verifies that it cannot achieve a balanced prediction over positive and negative labels. All the criteria values of Neural-fp are not significant. MPNN and DMPNN has almost equal sensitivity and specificity scores, but the overall accuracy, F1-score and MCC are not notably high. The accuracy, sensitivity, F1-score, and MCC of MV-GNNcross are higher than other baselines on DILI dataset. The specificity score is slightly lower than Circular-fp, but is still competitive. MV-GNNcross utilizing property augmentation strategy has obtained the highest accuracy score which is 81.4%. The specificity score is fairly high as 0.849, and a sensitivity score of 0.768 is also the highest compared with other baselines. The comparisons of F1-score and MCC confirm that our MV-GNNcross model with property augmentation significantly perform better than other models on DILI prediction task.
We also conduct additional experiments with our method utilizing MPNN and DMPNN, where the performance is compared in Table 6 in a pair-wise manner (DILI vs. Tox-DILI). The accuracy improvement is visualized in Figure 6, and the ROC-AUC is plot in Figure 10. We can observe that models with proposed property augmentation almost outperform the other one over all evaluation criteria.
Table 6:
The performance comparison between w/o Property Augmentation (DILI) and w/ Property Augmentation (Tox-DILI) using cross-validation with random splitting. Higher score within each pair-wise comparison is marked as bold.
| MPNN (DILI) | MPNN (Tox-DILI) | DMPNN (DILI) | DMPNN (Tox-DILI) | MV-GNNcross(DILI) | MV-GNNcross(Tox-DILI) | |
|---|---|---|---|---|---|---|
| Accuracy | 0.738±0.094 | 0.788 ±0.044 | 0.750±0.098 | 0.785 ±0.024 | 0.788±0.077 | 0.814 ±0.047 |
| Sensitivity | 0.727±0.133 | 0.761 ±0.072 | 0.728±0.135 | 0.748 ±0.091 | 0.762±0.105 | 0.768 ±0.100 |
| Specificity | 0.752±0.129 | 0.807 ±0.070 | 0.764±0.172 | 0.812 ±0.045 | 0.809±0.092 | 0.849 ±0.097 |
| F1-score | 0.666±0.124 | 0.728 ±0.045 | 0.764 ±0.172 | 0.718±0.045 | 0.721±0.105 | 0.753 ±0.063 |
| MCC | 0.473±0.202 | 0.562 ±0.082 | 0.499±0.179 | 0.553 ±0.060 | 0.562±0.178 | 0.621 ±0.114 |
Figure 10:
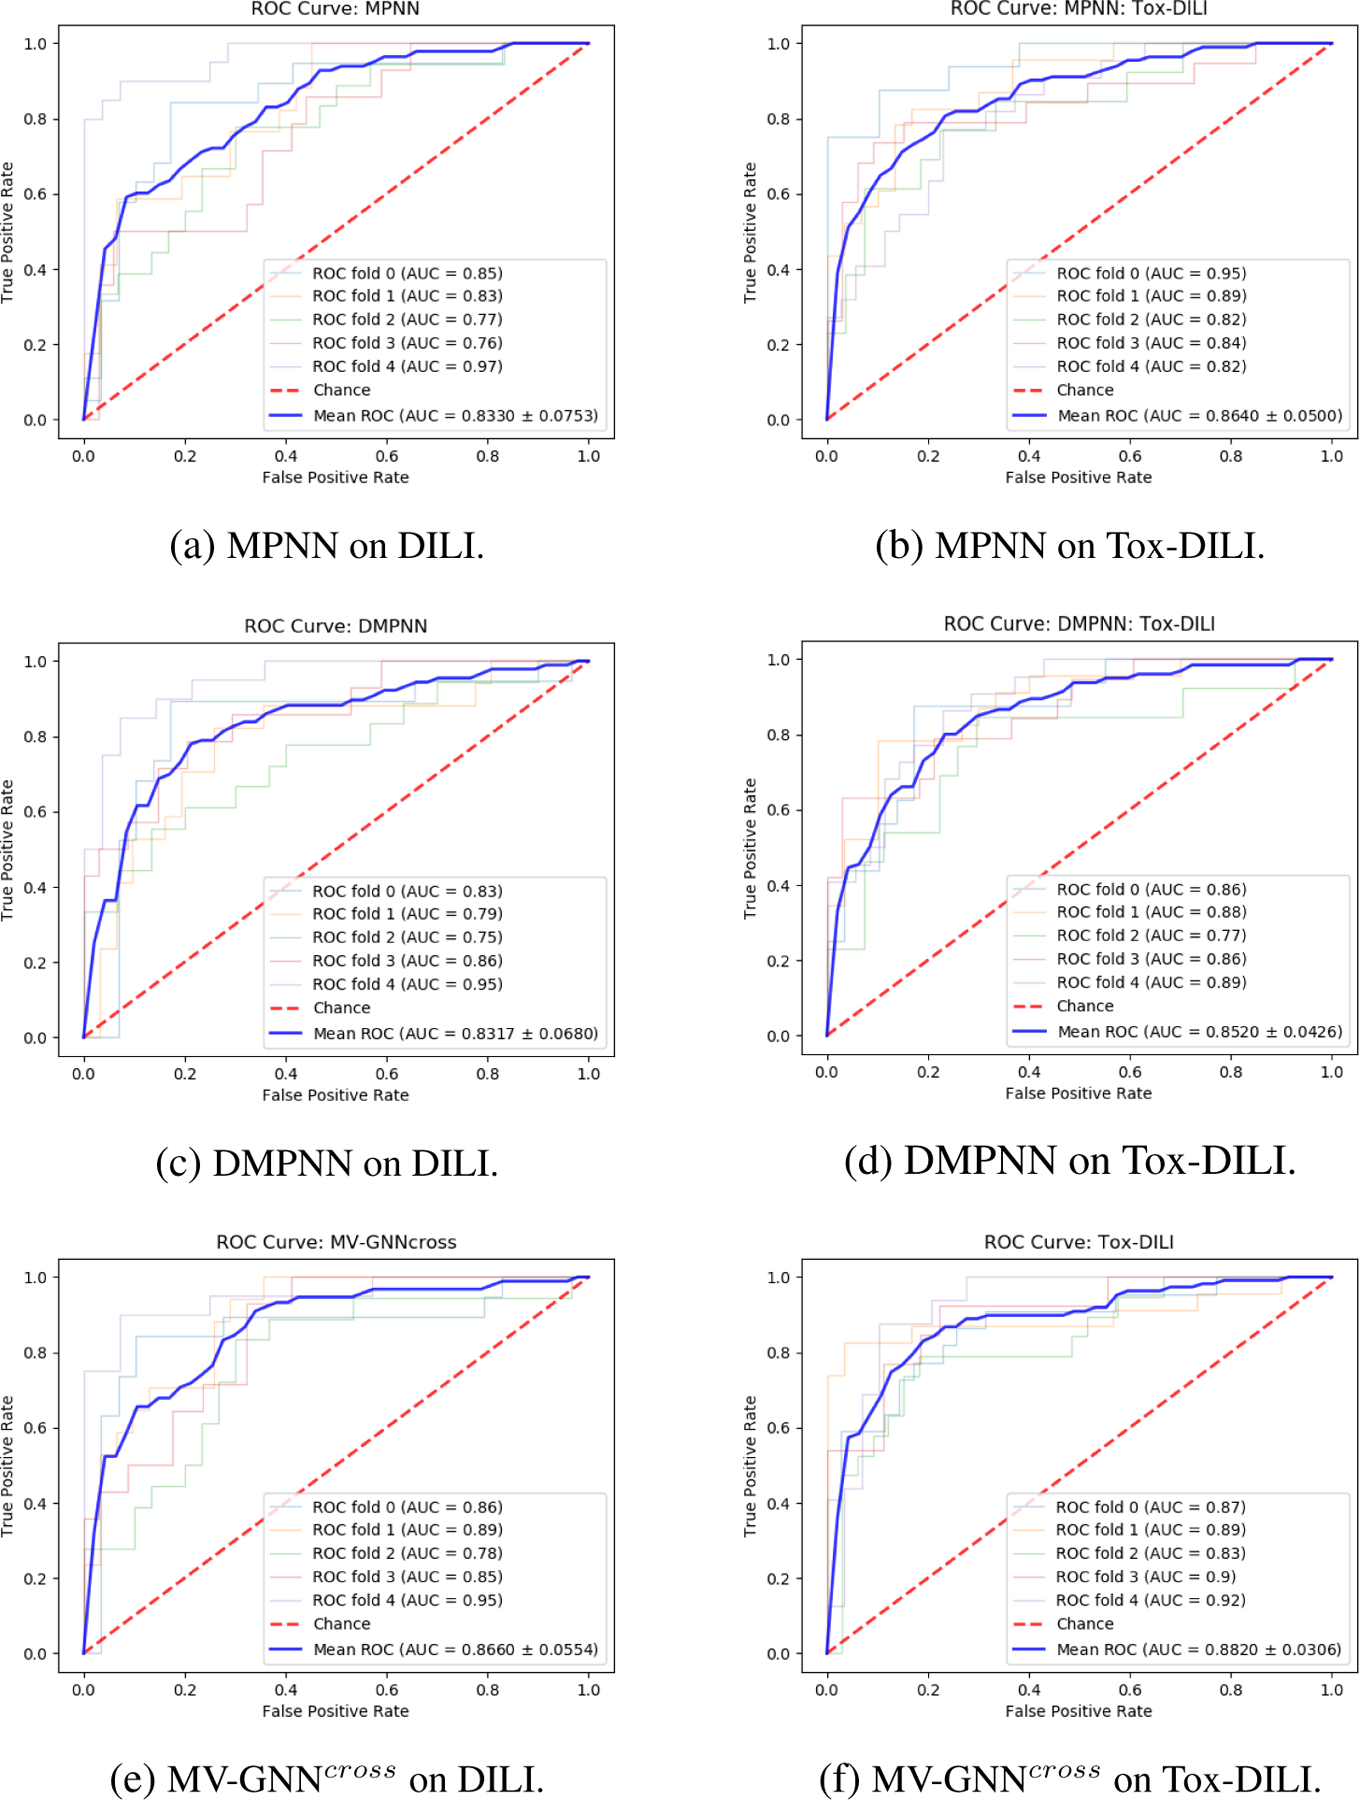
Cross-validation with random splitting. ROC Curve comparison (larger AUC is better) between w/o Property Augmentation (DILI) and w/ Property Augmentation (Tox-DILI). The lighter lines demonstrate the performance of each fold, and the blue line represents the mean AUC for each method.
We can observe the performance comparison between each model based on Figure 10. Figure 10 visualizes the ROC-AUC for each model. As we know, the larger area under the curve (AUC) represents better model performance. When the inflection point is close to the left top corner, the AUC is approximate to 1. Figure 10f illustrates that MV-GNNcross on Tox-DILI outperforms other models.
Leave-one-out Cross-validation
To eliminate the randomness of splitting method, we use 10-fold leave-one-out cross-validation to re-run all the experiments. The performance is shown in Table 7 and Table 8. The results follow the similar trend as obtained using cross-validation with random splitting. MV-GNNcross with property augmentation learning performs best over all evaluation criteria except the specificity, where Circular-fp obtains highest value. However, the other performance results such as sensitivity, MCC and F1-score indicate that the prediction results of Circular-fp is extremely unbalanced. The accuracy and ROC-AUC visualization between w/o and w/ property augmentation on MPNN, DMPNN and MV-GNNcross, which are shown in Figure 8 and Figure 11, further proof the superiority of proposed method. As shown in Figure 8, the p-value calculated from MV-GNNcross w/o and w/ property augmentation is less than 0.01, which can be considered as statistical significant. The prediction results with leave-one-out cross-validation confirm that our method is capable for improving the prediction performance of DILI.
Table 7:
The performance of DILI models (higher is better) using leave-one-out cross-validation. Best score is marked as bold.
| Circular-fp | Neural-fp | MPNN | DMPNN | MV-GNNcross | Property Augmentation with Tox-DILI | |
|---|---|---|---|---|---|---|
| Accuracy | 0.668±0.085 | 0.683±0.063 | 0.706±0.057 | 0.715±0.059 | 0.728±0.047 | 0.787 ±0.070 |
| Sensitivity | 0.351±0.171 | 0.595±0.089 | 0.590±0.141 | 0.617±0.140 | 0.651±0.121 | 0.721 ±0.106 |
| Specificity | 0.899 ±0.063 | 0.757±0.081 | 0.798±0.115 | 0.803±0.107 | 0.791±0.087 | 0.837±0.062 |
| F1-score | 0.447±0.175 | 0.604±0.064 | 0.614±0.078 | 0.631±0.086 | 0.655±0.076 | 0.731 ±0.076 |
| MCC | 0.294±0.120 | 0.353±0.118 | 0.406±0.114 | 0.432±0.113 | 0.448±0.099 | 0.558 ±0.131 |
| ROC-AUC | 0.775±0.069 | 0.734±0.035 | 0.789±0.072 | 0.792±0.051 | 0.797±0.039 | 0.840 ±0.064 |
Table 8:
The performance comparison between w/o Property Augmentation (DILI) and w/ Property Augmentation (Tox-DILI) using leave-one-out cross-validation. Higher score within each pair-wise comparison is marked as bold.
| MPNN (DILI) | MPNN (Tox-DILI) | DMPNN (DILI) | DMPNN (Tox-DILI) | MV-GNNcross(DILI) | MV-GNNcross(Tox-DILI) | |
|---|---|---|---|---|---|---|
| Accuracy | 0.706±0.057 | 0.736 ±0.074 | 0.715±0.059 | 0.748 ±0.064 | 0.728±0.047 | 0.787 ±0.070 |
| Sensitivity | 0.590±0.141 | 0.625 ±0.104 | 0.617±0.140 | 0.632 ±0.099 | 0.651±0.121 | 0.721 ±0.106 |
| Specificity | 0.798±0.115 | 0.820 ±0.117 | 0.803±0.107 | 0.817 ±0.079 | 0.791±0.087 | 0.837 ±0.062 |
| F1-score | 0.614±0.078 | 0.655 ±0.090 | 0.631±0.086 | 0.657 ±0.095 | 0.655±0.076 | 0.731 ±0.076 |
| MCC | 0.406±0.114 | 0.456 ±0.148 | 0.432±0.113 | 0.454 ±0.135 | 0.448±0.099 | 0.558 ±0.131 |
| ROC-AUC | 0.789±0.072 | 0.813 ±0.070 | 0.792±0.051 | 0.806 ±0.067 | 0.797±0.039 | 0.840 ±0.064 |
Figure 8:
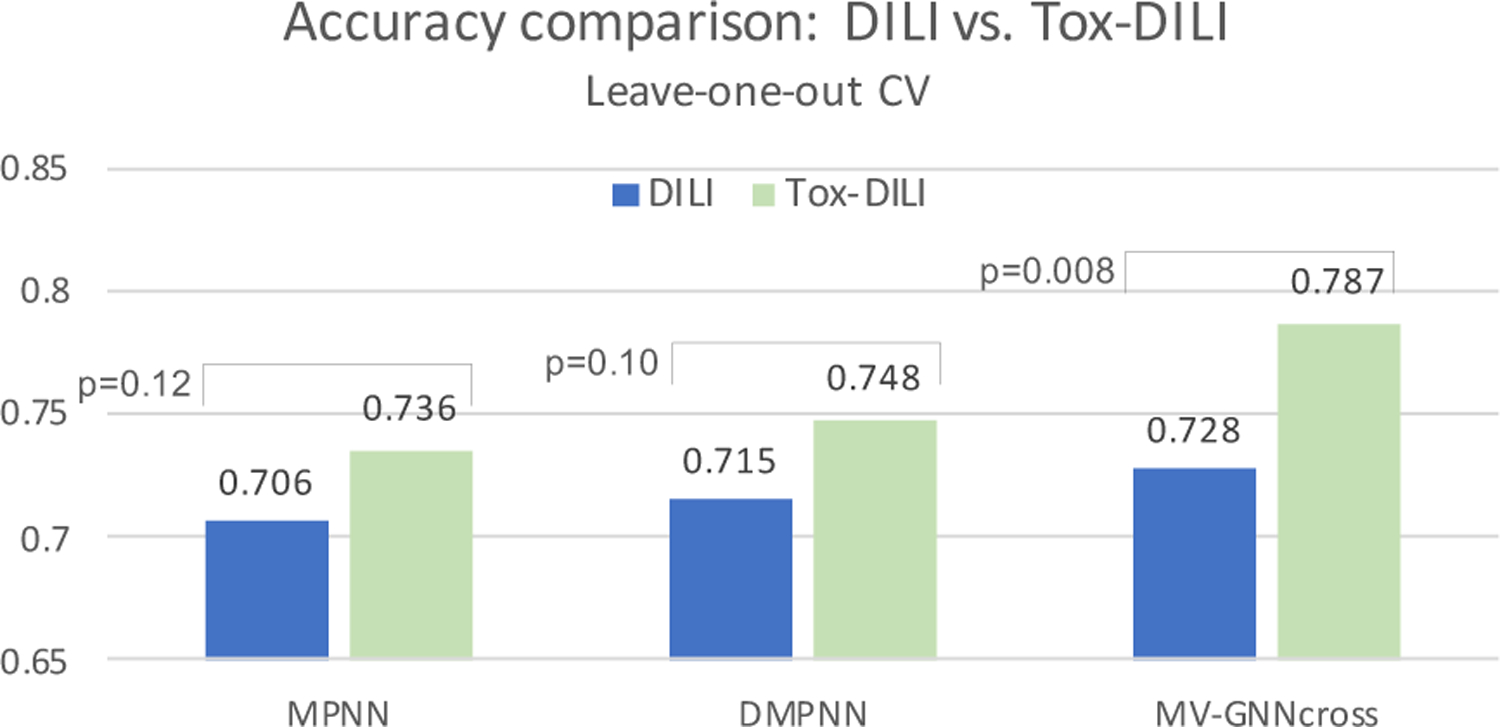
Leave-one-out cross-validation. Visualization from Table 8. DILI indicates baseline, and Tox-DILI demonstrates the performance of utilizing property augmentation. P-value is calculated between the two prediction results for each model.
Figure 11:
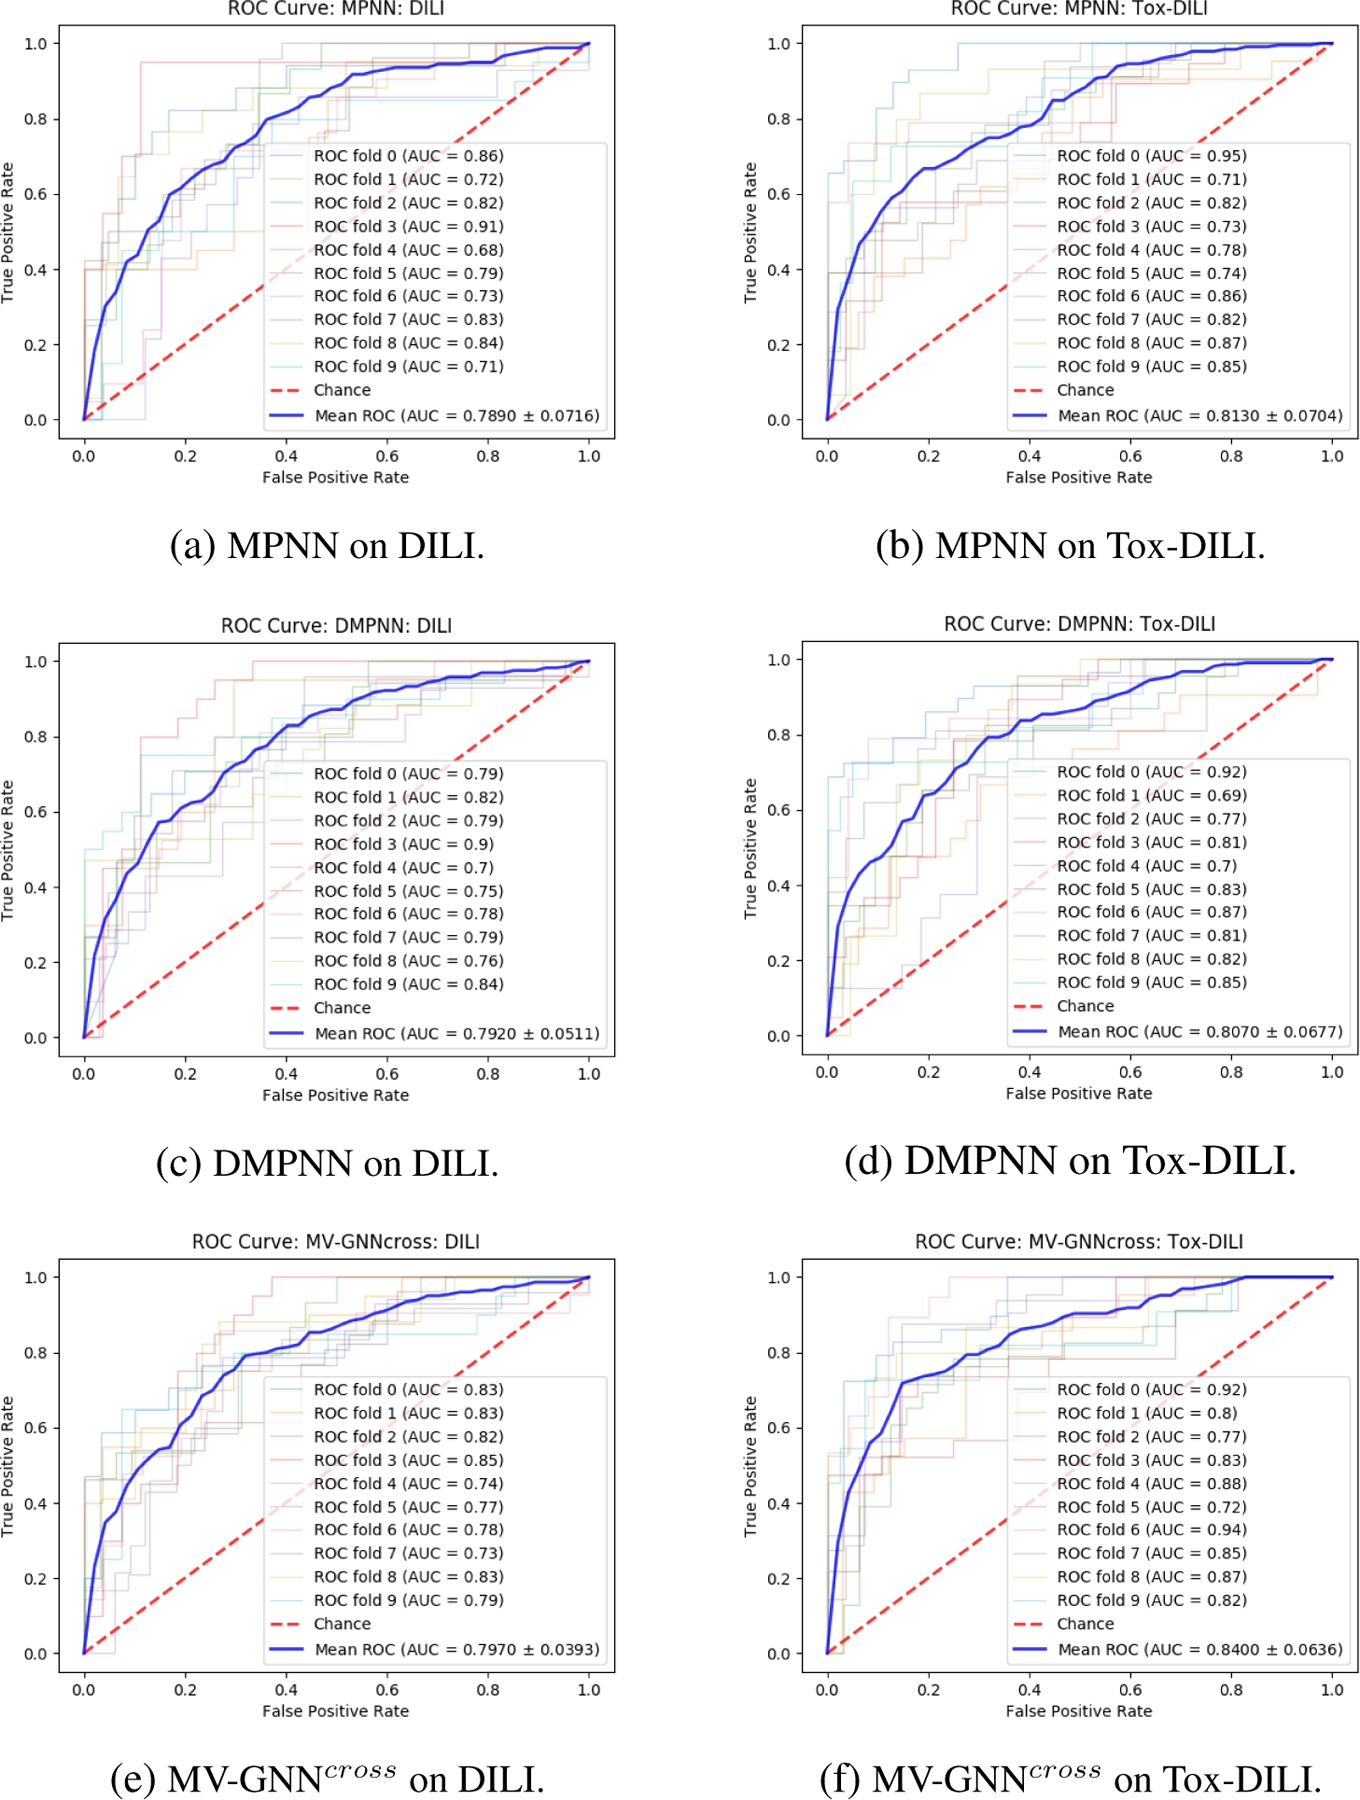
Leave-one-out cross-validation. ROC Curve comparison (larger AUC is better) between w/o Property Augmentation (DILI) and w/ Property Augmentation (Tox-DILI). The lighter lines demonstrate the performance of each fold, and the blue line represents the mean AUC for each method.
Cross-validation with Scaffold Splitting
Last, we challenge the most difficult but practical scenario by conducting experiments using scaffold splitting. The results are recorded in Table 9 and Table 10, while the accuracy and ROC-AUC are visualized in Figure 9 and Figure 12. The accuracy scores have dropped compared with random splitting, which is reasonable considering the strict splitting. However, other criteria such as F1-score and MCC do not vary much, and the general trending is still similar with the performance obtained from the other two evaluation methods. MV-GNNcross with property augmentation learning outperforms all other methods, including MPNN and DMPNN with property augmentation, which effectively illustrates the superiority of proposed method.
Table 9:
The performance of DILI models (higher is better) using cross-validation with scaffold splitting. Best score is marked as bold.
| Circular-fp | Neural-fp | MPNN | DMPNN | MV-GNNcross | Property Augmentation with Tox-DILI | |
|---|---|---|---|---|---|---|
| Accuracy | 0.657±0.037 | 0.665±0.048 | 0.706±0.010 | 0.714±0.043 | 0.735±0.045 | 0.765 ±0.047 |
| Sensitivity | 0.485±0.074 | 0.642±0.066 | 0.695±0.098 | 0.693±0.082 | 0.684±0.094 | 0.765 ±0.090 |
| Specificity | 0.784 ±0.073 | 0.688±0.082 | 0.708±0.066 | 0.724±0.062 | 0.765±0.099 | 0.774±0.046 |
| F1-score | 0.533±0.049 | 0.609±0.062 | 0.653±0.052 | 0.660±0.070 | 0.674±0.060 | 0.740 ±0.036 |
| MCC | 0.284±0.086 | 0.328±0.103 | 0.402±0.027 | 0.415±0.090 | 0.458±0.087 | 0.534 ±0.089 |
| ROC-AUC | 0.719±0.028 | 0.744±0.051 | 0.758±0.025 | 0.782±0.040 | 0.774±0.042 | 0.834 ±0.022 |
Table 10:
The performance comparison between w/o Property Augmentation (DILI) and w/ Property Augmentation (Tox-DILI) using cross-validation with scaffold splitting. Higher score within each pair-wise comparison is marked as bold.
| MPNN (DILI) | MPNN (Tox-DILI) | DMPNN (DILI) | DMPNN (Tox-DILI) | MV-GNNcross(DILI) | MV-GNNcross(Tox-DILI) | |
|---|---|---|---|---|---|---|
| Accuracy | 0.706±0.010 | 0.727 ±0.030 | 0.714±0.043 | 0.741 ±0.040 | 0.735±0.045 | 0.765 ±0.047 |
| Sensitivity | 0.695±0.098 | 0.727 ±0.102 | 0.693±0.082 | 0.801 ±0.073 | 0.684±0.094 | 0.765 ±0.090 |
| Specificity | 0.708±0.066 | 0.716 ±0.108 | 0.724 ±0.062 | 0.669±0.110 | 0.765±0.099 | 0.774 ±0.046 |
| F1-score | 0.653±0.052 | 0.717 ±0.049 | 0.660±0.070 | 0.748 ±0.052 | 0.674±0.060 | 0.740 ±0.036 |
| MCC | 0.402±0.027 | 0.452 ±0.064 | 0.415±0.090 | 0.482 ±0.082 | 0.458±0.087 | 0.534 ±0.089 |
| ROC-AUC | 0.758±0.025 | 0.796 ±0.052 | 0.782±0.040 | 0.814 ±0.072 | 0.774±0.042 | 0.834 ±0.022 |
Figure 9:
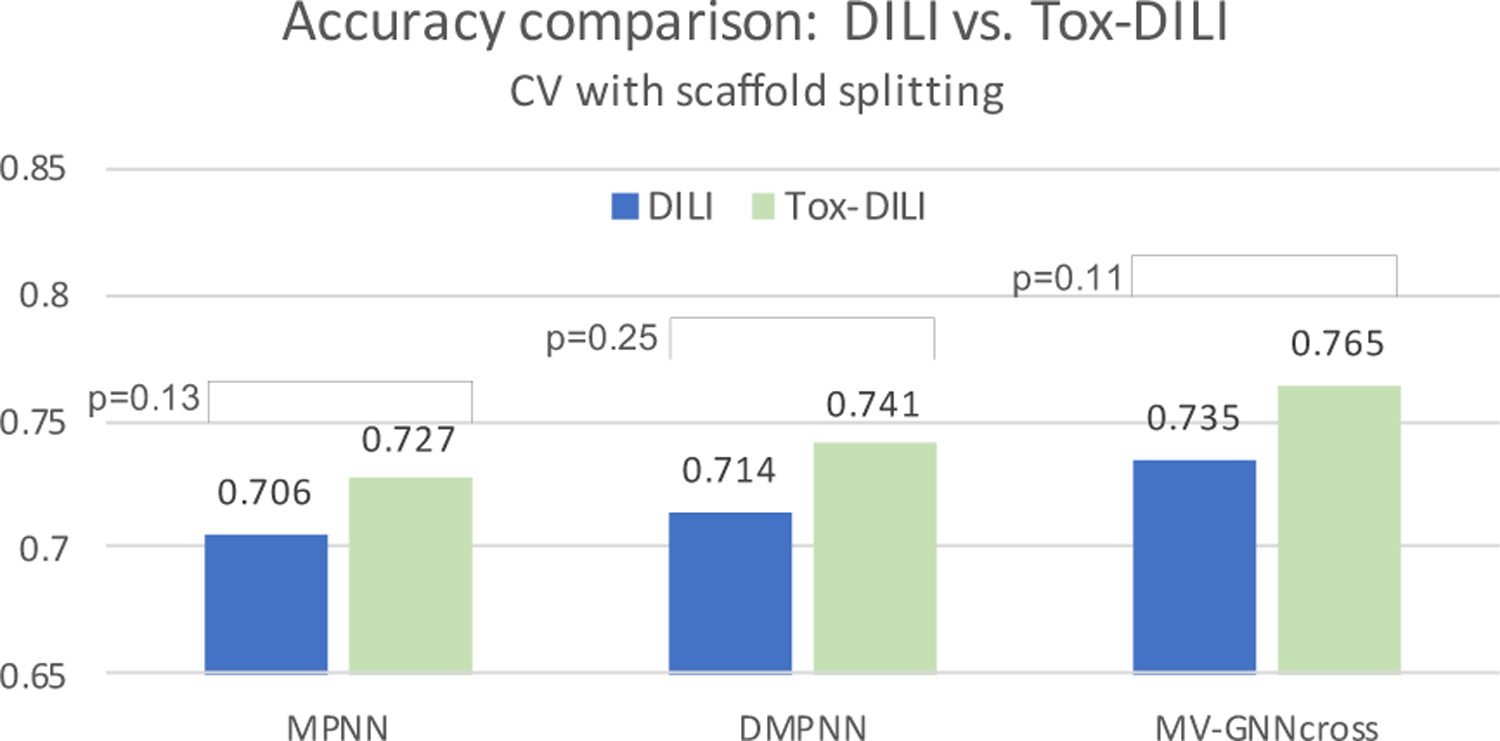
Cross-validation with scaffold splitting. Visualization from Table 10. DILI indicates baseline, and Tox-DILI demonstrates the performance of utilizing property augmentation. P-value is calculated between the two prediction results for each model.
Figure 12:
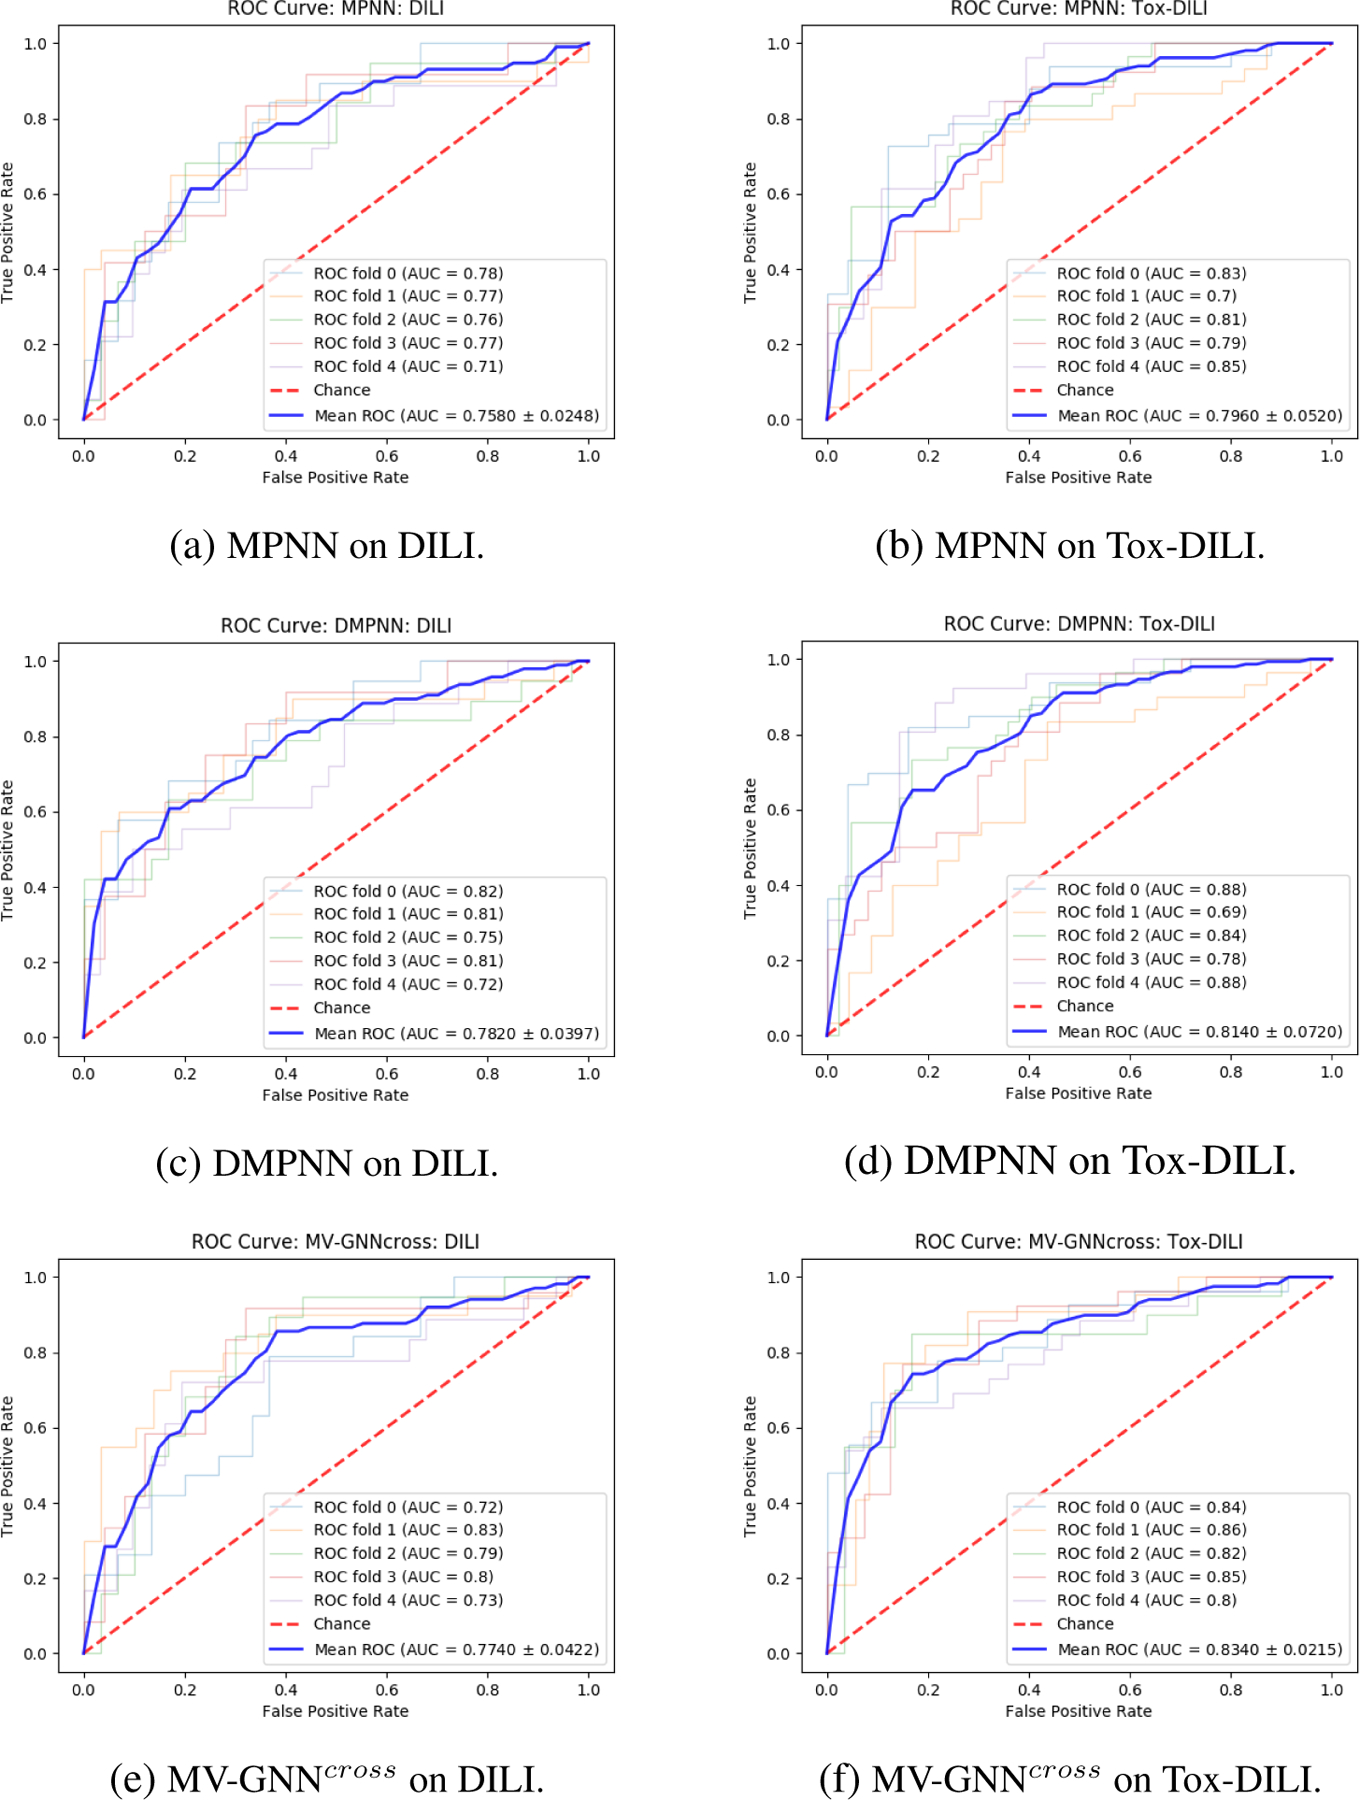
Cross-validation with scaffold splitting. ROC Curve comparison (larger AUC is better) between w/o Property Augmentation (DILI) and w/ Property Augmentation (Tox-DILI). The lighter lines demonstrate the performance of each fold, and the blue line represents the mean AUC for each method.
In addition to extensive experiments, several studies have investigated different methods to tackle DILI prediction problem in years. Recent two work, Ancuceanu et al. and Minerali et al. also seek for appropriate approaches to enhance the prediction performance of DILIrank. Minerali et al. utilizes Bayesian model to obtain an ROC-AUC of 0.814, a sensitivity of 0.741, a specificity of 0.755, and an accuracy of 0.746. The sensitivity/specificity is nearly perfectly balanced which denotes the model holds stabilized expressive power, but the ROC-AUC and accuracy are not remarkable compared with deep graph-based models. Ancuceanu et al. explores different features selection and various machine learning algorithms to build meta-models. Some models have achieved up to 95% sensitivity but low specificity around 50%, some models have reletively balanced sensitivity/specificity (e.g., 76%/73.2%), yet the accuracy is less than 0.75%. Ergo, it is empirically demonstrated the superior of our deep graph-based model along with property augmentation strategy.
Conclusions
Enhancing the prediction performance of DILI is crucial for drug development. Current studies generally focus on either bringing in more features, or stacking multiple models, or enlarging the dataset. These attempts have attained impressive achievements. In spite of that, we notice that certain properties of the drugs might contain hidden correlation between each other. Hence, we propose to establish a property augmentation approach to include more information to boost the training. Extensive experiments on Tox-DILIconfirm the superior of our method by improving the accuracy to 81.4% using cross-validation with random splitting, 78.7% using leave-one-out cross-validation, and 76.5% with cross-validation with scaffold splitting. Proposed method not only brings in more input data for the encoder network to learn better molecular vector representation, but also utilizes the correlations between different property labels during the prediction network. We believe it to be a promising perspective to improve the prediction performance of DILI, as well as other properties with limited available data.
Supplementary Material
Figure 4:

Message passing aggregation phase. Taking atom 4 as an example, atom 3 and atom 5 are its neighbors. In the passing process, the message of atom 3 and atom 5 from previous passing step will be aggregated to atom 4. For the message construction, we take atom 3 as an example. The message of atom 3 is concatenated by the initial atom features of atom 3, as well as the initial bond features µ34 of the connected bond 34.
Figure 7:
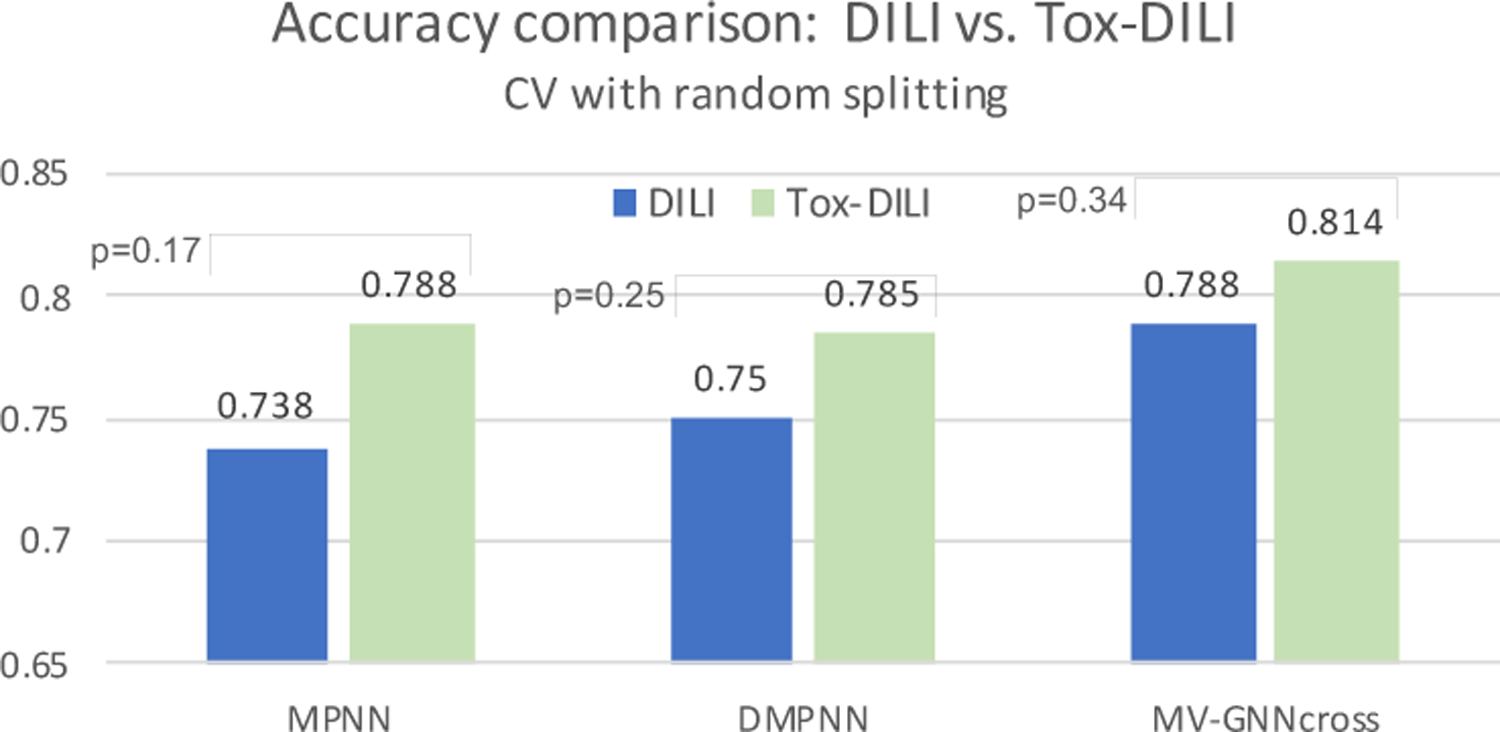
Cross-validation with random splitting. Visualization from Table 6. DILI indicates baseline, and Tox-DILI demonstrates the performance of utilizing property augmentation. P-value is calculated between the two prediction results for each model.
Acknowledgments
This work was partially supported by US National Science Foundation IIS-1718853, the CAREER grant IIS-1553687 and Cancer Prevention and Research Institute of Texas (CPRIT) award (RP190107).
Footnotes
Supporting Information
DILI.xlsx, dataset used for experiments w/o property augmentation learning; Tox-DILI.xlsx, dataset used for experiments w/ property augmentation. Data format, the SMILES representation of the molecule along with the corresponding property label; labels not observed are displayed as missing values.
Refer to supporting information.
References
- (1).Paul SM; Mytelka DS; Dunwiddie CT; Persinger CC; Munos BH; Lindborg SR; Schacht AL How to improve R&D productivity: the pharmaceutical industry’s grand challenge. Nature reviews Drug discovery 2010, 9, 203–214. [DOI] [PubMed] [Google Scholar]
- (2).DiMasi JA; Grabowski HG; Hansen RW The cost of drug development. New England Journal of Medicine 2015, 372. [DOI] [PubMed] [Google Scholar]
- (3).Berggren R; Møller M; Moss R; Poda P; Smietana K Outlook for the next 5 years in drug innovation. Nature reviews Drug discovery 2012, 11, 435–436. [DOI] [PubMed] [Google Scholar]
- (4).Thakkar S; Li T; Liu Z; Wu L; Roberts R; Tong W Drug-induced liver injury severity and toxicity (DILIst): Binary classification of 1279 drugs by human hepatotoxicity. Drug discovery today 2020, 25, 201–208. [DOI] [PubMed] [Google Scholar]
- (5).Parasrampuria DA; Benet LZ; Sharma A Why drugs fail in late stages of development: case study analyses from the last decade and recommendations. The AAPS Journal 2018, 20, 46. [DOI] [PubMed] [Google Scholar]
- (6).Kullak-Ublick GA; Andrade RJ; Merz M; End P; Benesic A; Gerbes AL; Aithal GP Drug-induced liver injury: recent advances in diagnosis and risk assessment. Gut 2017, 66, 1154–1164. [DOI] [PMC free article] [PubMed] [Google Scholar]
- (7).Greene N; Fisk L; Naven RT; Note RR; Patel ML; Pelletier DJ Developing Structure-Activity Relationships for the Prediction of Hepatotoxicity. Chemical Research in Toxicology 2010, 23, 1215–1222. [DOI] [PubMed] [Google Scholar]
- (8).Zhu X; Kruhlak NL Construction and analysis of a human hepatotoxicity database suitable for QSAR modeling using post-market safety data. Toxicology 2014, 321, 62–72. [DOI] [PubMed] [Google Scholar]
- (9).Xu JJ; Henstock PV; Dunn MC; Smith AR; Chabot JR; de Graaf D Cellular Imaging Predictions of Clinical Drug-Induced Liver Injury. Toxicological Sciences 2008, 105, 97–105. [DOI] [PubMed] [Google Scholar]
- (10).Sakatis MZ; Reese MJ; Harrell AW; Taylor MA; Baines IA; Chen L; Bloomer JC; Yang EY; Ellens HM; Ambroso JL; Lovatt CA; Aryton AD; Clarke SE Preclinical Strategy to Reduce Clinical Hepatotoxicity Using in Vitro Bioactivation Data for >200 Compounds. Chemical Research in Toxicology 2012, 25, 2067–2082. [DOI] [PubMed] [Google Scholar]
- (11).Chen M; Suzuki A; Thakkar S; Yu K; Hu C; Tong W DILIrank: the largest reference drug list ranked by the risk for developing drug-induced liver injury in humans. Drug Discovery Today 2016, 21, 648–653. [DOI] [PubMed] [Google Scholar]
- (12).Chen M; Vijay V; Shi Q; Liu Z; Fang H; Tong W FDA-approved drug labeling for the study of drug-induced liver injury. Drug Discovery Today 2011, 16, 697–703. [DOI] [PubMed] [Google Scholar]
- (13).Minerali E; Foil DH; Zorn KM; Lane TR; Ekins S Comparing Machine Learning Algorithms for Predicting Drug-Induced Liver Injury (DILI). Molecular Pharmaceutics 2020, 17, 2628–2637. [DOI] [PMC free article] [PubMed] [Google Scholar]
- (14).Aleo MD; Shah F; Allen S; Barton HA; Costales C; Lazzaro S; Leung L; Nilson A; Obach RS; Rodrigues AD; Will Y Moving beyond Binary Predictions of Human Drug-Induced Liver Injury (DILI) toward Contrasting Relative Risk Potential. Chemical Research in Toxicology 2020, 33, 223–238. [DOI] [PubMed] [Google Scholar]
- (15).Mora JR; Marrero-Ponce Y; García-Jacas CR; Suarez Causado A Ensemble Models Based on QuBiLS-MAS Features and Shallow Learning for the Prediction of Drug-Induced Liver Toxicity: Improving Deep Learning and Traditional Approaches. Chemical Research in Toxicology 2020, 33, 1855–1873. [DOI] [PubMed] [Google Scholar]
- (16).Ancuceanu R; Hovanet MV; Anghel AI; Furtunescu F; Neagu M; Constantin C; Dinu M Computational Models Using Multiple Machine Learning Algorithms for Predicting Drug Hepatotoxicity with the DILIrank Dataset. International Journal of Molecular Sciences 2020, 21, 2114. [DOI] [PMC free article] [PubMed] [Google Scholar]
- (17).Morgan HL The generation of a unique machine description for chemical structures-a technique developed at chemical abstracts service. Journal of Chemical Documentation 1965, 5, 107–113. [Google Scholar]
- (18).O’Boyle NM; Campbell CM; Hutchison GR Computational Design and Selection of Optimal Organic Photovoltaic Materials. The Journal of Physical Chemistry C 2011, 115, 16200–16210. [Google Scholar]
- (19).Rogers D; Hahn M Extended-Connectivity Fingerprints. Journal of Chemical Information and Modeling 2010, 50, 742–754. [DOI] [PubMed] [Google Scholar]
- (20).Duvenaud DK; Maclaurin D; Iparraguirre J; Bombarell R; Hirzel T; AspuruGuzik A; Adams RP Convolutional Networks on Graphs for Learning Molecular Fingerprints. Advances in Neural Information Processing Systems. 2015; pp 2224–2232. [Google Scholar]
- (21).Le T; Winter R; Noe F; Clevert D-A Neuraldecipher - Reverse-Engineering ECFP Fingerprints to Their Molecular Structures 2020, [DOI] [PMC free article] [PubMed] [Google Scholar]
- (22).Wu Z; Ramsundar B; Feinberg EN; Gomes J; Geniesse C; Pappu AS; Leswing K; Pande V MoleculeNet: a benchmark for molecular machine learning. Chemical Science 2018, 9, 513–530. [DOI] [PMC free article] [PubMed] [Google Scholar]
- (23).Li R; Wang S; Zhu F; Huang J Adaptive Graph Convolutional Neural Networks. Thirty-second AAAI conference on artificial intelligence 2018; pp 3546–3553. [Google Scholar]
- (24).Gilmer J; Schoenholz SS; Riley PF; Vinyals O; Dahl GE Neural Message Passing for Quantum Chemistry Proceedings of the 34th International Conference on Machine Learning. 2017; pp 1263–1272. [Google Scholar]
- (25).Yang K; Swanson K; Jin W; Coley C; Eiden P; Gao H; Guzman-Perez A; Hopper T; Kelley B; Mathea M; Palmer A; Settels V; Jaakkola T; Jensen K; Barzilay R Analyzing Learned Molecular Representations for Property Prediction. Journal of Chemical Information and Modeling 2019, 59, 3370–3388. [DOI] [PMC free article] [PubMed] [Google Scholar]
- (26).Ma H; Rong Y; Huang W; Xu T; Xie W; Ye G; Huang J Multi-View Graph Neural Networks for Molecular Property Prediction. arXiv preprint arXiv:2005.13607 2020, [Google Scholar]
- (27).Landrum G RDKit: Open-source cheminformatics 2006,
- (28).Shahane SA; Huang R; Gerhold D; Baxa U; Austin CP; Xia M Detection of Phospholipidosis Induction: A Cell-Based Assay in High-Throughput and High-Content Format. Journal of Biomolecular Screening 2014, 19, 66–76. [DOI] [PMC free article] [PubMed] [Google Scholar]
- (29).Sun S A survey of multi-view machine learning. Neural Computing and Applications 2013, 23, 2031–2038. [Google Scholar]
- (30).Veličković P; Cucurull G; Casanova A; Romero A; Liò P; Bengio Y Graph Attention Networks. International Conference on Learning Representations 2018. [Google Scholar]
- (31).Li J; Rong Y; Cheng H; Meng H; Huang W; Huang J Semi-Supervised Graph Classification: A Hierarchical Graph Perspective The World Wide Web Conference. 2019; pp 972–982. [Google Scholar]
- (32).Sun H; Xia M; Shahane SA; Jadhav A; Austin CP; Huang R Are hERG channel blockers also phospholipidosis inducers? Bioorganic & Medicinal Chemistry Letters 2013, 23, 4587–4590. [DOI] [PMC free article] [PubMed] [Google Scholar]
- (33).Xia M; Shahane SA; Huang R; Titus SA; Shum E; Zhao Y; Southall N; Zheng W; Witt KL; Tice RR; Austin CP Identification of quaternary ammonium compounds as potent inhibitors of hERG potassium channels. Toxicology and Applied Pharmacology 2011, 252, 250–258. [DOI] [PMC free article] [PubMed] [Google Scholar]
- (34).Kazius J; McGuire R; Bursi R Derivation and Validation of Toxicophores for Mutagenicity Prediction. Journal of Medicinal Chemistry 2005, 48, 312–320. [DOI] [PubMed] [Google Scholar]
- (35).Hansen K; Mika S; Schroeter T; Sutter A; Ter Laak A; Steger-Hartmann T; Heinrich N; Mu-ller K-R Benchmark Data Set for in Silico Prediction of Ames Mutagenicity. Journal of Chemical Information and Modeling 2009, 49, 2077–2081. [DOI] [PubMed] [Google Scholar]
- (36).Attene-Ramos MS; Huang R; Michael S; Witt KL; Richard A; Tice RR; Simeonov A; Austin CP; Xia M Profiling of the Tox21 Chemical Collection for Mitochondrial Function to Identify Compounds that Acutely Decrease Mitochondrial Membrane Potential. Environmental Health Perspectives 2015, 123, 49–56. [DOI] [PMC free article] [PubMed] [Google Scholar]
- (37).Attene-Ramos MS; Huang R; Sakamuru S; Witt KL; Beeson GC; Shou L; Schnellmann RG; Beeson CC; Tice RR; Austin CP; Xia M Systematic Study of Mitochondrial Toxicity of Environmental Chemicals Using Quantitative High Throughput Screening. Chemical Research in Toxicology 2013, 26, 1323–1332. [DOI] [PMC free article] [PubMed] [Google Scholar]
- (38).Friedman JH Greedy Function Approximation: A Gradient Boosting Machine. The Annals of Statistics 2001, 29, 1189–1232. [Google Scholar]
- (39).Bemis GW; Murcko MA The Properties of Known Drugs. 1. Molecular Frameworks. Journal of Medicinal Chemistry 1996, 39, 2887–2893. [DOI] [PubMed] [Google Scholar]
Associated Data
This section collects any data citations, data availability statements, or supplementary materials included in this article.


