

Abstract
Ecologists have long debated the relative importance of biotic interactions versus species-specific habitat preferences in shaping patterns of ecological dominance. In western North America, cycles of fire disturbance are marked by transitions between North American deermice (Peromyscus maniculatus), which predominate after wildfires, and southern red-backed voles (Myodes gapperi), which gradually replace deermice 3–4 years post-fire and maintain dominance as forests mature. While this shift has been frequently documented, the processes that mediate this turnover are debated. One possibility is competitive release, which predicts a reduction in vole competition may contribute to niche expansion and population growth in deermice. Alternatively, turnover in both species may be shaped by differences in their preferred habitat and resource base, as predicted by optimum foraging theory. We evaluate these hypotheses using stable isotopes and spatial mark-recapture of deermouse and vole populations sampled prior to and following a fire as part of a longitudinal study in the Greater Yellowstone Ecosystem. Fire disturbance was associated with a 94% decrease in vole abundance but a 102% increase in deermice. Even after accounting for microhabitat, vole and deermouse populations were negatively correlated spatially and temporally (R = −0.45), and competitor abundance was more important pre-fire than post-fire. When vole abundance was high (pre-fire), vole dietary niche space was 7x broader than that of deermice. Post-fire, deermouse dietary niche nearly tripled and was enriched in 13C (i.e., more C4 plants), while voles occupied a slightly reduced dietary niche (79% of pre-fire breadth). Our results suggest deermice are experiencing ecological release due to a reduction in vole competition but vole shifts are largely driven by habitat preferences.
Keywords: competition, deermice, dietary niche, disturbance, fire, Greater Yellowstone Ecosystem, Myodes, Peromyscus, red-backed voles, stable isotopes
Introduction
Long-standing debates on the relative importance of competition dynamics versus abiotic factors in shaping population dynamics have widely influenced both ecological and evolutionary theory over more than a century (Rosenzweig 1995, Hubbell 2001, Cooper 2003, Darwin 2008). While many authors have focused on the competition and the struggle for limited resources as a primary force shaping diversity dynamics and distributions (Hubbell 2001, Darwin 2008), others have largely focused on abiotic environmental factors in the absence of competition (Boer and Reddingius 1996, Morris 2003). As the footprint of human-induced rapid climate change becomes widespread (Abatzoglou and Williams 2016), understanding the relative importance of the drivers that shape ecological dominance becomes even more pressing for predicting how communities will change (Jackson 2021).
Anthropogenic activities have resulted in global climate change, shifting land-use practices, invasive species and disease, and increased fire frequency (IPBES 2019, Kelly et al. 2020, Riley and Loehman 2016), which are increasingly linked to turnover in ecologically dominant species (Shochat et al. 2006, Estes et al. 2016, Griffiths and Brooks 2014). This turnover may be explained by habitat tracking, such as would be predicted under optimal foraging theory, with species shifting in abundance in response to tracking fundamental niche (MacArthur and Pianka 1966). However, anthropogenic activities may also indirectly result in turnover by releasing species from competition, increasing the amount of realized niche space available for species with similar ecological niches (MacArthur and Levins 1967, Schoener 1974, Eckrich et al. 2018). Studying naturally occurring cyclic disturbances, such as those related to wildfire, will allow us to better understand the relative importance of habitat drivers related to independent niches versus competitive release in shaping this process.
In western North America, fire succession in small mammal communities often results in turnover between two ecologically dominant species. Southern red-backed voles (Myodes gapperi; hereafter red-backed voles) are abundant in old-growth forests but are largely replaced after a fire by North American deermice (Peromyscus maniculatus; hereafter deermice; Krefting and Ahlgren 1974). As vegetation matures, 3–4 years into fire succession, red-backed voles gradually begin to replace deermice (Stanton et al. 1991, Lanier et al. 2014). Although this transition is well-documented, the underlying drivers are debated: e.g., source–sink dynamics, decreased predation, increased food resources, increased foraging efficiency (Krefting and Ahlgren 1974, Morris 1996). Habitat preference and foraging efficiency may be key factors driving deermouse increase post-fire (Zwolak 2009, Zwolak et al. 2012; Fig. 1a); however, less focus has been given to the role of biotic interactions, such as competitive release. Evaluating the role of dietary competition, with pressure from voles limiting the dietary niches of deermice pre-fire and subsequent competitive release driving deermouse increases post-fire, may provide important insights into community change during fire succession.
Figure 1.

Predicted pre-/post-fire shifts in dietary niche space of red-backed voles and deermice under (a) optimal foraging theory, where each species exhibits a narrow dietary niche in its preferred habitat, and (b) competitive release, where post-fire release from competitive pressure from voles permits deermouse niche expansion. Under competitive release vole dietary niche breadth may be reduced if large deermouse populations exert competitive pressure on the remaining voles, limiting dietary niche space, or maintained, if there is no significant dietary exclusion. Species illustrations © Addison Allen.
Evidence for competition between deermice and red-backed voles is mixed, with support for either vole (Crowell and Pimm 1976) or deermouse (Lemaître et al. 2010) dominance, depending on the ecological context in which competition is measured. Both species eat seeds, grains, nuts, fruit, and flowers, but while red-backed vole diets are thought to be more narrow and involve more mosses and fungi (Merritt 1981, Orrock and Pagels 2002), deermice shift resource selection depending on local availability. Under the competitive release hypothesis (Wilson 1961) we predict that competition from voles limits dietary breadth and population density of deermice is diminished in old-growth habitats. We hypothesize that fire, by reducing competitive pressure from voles, leads to ecological release of deermice, allowing them to expand their dietary niche and increase in abundance (Fig. 1b; Herrmann et al. 2021). Under the competitive release hypothesis, we predict greater pre-fire competitive pressure from voles on deermice in a semi-shared dietary niche, with deermice excluded from a portion of their fundamental niche by the voles (Hutchinson 1957). We contrast these predictions with dietary and habitat shifts expected under optimal foraging theory (MacArthur and Pianka 1966), which suggests species turnover will reflect changes in resource availability. Under this scenario (Fig. 1a) we predict little niche overlap between species either pre- or post-fire, narrow dietary niches in habitats with preferred food resources, and dietary niche expansion when a species forages in suboptimal habitat to compensate for decreases in resource quality, quantity, or accessibility (Stephens et al. 2019). Fire-associated shifts in deermice and red-backed voles under this hypothesis would represent responses to dietary and habitat specialization (Morris 1996, Boonstra and Krebs 2012), not competition. Understanding resource partitioning within the community requires simultaneously considering that multiple mechanistic models, such as competition or niche differentiation, may be driving the observed abundance shifts (Schoener 1974).
Here we evaluate the role of shifting food resources and interspecific dietary competition in driving turnover between small mammals (voles and deermice) in a boreal forest using longitudinal sampling from a fire-prone ecosystem (Lanier et al. 2017). We apply stable isotope analysis of vole and deermouse hair to evaluate resource use in terms of total carbon and nitrogen contributions, which allowed us to examine changes in dietary niche breadth and overlap. Because chipmunks (Tamias spp.) have been shown to interact and potentially compete with deermice and red-backed voles (Morris 1996) we also assess the role of chipmunk abundance in shaping population dynamics in this system. To evaluate space use by deermice, voles, and chipmunks, we analyzed microhabitat variables and spatial capture history to test whether habitat shifts better explain variation in small mammal abundance during fire succession than competitor presence. Our goal was to evaluate the effects of competition and resource availability in shaping variation in small mammal abundance across different seral stages following fire. As an important trophic link between producers and higher-level predators, fungal and seed dispersers, shape and aerate soil nutrients and moisture (Brehme et al. 2011, Lacher et al. 2019, Wilson and Smith 2015), understanding the factors driving these turnovers will allow us to better understand and predict overall community dynamics.
Materials and Methods
Field Methods
Study area.—
The study area consisted of four 1-ha sampling grids along the John D. Rockefeller, Jr. Memorial Parkway, between Yellowstone and Grand Teton National Parks (Appendix S1: Fig. S1; Lanier et al. 2017). This lodgepole pine-dominated ecosystem has been the subject of decades of influential research in fire and disturbance ecology (Turner et al. 1997, Romme et al. 2011). All four grids (two on east-facing and two on west-facing slopes) were initially established after the 1988 Yellowstone wildfires to compare fire succession on two burned grids with nearby, unburned habitats (Appendix S1: Fig. S1; Stanton et al. 1991). Continued work on these sites has provided a long-term, vouchered dataset that our research builds on. A new set of wildfires burned all four grids in 2016 (Lanier et al. 2017), providing the opportunity to directly test the role of pre- and post-fire dietary competition and space use in shaping population dynamics in this system.
Trapping and sampling.—
Each 1-ha grid consisted of 100 Sherman trap stations, each 10 m apart, baited with peanut butter and oats (Lanier et al. 2017). Small mammals were sampled in a single, 4-night trapping period per month, repeated during the months of June, July, and August surveyed during 2009, 2014, 2015, 2017, and 2018. Live-captured small mammals were identified to genus and species (where possible), sexed, and measurements were taken for total length, tail length, ear width, and weight. Captures were singly (2009) or doubly (2014) marked with ear tags, or one ear tag and one Passive Integrated Transponder tag (2015, 2017, 2018) for mark-recapture abundance estimates. “Total captures” in our dataset reflect both the new (i.e., unique) small mammal individuals captured as well as recaptures to encompass the intensity of individual activity, whereas “unique captures” refer to the number of new individuals captured (i.e., excluding recaptures). A quarter of the Sherman traps (25 of the 100 trap stations for each grid; 100 per session) were paired with a pitfall trap, filled with propylene glycol, during the consecutive 4-night trapping session in order to better sample shrew species. Pitfall traps also provided an important voucher specimen record, facilitating the dietary aspects of this study. All trapping and mammal handling was conducted following the ASM Guidelines for Wildlife (Sikes 2016) and handled in accordance with IACUC protocols 20140520ZR00105 and 20170517ZR0071. Museum catalog numbers for all voucher specimens associated with this paper can be accessed in OSF (Data: SpecimenList.xlsx; DOI 10.17605/OSF.IO/JC8A6).
Vegetation sampling.—
To understand vegetation communities and habitat complexity during fire succession, vegetation and habitat data were collected from 25 trap stations per grid once per year, during the July trapping session. We evaluated microhabitat characteristics around each trap station, quantifying ground and canopy cover, distance to nearest seedling and shrub, and characteristics of the coarse woody debris. Ground-dwelling small mammals rely heavily on microhabitat for food and protection, so ground cover and shrubs and seedling density provide insights into the resources available and their turnover during succession. Canopy cover, estimated with a convex spherical densiometer, provides information into altered plant communities, abiotic conditions, as well as providing small mammals with cover from predators. We used a 1-meter Daubenmire frame placed at the trap station to estimate the percentage of ground cover (bare ground, grass, herbaceous plant, leaf litter, shrub, and woody plants) to the nearest 25% (i.e., 0%, 1–25%, 26–50%, 51–75%, 76–100%; Daubenmire 1959, Deuser and Shugart 1978). We assessed coarse woody debris (i.e., downed logs >7.5 cm in diameter) occurring along a transect within a 5-meter distance from the trap site in each cardinal direction (for a 10-m transect centered on the trap). For each piece of coarse woody debris encountered along the transect, we measured: distance to the trap; debris diameter; height from the ground; and a categorical decay class (0–5, from most to least decayed). The area around the trap station was searched for seedlings and shrubs, and the distance to the trap station was measured. If no seedling or shrub was found within the 10 meters surrounding the trap station, the distances for those two variables were set to 15 meters. This was done for 15 distance-to-seedling distance entries and 3 distance-to-shrub entries. For 4 traps (out of 400 total) missing percent canopy and ground cover values were imputed as the means from the 4–6 physically closest traps from the same year.
Isotopic Analysis
Stable isotope analysis.—
To assess dietary differences within and among species we used nitrogen and carbon isotopic signatures (δ13C and δ15N) from the hair of 61 deermouse and 58 red-backed vole specimens collected in 2009, 2014, 2015, 2017, and 2018 (Table 1). Nitrogen stable isotopes (δ15N) are useful for estimating trophic position because they are usually enriched by 3–4‰ relative to the consumer diet (Newsome et al. 2012). Carbon stable isotopes (δ13C) tell us the ultimate carbon sources a consumer uses (i.e., C3 vs. C4 plants use different carbon photosynthetic pathways and therefore have different isotopic signatures; Flaherty and Ben-David 2010, Newsome et al. 2012). We measured (δ13C and δ15N) with a Flash EA Isolink Elemental Analyzer (Thermo Fisher Scientific, Inc., Waltham, MA, USA) connected to a Thermo Delta V Advantage Isotope Ratio Mass Spectrometer (Thermo Fisher Scientific, Inc., Waltham, MA, USA). We adjusted δ13C and δ15N and elemental compositions (%C and %N) with in-house standards and reference materials USGS42 and USGS40 (Reston Stable Isotope Laboratory, U.S. Geological Survey, Reston, VA, USA). These materials have known elemental compositions and were run alongside our samples for quality assurance. We report results as δ13C and δ15N ratios in parts per thousand (‰) in relation to the international standards Vienna-Peedee Belemnite (VPDB; δ13C) and atmospheric nitrogen (AIR; δ15N; Manlick et al. 2017). We confirmed the precision, accuracy, and repeatability of isotope runs with control tests on the standard and reference materials. Across all runs, the average standard deviations for δ13C and δ15N measurements of USGS42 and USGS40 were 1.198 and 0.703, respectively. The measured values for δ13C and δ15N for machine drift and linearity were corrected when needed.
Table 1.—
Red-backed voles (Myodes gapperi), deermice (Peromyscus maniculatus), and total small mammal captures by year, and the number of voucher specimens used for isotope analysis. The number of chipmunk captures (Tamias spp.) is in parentheses in the total unique small mammal captures column.
| Red-backed voles | Deermice | Small mammals | ||||
|---|---|---|---|---|---|---|
| n unique | n unique | n captures | ||||
| Year | (ntotal = 1,115) | n isotope samples | n unique (ntotal = 824) | n isotope samples | (ntotal = 2716) | (ntotal = 5493) |
|
| ||||||
| 2009 | 256 | 14 | 116 | 4 | 486 (29) | 607 |
| 2014 | 349 | 16 | 65 | 16 | 650 (27) | 1197 |
| 2015 | 468 | 16 | 162 | 5 | 936 (25) | 1901 |
| 2017 | 12 | 4 | 116 | 21 | 153 (3) | 404 |
| 2018 | 30 | 8 | 365 | 15 | 491 (24) | 1384 |
Data Analysis
Capture-based estimates of competition.—
We used two complementary methods to further evaluate the role of competitive interactions in shaping the spatial distribution of red-backed voles and deermice over time. First, we used a randomization analysis to test whether deermice and voles were unlikely to co-occur among trap stations. These analyses provide a baseline for assessing patterns of species co-occurrence within a given trapping session, but do not make assumptions about underlying mechanisms. For these analyses, we compared the observed species overlap (i.e., the number of trap stations with both species) within a month against a randomized, simulated overlap matrix. We ran this co-occurrence analysis using the binary presence-absence capture history of deermice and red-backed voles from each monthly sampling session over the 5 sampling years (for a total of 15 comparisons). Simulated datasets were constructed with the R package EcoSimR v. 0.1.0 (Gotelli et al. 2015) using 1,000 randomizations with the “Sim2” metric (Data: Randomization.R; DOI 10.17605/OSF.IO/JC8A6). Observed data and simulations were compared using the C-score index (Stone and Roberts 1990), which evaluates the average covariance between each species pair in capture occurrences among the trap stations. Large values of the C-score index indicate strong species segregation among traps. A Bonferroni correction for multiple comparisons was applied to the results.
As randomization only evaluates patterns of co-occurrence and does not account for surrounding habitat or distance between traps, we also used simultaneous autoregressive (SAR) models (Kissling and Carl 2008) to examine spatial overlap between deermice and voles. Simultaneous autoregressive models can be used to test and account for spatial autocorrelation, if necessary, allowing us to simultaneously examine the influence of competitor abundance (i.e., the number of captures of deermice, voles, or chipmunks at a given trap station) and the vegetation community at a trap station in potentially autocorrelated data. Chipmunks were included as explanatory variables in these models because they have been shown to interact with voles and deermice (Morris 1996). We took an iterative approach, running a preliminary set of negative binomial generalized linear models (GLMs) to identify the best combinations of variables that explain per-trap species abundance (i.e., deermice or red-backed voles as the response variable) without accounting for spatial distance (MASS v. 7.3–51.4; Ripley et al. 2020; Data: SARModelComparisons.R; DOI 10.17605/OSF.IO/JC8A6). Because populations fluctuate annually, models were run separately for each species and each year, focusing on the trap stations per grid with both vegetation and capture data (25 stations/grid; 100 stations/year), during the years where vegetation data collection was standardized (2014, 2015, 2017, 2018). To control for the effect of correlated vegetation characteristics, we used a PCA based on a correlation matrix to reduce the microhabitat variables to the top 3 principal components across all four years, as determined by scree plots (Data: VegPCA.R; DOI 10.17605/OSF.IO/JC8A6; variable contributions shown in Appendix S1: Table S1). Microhabitat differences based on PC1 most strongly captured fire succession trends, whereas PC2 and PC3 capture greater variation in ground cover and logs (Appendix S1: Fig. S2). Aspatial models within ΔAICC < 2 of the best model (MuMIn; Bartoń 2020) were further investigated with likelihood ratio tests (LRT), to assess goodness-of-fit.
Because spatial distance between traps can influence vegetation communities and capture rates, as well as violate assumptions regarding the independence of residuals, we also evaluated spatial models for our datasets. To evaluate the role of spatial distance, the best aspatial models (i.e., ΔAICC < 2) were modified to account for fine-scale autocorrelation using a distance matrix component based on coordinate data (Douglas and Endler 1982, Kissling and Carl 2008) in the R packages spdep v. 1.1–5 (Bivand and Wong 2018) and spatialreg v. 1.1–5 (Bivand et al. 2013). If spatial autocorrelation was rejected for a given set of models, aspatial models were used for inference. To examine the relative importance of predictor variables associated with either habitat or competition, we calculated model-averaged beta coefficients across all best models for a given species/year. We also calculated incidence rate ratios for the top model(s) (as determined by ΔAICC < 2 and the LRT results), as standard effects size calculations are not appropriate for negative binomial GLMs.
Estimating dietary niche shifts.—
We used δ13C and δ15N values from individual deermice and red-backed voles to evaluate dietary niche breath and overlap. To evaluate the dietary niche breadth of a population, we fit standard ellipses corrected for small sample size (SEAc) in the R package SIAR version 4.2 (Parnell and Jackson 2013) and fit dashed-lined convex hulls to enclose species distributions of isotopic values within a given year using the R package SIBER version 2.1.4 (Jackson et al. 2011, Jackson and Parnell 2020; Data: Isotopes.R; DOI 10.17605/OSF.IO/JC8A6). To test for differences among species and within species among years, we ran MANOVAs on species’ carbon and nitrogen isotope signatures (the dependent variable) using the base functions in R version 3.6.0 (R Core Team 2019; Data: MANOVA.R; DOI 10.17605/OSF.IO/JC8A6).
Results
Species abundances.—
Over the 5 sampling years (2009, 2014, 2015, 2017, and 2018) we captured a total of 2,721 small mammals, including 1,130 red-backed voles and 827 deermice. Prior to the 2016 fire, red-backed voles predominated in small mammal communities (49–56% of all captures), but after the fire deermice comprised the majority of the captures (75–76% of all captures; Table 1; Fig. 2). The average number of voles captured per grid (i.e., per ha) per year transitioned from 179 pre-fire to 12 post-fire, whereas the average number of deermice transitioned from 63 pre-fire to 189 post-fire (Table 1). Across grids and years, vole and deermouse captures were negatively correlated (R = −0.447; R2 = 0.199; Data: AbundanceRegression.R; DOI 10.17605/OSF.IO/JC8A6); with 35 fewer deermice captures for every additional 100 voles captured (Fig. 3). Other small mammal species commonly captured included Tamias spp. (mainly yellow-pine chipmunks, T. amoenus, but also least chipmunks, T. minimus), which transitioned from an average of 27 pre-fire to 13 post-fire. Pre-fire shrews (mainly Sorex monticolus and S. cinereus) also comprised a large number of captures, but transitioned from an average of 150 pre-fire to 14 post-fire.
Figure 2.
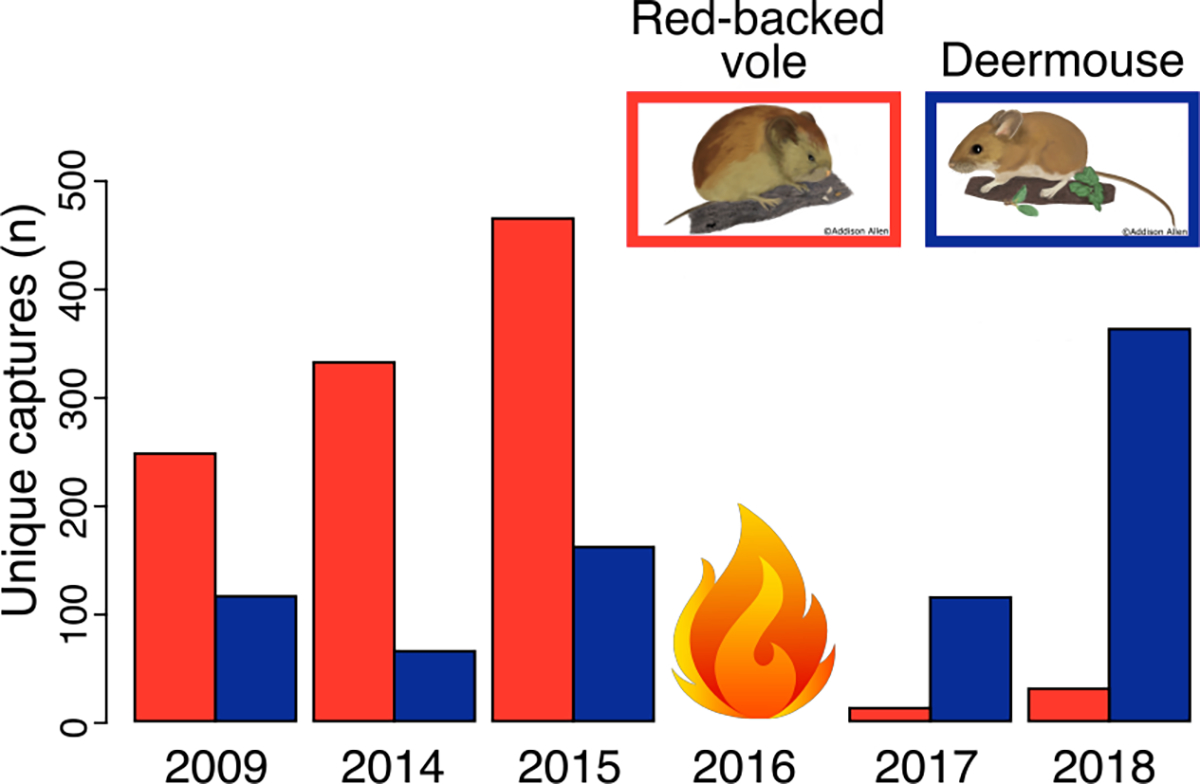
Abundance of each species before and after the 2016 fire. Red-backed voles comprised 53%, 56%, and 49% of all unique captures pre-fire (2009, 2014, and 2015, respectively) but only 8% and 6% post-fire (2017, 2018), whereas deermice comprise 24%, 11%, and 18% pre-fire but 76% and 75% post-fire. The remaining unique captures correspond to other species (Microtus spp., Neotamias amoenus, Sorex spp., Thomomys talpoides, Phenacomys intermedius, Zapus princeps, and Neotoma cinerea). Species illustrations © Addison Allen.
Figure 3.
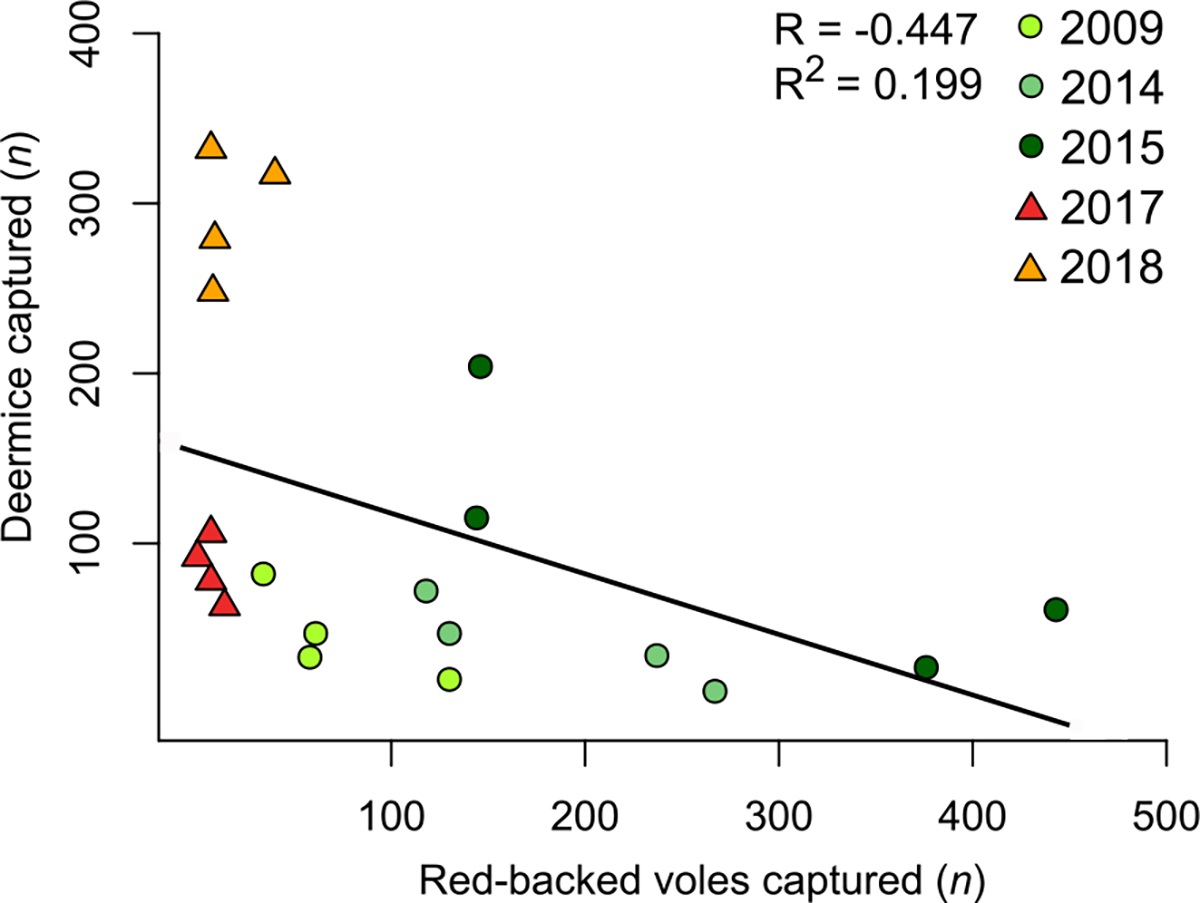
Red-backed vole captures are negatively correlated to deermouse captures during both pre- (circles) and post-fire (triangles) years (regression line shown for context). Red-backed vole captures were negatively correlated to deermice captures, with 35 fewer deermice captures for every additional 100 vole captures.
Capture-based estimates for competition.—
Randomization results indicated deermice and voles were significantly more segregated among trap stations than expected by chance for all months and years (P < 0.001; Appendix S1: Table S2). Even after applying a Bonferroni correction for multiple comparisons results remained significant.
The SAR approach confirmed a negative relationship between the two species (Appendix S1: Table S3), both the effect of voles on deermice (βpre-fire = −0.27 and βpost-fire = −0.26) and the effect of deermice on voles (βpre-fire = −0.21 and βpost-fire = −0.33), even when accounting for any spatial autocorrelation or microhabitat effects (Appendix S1: Table S4). None of the model comparisons that included spatial autocorrelation had better AICC values than aspatial models (Appendix S1: Table S4), but lambda values and residuals suggested spatial autocorrelation in 2015 for both species and for deermice in 2017. Pre-fire, deermouse models that incorporated vole abundance were uniformly better than those that did not; although vegetation and chipmunk models were within ΔAICC < 2, likelihood ratio test results as well as IRR values and variable significance indicate a greater importance of vole presence (Appendix S1: Tables S3 and S4). Pre-fire, vole models that incorporated deermouse abundance and vegetation characteristics were best. After the 2016 fire, models of deermouse abundance that only included vegetation characteristics had the lowest AICC scores; while models including competitor abundance also received substantial support (i.e., ΔAICC < 2; Appendix S1: Table S4), they were not equivalent under the likelihood ratio test. Significance of individual variables and IRR results also suggested that microhabitat variable importance increased after the fire. Microhabitat differences based on vegetation principal component 1 (PC1) were always included in the best model for red-backed voles, regardless of burn status (Appendix S1: Tables S3 and S4). PC1 is most strongly associated with habitat characteristics related to the burn: more herbaceous plants, grasses, downed logs, and space below logs pre-fire whereas post-fire years vegetation included fewer decaying logs, more open canopy and bare ground.
Dietary niche shifts.—
Before the 2016 fire, vole dietary niche space was nearly 7x as broad as deermouse niche space, particularly with respect to nitrogen content (Fig. 4). After the 2016 fire, deermice expanded in niche space and experienced more year-to-year shifts. When vole populations were reduced post-fire, the dietary niche of deermice increased to 280% of pre-fire breadth (SEAcpre-fire mean=0.94; SEAcpost-fire mean=2.66) whereas vole dietary niche was reduced to 79% of pre-fire breadth (SEAcpre-fire mean=6.56; SEAcpost-fire mean=5.18). In two of the three years prior to the 2016 fire, the two species differed significantly in nitrogen content but not carbon (Appendix S1: Table S5). One year after the fire (2017), species did not significantly differ (Fig. 4; Appendix S1: Table S5); however, two years post-fire (2018) overlap decreased and the species significantly differed in carbon (P = 0.01; Appendix S1: Table S5). Deermice significantly shifted in both dietary axes across years (P = 9.791e-13 for δ13C and P = 0.0005 for δ15N; Appendix S1: Table S6) whereas vole dietary space shifted very little in carbon but significantly in nitrogen (P < 0.05; Appendix S1: Table S6).
Figure 4.
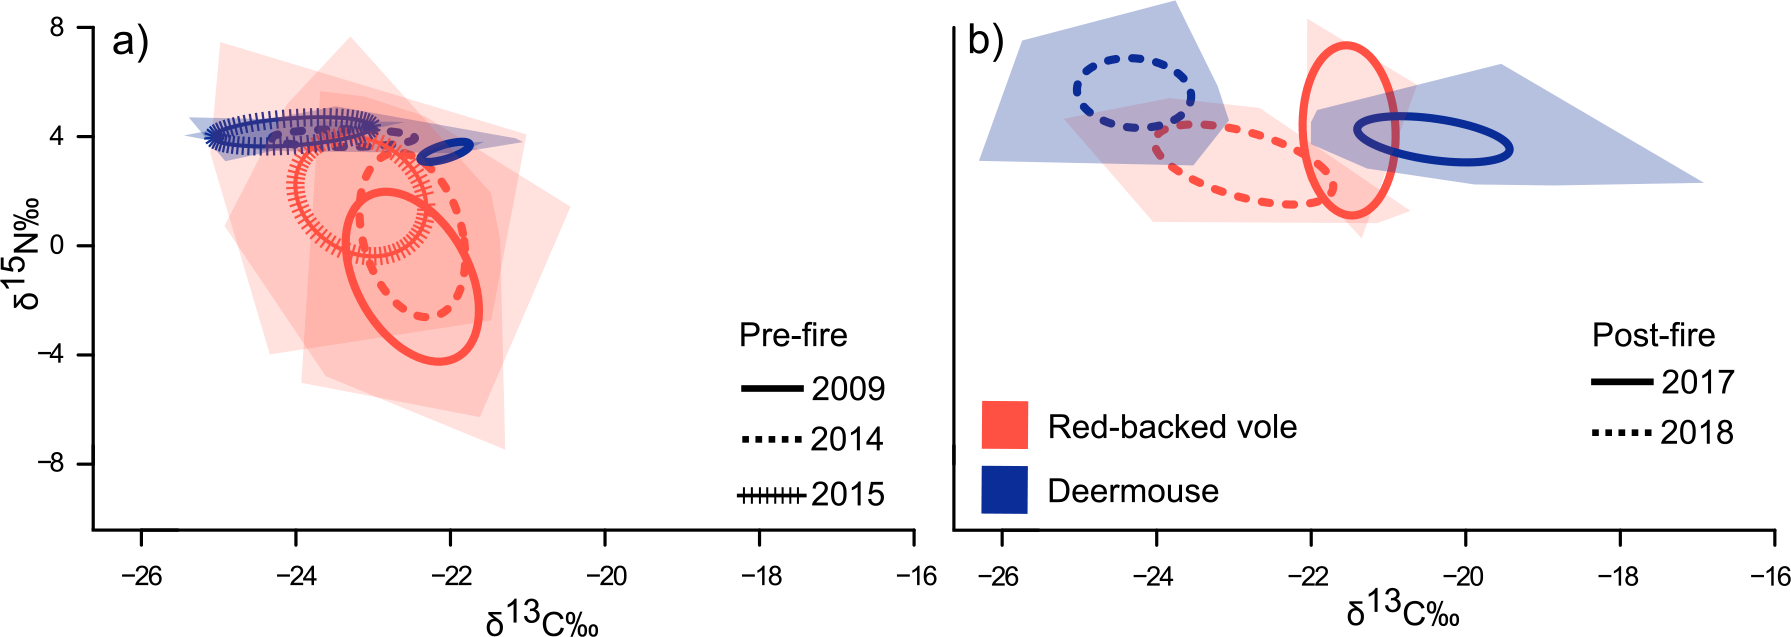
Carbon and nitrogen isotope signatures (δ13C and δ15N) of deermice and red-backed voles shift from (a) pre-fire to (b) post-fire (both axes are the same). Standard ellipses corrected for small sample size (SEAc; lines) illustrate dietary niche breadth, and convex hulls (shaded) enclose a species isotopic values within a given year. The post-fire reduction in vole population is associated with a nearly 3x increase in deermouse dietary niche.
Discussion
Our results suggest that competitive dynamics shape community turnover from red-backed voles to deermice during fire succession. Red-backed vole and deermouse populations are negatively correlated spatially and temporally, and non-random differences in spatial capture data suggest strong dispersion between the two species even after accounting for habitat, particularly pre-fire. In old-growth habitats, where voles are abundant, deermouse dietary breadth is extremely reduced, as would be expected when a weaker competitor is restricted to a smaller realized niche space (Hutchinson 1957). However, when vole populations diminished post-fire, deermouse dietary niche breadth nearly tripled and deermouse populations increased substantially. Together, these results support the hypothesis that voles are competitively excluding deermice in older growth habitats and deermice are experiencing competitive release when voles diminish following a fire (Herrmann et al. 2021). In contrast, support for reciprocal competitive pressure experienced by red-backed voles from deermice was mixed. Voles exhibited a broad dietary niche across all years and experienced fewer year-to-year shifts in isotopic space, but competitor abundance was an important secondary predictor of vole abundance at a trap station.
Collectively, these results suggest red-backed voles influence community turnover associated with fires by competitively excluding deermice spatially and restricting access to certain food resources in old-growth habitats, but competitive release drives deermouse abundance after fires. Competitive interactions between deermice and red-backed vole populations are supported by capture histories across our study sites, with non-random segregating on the landscape and a greater importance of competitor abundance in pre-fire models. This fits expectations from behavioral lab experiments where interactions between red-backed voles and deermice (and within deermice) were mostly aggressive (Grant 1970). Red-backed voles often have rigid habitat preferences, which may restrict their habitat selection but increase the competitive pressure for foods in their preferred ‘high-quality’ old-growth habitat, where they might out-compete or exclude deermice (Crowell and Pimm 1976). Our models also support a stronger role for microhabitat in shaping red-back vole abundance, regardless of the stage of fire succession. Although support for competitive pressure contrasts with previous studies (Galindo and Krebs 1985, Morris 1996), this may reflect regional and temporal shifts driving differing competitive pressure (similar to the findings of Smith and Fox 2017). Overall, we found a strong, negative influence of voles on deermice, with less impact of deermice on voles, which is similar to other findings regarding habitat use in the two species (Crowell and Pimm 1976). Finally, while chipmunks interact with both species (Morris 1996), model results suggest chipmunk presence generally did not significantly influence abundance of either voles or deermice, and chipmunks and voles were positively correlated in 2018 (Appendix S1: Tables S3 and S4).
As an alternative to competition, we evaluated the possibility that community turnover associated with fire disturbance may reflect resource-driven habitat preferences in deermice (optimal foraging theory). Under this hypothesis (Fig. 1a), each species would experience a greater population density and smaller dietary niche in preferred habitats, where food resources are abundant, with little niche overlap between species. Similar dietary niche shifts have been described in white-footed deermice (P. leucopus) and North American deermice, with both species exhibiting narrower niche breaths during masting seasons (i.e., when consuming a high-quality food resource) and expanded dietary niches in nonmasting seasons when food resources are reduced (Stephens et al. 2019). However, our results run counter to these predictions. Pre-fire, when vole abundance was high, deermouse dietary breadth was extremely reduced and marginal to vole dietary niche space. Instead of niche reduction post-fire, as expected under optimum foraging theory, the dietary niche of deermice increased nearly threefold. If post-fire niche expansion in the deermice from our study was solely due to consuming more low-quality food resources in newly burned habitats, we would expect niche expansion and population decreases (similar to Stephens et al. 2019), which was also not the case. Instead, the deermouse results fit expectations under the ecological release hypothesis (Herrmann et al. 2021) and contrast with alternative niche expansion expectations. Resource-driven predictors become more important for deermice in post-fire years, where the top models for deermice indicate an association with open canopy and bare ground.
In contrast to deermice, red-backed voles maintained a large dietary breadth in carbon and nitrogen space across all years, with fewer year-to-year shifts, despite significant fire-associated habitat changes (Lanier et al. 2017). Based on stable isotopes, voles consume a broad range of nitrogen food resources pre-fire (Fig. 4) but shift to a slightly more restricted, δ15N-enriched diet after a fire. This may indicate voles incorporate more insects in their diet post-fire or it may reflect post-fire nitrogen release from above-ground plant matter into soil and higher fungal abundance (Neary et al. 2005). While vole dietary niches are far broader than deermice in older-growth habitats, we find less isotopic evidence for reciprocal dietary pressure on vole dietary niches when deermice were abundant. This suggests the post-fire vole population crash and dietary shift is mainly driven by resource shifts, providing greater support for resource tracking/optimal foraging in vole responses. Our regression models also indicate voles were more responsive to the vegetation community, particularly habitats with more ground cover and more space below logs. This result may also explain voles’ slower expansion into marginal habitat after a disturbance (with less decaying logs and more bare ground) and the lack of evidence for displacing other species after a disturbance (Crowell and Pimm 1976).
Beyond competitive release from red-backed voles, dietary flexibility exhibited by deermice may also contribute to their post-fire success. Both species shifted their dietary niche post-fire, transitioning to a diet enriched in 13C, which coincided with increased grasses in the newly burned habitats (Lanier et al. 2017), as is common in fire succession. However, deermouse dietary shifts were greater than those observed in red-back voles (Fig. 4; Appendix S1: Table S6), and deermice even underwent considerable shifts in post-fire years (i.e., between 2017 and 2018). Deermice may also be more efficient foragers than voles in altered and disturbed habitats (Lemaître et al. 2010, Zwolak et al. 2012), which may allow deermice to be more successful after the fire. Overall, decreased competition pressure and vegetation community shifts together result in burned areas being high quality habitat for deermice, with similar survival rates but higher reproduction rates than unburned habitats (Zwolak and Foresman 2008, Zwolak et al. 2012).
The presence of deermouse- or vole-dominated small mammal communities has important ecological consequences. For example, deermice are important predators on songbird nests (Hethcoat and Chalfoun 2015, Lemaître et al. 2010) and exert more competitive pressure on shrews (Eckrich et al. 2018), whereas red-backed voles are important dispersers of fungal spores (Orrock and Pagels 2002). These two species also differ with respect to seed choice (Lobo 2014), with deermice exhibiting a greater ability to tolerate plant secondary compounds from pine seeds, which impacts their roles as seed predators and dispersers (Lobo and Millar 2011). Deermice and red-backed voles differ with respect to boldness, seed-predation, seed-caching, and personality traits that mediate these behaviors (Brehm et al. 2019). These links between species preferences, individual personality and seed selection, dispersal, and caching in different habitats (Brehm et al. 2019) shape the characteristics of the surrounding plant community (Zwolak 2018). Evidence also suggests deermice and voles are differentially important as prey items for mammalian and avian predators, such as weasels and spotted owls (Wywialowski 1987, Rosenberg et al. 2003). Thus, an abundance of deermice or voles can have both top-down and bottom-up impacts on the composition of the surrounding ecological community.
As fires become more frequent, red-backed voles may have fewer old-growth habitats and our results suggest deermice will face less competitive pressure. Removal experiments and more detailed dietary analyses under differing competitive environments may provide insights into the potential for frequent fires to homogenize surrounding plant and animal communities and weaken community recovery. For example, removal of deer mice may permit a greater diversity of plants to establish, given their greater tolerance for secondary compounds (Lobo and Miller 2011), and increase survival of songbirds (Hethcoat and Chalfoun 2015). Removal experiments may also assist with determining how species identity, individual personality (Brehm et al. 2019), and competitive pressure (e.g., Davison & Morris 2001) intersect to influence ecological characteristics, such as plant community structure and predator abundance.
This research provides unique insights into the drivers of turnover between dominant species between two regionally dominant small mammals. We found that competitive release drives high deermouse abundance post-fire, but vole trends in abundance during fire succession are more greatly influenced by niche-specific habitat shifts. Population density, community diversity, and habitat recovery have been suggested as factors that contribute to small mammal community turnover during disturbances (Zwolak 2009). However, our results indicate that biotic interactions, specifically competitive release, are also an important element. Understanding how competitive exclusion is reduced in disturbed habitats provides important predictions regarding shifts in biotic interactions due to frequent fires. As small mammals are a trophic link between producers and higher-level predators, understanding mechanisms that structure diet and abundance shifts in small mammal communities could help us better predict the mechanisms that drive ecosystem changes. With climate projections suggesting that disturbances, such as fire, will become more frequent in coming decades (Romme et al. 2011, Abatzoglou and Williams 2016, Riley and Loehman 2016), identifying mechanisms of the drivers behind community response to disturbances are vital for predicting population dynamics.
Supplementary Material
Acknowledgments
This project was supported by an Institutional Development Award (IDeA) from the National Institute of General Medical Sciences of the National Institutes of Health (2P20GM103432), Laramie County Community College, the University of Wyoming-National Park Service Research Station, and the Mammalogy Department at the Sam Noble Museum of Natural History. We thank Dr. B.S. Coyner for field and catalog assistance, M.A. Roehrs for field coordination and assistance, Dr. D. Allen and Dr. A. Wangeline for stable isotope sample and data processing advice, and students from the University of Wyoming at Casper and Laramie County Community College. Finally, thanks to Dr. M. Rowe and Dr. M. Patten for help with project development and spatial analyses as well as Dr. M.H. Hoefnagels, M. Vesy, M. Loya, S. Fulton, G. Tolentino Ramos, M. da Cruz, and five anonymous reviewers for suggestions on this manuscript.
Footnotes
Open Research:
All data and code used to run statistical models included in this manuscript can be accessed at https://osf.io/jc8a6/?view_only=3c43686f138044679f458fdb8748cce1 and are archived in OSF (DOI 10.17605/OSF.IO/JC8A6).
Contributor Information
Addison G. Allen, Department of Biology and Sam Noble Oklahoma Museum of Natural History, University of Oklahoma, Norman, OK 73072 USA.
Zachary P. Roehrs, School of Math and Sciences, Laramie County Community College, Cheyenne, WY 82007 USA
R. Scott Seville, Department of Zoology and Physiology, University of Wyoming at Casper, Casper, WY 82601 USA.
Hayley C. Lanier, Department of Biology and Sam Noble Oklahoma Museum of Natural History, University of Oklahoma, Norman, OK 73072 USA
Literature Cited
- Abatzoglou John T., and Williams A. Park. 2016. “Impact of Anthropogenic Climate Change on Wildfire across Western US Forests.” Proceedings of the National Academy of Sciences of the United States of America 113 (42): 11770–75. 10.1073/pnas.1607171113. [DOI] [PMC free article] [PubMed] [Google Scholar]
- Bartoń Kamil. 2020. MuMIn: Multi-Model Inference (version 1.43.17). https://CRAN.R-project.org/package=MuMIn.
- Bivand Roger, Hauke Jan, and Kossowski Tomasz. 2013. “Computing the Jacobian in Gaussian Spatial Autoregressive Models: An Illustrated Comparison of Available Methods.” Geographical Analysis 45 (2): 150–79. 10.1111/gean.12008. [DOI] [Google Scholar]
- Bivand Roger S., and Wong David W. S.. 2018. “Comparing Implementations of Global and Local Indicators of Spatial Association.” TEST 27 (3): 716–48. 10.1007/s11749-018-0599-x. [DOI] [Google Scholar]
- Boer P. J. den, and Reddingius Joannes. 1996. Regulation and Stabilization Paradigms in Population Ecology. 1st ed.. Population and Community Biology Series 16. London; New York: Chapman & Hall. [Google Scholar]
- Boonstra Rudy, and Krebs Charles J.. 2012. “Population Dynamics of Red-Backed Voles (Myodes) in North America.” Oecologia 168 (3): 601–20. 10.1007/s00442-011-2120-z. [DOI] [PubMed] [Google Scholar]
- Brehm Allison M., Mortelliti Alessio, Maynard George A., and Zydlewski Joseph. 2019. “Land-Use Change and the Ecological Consequences of Personality in Small Mammals.” Ecology Letters 22 (9): 1387–95. 10.1111/ele.13324. [DOI] [PubMed] [Google Scholar]
- Brehme Cheryl S., Clark Denise R., Rochester Carlton J., and Fisher Robert N.. 2011. “Wildfires Alter Rodent Community Structure across Four Vegetation Types.” Fire Ecology 7 (2): 81–98. 10.4996/fireecology.0702081. [DOI] [Google Scholar]
- Cooper Gregory John. 2003. The Science of the Struggle for Existence: On the Foundations of Ecology. Cambridge Studies in Philosophy and Biology. Cambridge, U.K.; New York: Cambridge University Press. [Google Scholar]
- Crowell KL, and Pimm SL. 1976. “Competition and Niche Shifts of Mice Introduced onto Small Islands.” Oikos 27 (2): 251–58. 10.2307/3543903. [DOI] [Google Scholar]
- Darwin Charles. 2008. On the Origin of Species. Edited by Quammen David. Illustrated ed.. New York: Sterling. [Google Scholar]
- Daubenmire RF 1959. “A Canopy-Coverage Method of Vegetational Analysis.” Northwest Science 33 (1): 22. [Google Scholar]
- Douglas Michael E., and Endler John A.. 1982. “Quantitative Matrix Comparisons in Ecological and Evolutionary Investigations.” Journal of Theoretical Biology 99 (4): 777–95. 10.1016/0022-5193(82)90197-7. [DOI] [Google Scholar]
- Dueser RD, and Shugart HH. 1978. “Microhabitats in a Forest-Floor Small Mammal Fauna.” Ecology 59 (1): 89–98. 10.2307/1936634. [DOI] [Google Scholar]
- Eckrich Carolyn A., Flaherty Elizabeth A., and Ben-David Merav. 2018. “Functional and Numerical Responses of Shrews to Competition Vary with Mouse Density.” PLoS One 13 (1): e0189471. 10.1371/journal.pone.0189471. [DOI] [PMC free article] [PubMed] [Google Scholar]
- Estes James A., Burdin Alexander, and Doak Daniel F.. 2016. “Sea Otters, Kelp Forests, and the Extinction of Steller’s Sea Cow.” Proceedings of the National Academy of Sciences 113 (4): 880–85. 10.1073/pnas.1502552112. [DOI] [PMC free article] [PubMed] [Google Scholar]
- Flaherty Elizabeth A., and Ben-David Merav. 2010. “Overlap and Partitioning of the Ecological and Isotopic Niches.” Oikos 119 (9): 1409–16. 10.1111/j.1600-0706.2010.18259.x. [DOI] [Google Scholar]
- Galindo C, and Krebs CJ. 1985. “Habitat Use and Abundance of Deer Mice: Interactions with Meadow Voles and Red-Backed Voles.” Canadian Journal of Zoology-Revue Canadienne De Zoologie 63 (8): 1870–79. 10.1139/z85-278. [DOI] [Google Scholar]
- Gotelli Nicholas J., Hart Edmund M., and Ellison Aaron M.. 2015. EcoSimR: Null Model Analysis for Ecological Data (version R package version 0.1.0). Zenodo. 10.5281/ZENODO.16522. [DOI] [Google Scholar]
- Grant PR 1970. “Experimental Studies of Competitive Interaction in a Two-Species System: II. The Behaviour of Microtus, Peromyscus and Clethrionomys Species.” Animal Behaviour 18 (3): 411–26. 10.1016/0003-3472(70)90035-7. [DOI] [Google Scholar]
- Griffiths Anthony D., and Brook Barry W.. 2014. “Effect of Fire on Small Mammals: A Systematic Review.” International Journal of Wildland Fire 23 (7): 1034–43. 10.1071/WF14026. [DOI] [Google Scholar]
- Herrmann Nicholas C., Stroud James T., and Losos Jonathan B.. 2020. “The Evolution of ‘Ecological Release’ into the 21st Century.” Trends in Ecology & Evolution 0 (0). 10.1016/j.tree.2020.10.019. [DOI] [PubMed] [Google Scholar]
- Hethcoat Matthew G., and Chalfoun Anna D.. 2015. “Towards a Mechanistic Understanding of Human-Induced Rapid Environmental Change: A Case Study Linking Energy Development, Nest Predation and Predators.” Journal of Applied Ecology 52 (6): 1492–99. 10.1111/1365-2664.12513. [DOI] [Google Scholar]
- Hubbell Stephen P. 2001. The Unified Neutral Theory of Biodiversity and Biogeography. Monographs in Population Biology 32. Princeton, N.J.: Princeton University Press. [Google Scholar]
- Hutchinson George E. 1957. “Concluding Remarks.” Cold Spring Harbor Symposia on Quantitative Biology 22: 415–27. 10.1101/SQB.1957.022.01.039. [DOI] [Google Scholar]
- IPBES. 2019. “Global Assessment Report on Biodiversity and Ecosystem Services | IPBES.” Secretariat of the Intergovernmental Science-Policy Platform on Biodiversity and Ecosystem Services. https://ipbes.net/global-assessment-report-biodiversity-ecosystem-services. [Google Scholar]
- Jackson Andrew L., Inger Richard, Parnell Andrew C., and Bearhop Stuart. 2011. “Comparing Isotopic Niche Widths among and within Communities: SIBER – Stable Isotope Bayesian Ellipses in R.” Journal of Animal Ecology 80 (3): 595–602. 10.1111/j.1365-2656.2011.01806.x. [DOI] [PubMed] [Google Scholar]
- Jackson Andrew, and Parnell Andrew. 2020. SIBER: Stable Isotope Bayesian Ellipses in R (version 2.1.5). https://CRAN.R-project.org/package=SIBER. [DOI] [PubMed]
- Jackson Stephen T. 2021. “Transformational Ecology and Climate Change.” Science 373 (6559): 1085–86. 10.1126/science.abj6777. [DOI] [PubMed] [Google Scholar]
- Kelly Luke T., Giljohann Katherine M., Duane Andrea, Núria Aquilué Sally Archibald, Batllori Enric, Bennett Andrew F., et al. 2020. “Fire and Biodiversity in the Anthropocene.” Science 370 (6519). 10.1126/science.abb0355. [DOI] [PubMed] [Google Scholar]
- Kissling W. Daniel, and Carl Gudrun. 2008. “Spatial Autocorrelation and the Selection of Simultaneous Autoregressive Models.” Global Ecology and Biogeography 17 (1): 59–71. 10.1111/j.1466-8238.2007.00334.x. [DOI] [Google Scholar]
- Krefting Laurits W., and Ahlgren Clifford E.. 1974. “Small Mammals and Vegetation Changes after Fire in a Mixed Conifer-Hardwood Forest.” Ecology 55 (6): 1391–98. 10.2307/1935467. [DOI] [Google Scholar]
- Lacher Thomas E., Davidson Ana D., Fleming Theodore H., Gómez-Ruiz Emma P., McCracken Gary F., Owen-Smith Norman, Peres Carlos A., and Vander Wall Stephen B.. 2019. “The Functional Roles of Mammals in Ecosystems.” Journal of Mammalogy 100 (3): 942–64. 10.1093/jmammal/gyy183. [DOI] [Google Scholar]
- Lanier Hayley C, Kulikowski Andy J., Seville R. Scott, Roehrs Zachary P., and Roehrs Meredith A.. 2014. “Succession Effects on Mammal and Invertebrate Communities 26 Years after the 1988 Huckleberry Mountain Fire.” University of Wyoming National Park Service Research Center Annual Report 37 (1): 49–57. [Google Scholar]
- Lanier Hayley C., Moore Lynn M., Roehrs Zachary P., Wangeline Ami L., and Seville R. Scott. 2017. “The Influence of Fire Interval on Community Structure in the Greater Yellowstone Ecosystem.” The UW National Parks Service Research Station Annual Reports 40 (December): 43–49. 10.13001/uwnpsrc.2017.5567. [DOI] [Google Scholar]
- Lemaître Jérôme, Fortin Daniel, Morris Douglas W., and Darveau Marcel. 2010. “Deer Mice Mediate Red-Backed Vole Behaviour and Abundance along a Gradient of Habitat Alteration.” Evolutionary Ecology Research 12 (2): 203–16. [Google Scholar]
- Lobo Nikhil. 2014. “Conifer Seed Predation by Terrestrial Small Mammals: A Review of the Patterns, Implications, and Limitations of Top-down and Bottom-up Interactions.” Forest Ecology and Management 328 (September): 45–54. 10.1016/j.foreco.2014.05.019. [DOI] [Google Scholar]
- Lobo Nikhil, and Millar John S.. 2011. “The Efficacy of Conifer Seeds as Major Food Resources to Deer Mice (Peromyscus maniculatus) and Southern Red-Backed Voles (Myodes gapperi).” Mammalian Biology 76 (3): 274–84. 10.1016/j.mambio.2010.11.004. [DOI] [Google Scholar]
- MacArthur Robert H., and Levins Richard. 1967. “The Limiting Similarity, Convergence, and Divergence of Coexisting Species.” The American Naturalist 101 (921): 377–85. 10.1086/282505. [DOI] [Google Scholar]
- MacArthur Robert H., and Pianka Eric R.. 1966. “On Optimal Use of a Patchy Environment.” The American Naturalist 100 (916): 603–9. [Google Scholar]
- Manlick Philip J., Woodford James E., Zuckerberg Benjamin, and Pauli Jonathan N.. 2017. “Niche Compression Intensifies Competition between Reintroduced American Martens (Martes americana) and Fishers (Pekania pennanti).” Journal of Mammalogy 98 (3): 690–702. 10.1093/jmammal/gyx030. [DOI] [Google Scholar]
- Merritt Joseph F. 1981. “Clethrionomys gapperi.” Mammalian Species, no. 146 (May): 1–9. 10.2307/3503900. [DOI] [Google Scholar]
- Morris Douglas W. 1996. “Coexistence of Specialist and Generalist Rodents via Habitat Selection.” Ecology 77 (8): 2352–64. 10.2307/2265737. [DOI] [Google Scholar]
- Morris Douglas W. 2003. “Toward an Ecological Synthesis: A Case for Habitat Selection.” Oecologia 136 (1): 1–13. [DOI] [PubMed] [Google Scholar]
- Neary Daniel G., Ryan Kevin C., and DeBano Leonard F.. 2005. “Wildland Fire in Ecosystems: Effects of Fire on Soils and Water.” Gen. Tech. Rep. RMRS-GTR-42-Vol.4. Ogden, UT: U.S. Department of Agriculture, Forest Service, Rocky Mountain Research Station. 250 p. 042. 10.2737/RMRS-GTR-42-V4. [DOI] [Google Scholar]
- Newsome Seth D., Yeakel Justin D., Wheatley Patrick V., and Tinker M. Tim. 2012. “Tools for Quantifying Isotopic Niche Space and Dietary Variation at the Individual and Population Level.” Journal of Mammalogy 93 (2): 329–41. 10.1644/11-MAMM-S-187.1. [DOI] [Google Scholar]
- Orrock John L., and Pagels John F.. 2002. “Fungus Consumption by the Southern Red-Backed Vole (Clethrionomys gapperi) in the Southern Appalachians.” The American Midland Naturalist 147 (2): 413–18. [Google Scholar]
- Parnell Andrew, and Jackson Andrew. 2013. Siar: Stable Isotope Analysis in R (version 4.2). https://CRAN.R-project.org/package=siar.
- R Core Team. 2019. R: A Language and Environment for Statistical Computing. Vienna, Austria: R Foundation for Statistical Computing. https://www.R-project.org/. [Google Scholar]
- Riley Karin L., and Loehman Rachel A.. 2016. “Mid-21st-Century Climate Changes Increase Predicted Fire Occurrence and Fire Season Length, Northern Rocky Mountains, United States.” Ecosphere 7 (11): e01543. 10.1002/ecs2.1543. [DOI] [Google Scholar]
- Ripley Brian, Venables Bill, Bates Douglas M., Hornik Kurt (partial port ca 1998), Gebhardt Albrecht (partial port ca 1998), and Firth David. 2020. MASS: Support Functions and Datasets for Venables and Ripley’s MASS (version 7.3–53). https://CRAN.R-project.org/package=MASS.
- Romme William H., Boyce Mark S., Gresswell Robert, Merrill Evelyn H., Minshall G. Wayne, Whitlock Cathy, and Turner Monica G.. 2011. “Twenty Years after the 1988 Yellowstone Fires: Lessons about Disturbance and Ecosystems.” Ecosystems 14 (7): 1196–1215. 10.1007/s10021-011-9470-6. [DOI] [Google Scholar]
- Rosenberg DK, Swindle KA, and Anthony RG. 2003. “Influence of Prey Abundance on Northern Spotted Owl Reproductive Success in Western Oregon.” Canadian Journal of Zoology 81 (10): 1715–25. 10.1139/Z03-167. [DOI] [Google Scholar]
- Rosenzweig Michael L. 1995. Species Diversity in Space and Time. Cambridge; New York: Cambridge University Press. [Google Scholar]
- Schoener TW 1974. “Resource Partitioning in Ecological Communities.” Science 185 (4145): 27–39. 10.1126/science.185.4145.27. [DOI] [PubMed] [Google Scholar]
- Shochat E, Warren PS, Faeth SH, McIntyre NE, and Hope D. 2006. “From Patterns to Emerging Processes in Mechanistic Urban Ecology.” Trends in Ecology & Evolution 21 (4): 186–91. 10.1016/j.tree.2005.11.019. [DOI] [PubMed] [Google Scholar]
- Sikes Robert S. 2016. “2016 Guidelines of the American Society of Mammalogists for the Use of Wild Mammals in Research and Education.” Journal of Mammalogy 97 (3): 663–88. 10.1093/jmammal/gyw078. [DOI] [PMC free article] [PubMed] [Google Scholar]
- Smith Winston P., and Fox Barry J.. 2017. “Habitat Selection, Interspecific Competition, and Coexistence of a Habitat Generalist and Specialist in Temperate Rainforest of Southeastern Alaska.” Northwest Science 91 (2): 103–23. 10.3955/046.091.0204. [DOI] [Google Scholar]
- Stanton Nancy L, Buskirk Steven W, and Miller Steven L. 1991. “Habitat Distribution of Small Mammal Communities in Grand Teton National Park” 15: 7. [Google Scholar]
- Stephens Ryan B., Hobbie Erik A., Lee Thomas D., and Rowe Rebecca J.. 2019. “Pulsed Resource Availability Changes Dietary Niche Breadth and Partitioning between Generalist Rodent Consumers.” Ecology and Evolution 9 (18): 10681–93. 10.1002/ece3.5587. [DOI] [PMC free article] [PubMed] [Google Scholar]
- Stone L, and Roberts A. 1990. “The Checkerboard Score and Species Distributions.” Oecologia 85 (1): 74–79. 10.1007/BF00317345. [DOI] [PubMed] [Google Scholar]
- Turner Monica G., Romme William H., Gardner Robert H., and Hargrove William W.. 1997. “Effects of Fire Size and Pattern on Early Succession in Yellowstone National Park.” Ecological Monographs 67 (4): 411–33. 10.1890/0012-9615(1997)067[0411:EOFSAP]2.0.CO;2. [DOI] [Google Scholar]
- Turner Monica G., Romme William H., and Tinker Daniel B.. 2003. “Surprises and Lessons from the 1988 Yellowstone Fires.” Frontiers in Ecology and the Environment 1 (7): 351–58. 10.2307/3868187. [DOI] [Google Scholar]
- Wilson Edward O. 1961. “The Nature of the Taxon Cycle in the Melanesian Ant Fauna.” American Naturalist 95 (882): 169–93. 10.1086/282174. [DOI] [Google Scholar]
- Wilson Maxwell C., and Smith Andrew T.. 2015. “The Pika and the Watershed: The Impact of Small Mammal Poisoning on the Ecohydrology of the Qinghai-Tibetan Plateau.” Ambio 44 (1): 16–22. 10.1007/s13280-014-0568-x. [DOI] [PMC free article] [PubMed] [Google Scholar]
- Wywialowski AP 1987. “Habitat Structure and Predators: Choices and Consequences for Rodent Habitat Specialists and Generalists.” Oecologia 72 (1): 39–45. [DOI] [PubMed] [Google Scholar]
- Zwolak R, Pearson DE, Ortega YK, and Crone EE. 2012. “Mechanisms Driving Postfire Abundance of a Generalist Mammal.” Canadian Journal of Zoology 90 (1): 51–60. 10.1139/z11-111. [DOI] [Google Scholar]
- Zwolak Rafal. 2009. “A Meta-Analysis of the Effects of Wildfire, Clearcutting, and Partial Harvest on the Abundance of North American Small Mammals.” Forest Ecology and Management 258 (5): 539–45. 10.1016/j.foreco.2009.05.033. [DOI] [Google Scholar]
- Zwolak Rafał. 2018. “How Intraspecific Variation in Seed-Dispersing Animals Matters for Plants.” Biological Reviews 93 (2): 897–913. 10.1111/brv.12377. [DOI] [PubMed] [Google Scholar]
- Zwolak Rafal, and Foresman Kerry R.. 2008. “Deer Mouse Demography in Burned and Unburned Forest: No Evidence for Source-Sink Dynamics.” Canadian Journal of Zoology/Revue Canadienne de Zoologie 86 (2): 83–91. 10.1139/Z07-126. [DOI] [Google Scholar]
Associated Data
This section collects any data citations, data availability statements, or supplementary materials included in this article.