

Summary
Gamma band synchronization can facilitate local and long-range neural communication. In the primary visual cortex, visual stimulus properties within a specific location determine local synchronization strength, while the match of stimulus properties between distant locations controls long-range synchronization. The neural basis for the differential control of local and global gamma band synchronization is unknown. Combining electrophysiology, optogenetics and computational modeling, we found that VIP disinhibitory interneurons in mouse cortex linearly scale gamma power locally without changing its stimulus tuning. Conversely, they suppress long-range synchronization when two regions process non-matched stimuli, tuning gamma coherence globally. Modeling shows that like-to-like connectivity across space and specific VIP→SST inhibition captures these opposing effects. VIP neurons thus differentially impact local and global properties of gamma rhythms depending on visual stimulus statistics. They may thereby construct gamma-band filters for spatially extended but continuous image features, such as contours, facilitating the downstream generation of coherent visual percepts.
ETOC Blurb
Veit et al. show that disinhibitory VIP interneurons shape the spatial structure of visual cortical gamma oscillations which may facilitate interareal communication and the formation of coherent percepts.
Introduction
Synchronized activity is widespread in neural systems, occurring both spontaneously and during sensory stimulation, cognition, and motor action 1–8. In monkeys, synchronization is dependent on stimulus features 9–13 and modulated by behavioral state, such as directed attention 14–17. Synchronization may facilitate neural communication by enhancing the temporal co-incidence of synaptic excitatory potentials in target neurons 6,18. Gamma band synchrony across distant sites in the primary visual cortex (V1) depends on matched stimulus properties processed by the two sites 7,19, suggesting a role in promoting the contextual synthesis of visual percepts downstream. Thus, the tuning of local gamma band power and global gamma band coherence to specific stimuli and contexts may be crucial for its role in cortical computation and perception. Importantly, not only must gamma rhythms be tuned, they must also be scaled appropriately, as excessive synchrony can limit information carrying capacity of neural networks 20,21, and too much or too little synchrony may lead to neurological disorders 22–25. Remarkably, despite detailed knowledge of the phenomenology of cortical oscillations on one hand, and a deep mechanistic and theoretical insight into their underlying synaptic basis on the other 26–28 we have a very limited understanding for the neural circuits that regulate their magnitude and coherence across different sensory and behavioral contexts 14,15. It is also important to note that there is long-standing disagreement on the functional consequences of gamma rhythms in sensory perception. Although resolving this debate has proven challenging, understanding the underlying mechanisms of synchrony generation and its modulation, could provide new inroads to address it 7,10,18,29–33.
Mechanistically, ample evidence indicates that local GABAergic interneurons temporally entrain excitatory neurons by biasing their spike timing to the trough of their periodic inhibitory synaptic potentials 26,27,34–40. This periodicity results from the recurrent interaction between excitatory and inhibitory neurons 35, through direct interneuron-to-interneuron synaptic coupling 41, and through electrical synapses 42–44. Cortical gamma oscillations depend on various types of interneurons, including soma-targeting parvalbumin positive basket cells 45,46. In the mouse primary visual cortex, a visually induced gamma oscillation (25–40 Hz), similar to the widely studied gamma rhythms in higher mammals 9,10,47,48, requires the activity of somatostatin (SST) interneurons 49–51. In V1, SST neuron firing rates strongly correlate with visually induced narrow-band gamma power on a trial-to-trial basis, and optogenetic inactivation of SST neurons (but not PV neurons) nearly abolishes visually evoked gamma oscillations 50. SST neurons are also known to be critical for the encoding of contextual stimuli, such as for gratings that extend beyond neurons’ classical receptive fields 52–55. Notably, a second narrowband gamma oscillation around ~60 Hz that is increased by locomotion and luminance, but strongly suppressed by visual stimuli, is also present in V1 but is not of cortical origin and thus independent of cortical interneurons 50,56–58.
The discovery that VIP interneurons preferentially inhibit other interneurons, especially SST neurons, 59–61 raises the hypothesis that they might regulate the power and stimulus-dependence of gamma band oscillations. Recent work has shown that VIP neurons are suppressed by visual stimuli 54,55,62 that have previously been shown to drive strong gamma oscillations 9,11,50, but no direct link has been established. In particular, large, high contrast and iso-oriented gratings potently drive gamma rhythms in V1, but simultaneously suppress VIP activity. Conversely, small, low contrast, cross-oriented gratings weakly induce gamma rhythms, but drive strong VIP firing. These results raise the hypothesis that while SST neurons induce gamma rhythms by inhibiting pyramidal cells, VIP neurons tune the gamma rhythm to specific stimulus features by modulating SST neurons. If so, this would establish VIP-mediated disinhibition as a crucial regulator of local gamma band synchronization.
In this study we tested whether VIP neurons play a role in tuning gamma power locally and synchrony globally across the retinotopic map (hereafter termed global coherence) via their disinhibitory action in the cortical microcircuit. Specifically, if VIP neurons suppress SST neurons, they would reduce local gamma power and this may also serve to reduce global coherence. However, the efficacy with which VIP neuron activity suppresses global coherence may depend upon whether the stimulus features in distant sites conflict or match. To test this idea we combined multi-site, multi-electrode array recordings and optogenetics in awake mice with computational modeling of the superficial layers of the V1 network. We found that VIP suppression only scaled the gain of local gamma band synchronization, but did not alter its tuning, contrary to expectations. Conversely, we found that VIP suppression enhanced the global coherence between distant sites in V1 preferentially when those sites were processing non-matched stimulus features. Remarkably, VIP activity could simultaneously suppress gamma power locally but selectively permit gamma coherence globally for large, homogenous textures. This demonstrates a stimulus-dependent decoupling between the local and global properties of gamma oscillations. A computational model of L2/3 in mouse V1 captures all of these findings with only the minimal conditions of like-to-like connectivity across space and selective inhibition of SST by VIP. The ubiquity of these features throughout cortex suggest that our findings may generalize beyond the visual system.
Results
VIP neurons locally control the gain but not the tuning of visually induced gamma oscillations in V1
In primates, cats, and humans, visual stimuli can induce potent oscillations in the gamma band (20–90 Hz), yet the strength of these rhythms depends on the properties of the visual stimulus 9,10,13,47,48,63–65 and the brain state 14,66. To probe the neural mechanisms of gamma rhythms in mouse primary visual cortex (V1), we presented head-fixed, awake, locomoting mice with drifting gratings varying in size, contrast, or the orientation of the grating surround relative to the center. We inserted one or two laminar multielectrode arrays into the superficial layers of the primary visual cortex to record both isolated single units and the local field potential (LFP) and used optogenetic perturbations to probe the underlying circuit mechanisms (Fig. 1A). Visual stimuli potently and specifically induced narrow band gamma oscillations (~30 Hz), and gamma power rose monotonically with stimulus contrast and size, (Fig 1 B–D, G–I), but decreased as the relative angle of orientation between the center and surround was increased (Fig 1 L–N). These effects in the LFP were mirrored by those in the phase-locking of isolated single units (Fig. 2) confirming that they were mediated by local changes in spike synchrony. Although not a definitive classification, regular spiking (RS) units often correspond to excitatory neurons while fast spiking (FS) units often correspond to parvalbumin-expressing fast spiking inhibitory cells. In general, we observed qualitatively similar effects on both RS and FS units, both here and below. Gamma power across these stimulus dimensions was also strongly modulated by behavioral state with much stronger gamma power during quiescent periods as compared to running (Fig. S1).
Figure 1: VIP neurons locally control the gain but not the tuning of visually induced gamma oscillations.
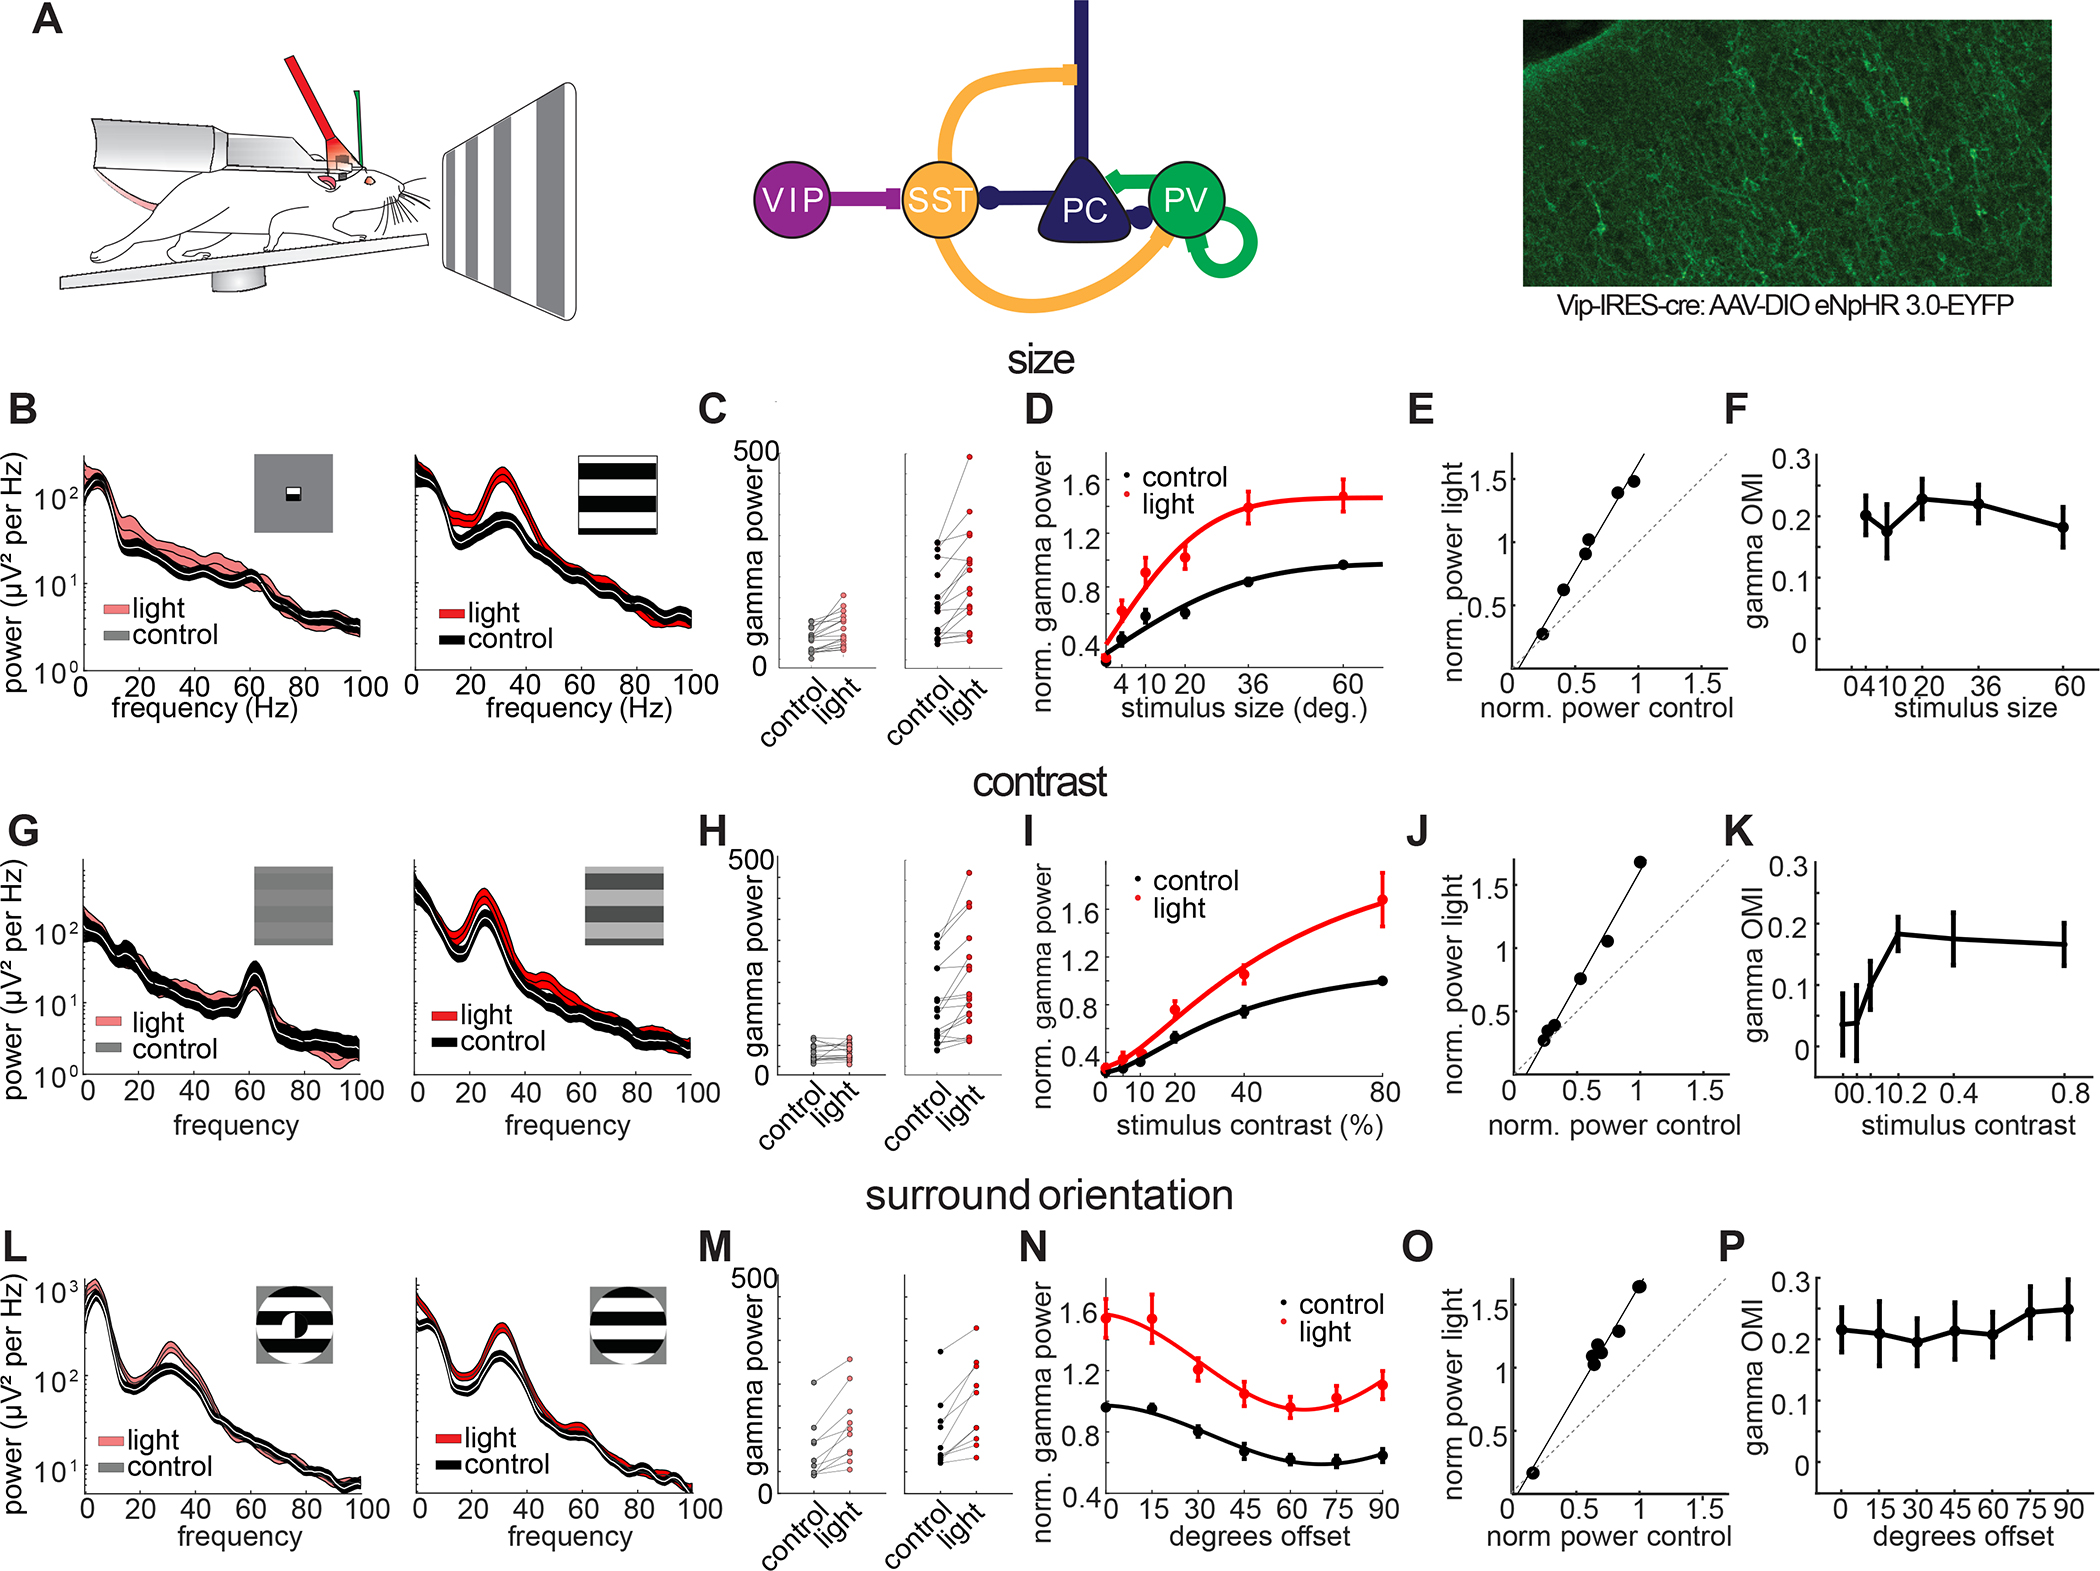
A: Left: Schematic of a head-fixed mouse on a running wheel with an optic fiber over the visual cortex and a laminar multi-electrode array in V1. Middle: Simplified circuit diagram with VIP neurons disinhibiting PCs from SST inhibition. Right: Example image of a V1 brain section from a VIP-Cre mouse injected with a Cre-dependent AAV virus driving eNpHR3.0-YFP. B: Left: example LFP power spectrum in response to a small (4°) drifting grating with (red hue) and without (gray) light mediated suppression of VIP neurons (thickness of line denotes mean ± standard error). Right: same recording site in response to a large (60°) drifting grating. C: Left: plot comparing the gamma power for small gratings with and without light (n = 17, p < 0.001, Wilcoxon signed rank test). Right: same plot comparing the gamma power for large gratings with and without light (n = 17, p < 0.001, Wilcoxon signed rank test). D: Average normalized gamma power with (red) and without (black) optogenetic suppression of VIP neurons versus stimulus size (n = 17, 2-way-ANOVA: main effect of light: p < 0.001; main effect of size: p < 0.001; interaction: p = 0.017). E: Scatter plot of average gamma power in control vs. light across different stimulus sizes and linear fit (black line, R2 = 0.90 ± 0.02, slope = 1.65 ± 0.18, y-intercept = 0.38 ± 6.61). F: Average optogenetic modulation index (OMI) across stimulus conditions. Correlation of OMI with stimulus size: r = −0.13, p = 0.83. G,H: Same as B,C but for low (5%) and high (80%) contrast drifting gratings (low: n = 18, p = 0.45, Wilcoxon signed rank test, high: n = 18, p < 0.001, Wilcoxon signed rank test). I: Same as D but across different stimulus contrast levels (n = 18, 2-way-ANOVA: main effect of light: p<0.001; main effect of contrast: p<0.001; interaction: p < 0.001). J: Same as E across different stimulus contrast levels (R2 = 0.87 ± 0.05, slope = 1.52 ± 0.22, y-intercept = −9.0 ± 6.19). K: Same as F across different contrast levels: Correlation of OMI with stimulus contrast: r: 0.69, p: 0.13. L,M: Same as B,C but for cross surround (90° offset) and iso surround (0°) offset drifting gratings (cross: n = 10, p = 0.002, Wilcoxon signed rank test, iso: n = 10, p = 0.002, Wilcoxon signed rank test). N: Same as D but across different offset angles between center and surround grating (n = 10, 2-way-ANOVA: main effect of light: p < 0.001; main effect of orientation: p < 0.001; interaction: p = 0.57). O: Same as E across different offset angles between center and surround grating (R2 = 0.82 ± 0.04, slope = 1.61 ± 0.16, y-intercept = −3.86 ± 8.23). P: Same as F across different offset angles between center and surround grating. Correlation of OMI with offset angle: r: 0.71, p: 0.074.
Figure 2: VIP neurons control the strength of locking of single neurons to the visually induced gamma rhythm.
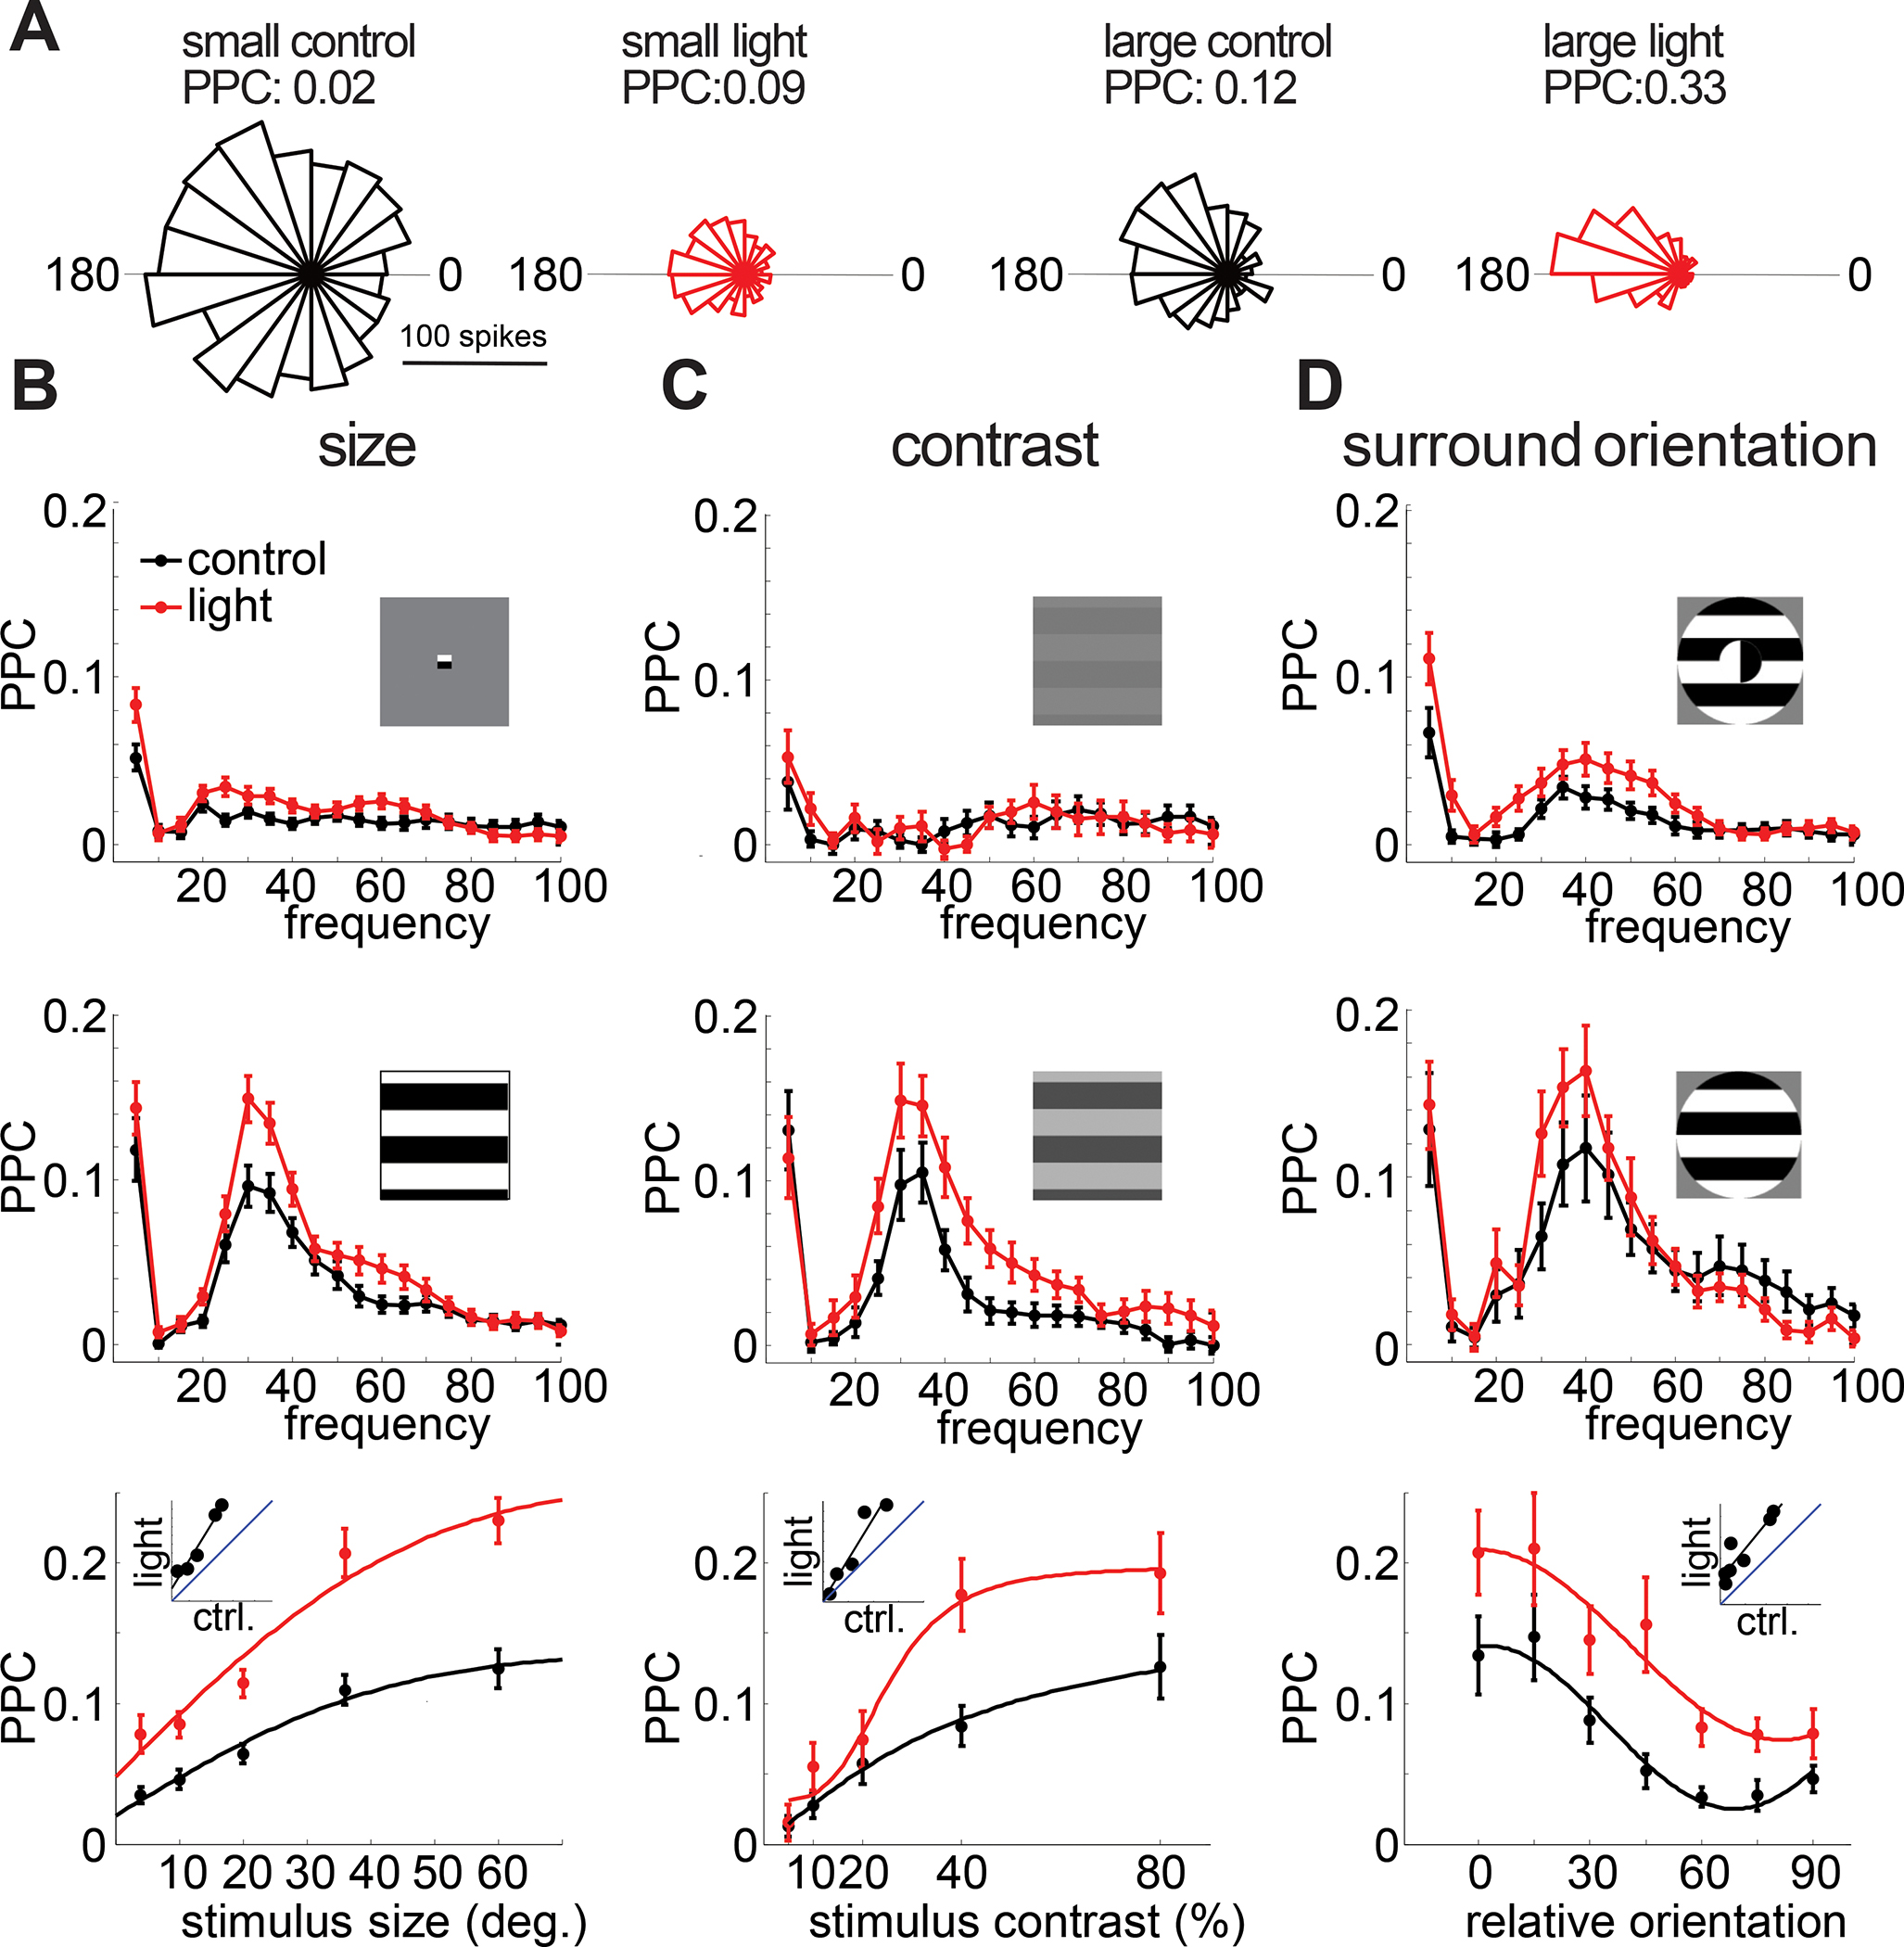
A: Phase histogram of the spikes of an example L2/3 RS neuron relative to the gamma oscillation in various conditions. From left to right: For stimulation with a small (4°) grating during control (black) and during inactivation of VIP neurons (red) and for stimulation with a large (60°) grating during control (black) and during inactivation of VIP neurons (red). B: Top: average PPC spectra for L2/3 RS units with (red) and without (black) suppression of VIP neurons (n = 78 units) for small (4°) stimuli. Middle: average PPC spectra for L2/3 RS units with (red) and without (black) suppression of VIP neurons (n = 68 units) for large (60°) stimuli. Bottom: Plot of average PPC versus stimulus size with (red) and without (black) light-mediated inactivation of VIP neurons (n = 87 units, 2-way ANOVA: main effect of light: p < 0.001; main effect of size: p < 0.001; interaction: p = 0.014). C: Top: average PPC spectra for L2/3 RS units with (red) and without (black) suppression of VIP neurons (n = 27 units) for low contrast (5%) stimuli. Middle: average PPC spectra for L2/3 RS units with (red) and without (black) suppression of VIP neurons (n = 30 units) for high contrast (80%) stimuli. Bottom: Plot of average PPC versus stimulus contrast with (red) and without (black) inactivation of VIP neurons (n = 29 units, 2-way ANOVA: main effect of light: p<0.001; main effect of contrast: p < 0.001; interaction: p = 0.072). D: Top: average PPC spectra for L2/3 RS units with (red) and without (black) suppression of VIP neurons (n = 46 units) for cross surround (90° offset) stimuli. Middle: average PPC spectra for L2/3 RS units with (red) and without (black) suppression of VIP neurons (n = 21 units) for iso surround (0° offset) stimuli. Bottom: Plot of average PPC of L2/3 RS units versus relative surround orientation with (red) and without (black) inactivation of VIP neurons (n = 28 units, 2-way ANOVA: main effect of light: p < 0.001; main effect of orientation: p < 0.001; interaction: p = 0.66). Error bars in all plots represent s.e.m.
For three reasons we hypothesized that cortical VIP neurons might be crucial for the strong feature and behavioral dependence of visually induced gamma rhythms. First, VIP neurons potently inhibit SST neurons 59 and SST activity has been shown to be critical for visually driven gamma oscillations in V1 50. Second, prior work has argued that VIP neurons contribute to cortical gain changes associated with locomotion and arousal by disinhibiting pyramidal neurons via their inhibition of SST cells 67–69 similar to what we observed for gamma power. Third, across visual stimuli, VIP neurons’ activity has been reported to be lowest when we find gamma power to be the highest: VIP neurons are suppressed by high contrast, suppressed by large gratings, and suppressed by iso-oriented as compared to cross-oriented gratings 54,55,62. To probe this last notion directly, we correlated gamma power measured electrophysiologically to average SST and VIP neuron activity measured with two-photon imaging in a separate set of mice. While SST neuron activity was highest in conditions that showed high gamma power (r: 0.76, p: 0.019), VIP neuron activity was lowest (r: −0.84, p: 0.005) and vice versa (Fig. S2).
These results raise the hypothesis that VIP neurons might actively tune gamma power to the contrast, size and surround orientation of gratings. If so, this would be in line with recent reports that argue that VIP neurons actively tune the firing rates of pyramidal cells across contrast 62 and center/surround orientation 54. To test this notion, we optogenetically suppressed VIP neurons via Cre-dependent expression of the optogenetic silencer eNpHR3.0. Post-mortem histological analysis revealed widespread expression of eNpHR3.0 in superficial interneurons with bipolar morphology (Figure 1A, right). Illumination of the visual cortex in these mice resulted in significant enhancements in narrowband gamma power (20–40 Hz) across visual stimulus size, contrast, and center/surround orientation (Figure 1). Strikingly, VIP neuron suppression multiplicatively enhanced gamma power across all feature dimensions, thereby scaling the gain of neural synchronization while preserving the tuning to contrast, size and center/surround orientation dependence (Fig. 1E,J,O). We verified this by calculating the optogenetic modulation index (OMI) (powerlight − powercontrol)/(powerlight + powercontrol), which is invariant to multiplicative gain changes. The OMI showed no significant correlation with either size (r: −0.11, p = 0.87, Fig 1F), contrast (r: 0.62, p = 0.19, Fig. 1 K), or surround orientation (r: 0.71, p= 0.07, Fig. 1P). Moreover, gamma power in control vs. light conditions for individual animals was well fit by a simple linear model (Fig. 1E,J,O) and showed good agreement with a multiplicative scaling including a slope significantly > 1 (size: n = 17 mice, p = 0.001; contrast: n = 18 mice, p = 0.003; surround orientation: n = 10 mice, p = 0.002; Wilcoxon signed rank tests) and y-intercept not different from 0 (size: p = 0.65; contrast: p = 0.78; surround orientation: p = 0.85; Wilcoxon signed rank tests). Thus, contrary to expectations based on these prior studies, our results negate the hypothesis that VIP activity generates the strong feature-dependence of gamma band synchronization in V1. The increases in gamma power were mirrored by increases in the phase locking of isolated single RS and FS unit spiking activity (Fig. 2, Fig. S3).
Optogenetically suppressing VIP neurons had no effect on the higher frequency (55–65 Hz) narrowband gamma oscillation derived from sub-cortical circuits, demonstrating a specific role of VIP in controlling stimulus-induced cortical gamma synchronization only (Fig. S4).
Since locomotion also controls the gain of visually evoked activity in V1 70 and potently reduces visually induced gamma oscillations (Fig. S1), we asked whether VIP neurons contribute to the behavioral dependence of gamma band synchronization. We found that suppressing VIP neurons strongly enhanced gamma band power and phase coupling of V1 units across both locomoting and quiescent states (Fig. 3A–C, 3-way ANOVA with factors light, locomotion and stimulus with post-hoc testing, all p<0.001), but preferentially during locomotion. This was evidenced by a significant reduction of the behavioral modulation index (BMI), with suppression of VIP cells (Fig. 3D–F), as well as a lower OMI (Fig. 3G–I) during quiescence across stimulus sizes and center/surround offset angles, demonstrating that VIP neurons regulate the behavioral modulation of network synchronization in mouse V1. Across different contrast levels the trend of reduced OMI and RMI did not reach significance.
Figure 3: VIP neurons contribute to the behavioral dependence of gamma band synchronization.
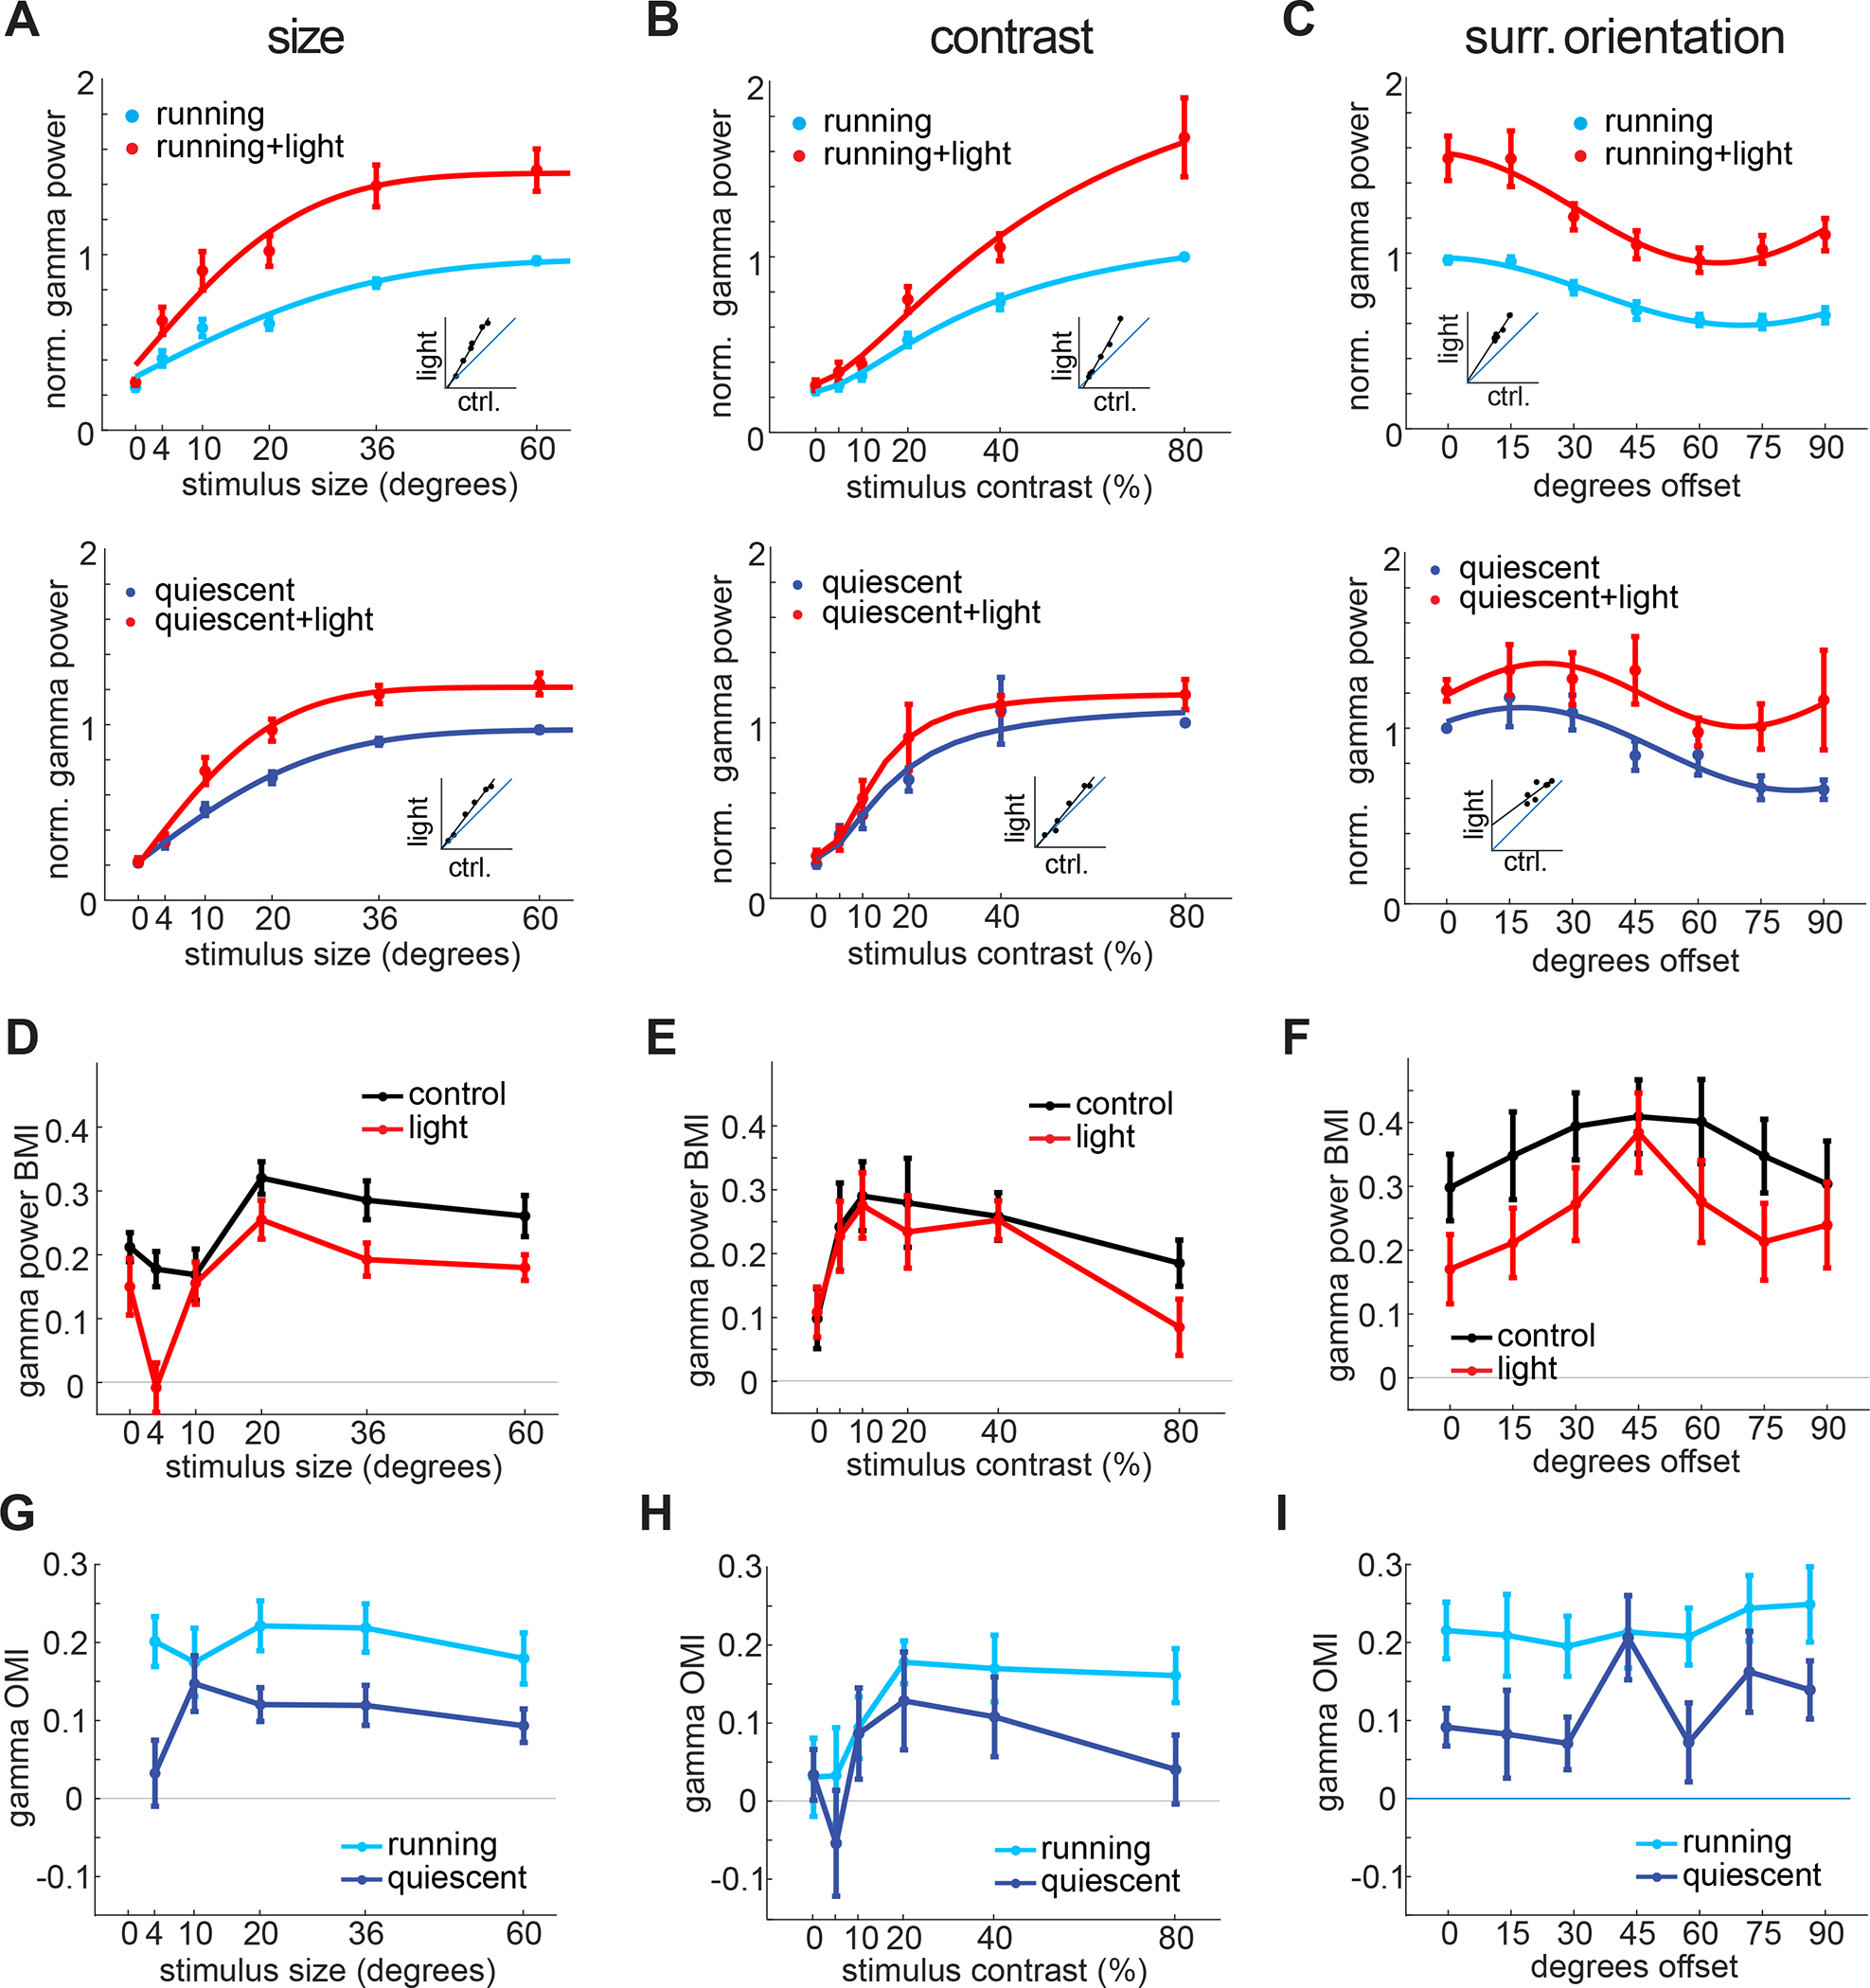
A: Top: Average normalized gamma power as a function of stimulus size with (red) and without optogenetic suppression of VIP neurons during running (replotted from Fig. 1D for comparison) Bottom: Same for quiescent (dark blue, normalized to own max, n = 21 mice), 3-way-ANOVA: main effect of light: p < 0.001; main effect of size: p < 0.001; main effect of running: p < 0.001; light-size-interaction: p = 0.02; size-running-interaction: p < 0.001; light-running-interaction: p = 0.58; three-way-interaction: p = 0.99). B: Same as A across different contrast levels (Top: replotted from Fig. 1I, Bottom: n = 13 mice, 3-way-ANOVA: main effect of light: p < 0.001; main effect of contrast: p < 0.001; main effect of running: p < 0.001; size-light-interaction: p = 0.02; size-running-interaction: p = 0.003; running-light-interaction: p = 0.35; three-way-interaction: p = 0.40). C: Same as A across different offset angles between center and surround (Top: running, replotted from Fig 1N, Bottom: quiescent, n = 7 mice, 3-way-ANOVA: main effect of light: p < 0.001; main effect of rel. orientation: p < 0.001; main effect of running: p < 0.001; rel. orientation-light-interaction: p = 0.90; rel. orientation-running-interaction: p = 0.31; light-running-interaction: p = 0.84; three-way-interaction: p = 0.83). D: Average gamma power behavioral modulation index (BMI) as a function of stimulus size with (red) and without (black) optogenetic suppression of VIP neurons (n = 14 mice, 2-way-ANOVA: main effect of light: p < 0.001; main effect of size: p < 0.001; interaction: p = 0.41). E: Same as D as a function of stimulus contrast (n = 13 mice, 2-way-ANOVA: main effect of light: p = 0.56; main effect of contrast: p = 0.036; interaction: p = 0.93). F: Same as D as a function of relative surround angle (n = 8 mice, 2-way-ANOVA: main effect of light: p = 0.006; main effect of orientation: p = 0.31; interaction: p = 0.98). G: OMI as a function of stimulus size during running (light blue) and quiescence (dark blue, n = 14 mice, 2-way-ANOVA: main effect of light: p < 0.001; main effect of size: p = 0.56; interaction: p = 0.49). H: Same as G as a function of stimulus contrast (n = 13 mice, 2-way-ANOVA: main effect of light: p = 0.11; main effect of contrast: p = 0.040; interaction: p = 0.89). I: Same as G as a function of offset angle between center and surround (n = 8 mice, 2-way-ANOVA: main effect of light: p < 0.001; main effect of surround angle: p = 0.47; interaction: p = 0.86).
Taken together, these results demonstrate that locally, VIP neurons scale the power of gamma band rhythms both as a function of the stimulus and as a function of brain state. Yet contrary to expectations, they appear to play no role in the tuning of gamma band power to any of these features.
VIP neurons globally tune the coherence of V1 ensembles
One of the most striking features of V1 gamma band oscillations is that they preferentially synchronize distant neurons that are processing separate parts of a stimulus with common properties, such as the same orientation and direction of motion 47, indicative of belonging to a common object. The mechanisms for this fundamental phenomenon remain largely unknown. Optogenetically suppressing SST neurons strongly reduces this global coherence 50, but this could be a simple consequence of the strong suppression of local gamma rhythms at both locations. One possibility is that VIP neurons preferentially suppress global coherence when the stimulus features between two retinotopic locations conflict, but permit coherence when those features are shared. To test this, we placed one multielectrode array in the retinotopic region corresponding to the center of the grating, and one in a distal region representing the surround (Fig. 4A, average electrode separation: 530 ± 90 μm (n = 7/10 mice with both tracts clearly visible in histology), 15±6 visual degrees separation across the reported data set (n = 10 mice, Fig. S5). Similar to findings in cats 47, large, homogeneous (‘iso-oriented’) drifting gratings drove highly coherent LFP gamma oscillations between the two separate sites (Fig. 4B top, 4D). However, when the grating orientation for the two separated electrode arrays was orthogonal (‘cross-oriented’), coherence in the gamma frequency band, dropped substantially (Fig. 4B bottom, 4C,E: 25.4 ± 7.6%, p = 0.008, Wilcoxon signed rank test). This impact of VIP suppression on coherence for cross-oriented gratings was highly specific to the visually induced gamma band (~30 Hz, Fig. 4D–E). If VIP neurons would simply reduce coherence according to the reduction in gamma power, we would expect coherence to increase similarly for both matched (iso) and non-matched (cross) stimulus features. However, optogenetically suppressing VIP neurons significantly increased coherence for cross-oriented gratings (Fig. 4G, 21.9 ± 10.0%, p = 0.039, n = 9, Wilcoxon signed rank test) but had no impact on global coherence for iso-oriented gratings (Fig. 4F, −1.5±4.6%, p = 1, n = 9, Wilcoxon signed rank test). The optogenetic modulation index for coherence showed a significant correlation with surround orientation offset (Fig. 4J, r: 0.81 p: 0.026). Linear regression of coherence in the control vs. the light condition showed a slope significantly < 1 (0.74±0.09, p = 0.004, n = 9, Wilcoxon signed rank test) and a significantly positive y-intercept (0.17 ± 0.04, p = 0.004, n = 9, Wilcoxon signed rank test), not in line with multiplicative scaling (Fig. 4I). Instead, the stronger optogenetic effect at non-matched orientations (Fig. 4H,J) points to a detuning of gamma coherence with VIP inactivation. This supports the idea that VIP cells contribute to the difference in coherence between matched and non-matched surrounds. Importantly, the regression slopes for coherence were significantly different from those for power (Fig 4K, p = 0.004, n = 9, Wilcoxon signed rank test).
Figure 4: VIP neurons globally tune the coherence of visual ensembles.
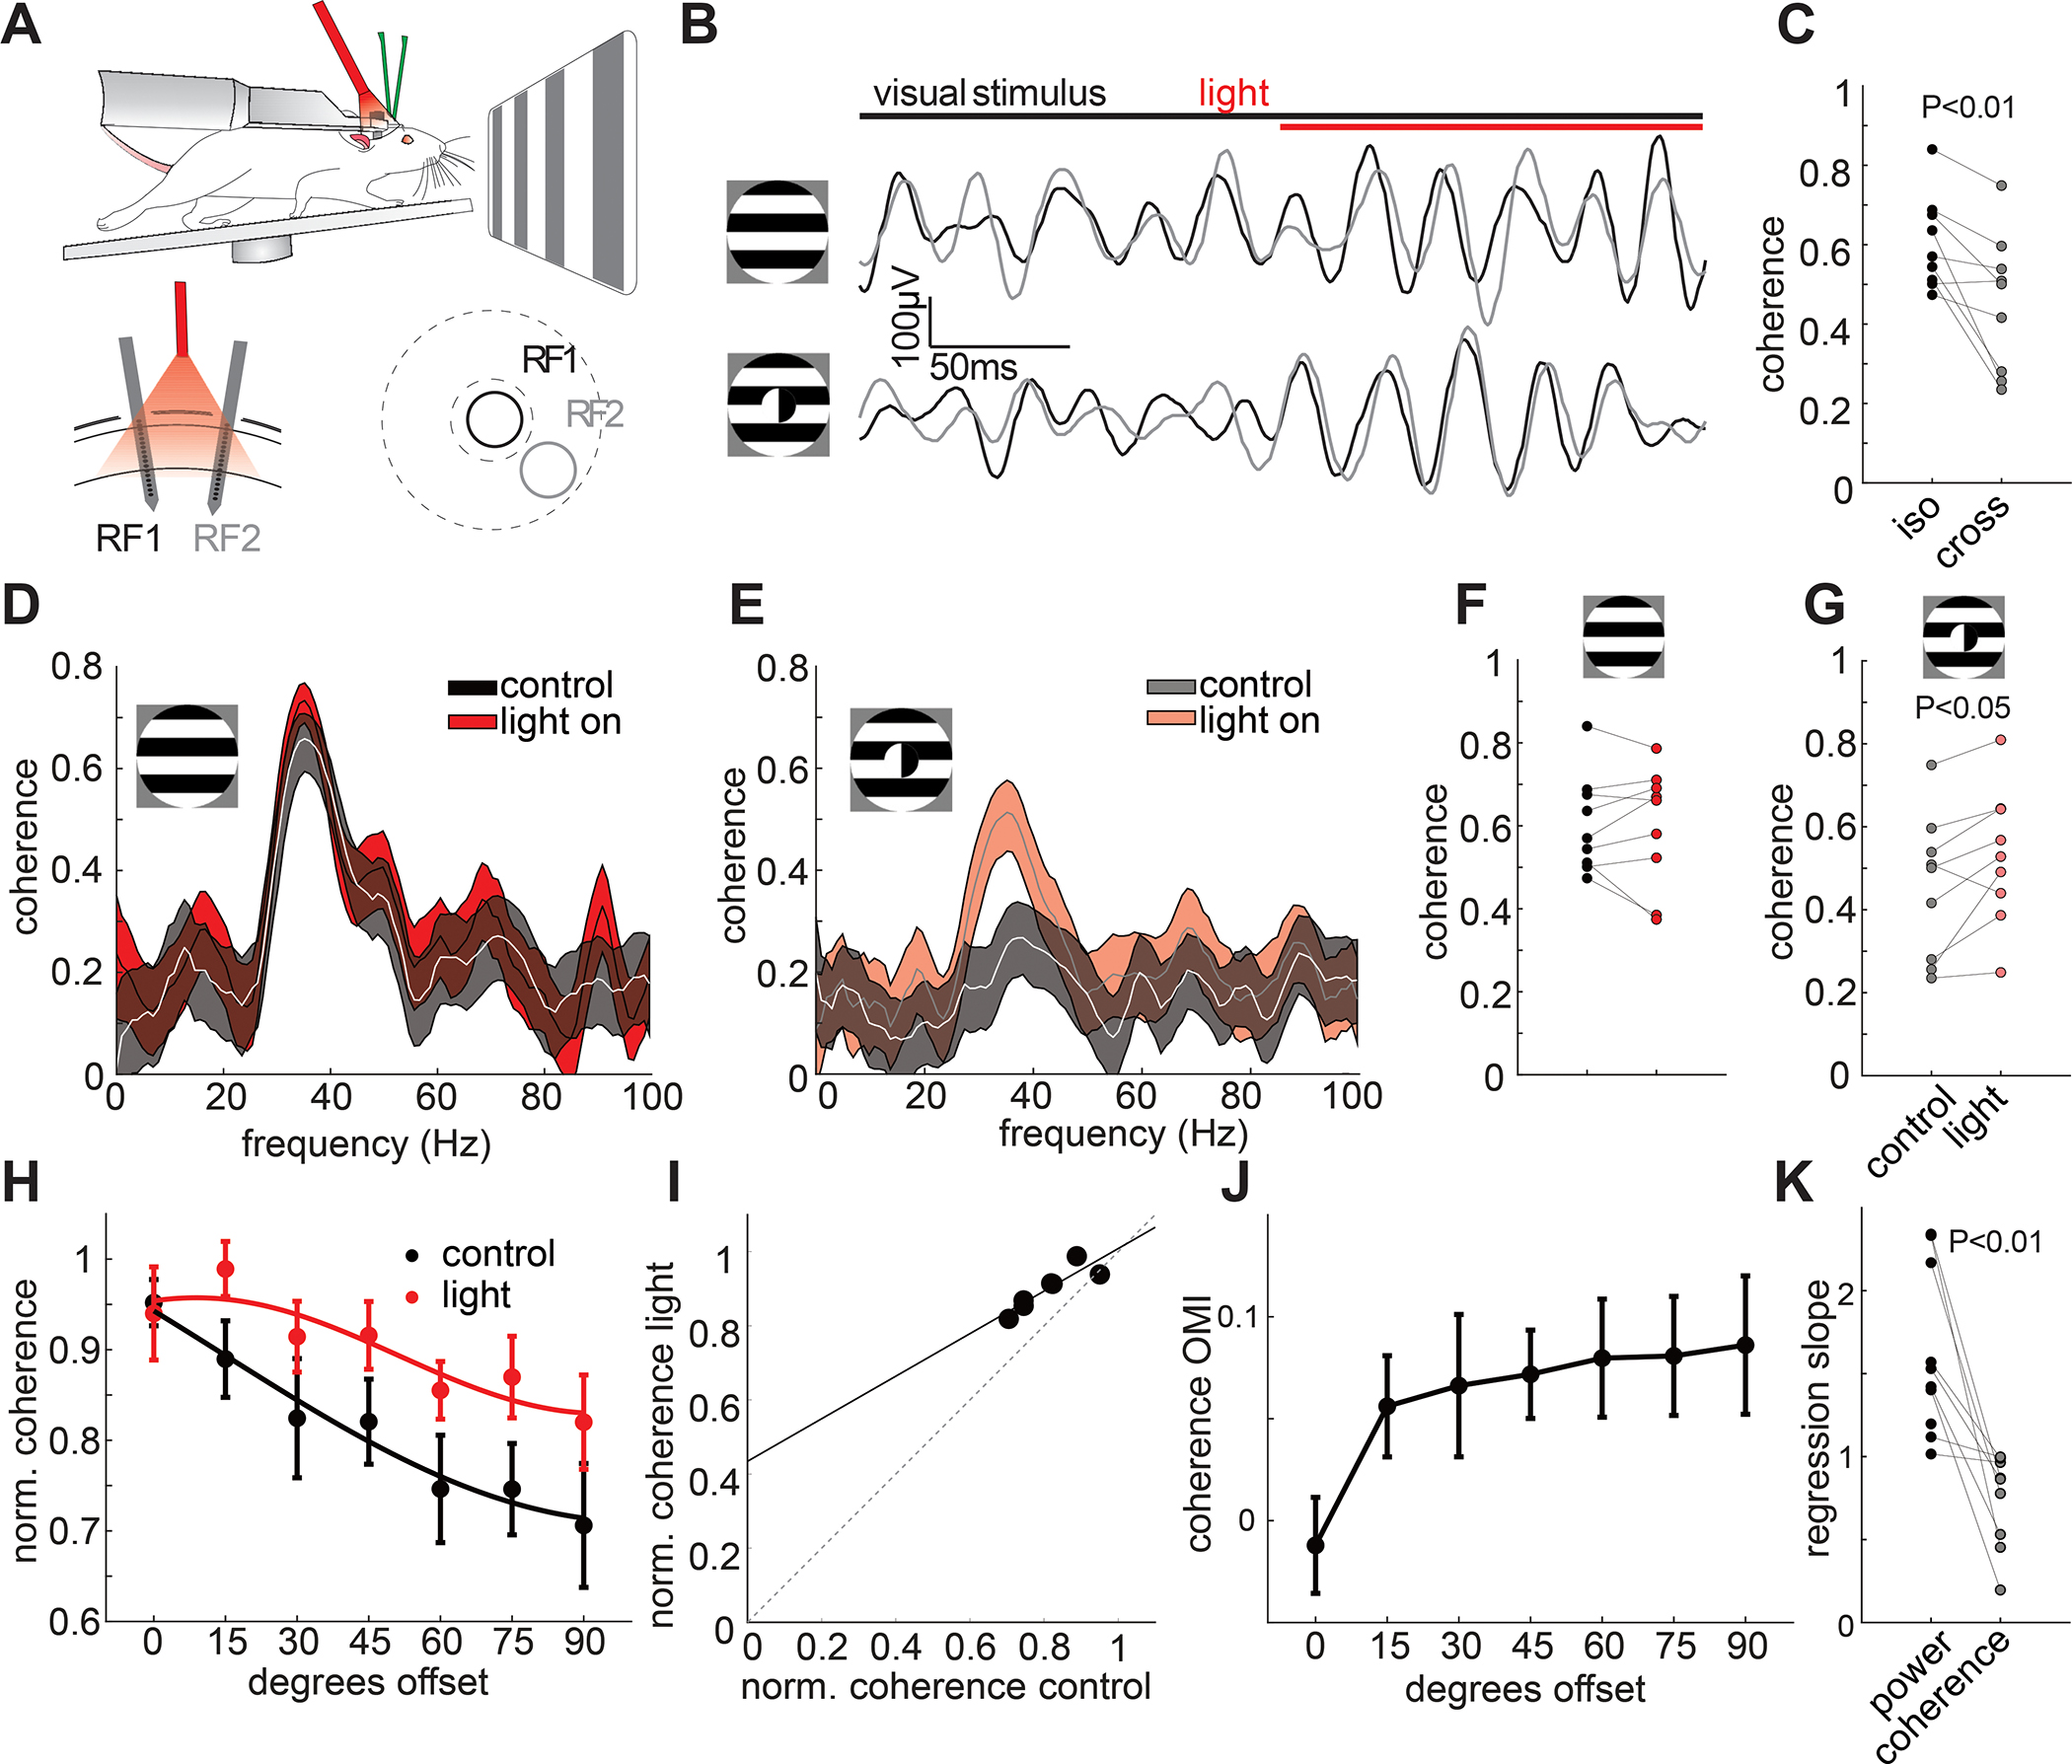
A: Top: recording schematic with two independent laminar probes in V1 of awake, head-fixed VIP-Cre mice. Bottom left: Schematic of the multielectrode array recording configuration with two laminar arrays in distant sites (530 ± 90 μm apart, histology from n = 7 mice) recorded from two separate receptive fields (RF1 and RF2, 15° ± 3° of visual angle separation, n = 11 mice). Bottom right: schematic of the receptive fields’ locations on the two laminar probes. The center and surround of the gratings are indicated with dashed lines. B: Example filtered LFP traces in response to an iso (0° offset, top) and a cross (90° offset, bottom) oriented surround relative to the center. Traces from the center recording site are plotted in black, traces from the surround in gray. The onset of light to suppress VIP cell activity is shown as a red bar on top. C: Plot comparing the LFP gamma band coherence for iso-oriented to cross-oriented surround stimuli (n = 9 mice, P = 0.008, Wilcoxon signed rank test). D: Example LFP coherence spectrum in response to an iso-oriented drifting grating with (red hue) and without (gray) light mediated suppression of VIP neurons (thickness of line denotes mean ± standard error). E: Same as D for cross-oriented gratings. F: Plot comparing the LFP gamma band coherence for iso-oriented surround stimuli for control (black) and VIP inactivation (red) trials (n = 9 mice, p = 1, Wilcoxon signed rank test) G: Same as E for cross-oriented surround stimuli (n = 9 mice, p = 0.039, Wilcoxon signed rank test). H: Plot of average normalized coherence versus relative surround orientation with (red) and without (black) inactivation of VIP neurons (n = 9 mice, 2-way ANOVA: main effect of light: p = 0.0015; main effect of offset angle: p = 0.0016; interaction: p = 0.87). Error bars represent s.e.m. I: Scatter plot of average gamma coherence in control vs. light across different offset angles between center and surround and linear fit (black line). J: Average optogenetic modulation index (OMI) across stimulus conditions. Correlation of OMI with offset angle: r = 0.81, p = 0.026. K: Plot comparing the slope of the linear fits between gamma power (black) and coherence (gray, n = 9 mice, p = 0.004, Wilcoxon signed rank test).
These results demonstrate that VIP neurons critically contribute to long-range synchronization of primary visual cortical ensembles: they preferentially suppress synchrony when the stimulus features for distant ensembles do not match. Remarkably, even though VIP neuron suppression profoundly enhanced local gamma power in response to iso-oriented gratings (see Fig. 1L–N), it did not significantly increase coherence. Note that the lack of an increase in coherence for iso-oriented stimuli was not due to a ceiling effect, as the measured coherence was substantially less than the theoretical maximum of 1 (mean coherence iso: 0.60±0.04, mean coherence iso+light: 0.60±0.05, Fig. 4C). This demonstrates that the local and global properties of stimulus induced gamma oscillations in the visual cortex can be uncoupled: VIP neurons generally suppress the strength of gamma rhythms for all stimuli, but they only suppress the coherence of gamma rhythms when the features being processed by two distant sites in V1 conflict.
Computational modeling of V1 explains VIP neurons’ role in local and global gamma synchronization
To gain insight into how VIP neurons might scale gamma power locally but regulate gamma coherence globally we developed a computational model of layer 2/3 of mouse V1 composed of its four primary cell types modeled by integrate-and-fire spiking dynamics (Fig. 5A). Neurons were connected according to well-known rules (see STAR Methods), though to maintain simplicity, VIP neurons only targeted SST neurons and were themselves driven exclusively by an external (untuned) bias input. A model where VIP neurons received tuned input (e.g., as a function of contrast as shown in Fig. S2) led to the same qualitative results, with little variation quantitatively (Fig. S6). To account for stimulus size, multiple discrete retinotopic circuits were connected via horizontal excitatory connections, the strength of which was larger for iso-tuned center and surround populations compared to cross-tuned populations (Fig. 5A). The model produced stochastic spiking dynamics that readily generated robust population gamma rhythms (Fig. 5B). The summed population activity was well-captured by a mean-field approximation which is constructed from linearized neuronal responses (Fig. 5C–D, compare the simulation points to the smooth lines computed from the theory; see STAR Methods and Methods S1). Despite only including a subset of key features of the mouse V1 network, these gamma rhythms scaled with stimulus strength (≈contrast), size, and center/surround orientation in a qualitatively similar fashion as our experimental results (Fig. 5E–J, gray curves). Moreover, reducing VIP activity to mimic the effects of optogenetically suppressing VIP neurons yielded qualitatively similar impacts on gamma power across stimulus dimensions (Fig. 5E–J, red curves). This shows that a fairly minimal model captures the core phenomenology of visually induced gamma rhythms in V1 and could qualitatively predict the scaling of gamma power across stimulus space by VIP neurons.
Figure 5: Minimal computational model captures VIP neurons’ role in controlling gamma power.
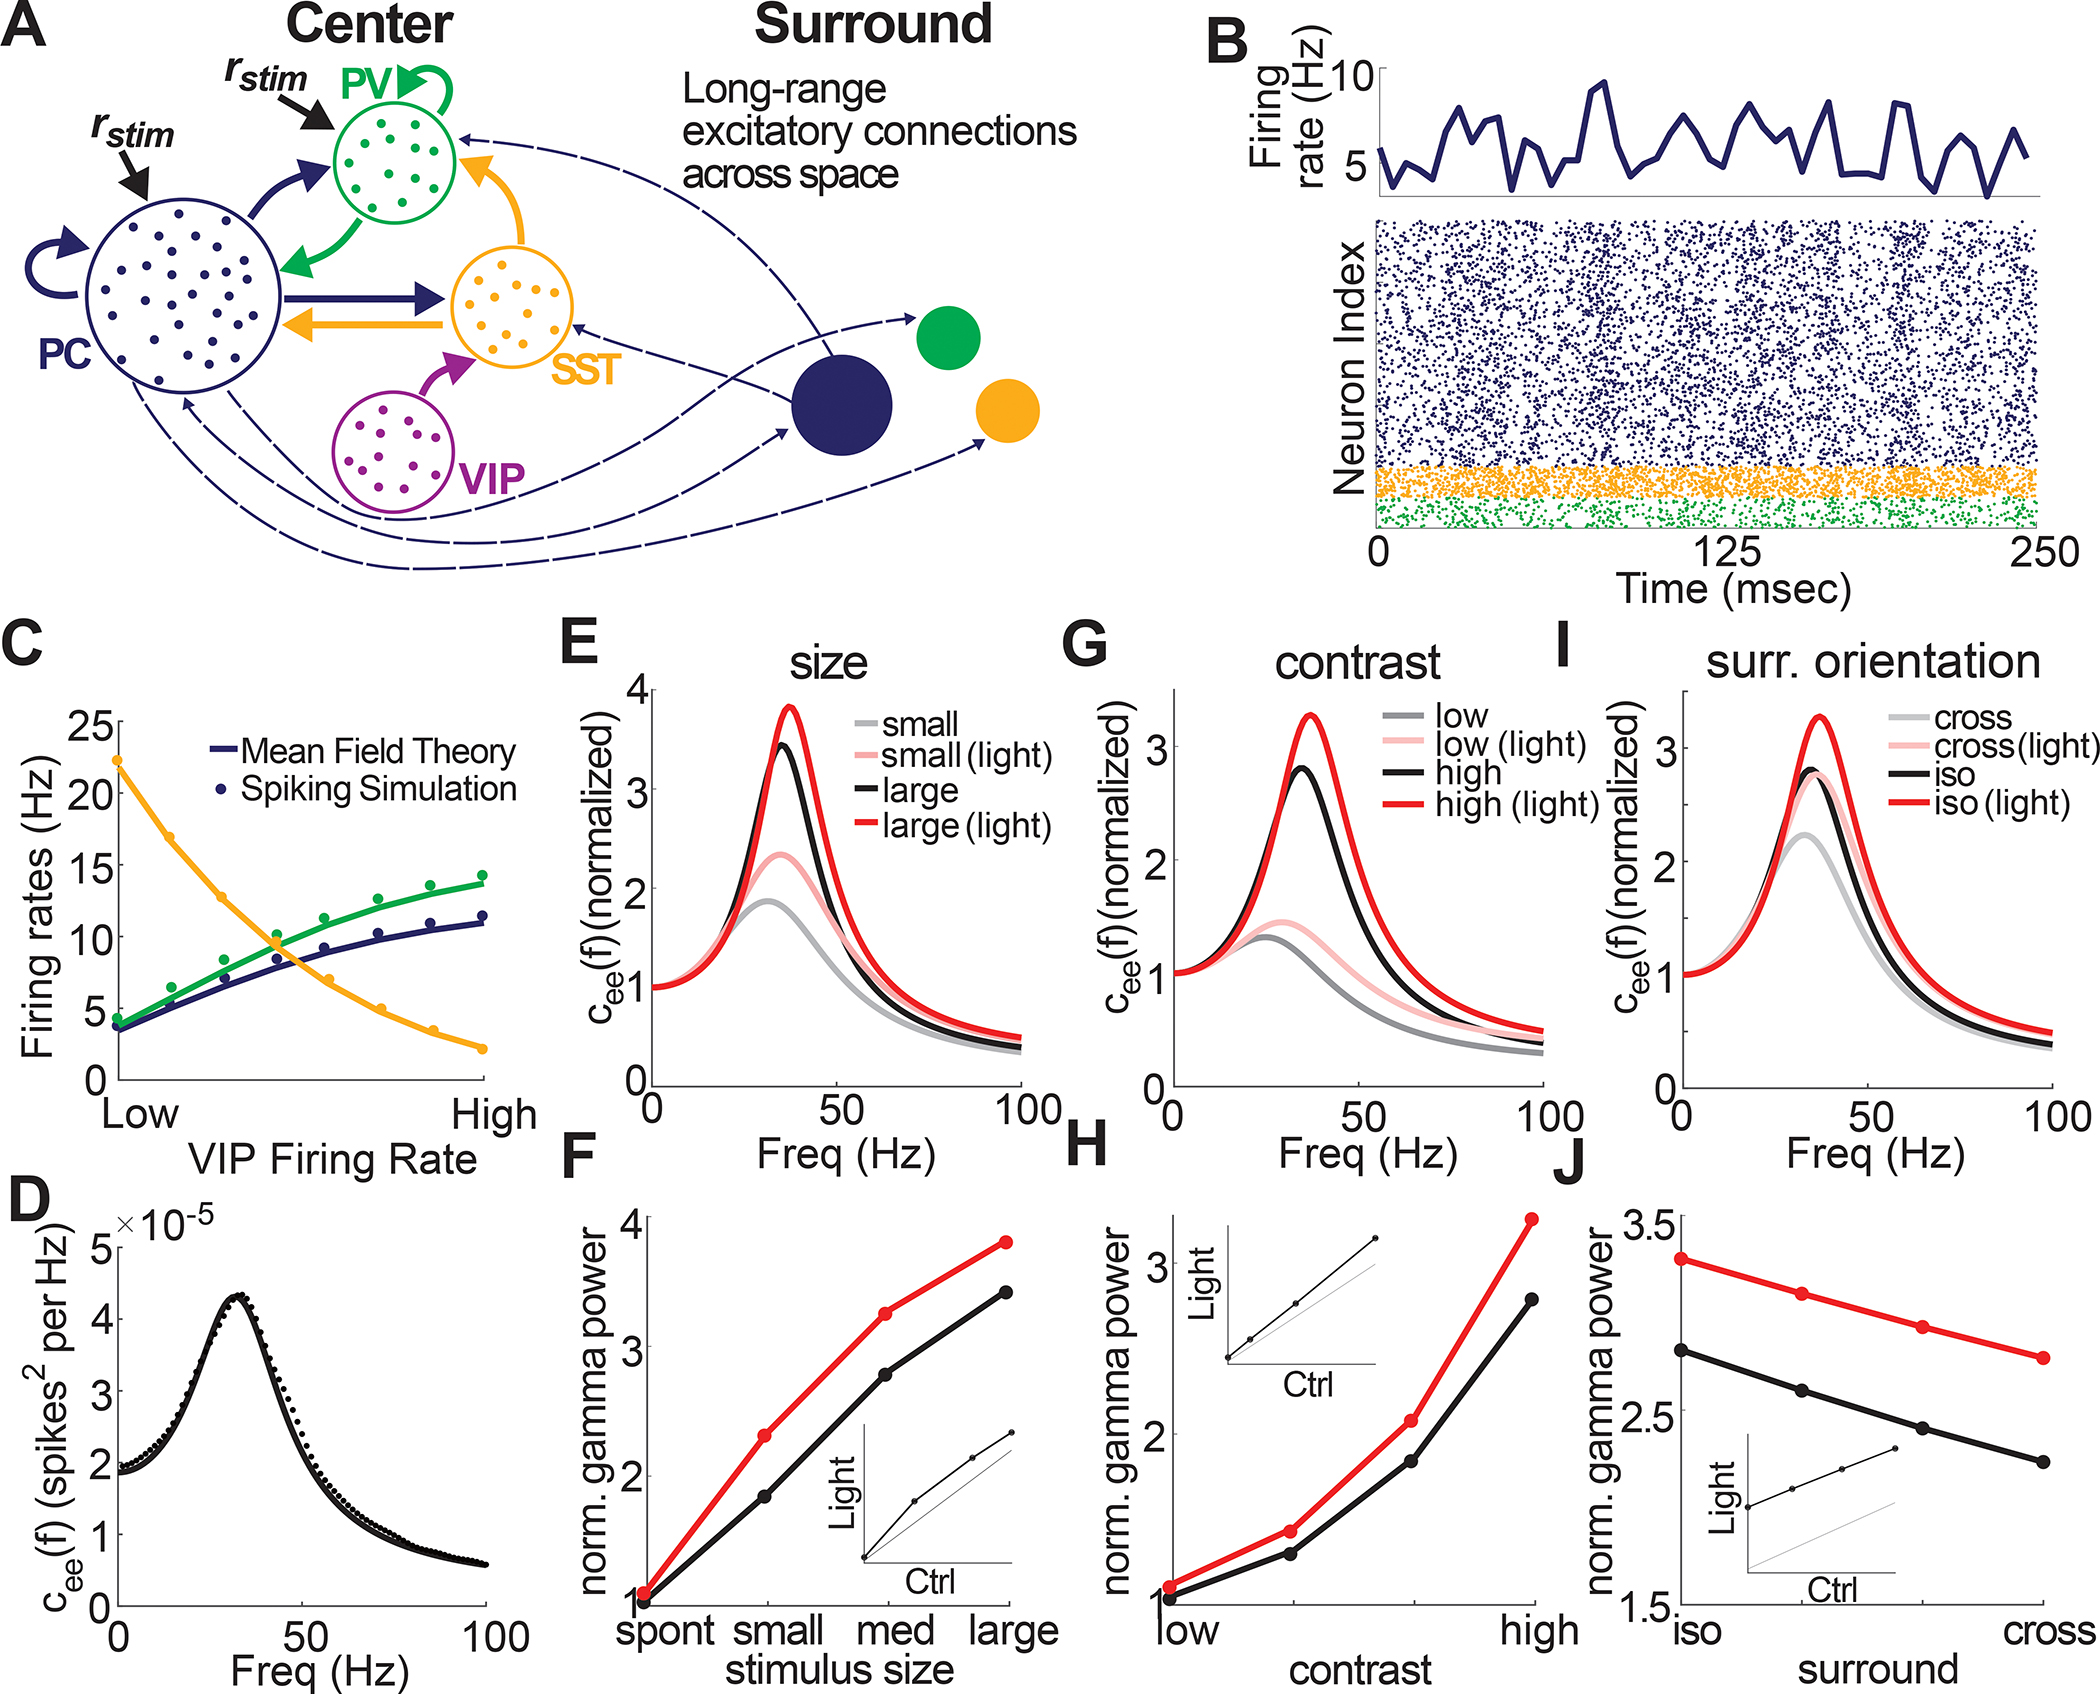
A: Schematic of the local connectivity across the four cell types, along with the long-ranged excitatory connections (dashed arrows) spanning across space. All populations receive a static background current, while PC and PV neurons receive stimulus-dependent drives. For a large stimulus size, an additional surround population was added (see STAR Methods). B: Bottom: Raster plot showing the spike times of neurons from the PC, PV, and SST populations. Top: Average firing rate (averaged over a 5 msec time window) across the excitatory population. C: Average firing rates across the populations for the spiking simulation and mean-field theory as a function of VIP firing rates. D: Example of the power spectrum for spiking simulations (dots) and mean-field theory (solid line) showing a strong peak in the gamma frequency. E: Normalized power spectrum from the mean-field model as a function of stimulus size. The red lines illustrate the result of suppressing VIP neurons (i.e., mimicking the optogenetic suppression done experimentally). F: Normalized gamma power taken from the power spectrum of panel E. G,H,I,J: Same as E,F, except for contrast (G,H) and surround orientation (I,J). Similar to experimental results, increasing the size (and contrast) of the stimulus results in a noticeable increase in gamma power. Likewise, iso-surround exhibits larger gamma power than cross-surround. Further, suppressing VIP leads to a linear increase in gamma power across conditions.
Next, we asked in the model how VIP neurons could globally tune coherence despite locally only scaling gamma power. In agreement with our experimental results, we found that high VIP activity in the model specifically suppressed coherence for cross-oriented as compared to iso-oriented gratings (Fig. 6A–D). We then probed which features of VIP connectivity in the model might be important for this result. First, we constructed a model where VIP directly inhibited PV neurons rather than the SST neurons (Fig. 6E). This model could not reproduce the core experimental results, putatively because PV neurons are key stabilizers in this circuit 71. As a result, their suppression led to a large increase in excitatory firing rates, resulting in an increase in gamma power and gamma coherence under the iso-oriented condition (Fig. 6F). Finally, we constructed a model where VIP neurons non-specifically targeted all other cell types in the circuit. While this model could capture the impact of VIP activity on overall coherence, it could not recapitulate the selective effect on cross-oriented gratings (Fig. 6G,H). These modeling experiments imply that the selective inhibitory-inhibitory wiring between VIPs and SSTs is central to the feature-dependence of gamma band coherence across V1 as simpler circuits could not robustly reproduce this core phenomenology.
Figure 6: Connectivity of VIP neurons in the local circuit is crucial for controlling gamma coherence.
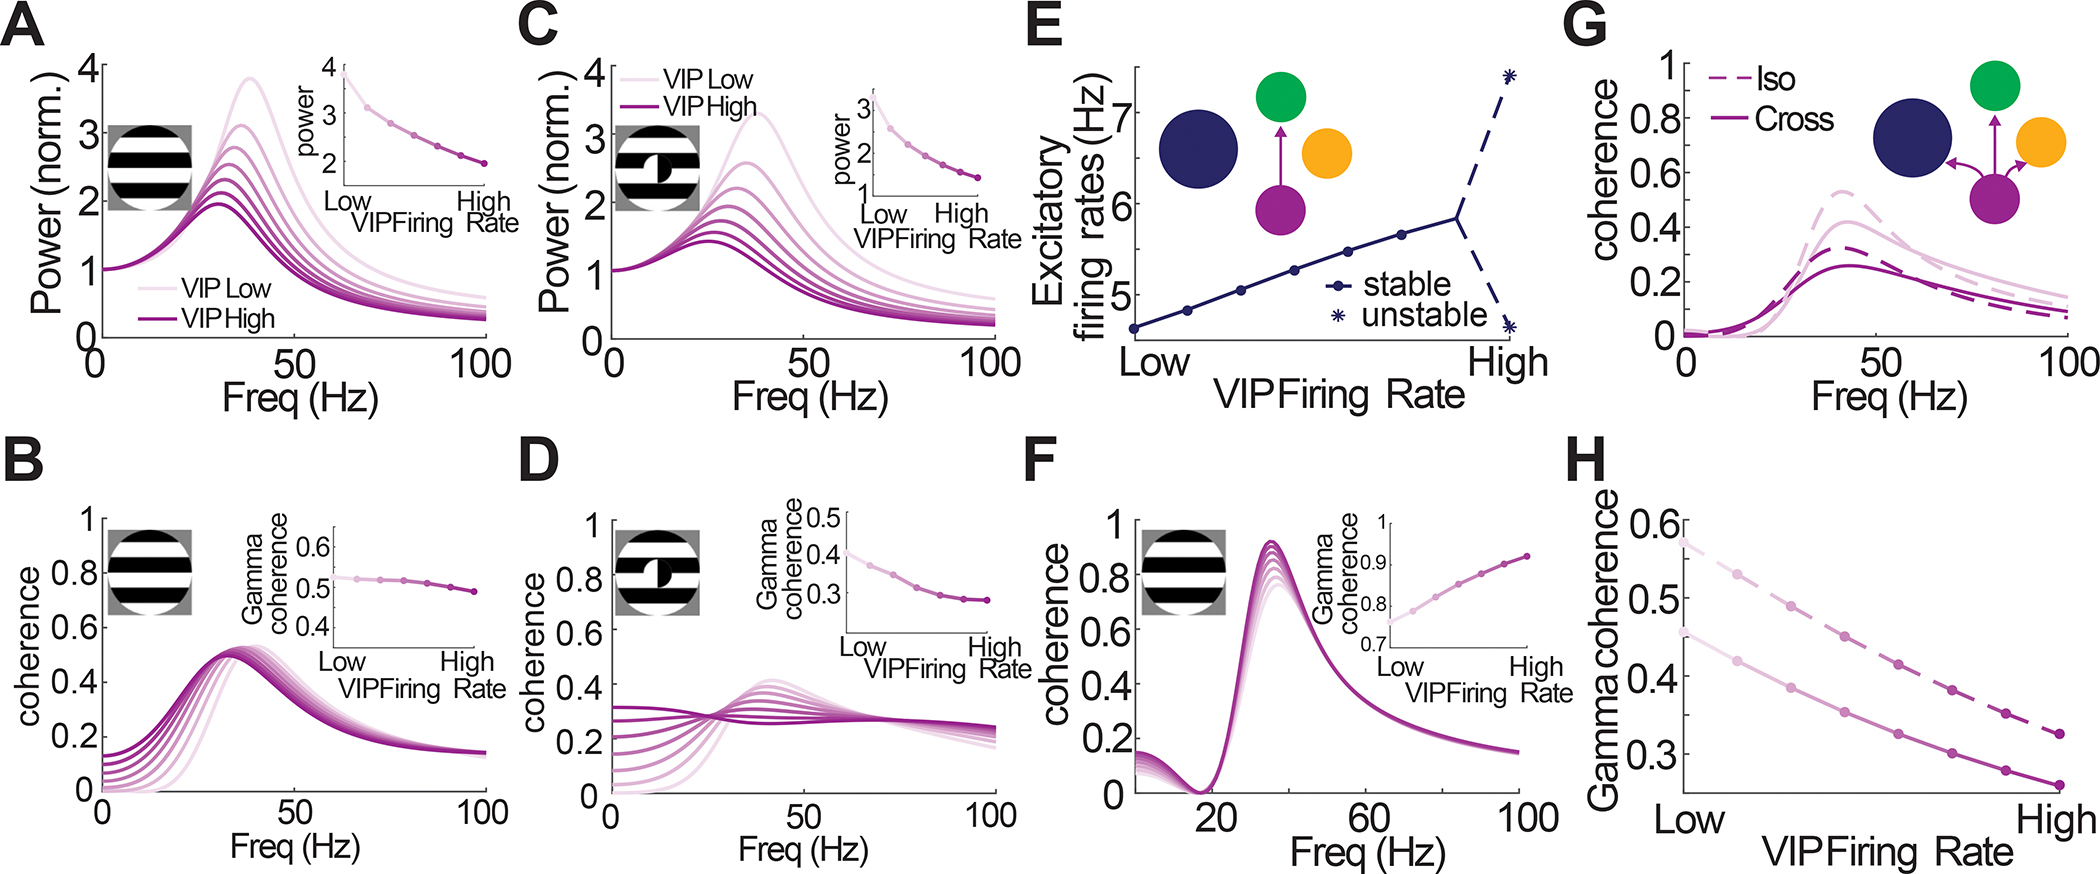
A: Normalized gamma power and B: coherence for an iso-surround as a function of VIP firing rate. Despite gamma power decreasing as VIP firing rate increases (A, inset) the coherence at the gamma frequency remains relatively constant (B, inset). C,D: Same as A, except with a cross-surround. In this case, a decrease in gamma power coincides with a decrease in coherence at the gamma frequency. E,F: Simulations results for an iso-surround with a model where VIP inhibits PV, as opposed to SST (inset). E: Firing rate curve showing that stability is lost as VIP firing rates increase (dots are stable steady states, stars indicate the max and min of the oscillatory solution). F: Coherence curves, which, as opposed to the default model, shows an increase in gamma coherence as VIP firing rates increase (inset). G: Coherence curves for an iso- (dashed) and cross-surround (solid) with high (dark lines) and low (light lines) VIP firing rates, where the model considers a VIP population that inhibits PC, PV, and SST populations with equal strength (inset). H: Gamma coherence decreases significantly for both the iso- and cross-surround conditions in this modified model.
Discussion
The data in this study establishes the disinhibitory VIP cell as a crucial regulator of gamma rhythms in the primary visual cortex. Importantly, optogenetically suppressing VIP neurons profoundly impacted the strength and spatial coherence of gamma rhythms, but did so in highly unexpected ways. Recent studies have highlighted the opposing responses of VIP and SST neurons to varied visual stimuli 54,55,62. While SST neurons are strongly driven by large high contrast, iso-oriented gratings, VIP neurons are suppressed by these stimuli and instead driven best by small, low contrast, or cross-oriented gratings. Two of these studies proposed or directly showed through optogenetic perturbations that VIP neurons tune the pyramidal network along these stimulus properties. All of this data supported a hypothesis wherein VIP neurons would likewise tune the stimulus-dependence of gamma oscillations. Strikingly and unexpectedly, our data refute this notion, as suppressing VIP neurons had a nearly exclusive impact on the gain of gamma rhythms, not their stimulus tuning. The most dramatic change in gamma power during VIP suppression was for the largest, and highest contrast iso-oriented gratings, while we observed fairly small effects for small, low contrast or cross-oriented gratings.
These data could have supported a relatively simple, albeit counterintuitive, model where the only role of VIP neurons in cortical gamma band rhythms was to control the gain of gamma band synchrony locally. However, our data with multi-site recording demonstrate that VIP neurons have a second, and arguably more important function in the global properties of gamma oscillations. VIP-mediated disinhibition, putatively through inhibition of SST neurons, preferentially suppressed inter-site coherence when the two sites were processing non-matched stimulus features, such as different orientations. Conversely, when these stimulus features matched, VIP neurons permit spatial coherence, even while they simultaneously scale down the total power of gamma divisively.
This raises a crucial next question: why do VIP neurons dampen gamma oscillations locally but permit coherence globally, depending on the visual context? One idea is that this local, divisive scaling of synchrony prevents the hyper-synchronization of cortical pyramidal neurons that might lead to aberrant propagation of activity to higher cortical areas 72. In the same vein, VIP neuron activity might enhance visual perception by expanding the dynamic range of stimulus-dependent oscillatory dynamics. Importantly, even as they reduce local rhythmicity, VIP neurons allow distant network oscillators to couple when they are processing matched stimulus features. This might enhance the output of downstream neurons integrating across cortical space. VIP activity could thus act as a temporal filter in the gamma band for passing spatially continuous image features, such as contours and surfaces of objects.
The VIP-dependent decoupling between local and global neural synchronization argues that gamma power and coherence are not necessarily intrinsically linked. Superficially, this finding conflicts with a recent study which argues that gamma power and coherence should always be highly correlated 73. However, this study primarily considered sender and receiver populations that reside in different brain areas, rather than differentially tuned and spatially separate populations in the same cortical region, which we study here. Our theoretical work also differs from Schneider et al. (2021) in that we use standard techniques from non-equilibrium statistical mechanics to calculate the spike train power and cross-spectrums. As a result, a shift in the operating point (through changing contrast, VIP activation, cross vs. iso surround) changes the power and cross-spectrums in different ways. Since our formula for coherence depends on both of these quantities for a finite number of neurons, coherence will not be intrinsically linked to power without additional assumptions (see Methods S2). In light of our experimental observations, such assumptions do not hold across spatial locations in V1 and questions their generality, in line with other studies 66,74.
It must be noted that there is a long-standing debate on the functional importance of gamma band synchrony for neural computation and perception 7,10,18,29–33. It has proven difficult to make definitive progress on this debate, and while the data and modeling in this study do not resolve it, they do provide key new insight into the mechanisms that control both the its magnitude and tuning for different classes of sensory stimuli in the mouse. It may be possible to leverage this and other recently obtained mechanistic findings on cortical gamma rhythms 49–51 to develop a more definitive test in the future, at least in mice where the access to specific cell types. Recent advances in cell-type specific targeting in non-genetically tractable species may eventually extend this to higher organisms such as non-human primates.
A key outstanding question is what excitatory inputs drive VIP neurons, and in turn, how they mediate their divergent local and global effects. Although VIP neurons are known targets of corticocortical feedback axons from higher cortical areas, 67,75 they are also local targets of V1 horizontal axons in layer 2/3 76,77. Our computational modeling implies that both the local and global action of VIP on gamma rhythms can be mediated entirely within V1. Analysis of the model revealed several key features that were important for the robustness of capturing the physiological results. First, and most intuitively, global coherence depended on specific like-to-like (i.e., iso-oriented) connectivity between center and surround circuits. Second, for capturing the selective effect of VIP on suppressing coherence to cross-oriented stimuli, it was important that VIP selectively targeted SST, as alternative models that generalized VIP neurons to target other cell types fell short in capturing our experimental results. Third, and perhaps least intuitively, in our model VIP neurons did not need tuned input from the local V1 network. Although VIP neurons receive recurrent excitation from L2/3 PCs, our modeling surprisingly suggests that tuned excitatory input is not required for VIPs role in regulating the stimulus-dependence of global coherence – rather they can enforce this effect through their powerful inhibition of SSTs which get tuned recurrent input in the model.
Taken together, our data reveal a key new mechanism for the dynamic control of gamma-band neural synchronization in the primary visual cortex. As the same disinhibitory circuits exist in other sensory and higher cortical areas, the role of VIP neurons in controlling the gain and spatial coherence of gamma entrainment might be a general feature of cortical networks. Furthermore, our data suggest that VIP neurons might be potential therapeutic targets in neurological disorders that are associated with altered gamma rhythms and defects in inhibitory neural circuitry. Optogenetic or pharmacological tools aimed at re-balancing activity in VIP neurons, or perhaps more specific subsets of VIP neurons, should thus be useful in understanding the role of gamma rhythms in normal brain function and perhaps correcting it in disease.
STAR Methods
Resource Availability
Lead contact
Further information and requests for resources should be directed to the lead contact, Hillel Adesnik (hadesnik@berkeley.edu)
Materials Availability
This study did not generate new unique reagents.
Data and code availability
The electrophysiological and imaging data reported in this paper will be shared by the lead contact upon request.
All original code for the electrophysiological and imaging analysis, as well as for the numerical simulations and corresponding theory has been deposited at Zenodo and is publicly available as of the date of publication. DOIs are listed in the key resources table.
Any additional information required to reanalyze the data reported in this paper is available from the lead contact upon request.
Key resources table.
| REAGENT or RESOURCE | SOURCE | IDENTIFIER |
|---|---|---|
| Antibodies | ||
| Bacterial and virus strains | ||
| AAV9-EF1a-DIO-eNpHR3.0-YFP | Addgene | 26966-AAV9 |
| Biological samples | ||
| Chemicals, peptides, and recombinant proteins | ||
| Ketamine/Xylazine | Sigma-Adrich | Cat# K113 |
| Metabond | Parkell | http://parkell.com |
| 3M Vetbond | Fisher scientific | Cat# 10430774 |
| Critical commercial assays | ||
| Deposited data | ||
| Experimental models: Cell lines | ||
| Experimental models: Organisms/strains | ||
| CD-1 (ICR) | Charles River | 022 |
| Vip-IRES-cre | The Jackson Laboratory | RRID:IMSR_JAX:010908 |
| Sst-IRES-cre | The Jackson Laboratory | RRID:IMSR_JAX:013044 |
| Ai162(TIT2L-GC6s-ICL-tTA2)-D | The Jackson Laboratory | RRID:IMSR_JAX:031562 |
| Oligonucleotides | ||
| Recombinant DNA | ||
| Software and algorithms | ||
| MATLAB | MathWorks | RRID:SCR_001622 |
| Psychophysics Toolbox | http://psychtoolbox.org | RRID:SCR_002881 |
| Chronux Toolbox | http://chronux.org/ | RRID:SCR_005547 |
| UltraMega Sort | https://neurophysics.ucsd.edu/software.php | RRID:SCR_015857 |
| MClust | http://redishlab.neuroscience.umn.edu/MClust/MClust.html | |
| EEGLAB | http://sccn.ucsd.edu/eeglab/index.html | RRID:SCR_007292 |
| Circular statistics toolbox | https://de.mathworks.com/matlabcentral/fileexchange/10676-circular-statistics-toolbox-directional-statistics | RRID:SCR_016651 |
| Suite2P | https://github.com/cortex-lab/Suite2P | RRID:SCR_016434 |
| OASIS: Fast online deconvolution of calcium imaging data | https://github.com/j-friedrich/OASIS | |
| original code for the numerical simulations and corresponding theory | https://zenodo.org/record/7186510 | 10.5281/zenodo.7192074 |
| original code for analysis of electrophysiological data | https://zenodo.org/record/7198169 | 10.5281/zenodo.7198169 |
| original code for analysis of imaging data | https://zenodo.org/record/7199471 | 10.5281/zenodo.7199471 |
| Other | ||
| Spike Gadgets MCU | Spike Gadgets | RRID:SCR_021623 |
| Drummond Nanoject II | https://www.drummondsci.com/product/microinjection/nanoject-ii-auto-nanoliter-injector/ | Cat. No. 3-000-204 |
| Fiber-Coupled LED | Thorlabs.com | M625F2 |
| NI-DAQ card | Ni.com | NI PCIe-6353 |
| Linear 16 channel probe | Neuronexus | A1x16-5mm-25-177-A16 |
| uMp-4 micromanipulator | Sensapex | uMp-4 micromanipulator |
Experimental Model and Subject Details
Transgenic mice
All experiments were performed in accordance with the guidelines and regulations of the ACUC of the University of California, Berkeley. Mice for the in vivo experiments were housed in groups of five or less with a 12:12h light:dark cycle. Both female (n = 7) and male (n = 14) mice were used. Experiments in vivo were performed on animals aged between 8–27 weeks during their subjective night. We used VIP-IRES-Cre (JAX stock 010908) mice. Mice were out-crossed for one generation to the ICR white strain (Charles River).
Method Details
Viral infection
Neonatal VIP-Cre mice (P3–6) were briefly cryo-anesthetized and placed in a head mold. Transcranial injection of ~45nl of undiluted AAV9-EF1a-DIO-eNpHR3.0-YFP (22 animals 78) was performed using a Drummond Nanoject II injector at three locations in V1 using a glass pipette beveled to a fine tip (~30–60μm). With respect to the lambda suture coordinates for V1 were 0.0 mm AP, 2.2 mm L and injection was as superficial as possible under the skull.
Preparation for in vivo recording
Mice were anesthetized with isoflurane (2.5% vapor concentration). The scalp was removed, the fascia retracted, and the skull lightly etched with a 27 gauge needle. Following application of Vetbond to the skull surface, a custom stainless steel headplate was fixed to the skull with dental cement (Metabond). Mice were allowed to recover from surgery for at least 2 days. Then mice were habituated for 2–10 days to head-fixation on a free-spinning circular treadmill. On the day of recording mice were briefly anesthetized with isoflurane (2%), the skull over V1 was thinned, and one or two (spacing 400–1000μm) small (<250 μm) craniotomies were opened over V1 with a fine needle
Visual stimulation
Visual stimuli were generated with Psychophysics Toolbox 79 running on an Apple Mac Mini and were presented on a gamma corrected 23-inch Eizo FORIS FS2333 LCD display with a 60-Hz refresh rate. At the beginning of each recording session the receptive fields of MUA recorded at each cortical location were mapped with sparse noise to be able to precisely position the grating stimuli. The stimulus was centered on a location where a small grating, movable by hand, elicited a clear response. Sparse noise consisted of black and white squares (2 visual degrees, 80 ms) on a 20×20 visual degree grid flashed onto a gray background of intermediate luminance. To improve receptive field estimation the same stimulus grid was offset by 1 degree and the resulting maps were averaged. MUA average receptive fields were calculated by reverse correlation.
Visual stimuli consisted of drifting square-wave gratings at 0.04 cycles per degree and 2 cycles per second centered on the average MUA receptive field presented for 2s with at least 1s inter stimulus interval. Gratings were presented in three different configurations: 1) full contrast gratings of eight different directions (0–315° in steps of 45x) and five different sizes (4, 10, 20, 36, and, if possible, 60 visual degrees – if the RF was not perfectly centered on the monitor, the effective largest size was slightly smaller); 2) gratings of four different directions (0–270° in steps of 90°), three different sizes (8,20 and 60°) and 5 different contrast levels (0.05, 0.1, 0.2, 0.4, 0.8) Michelson contrast and 3) full contrast square-wave gratings with a circular aperture of 8–15° visual degrees diameter (depending on the separation of the two RFs), centered on the MUA receptive field of one of the two simultaneously recorded cortical locations, that was surrounded by a 60 degree grating with one of seven different relative orientations (0–180° in steps of 30°). For the coherence analysis we only analyzed cases in which the second receptive field was covered entirely and exclusively by the surround-stimulus (see Fig. 7A and sup. Fig. 2).
Optogenetic stimulation in vivo
For optogenetic stimulation of eNpHR3.0 in vivo we used red (center wavelength: 625 nm) from the end of a 1-mm diameter multimode optical fiber coupled to a fiber coupled LED (Thorlabs) controlled by digital outputs (NI PCIe-6353). The fiber was placed as close to the craniotomy as possible (<3 mm). The illumination area was set to illuminate a wide area including all of V1. Light levels were tested in increasing intensities at the beginning of the experiment and were kept, for the remainder of the recording, at the lowest possible level that still evoked observable change in ongoing activity. We only used viral injections into V1, and did not attempt to use an eNphR transgenic reporter line to avoid off-target expression of the opsin and non-specific optogenetic suppression of subcortical nuclei (such as the thalamic reticular nucleus).
Gratings drifted for 2s with at least 1s inter-trial intervals with the red LED switched on for 1 s starting 0.5 s after start of the visual stimulus in 50% of the trials. The period of light was chosen to influence the stable steady-state of the response to the grating and all analysis was performed during this time window.
In vivo extracellular multi-electrode electrophysiology
One or two 16-channel linear electrodes with 25 micron spacing (NeuroNexus, A1×16–5mm-25–177-A16) were guided into the brain using micromanipulators (Sensapex) and a stereomicroscope (Leica). Electrical activity was amplified and digitized at 30 kHz (Spike Gadgets), and stored on a computer hard drive. The cortical depth of each electrical contact was determined by zeroing the bottom contact to the surface of the brain. Electrodes were inserted close to perpendicular to the brain’s surface for single electrode recordings and ~25 degrees from vertical for the two electrode experiments. After each recording a laminar probe coated with the lipophilic dye DiI was used to mark each electrode track to quantitatively assess insertion angle and depth with post-hoc histologic reconstructions. The laminar depth of recorded units was corrected for the insertion angle and the local curvature of the neocortex.
Analysis of local field potential data
All analysis was performed using custom written code or openly available packages in Matlab (Mathworks). Local field potentials were extracted by low pass filtering the raw signal, sampled at 30 kHz, below 200 Hz and subsequent down-sampling to 1 kHz. For LFP-only analysis we always analyzed the LFP from the electrode contact closest to a cortical depth of ~350 μm (in cortical layer 3). For spike locking to the LFP we used the LFP from an electrode contact 50 μm away from the contact with the largest spike-waveform amplitude to reduce contamination of the LFP.
The power spectrum was computed in a 800 ms analysis window starting 200 ms after light onset (to exclude any photo-electric artifacts sometimes present in the first ~150 ms after light onset) using multi-taper estimation in Matlab with the Chronux package (http://chronux.org/, Mitra & Bokil, 2007) using 3 tapers. All power analysis was performed on the power at the peak of each animal’s specific gamma oscillation in the specific visual stimulation condition. Peaks were identified as local maxima on the smoothed spectrum between 20 and 40Hz that were preceded by local minima in the 15Hz preceding the peak. If no true peak could be found (as was often the case for very small or low contrast conditions), we took the power at the frequency of the peak for the highest contrast/largest stimulus of that animal.
For calculation of coherence, bipolar derivatives of the LFP were calculated by subtracting the electrode channel two contacts above the channel of interest (50μm distance), to remove the common recording reference and to enhance spatial specificity of the signal. Coherence between the two recording sites was determined using the chronux package with the same number of tapers as the power analysis. All spectral plots show mean±s.e.m. Coherence values for the analysis were taken of the peak of each animals’ individual coherence spectrum as for the power above.
Analysis of spiking data
Spiking activity was extracted by filtering the raw signal between 800 and 7000 Hz. Spike detection was performed using the UltraMega Sort package (Hill et al., 2011). Detected spike waveforms were sorted using the MClust package (http://redishlab.neuroscience.umn.edu/MClust/MClust.html). Waveforms were first clustered automatically using KlustaKwik and then manually corrected to meet criteria for further analysis. With the exception of <25 burst firing units, included units had no more than 1.5% of their individual waveforms violating a refractory period of 2 ms. Individual units were classified as either fast-spiking or regular spiking using a k-means cluster analysis of spike waveform components. Since the best separation criterion was the trough-to-peak latency of the large negative going deflection and clustering is non-deterministic, we defined all units with latencies shorter than 0.36 ms as fast spiking and all units with latencies larger than 0.38ms as regular spiking. Units with intermediate latencies were excluded from further analysis.
The depth of each unit was assigned based on the calculated depth of the electrode on the array that exhibited its largest amplitude sorted waveform. Layer boundaries were determined following a previously established approach 81. Firing rates were computed from counting spikes in a 1 second window starting 500 ms after the onset of the visual stimulus, which coincided with the onset of the LED during optogenetic suppression trials. Unless otherwise stated, we only analyzed trials when the animal was moving (at least 1cm/s) and not accelerating or decelerating abruptly (not more than 1.5 s.d. deviation from the animal’s mean running speed).
To quantify locking of spiking activity to the gamma band we bandpass filtered the LFP in a 20 Hz band around the individual gamma band peak (between 20 and 45 Hz, EEGLAB eegfilt function (RRID:SCR_007292)) and extracted the oscillation’s instantaneous phase by using the imaginary part of the analytical signal using the Hilbert transform. Each spike is thus assigned an exact phase in the gamma oscillation. Phase locking magnitude is determined for each unit by the pairwise phase consistency (PPC), a measure of synchrony that is not biased by the number of spikes 82. We only included units that fired more than 20 spikes total in response to the largest grating size in the control condition and whose average visual response rate was >1Hz. PPC-spectra were calculated as above but for LFP filtered into 20 non-overlapping 5Hz wide frequency bands. Mean phases shown in figure S5A were calculated using the circular statistics toolbox (RRID:SCR_016651).
The optogenetic modulation index (OMI) was calculated as (Rl − Rc)/(Rl + Rc), where Rl is the average response in the light condition, suppressing VIP activity and Rc is the average response during control trials without light.
The behavioral modulation index (BMI) was calculated equivalently as (Rr − Rq)/(Rr + Rq), where Rr is the average response during running and Rq is the average response in quiescent trials.
For illustrative purposes the average functions for gamma power and PPC were fit with functions. For size tuning curves an integral of Gaussian, for contrast tuning a Naka-Rushton function and for center-surround angle a sinusoid was fit with the Matlab curve fitting toolbox.
Imaging data
Imaging data was performed as described in 55. Briefly, Sst-IRES-Cre and Vip-IRES-Cre mice were crossed to Ai162(TIT2L-GC6s-ICL-tTA2)-D mice (RRID:IMSR_JAX:031562) and an imaging window implanted. The visual stimulus consisted of square wave drifting gratings, with directions tiling 0–360 degrees at 45° intervals, with a spatial frequency of 0.08 cycles per degree, and a temporal frequency of 1 Hz. Visual stimulus presentation lasted one second, followed by a one second inter-stimulus interval. Mice were head-fixed on a freely spinning running wheel under a Nixon 16x-magnification water immersion objective and imaged with a two-photon resonant scanning microscope (Neurolabware) within a light tight box. The imaging FOV was 430 by 670 um, with four planes spaced 37.5 μm apart imaged sequentially using an electrotunable lens (Optotune), sampling each plane at an effective frame rate of 7.72 Hz. Motion correction and ROI segmentation was performed using Suite2p 83. Neuropil subtraction was applied as described in 84. ΔF/F traces were calculated as with baseline F0 computed over a sliding 20th percentile filter of width 3000 frames. Because the inter-stimulus interval was short to permit more stimuli to be displayed, calcium transients overlapped between successive trials. Therefore, we deconvolved calcium traces for this data using OASIS with L1 sparsity penalty 85 using ΔF/F traces as input. We report this deconvolved event rate normalized by the mean.
Spiking neuron model
We consider a network of N recurrently connected exponential integrate-and-fire (EIF) neurons of the form
which spikes when Vi(t) ≥ Vth, after which its value is reset to Vre and undergoes a refractory period of length τref. Each neuron i belongs to one of three subclasses a = e (PC), p (PV), or s (SST). The leak current is given by
which is accompanied by a spike-generating current of the form
Synaptic interactions are modeled as
where the spike trains from cell j is modeled as the point process , J(t) is a N × N matrix containing the synaptic kernels, W is a N × N matrix of synaptic strengths, and * denotes convolution. In this work, we consider exponential synapses,
though the theory can be generalized to account for arbitrary kernels. Further,
To create the connectivity matrix W, each neuron j from population b at location y is randomly connected to (without replacement) paxbyNax neurons from population a at location x.
From previous experimental work (Pfeffer et al. 2013), it is known that VIP cells preferentially inhibit SST cells. While VIP cells are also known to receive recurrent inhibition from SST cells and excitatory input from PC cells, we make the simplifying assumption here that they serve primarily as a feedforward source of inhibition onto SST cells. As a result, we model them to be neurons spiking according to some baseline Poisson firing rate (rv). In addition to the feedforward input of VIP neurons onto SST cells, we consider two types of external inputs from outside of the recurrent network: a fixed background input (driving all cells) and a stimulus input (driving only PC and PV cells). Assuming all of these inputs arrive as Poisson spike trains, we make use of a diffusion approximation and Campbell’s theorem (Kingman 1993) to write these inputs as
where ξi(t) is a zero mean, delta-correlated Gaussian white noise term, ηgl(t) is global noise process, c is the image contrast, and
The global noise process is primarily considered to be a zero mean, delta-correlated Gaussian white noise, though our corresponding linear response theory (see Methods S1) begins by considering it to be bandlimited. This theory yields a concise formula for coherence, which interestingly depends on both power and cross-spectrums for a finite number of neurons (see Methods S2).
Connectivity rules and neuron parameters for model
For neurons located in the same retinotopic space, the probability between and within neuron subclasses follows from (Pfeffer et al. 2013). Specifically, we note that SST cells do not have recurrent connections to other SST cells or from PV cells. The connectivity and neuronal parameters used in this paper (see Table S1 and Table S2) for neurons in the same retinotopic location were adjusted from previous work (Bos, Oswald, and Doiron 2020; Ocker, Litwin-Kumar, and Doiron 2015).
The connectivity parameters corresponding to the long-range excitatory connections across our discrete representation of retinotopic space were chosen to qualitatively match weights used in previous computational model work (Keller et al. 2020), which fitted a rate base model to experimental data collected from L2/3 of a mouse presented with different visual stimuli. Specifically, they found that these long-range excitatory connections were much stronger between neurons with a similar feature preference (i.e., like-to-like). Thus, to model a medium-sized visual stimulus with iso-surround, we considered two populations of neurons, each consisting of the three neuron subtypes, located in distinct retinotopic space, with a high probability of excitatory connections across the two populations. The key difference with the cross-surround stimulus is that the probability of these excitatory connections was decreased. See Table S2 for specific parameter values. Linear interpolation between these two parameter sets was used to consider visual stimuli with a center and surround with orientation differences less than ninety degrees (Fig. 3Eiii).
All default parameters can be found in Tables S1–S2. Unless otherwise noted, all simulations corresponded to a medium-sized visual stimulus (i.e., two retinotopic locations) at high contrast (c = 1). In the simulation with a large-sized visual stimulus (Fig. 3Ei), a third retinotopic location was added, with the probability the connections across two locations being half of probability of being connected to a neighboring location. The spontaneous (low contrast) and small-sized visual stimuli (Fig. 3Ei) consisted of only one spatial location. For Fig. 4C the model was adjusted so that VIP cells inhibited PV cells, and while all other parameter values matched the default case, the firing rate of VIP cells only varied from 0 to 6 Hz (default considered the range from 0 to 14 Hz), halting when the system became unstable. For Fig. 4D, all parameter values were the same as the default case, except VIP inhibited all cell types and as a result, their firing rate was only varied from 0 to 1.7 Hz.
Numerical details
The spiking simulations were completed with Euler’s method using a timestep of 0.025 msec for a total of 1e6 msec of simulation time. The auto- and cross-correlation functions was then estimated by binning the spike times over 1 msec time windows, summing this count across excitatory neurons in a retinotopic location, and then using Matlab’s built-in xcorr() function for a max window length of 250 msec. The power spectrum and cross-spectrum was then computed by taking the Fourier transform. The power spectrums in Fig. 3F and Fig. 4 was normalized by the power at 0 frequency. The normalized gamma power was taken to be the peak of the curve (which usually occurred in the frequency range of 30–50 Hz). Gamma coherence was defined to be the coherence value at the corresponding gamma frequency of the power spectrum.
Quantification and statistical analysis
Details for the statistical tests used can be found in the results section and in the figure legends. Statistically significant differences between conditions were determined using standard parametric or nonparametric tests in MATLAB, including a 2-way ANOVA, Kruskal-Wallis ANOVA and a Wilcoxon sign-rank test. Analysis of phase locking to the LFP was restricted to neurons that fired on average more than 1 spike/s in response to a visual stimulus and were located in L2/3 on the electrode representing the center. All “n” values are referring to mice, except when explicitly stated that n is referring to the number of recorded units.
Supplementary Material
Highlights:
VIP interneurons divisively scale the power of visually induced gamma oscillations
VIP interneurons tune the coherence of gamma oscillations across cortical space
This is captured in a model with like-to-like and selective VIP -> SOM connectivity
VIP disinhibition regulates locomotion-dependent changes in gamma power
Acknowledgements
This work was funded by the New York Stem Cell Foundation. H.A. is a New York Stem Cell Foundation Robertson Investigator. This work was supported by NEI grant R01EY023756 and NINDS grant U19NS107613. B.D. was supported by NIH grants 1U19NS107613-01 and R01 EB026953, the Vannevar Bush Faculty Fellowship #N00014-18-1-2002, and a grant from the Simons foundation collaboration on the global brain. J.V. was supported by an Emmy Noether grant from the DFG (VE 938/2-1). G.H. was supported by the Swartz Foundation Fellowship for Theory in Neuroscience and the Burroughs Wellcome Fund’s Career Award at the Scientific Interface.
Footnotes
Declaration of interests
The authors declare no competing interests.
Publisher's Disclaimer: This is a PDF file of an unedited manuscript that has been accepted for publication. As a service to our customers we are providing this early version of the manuscript. The manuscript will undergo copyediting, typesetting, and review of the resulting proof before it is published in its final form. Please note that during the production process errors may be discovered which could affect the content, and all legal disclaimers that apply to the journal pertain.
References
- 1.Jasper H, and Penfield W (1949). Electrocorticograms in man: Effect of voluntary movement upon the electrical activity of the precentral gyrus. Arch. F. Psychiatr. U. Z. Neur. 183, 163–174. 10.1007/BF01062488. [DOI] [Google Scholar]
- 2.Adrian ED (1950). The electrical activity of the mammalian olfactory bulb. Electroencephalogr Clin Neurophysiol 2, 377–388. 10.1016/0013-4694(50)90075-7. [DOI] [PubMed] [Google Scholar]
- 3.Bressler SL, and Freeman WJ (1980). Frequency analysis of olfactory system EEG in cat, rabbit, and rat. Electroencephalogr Clin Neurophysiol 50, 19–24. 10.1016/0013-4694(80)90319-3. [DOI] [PubMed] [Google Scholar]
- 4.Riehle A, Gruen S, Diesmann M, and Aertsen A (1997). Spike Synchronization and Rate Modulation Differentially Involved in Motor Cortical Function. Science 278, 1950–1953. [DOI] [PubMed] [Google Scholar]
- 5.Buzsáki G, and Draguhn A (2004). Neuronal oscillations in cortical networks. Science 304, 1926–1929. 10.1126/science.1099745. [DOI] [PubMed] [Google Scholar]
- 6.Colgin LL, Denninger T, Fyhn M, Hafting T, Bonnevie T, Jensen O, Moser M-B, and Moser EI (2009). Frequency of gamma oscillations routes flow of information in the hippocampus. Nature 462, 353–357. 10.1038/nature08573. [DOI] [PubMed] [Google Scholar]
- 7.Fries P (2009). Neuronal Gamma-Band Synchronization as a Fundamental Process in Cortical Computation. Annual Review of Neuroscience 32, 209–224. 10.1146/annurev.neuro.051508.135603. [DOI] [PubMed] [Google Scholar]
- 8.Vinck M, Batista-Brito R, Knoblich U, and Cardin JA (2015). Arousal and Locomotion Make Distinct Contributions to Cortical Activity Patterns and Visual Encoding. Neuron 86, 740–754. 10.1016/j.neuron.2015.03.028. [DOI] [PMC free article] [PubMed] [Google Scholar]
- 9.Gieselmann MA, and Thiele A (2008). Comparison of spatial integration and surround suppression characteristics in spiking activity and the local field potential in macaque V1. European Journal of Neuroscience 28, 447–459. 10.1111/j.1460-9568.2008.06358.x. [DOI] [PubMed] [Google Scholar]
- 10.Ray S, and Maunsell JHR (2010). Differences in Gamma Frequencies across Visual Cortex Restrict Their Possible Use in Computation. Neuron 67, 885–896. 10.1016/j.neuron.2010.08.004. [DOI] [PMC free article] [PubMed] [Google Scholar]
- 11.Ray S, Ni AM, and Maunsell JHR (2013). Strength of Gamma Rhythm Depends on Normalization. PLoS Biology 11, e1001477. 10.1371/journal.pbio.1001477. [DOI] [PMC free article] [PubMed] [Google Scholar]
- 12.Murty DVPS, Shirhatti V, Ravishankar P, and Ray S (2018). Large Visual Stimuli Induce Two Distinct Gamma Oscillations in Primate Visual Cortex. The Journal of Neuroscience 38, 2730–2744. 10.1523/JNEUROSCI.2270-17.2017. [DOI] [PMC free article] [PubMed] [Google Scholar]
- 13.Shirhatti V, Ravishankar P, and Ray S (2022). Gamma oscillations in primate primary visual cortex are severely attenuated by small stimulus discontinuities. PLOS Biology. [DOI] [PMC free article] [PubMed] [Google Scholar]
- 14.Chalk M, Herrero JL, Gieselmann MA, Delicato LS, Gotthardt S, and Thiele A (2010). Attention Reduces Stimulus-Driven Gamma Frequency Oscillations and Spike Field Coherence in V1. Neuron 66, 114–125. 10.1016/j.neuron.2010.03.013. [DOI] [PMC free article] [PubMed] [Google Scholar]
- 15.Fries P, Reynolds JH, Rorie AE, and Desimone R (2001). Modulation of oscillatory neuronal synchronization by selective visual attention. Science 291, 1560–1563. [DOI] [PubMed] [Google Scholar]
- 16.Vinck M, Womelsdorf T, Buffalo EA, Desimone R, and Fries P (2013). Attentional modulation of cell-class-specific gamma-band synchronization in awake monkey area v4. Neuron 80, 1077–1089. 10.1016/j.neuron.2013.08.019. [DOI] [PMC free article] [PubMed] [Google Scholar]
- 17.Womelsdorf T, and Fries P (2006). Neuronal coherence during selective attentional processing and sensory-motor integration. J Physiol Paris 100, 182–193. 10.1016/j.jphysparis.2007.01.005. [DOI] [PubMed] [Google Scholar]
- 18.Fries P (2015). Rhythms for Cognition: Communication through Coherence. Neuron 88, 220–235. 10.1016/j.neuron.2015.09.034. [DOI] [PMC free article] [PubMed] [Google Scholar]
- 19.Gray C, and Singer W (1989). Stimulus-specific neuronal oscillations in orientation columns of cat visual cortex. Proceedings of the National Academy of Sciences 86, 1698–1702. [DOI] [PMC free article] [PubMed] [Google Scholar]
- 20.Benda J, Longtin A, and Maler L (2006). A synchronization-desynchronization code for natural communication signals. Neuron 52, 347–358. 10.1016/j.neuron.2006.08.008. [DOI] [PubMed] [Google Scholar]
- 21.Nandy A, Nassi JJ, Jadi MP, and Reynolds J (2019). Optogenetically induced low-frequency correlations impair perception. Elife 8. 10.7554/eLife.35123. [DOI] [PMC free article] [PubMed] [Google Scholar]
- 22.Lewis DA, Hashimoto T, and Volk DW (2005). Cortical inhibitory neurons and schizophrenia. Nat Rev Neurosci 6, 312–324. 10.1038/nrn1648. [DOI] [PubMed] [Google Scholar]
- 23.Schnitzler A, and Gross J (2005). Normal and pathological oscillatory communication in the brain. Nature Reviews Neuroscience 6, 285–296. 10.1038/nrn1650. [DOI] [PubMed] [Google Scholar]
- 24.Uhlhaas PJ, and Singer W (2010). Abnormal neural oscillations and synchrony in schizophrenia. Nat Rev Neurosci 11, 100–113. 10.1038/nrn2774. [DOI] [PubMed] [Google Scholar]
- 25.Yizhar O, Fenno LE, Prigge M, Schneider F, Davidson TJ, O’Shea DJ, Sohal VS, Goshen I, Finkelstein J, Paz JT, et al. (2011). Neocortical excitation/inhibition balance in information processing and social dysfunction. Nature 477, 171–178. 10.1038/nature10360. [DOI] [PMC free article] [PubMed] [Google Scholar]
- 26.Bartos M, Vida I, and Jonas P (2007). Synaptic mechanisms of synchronized gamma oscillations in inhibitory interneuron networks. Nature Reviews Neuroscience 8, 45–56. 10.1038/nrn2044. [DOI] [PubMed] [Google Scholar]
- 27.Buzsáki G, and Wang X-J (2012). Mechanisms of Gamma Oscillations. Annual Review of Neuroscience 35, 203–225. 10.1146/annurev-neuro-062111-150444. [DOI] [PMC free article] [PubMed] [Google Scholar]
- 28.Traub RD, Bibbig A, LeBeau FEN, Buhl EH, and Whittington MA (2004). Cellular mechanisms of neuronal population oscillations in the hippocampus in vitro. Annu Rev Neurosci 27, 247–278. 10.1146/annurev.neuro.27.070203.144303. [DOI] [PubMed] [Google Scholar]
- 29.Shadlen MN, and Movshon JA (1999). Synchrony Unbound: A Critical Evaluation of the Temporal Binding Hypothesis. Neuron 24, 67–77. [DOI] [PubMed] [Google Scholar]
- 30.Singer W (1999). Neuronal Synchrony: A Versatile Code for the Definition of Relations? Neuron 24, 49–65. 10.1016/S0896-6273(00)80821-1. [DOI] [PubMed] [Google Scholar]
- 31.Singer W (2018). Neuronal oscillations: unavoidable and useful? European Journal of Neuroscience. 10.1111/ejn.13796. [DOI] [PubMed] [Google Scholar]
- 32.Ray S, and Maunsell JHR (2015). Do gamma oscillations play a role in cerebral cortex? Trends in Cognitive Sciences 19, 78–85. 10.1016/j.tics.2014.12.002. [DOI] [PMC free article] [PubMed] [Google Scholar]
- 33.Thiele A, and Stoner G (2003). Selective gating of visual signals by microstimulation of frontal cortex. Nature 421, 366–370. 10.1038/nature01284. [DOI] [PubMed] [Google Scholar]
- 34.Bartos M, Vida I, Frotscher M, Meyer A, Monyer H, Geiger JRP, and Jonas P (2002). Fast synaptic inhibition promotes synchronized gamma oscillations in hippocampal interneuron networks. Proc Natl Acad Sci U S A 99, 13222–13227. 10.1073/pnas.192233099. [DOI] [PMC free article] [PubMed] [Google Scholar]
- 35.Hasenstaub A, Shu Y, Haider B, Kraushaar U, Duque A, and McCormick DA (2005). Inhibitory Postsynaptic Potentials Carry Synchronized Frequency Information in Active Cortical Networks. Neuron 47, 423–435. 10.1016/j.neuron.2005.06.016. [DOI] [PubMed] [Google Scholar]
- 36.Hasenstaub A, Otte S, and Callaway E (2016). Cell Type-Specific Control of Spike Timing by Gamma-Band Oscillatory Inhibition. Cereb Cortex 26, 797–806. 10.1093/cercor/bhv044. [DOI] [PMC free article] [PubMed] [Google Scholar]
- 37.Perrenoud Q, Pennartz CMA, and Gentet LJ (2016). Membrane Potential Dynamics of Spontaneous and Visually Evoked Gamma Activity in V1 of Awake Mice. PLOS Biology 14, e1002383. 10.1371/journal.pbio.1002383. [DOI] [PMC free article] [PubMed] [Google Scholar]
- 38.Tukker JJ, Fuentealba P, Hartwich K, Somogyi P, and Klausberger T (2007). Cell type-specific tuning of hippocampal interneuron firing during gamma oscillations in vivo. J Neurosci 27, 8184–8189. 10.1523/JNEUROSCI.1685-07.2007. [DOI] [PMC free article] [PubMed] [Google Scholar]
- 39.Wulff P, Ponomarenko AA, Bartos M, Korotkova TM, Fuchs EC, Bähner F, Both M, Tort ABL, Kopell NJ, Wisden W, et al. (2009). Hippocampal theta rhythm and its coupling with gamma oscillations require fast inhibition onto parvalbumin-positive interneurons. Proc Natl Acad Sci U S A 106, 3561–3566. 10.1073/pnas.0813176106. [DOI] [PMC free article] [PubMed] [Google Scholar]
- 40.Zhang Z, Russell LE, Packer AM, Gauld OM, and Häusser M (2018). Closed-loop all-optical interrogation of neural circuits in vivo. Nat Methods 15, 1037–1040. 10.1038/s41592-018-0183-z. [DOI] [PMC free article] [PubMed] [Google Scholar]
- 41.Sohal VS, and Huguenard JR (2005). Inhibitory coupling specifically generates emergent gamma oscillations in diverse cell types. Proc Natl Acad Sci U S A 102, 18638–18643. 10.1073/pnas.0509291102. [DOI] [PMC free article] [PubMed] [Google Scholar]
- 42.Long MA, Jutras MJ, Connors BW, and Burwell RD (2005). Electrical synapses coordinate activity in the suprachiasmatic nucleus. Nat Neurosci 8, 61–66. 10.1038/nn1361. [DOI] [PubMed] [Google Scholar]
- 43.Neske GT, and Connors BW (2016). Synchronized gamma-frequency inhibition in neocortex depends on excitatory-inhibitory interactions but not electrical synapses. J Neurophysiol 116, 351–368. 10.1152/jn.00071.2016. [DOI] [PMC free article] [PubMed] [Google Scholar]
- 44.Traub RD, Kopell N, Bibbig A, Buhl EH, LeBeau FE, and Whittington MA (2001). Gap junctions between interneuron dendrites can enhance synchrony of gamma oscillations in distributed networks. J Neurosci 21, 9478–9486. [DOI] [PMC free article] [PubMed] [Google Scholar]
- 45.Cardin JA, Carlén M, Meletis K, Knoblich U, Zhang F, Deisseroth K, Tsai L-H, and Moore CI (2009). Driving fast-spiking cells induces gamma rhythm and controls sensory responses. Nature 459, 663–667. 10.1038/nature08002. [DOI] [PMC free article] [PubMed] [Google Scholar]
- 46.Sohal VS, Zhang F, Yizhar O, and Deisseroth K (2009). Parvalbumin neurons and gamma rhythms enhance cortical circuit performance. Nature 459, 698–702. 10.1038/nature07991. [DOI] [PMC free article] [PubMed] [Google Scholar]
- 47.Gray CM, Koenig P, Engel AK, and Singer W (1989). Oscillatory responses in cat visual cortex exhibit inter-columnar synchronization which reflects global stimulus properties. Nature 338, 334–337. [DOI] [PubMed] [Google Scholar]
- 48.Self MW, Peters JC, Possel JK, Reithler J, Goebel R, Ris P, Jeurissen D, Reddy L, Claus S, Baayen JC, et al. (2016). The Effects of Context and Attention on Spiking Activity in Human Early Visual Cortex. PLOS Biology 14, e1002420. 10.1371/journal.pbio.1002420. [DOI] [PMC free article] [PubMed] [Google Scholar]
- 49.Chen G, Zhang Y, Li X, Zhao X, Ye Q, Lin Y, Tao HW, Rasch MJ, and Zhang X (2017). Distinct Inhibitory Circuits Orchestrate Cortical beta and gamma Band Oscillations. Neuron 96, 1403–1418.e6. 10.1016/j.neuron.2017.11.033. [DOI] [PMC free article] [PubMed] [Google Scholar]
- 50.Veit J, Hakim R, Jadi MP, Sejnowski TJ, and Adesnik H (2017). Cortical gamma band synchronization through somatostatin interneurons. Nature Neuroscience 20, 951–959. 10.1038/nn.4562. [DOI] [PMC free article] [PubMed] [Google Scholar]
- 51.Hakim R, Shamardani K, and Adesnik H (2018). A neural circuit for gamma-band coherence across the retinotopic map in mouse visual cortex. eLife 7. 10.7554/eLife.28569. [DOI] [PMC free article] [PubMed] [Google Scholar]
- 52.Adesnik H, Bruns W, Taniguchi H, Huang ZJ, and Scanziani M (2012). A neural circuit for spatial summation in visual cortex. Nature 490, 226–231. 10.1038/nature11526. [DOI] [PMC free article] [PubMed] [Google Scholar]
- 53.Nienborg H, Hasenstaub A, Nauhaus I, Taniguchi H, Huang ZJ, and Callaway EM (2013). Contrast Dependence and Differential Contributions from Somatostatin- and Parvalbumin-Expressing Neurons to Spatial Integration in Mouse V1. Journal of Neuroscience 33, 11145–11154. 10.1523/JNEUROSCI.5320-12.2013. [DOI] [PMC free article] [PubMed] [Google Scholar]
- 54.Keller AJ, Dipoppa M, Roth MM, Caudill MS, Ingrosso A, Miller KD, and Scanziani M (2020). A Disinhibitory Circuit for Contextual Modulation in Primary Visual Cortex. Neuron 108. 10.1101/2020.01.31.929166. [DOI] [PMC free article] [PubMed] [Google Scholar]
- 55.Mossing DP, Veit J, Palmigiano A, Miller KD, and Adesnik H (2021). Antagonistic inhibitory subnetworks control cooperation and competition across cortical space (BioRxiv) 10.1101/2021.03.31.437953. [DOI] [Google Scholar]
- 56.Saleem AB, Lien AD, Krumin M, Haider B, Rosón MR, Ayaz A, Reinhold K, Busse L, Carandini M, and Harris KD (2017). Subcortical Source and Modulation of the Narrowband Gamma Oscillation in Mouse Visual Cortex. Neuron 93, 315–322. 10.1016/j.neuron.2016.12.028. [DOI] [PMC free article] [PubMed] [Google Scholar]
- 57.Storchi R, Bedford RA, Martial FP, Allen AE, Wynne J, Montemurro MA, Petersen RS, and Lucas RJ (2017). Modulation of Fast Narrowband Oscillations in the Mouse Retina and dLGN According to Background Light Intensity. Neuron 93, 299–307. 10.1016/j.neuron.2016.12.027. [DOI] [PubMed] [Google Scholar]
- 58.Hoseini MS, Higashikubo B, Cho FS, Chang AH, Clemente-Perez A, Lew I, Ciesielska A, Stryker MP, and Paz JT (2021). Gamma rhythms and visual information in mouse V1 specifically modulated by somatostatin+ neurons in reticular thalamus. Elife 10. 10.7554/eLife.61437. [DOI] [PMC free article] [PubMed] [Google Scholar]
- 59.Pfeffer CK, Xue M, He M, Huang ZJ, and Scanziani M (2013). Inhibition of inhibition in visual cortex: the logic of connections between molecularly distinct interneurons. Nature Neuroscience 16, 1068–1076. 10.1038/nn.3446. [DOI] [PMC free article] [PubMed] [Google Scholar]
- 60.Pi H-J, Hangya B, Kvitsiani D, Sanders JI, Huang ZJ, and Kepecs A (2013). Cortical interneurons that specialize in disinhibitory control. Nature 503, 521–524. 10.1038/nature12676. [DOI] [PMC free article] [PubMed] [Google Scholar]
- 61.Karnani MM, Jackson J, Ayzenshtat I, Hamzehei Sichani A, Manoocheri K, Kim S, and Yuste R (2016). Opening Holes in the Blanket of Inhibition: Localized Lateral Disinhibition by VIP Interneurons. Journal of Neuroscience 36, 3471–3480. 10.1523/JNEUROSCI.3646-15.2016. [DOI] [PMC free article] [PubMed] [Google Scholar]
- 62.Millman DJ, Ocker GK, Caldejon S, Kato I, Larkin JD, Lee EK, Luviano J, Nayan C, Nguyen TV, North K, et al. (2020). VIP interneurons in mouse primary visual cortex selectively enhance responses to weak but specific stimuli. eLife 9, e55130. 10.7554/eLife.55130. [DOI] [PMC free article] [PubMed] [Google Scholar]
- 63.Hermes D, Miller KJ, Wandell BA, and Winawer J (2015). Stimulus Dependence of Gamma Oscillations in Human Visual Cortex. Cereb Cortex 25, 2951–2959. 10.1093/cercor/bhu091. [DOI] [PMC free article] [PubMed] [Google Scholar]
- 64.Bartoli E, Bosking W, Chen Y, Li Y, Sheth SA, Beauchamp MS, Yoshor D, and Foster BL (2019). Functionally Distinct Gamma Range Activity Revealed by Stimulus Tuning in Human Visual Cortex. Curr Biol 29, 3345–3358.e7. 10.1016/j.cub.2019.08.004. [DOI] [PMC free article] [PubMed] [Google Scholar]
- 65.Peter A, Uran C, Klon-Lipok J, Roese R, van Stijn S, Barnes W, Dowdall JR, Singer W, Fries P, and Vinck M (2019). Surface color and predictability determine contextual modulation of V1 firing and gamma oscillations. Elife 2019, 38. [DOI] [PMC free article] [PubMed] [Google Scholar]
- 66.Bosman CA, Schoffelen J-M, Brunet N, Oostenveld R, Bastos AM, Womelsdorf T, Rubehn B, Stieglitz T, De Weerd P, and Fries P (2012). Attentional Stimulus Selection through Selective Synchronization between Monkey Visual Areas. Neuron 75, 875–888. 10.1016/j.neuron.2012.06.037. [DOI] [PMC free article] [PubMed] [Google Scholar]
- 67.Lee S, Kruglikov I, Huang ZJ, Fishell G, and Rudy B (2013). A disinhibitory circuit mediates motor integration in the somatosensory cortex. Nature Neuroscience 16, 1662–1670. 10.1038/nn.3544. [DOI] [PMC free article] [PubMed] [Google Scholar]
- 68.Fu Y, Tucciarone JM, Espinosa JS, Sheng N, Darcy DP, Nicoll RA, Huang ZJ, and Stryker MP (2014). A Cortical Circuit for Gain Control by Behavioral State. Cell 156, 1139–1152. 10.1016/j.cell.2014.01.050. [DOI] [PMC free article] [PubMed] [Google Scholar]
- 69.Jackson J, Ayzenshtat I, Karnani MM, and Yuste R (2016). VIP+ interneurons control neocortical activity across brain states. J Neurophysiol 115, 3008–3017. 10.1152/jn.01124.2015. [DOI] [PMC free article] [PubMed] [Google Scholar]
- 70.Niell CM, and Stryker MP (2010). Modulation of Visual Responses by Behavioral State in Mouse Visual Cortex. Neuron 65, 472–479. 10.1016/j.neuron.2010.01.033. [DOI] [PMC free article] [PubMed] [Google Scholar]
- 71.Bos H, Oswald A-M, and Doiron B (2020). Untangling stability and gain modulation in cortical circuits with multiple interneuron classes 10.1101/2020.06.15.148114. [DOI] [Google Scholar]
- 72.Salinas E, and Sejnowski TJ (2001). Correlated neuronal activity and the flow of neural information. Nature reviews neuroscience 2, 539–550. [DOI] [PMC free article] [PubMed] [Google Scholar]
- 73.Schneider M, Broggini AC, Dann B, Tzanou A, Uran C, Sheshadri S, Scherberger H, and Vinck M (2021). A mechanism for inter-areal coherence through communication based on connectivity and oscillatory power. Neuron, S0896627321007108. 10.1016/j.neuron.2021.09.037. [DOI] [PMC free article] [PubMed] [Google Scholar]
- 74.Vezoli J, Vinck M, Bosman CA, Bastos AM, Lewis CM, Kennedy H, and Fries P (2021). Brain rhythms define distinct interaction networks with differential dependence on anatomy. Neuron 109, 3862–3878.e5. 10.1016/j.neuron.2021.09.052. [DOI] [PMC free article] [PubMed] [Google Scholar]
- 75.Zhang S, Xu M, Kamigaki T, Hoang Do JP, Chang W-C, Jenvay S, Miyamichi K, Luo L, and Dan Y (2014). Long-range and local circuits for top-down modulation of visual cortex processing. Science 345, 660–665. 10.1126/science.1254126. [DOI] [PMC free article] [PubMed] [Google Scholar]
- 76.Xu X, and Callaway EM (2009). Laminar Specificity of Functional Input to Distinct Types of Inhibitory Cortical Neurons. Journal of Neuroscience 29, 70–85. 10.1523/JNEUROSCI.4104-08.2009. [DOI] [PMC free article] [PubMed] [Google Scholar]
- 77.Karnani MM, Jackson J, Ayzenshtat I, Tucciarone J, Manoocheri K, Snider WG, and Yuste R (2016). Cooperative Subnetworks of Molecularly Similar Interneurons in Mouse Neocortex. Neuron 90, 86–100. 10.1016/j.neuron.2016.02.037. [DOI] [PMC free article] [PubMed] [Google Scholar]
- 78.Gradinaru V, Zhang F, Ramakrishnan C, Mattis J, Prakash R, Diester I, Goshen I, Thompson KR, and Deisseroth K (2010). Molecular and Cellular Approaches for Diversifying and Extending Optogenetics. Cell 141, 154–165. 10.1016/j.cell.2010.02.037. [DOI] [PMC free article] [PubMed] [Google Scholar]
- 79.Brainard DH (1997). The Psychophysics Toolbox. Spat Vis 10, 433–436. [PubMed] [Google Scholar]
- 80.Mitra P, and Bokil H (2007). Observed Brain Dynamics (Oxford University Press; ). [Google Scholar]
- 81.Pluta S, Naka A, Veit J, Telian G, Yao L, Hakim R, Taylor D, and Adesnik H (2015). A direct translaminar inhibitory circuit tunes cortical output. Nature Neuroscience 18, 1631–1640. 10.1038/nn.4123. [DOI] [PMC free article] [PubMed] [Google Scholar]
- 82.Vinck M, van Wingerden M, Womelsdorf T, Fries P, and Pennartz CMA (2010). The pairwise phase consistency: A bias-free measure of rhythmic neuronal synchronization. NeuroImage 51, 112–122. 10.1016/j.neuroimage.2010.01.073. [DOI] [PubMed] [Google Scholar]
- 83.Pachitariu M, Stringer C, Dipoppa M, Schröder S, Rossi LF, Dalgleish H, Carandini M, and Harris KD (2017). Suite2p: beyond 10,000 neurons with standard two-photon microscopy. bioRxiv, 061507. 10.1101/061507. [DOI] [Google Scholar]
- 84.Pluta SR, Lyall EH, Telian GI, Ryapolova-Webb E, and Adesnik H (2017). Surround Integration Organizes a Spatial Map during Active Sensation. Neuron 94, 1220–1233.e5. 10.1016/j.neuron.2017.04.026. [DOI] [PMC free article] [PubMed] [Google Scholar]
- 85.Friedrich J, Zhou P, and Paninski L (2017). Fast online deconvolution of calcium imaging data. PLoS Comput Biol 13, e1005423. 10.1371/journal.pcbi.1005423. [DOI] [PMC free article] [PubMed] [Google Scholar]
Associated Data
This section collects any data citations, data availability statements, or supplementary materials included in this article.
Supplementary Materials
Data Availability Statement
The electrophysiological and imaging data reported in this paper will be shared by the lead contact upon request.
All original code for the electrophysiological and imaging analysis, as well as for the numerical simulations and corresponding theory has been deposited at Zenodo and is publicly available as of the date of publication. DOIs are listed in the key resources table.
Any additional information required to reanalyze the data reported in this paper is available from the lead contact upon request.
Key resources table.
| REAGENT or RESOURCE | SOURCE | IDENTIFIER |
|---|---|---|
| Antibodies | ||
| Bacterial and virus strains | ||
| AAV9-EF1a-DIO-eNpHR3.0-YFP | Addgene | 26966-AAV9 |
| Biological samples | ||
| Chemicals, peptides, and recombinant proteins | ||
| Ketamine/Xylazine | Sigma-Adrich | Cat# K113 |
| Metabond | Parkell | http://parkell.com |
| 3M Vetbond | Fisher scientific | Cat# 10430774 |
| Critical commercial assays | ||
| Deposited data | ||
| Experimental models: Cell lines | ||
| Experimental models: Organisms/strains | ||
| CD-1 (ICR) | Charles River | 022 |
| Vip-IRES-cre | The Jackson Laboratory | RRID:IMSR_JAX:010908 |
| Sst-IRES-cre | The Jackson Laboratory | RRID:IMSR_JAX:013044 |
| Ai162(TIT2L-GC6s-ICL-tTA2)-D | The Jackson Laboratory | RRID:IMSR_JAX:031562 |
| Oligonucleotides | ||
| Recombinant DNA | ||
| Software and algorithms | ||
| MATLAB | MathWorks | RRID:SCR_001622 |
| Psychophysics Toolbox | http://psychtoolbox.org | RRID:SCR_002881 |
| Chronux Toolbox | http://chronux.org/ | RRID:SCR_005547 |
| UltraMega Sort | https://neurophysics.ucsd.edu/software.php | RRID:SCR_015857 |
| MClust | http://redishlab.neuroscience.umn.edu/MClust/MClust.html | |
| EEGLAB | http://sccn.ucsd.edu/eeglab/index.html | RRID:SCR_007292 |
| Circular statistics toolbox | https://de.mathworks.com/matlabcentral/fileexchange/10676-circular-statistics-toolbox-directional-statistics | RRID:SCR_016651 |
| Suite2P | https://github.com/cortex-lab/Suite2P | RRID:SCR_016434 |
| OASIS: Fast online deconvolution of calcium imaging data | https://github.com/j-friedrich/OASIS | |
| original code for the numerical simulations and corresponding theory | https://zenodo.org/record/7186510 | 10.5281/zenodo.7192074 |
| original code for analysis of electrophysiological data | https://zenodo.org/record/7198169 | 10.5281/zenodo.7198169 |
| original code for analysis of imaging data | https://zenodo.org/record/7199471 | 10.5281/zenodo.7199471 |
| Other | ||
| Spike Gadgets MCU | Spike Gadgets | RRID:SCR_021623 |
| Drummond Nanoject II | https://www.drummondsci.com/product/microinjection/nanoject-ii-auto-nanoliter-injector/ | Cat. No. 3-000-204 |
| Fiber-Coupled LED | Thorlabs.com | M625F2 |
| NI-DAQ card | Ni.com | NI PCIe-6353 |
| Linear 16 channel probe | Neuronexus | A1x16-5mm-25-177-A16 |
| uMp-4 micromanipulator | Sensapex | uMp-4 micromanipulator |