Abstract
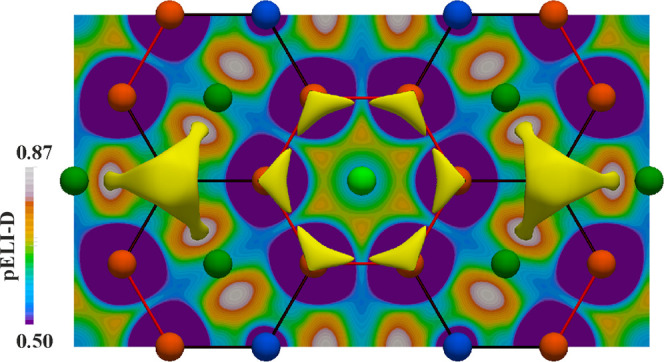
The complete structure revision of the RE2PdGe3 (RE = rare-earth metal) series revealed that Yb2PdGe3 is the only AlB2 ordered superstructure. Good-quality single crystals of this compound were successfully grown from molten indium flux, enabling accurate single-crystal investigations. Yb2PdGe3 crystallizes with the Ce2CoSi3-type structure in the hexagonal space group P6/mmm (no. 191) with lattice parameters a = 8.468(1) Å and c = 4.0747(7) Å. This structure is a four-order derivative of AlB2, composed of planar ∞2[PdGe3] honeycomb layers spaced by Yb species, located at the center of Ge6 and Ge4Pd2 hexagons. A superconducting transition is observed below the critical temperature of 4 K. A divalent state of Yb is deduced from magnetic susceptibility measurements below room temperature, which indicate an almost nonmagnetic behavior. A charge transfer from Yb to Pd and Ge was evidenced by the Quantum Theory of Atoms in Molecules (QTAIM) effective charges; polar four-atomic Ge–Pd/Yb and two-atomic Pd–Yb bonds were observed from the ELI-D (electron localizability indicator), partial ELI-D, and ELI-D/QTAIM intersections. The bonding interactions between Ge atoms within regular Ge6 hexagons are found to be intermediate between single bonds, as in elemental Ge, and higher-order bonds in the hypothetic Ge6H6 and Ge6 aromatic molecules.
Short abstract
The Yb2PdGe3 intermetallic was found to be the only AlB2 ordered superstructure within the RE2PdGe3 (RE = rare-earth metal) series. Single crystals of such phase were successfully grown in indium flux. Yb2PdGe3 is a type II superconductor composed of two-dimensional ∞2[PdGe3] honeycomb anionic layers spaced by Yb cations. The Ge–Ge interactions are analyzed based on a comparative analysis with the Ge6H6 and Ge6 molecules.
1. Introduction
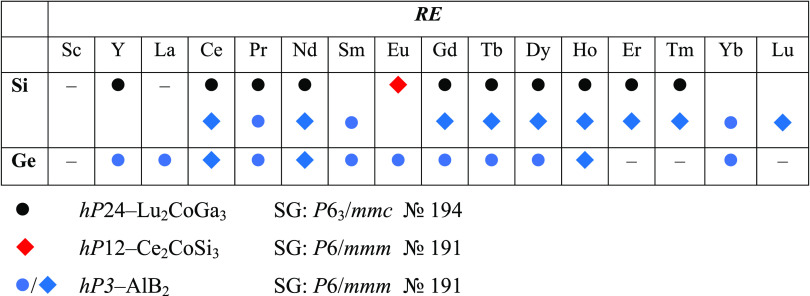
Ternary rare-earth tetrelides RE–T–Tt (RE = rare-earth metal; T = transition metal; Tt = tetrel element) have been heavily studied due to their intriguing structure peculiarities, unconventional physical properties, and unprecedented bonding scenarios.1−10 Among them, intermetallics crystallizing with a disordered AlB2-type structure or with one of its ordered derivatives11 have attracted particular attention since the discovery of superconductivity with Tc ∼ 39 K in MgB2,12 featuring similar honeycomb-like layers. Unfortunately, investigations of physical properties of these compounds were frequently not accompanied by accurate and in-depth structural analyses, which are indeed crucial to enable a correct interpretation of the observed phenomena. This is the case for compounds with 33.3 atom % RE; 16.7 atom % Pd; and 50.0 atom % Tt nominal composition, corresponding to the 2:1:3 stoichiometry.13 As shown in Table 1, both silicides and germanides were found to exist with almost all of the REs.14
Table 1. Crystal Structures Reported in the Literature for RE–Pd–{Si, Ge} Phases of 2:1:3 Compositiona.
● indicates that only cell parameters and the structure type were assigned and ◆ indicates a complete structure determination.
Most of the silicides were first reported as hP24-Lu2CoGa3, an ordered superstructure of AlB2,11 and subsequently revised in some cases as disordered, i.e., hP3-AlB2, based on more accurate structural investigations. The Eu-containing compound is the only one crystallizing with the hP12-Ce2CoSi3 structure, which is an AlB2 derivative as well.11 Moving to Ge, no superstructures have been reported;15 nevertheless, a complete structure determination was performed only in a few cases, i.e., with Ce, Nd, and Ho. Although many of such phases have been described as disordered and assigned to the AlB2 type, they were often referred to with the misleading RE2PdTt3 formula, instead of RE(PdxGe1–x)2 (with x = 0.25). Additionally, it is worth mentioning that the formation of an ordered Lu2CoGa3 or Ce2CoSi3 superstructure would lead to symmetrically inequivalent RE sites, which must be considered to correctly interpret the measured magnetic properties. In fact, both ferro16−18 and antiferromagnetic13,17 order were detected in several cases. Interestingly, “Y2PdGe3” is the only representative displaying a superconducting behavior below ∼3 K.16,19 Given this unique feature and the less accurate crystallographic data reported for the germanides with respect to the silicides, a complete structural reinvestigation along the whole RE series was performed for the “RE2PdGe3” phases, paying particular attention to the possible formation of ordered structures. As the main focus of this paper, we report on the successful synthesis of the novel Yb2PdGe3 intermetallic, prepared both from metal flux (indium) and by direct synthesis. Its crystal structure solution and group–subgroup relations with AlB2 are presented together with magnetic properties and chemical bonding analysis. In fact, the involved elements together with the structural features based on Ge–Ge interactions suggest approaching the chemical bonding, applying the Zintl–Klemm concept. To explain the deviations from this ideal model, it is necessary to investigate the alternative ways through which the system compensates for insufficient charge transfer and electron deficiency. For instance, in molecular chemistry, this is achieved by the formation of multiple bonds comprising π-interactions as in aromatic molecules. The similarity between the honeycomb-like layers in the compounds of interest and the widespread hexagonal aromatic cycles, together with previous studies on intermetallic π-systems,20−22 inspired a comparative chemical bonding analysis between Yb2PdGe3 and ad hoc simulated molecular analogues. This contribution highlights the importance of a more general perspective in studying chemical bonding, overcoming the classic boundaries between solid-state and molecular chemistry.
2. Experimental Section
2.1. Synthetic Procedures
Samples of nominal composition 33.3 atom % RE; 16.7 atom % Pd; and 50.0 atom % Ge (RE = Y, La–Nd, Sm, Gd–Er, Yb) were synthesized to check for the existence of the ordered RE2PdGe3 phase. The starting materials were rods of the rare-earth metals (supplied by NewMet Ltd., Waltham Abbey, U.K.) with a freshly cleaned surface, palladium foils, and germanium chunks (supplied by MaTecK, Jülich, Germany), all with a nominal purity > 99.9 mass %. Ingots of about 0.8 g were obtained by melting stoichiometric amounts of the pristine elements.
Samples with RE = Y, La–Nd, Gd, Tb, Er were prepared by arc melting on a water-cooled copper heart with a tungsten electrode under ∼1 bar of Ar gas. The obtained alloys were flipped and arc-melted multiple times, ensuring their homogeneity. Weight losses were always lower than 1%.
Samples with RE = Sm, Dy, Ho, Yb were prepared by induction melting of the elements enclosed in arc-welded Ta crucibles to avoid element losses. The melting procedure was performed under a continuous argon flow, to prevent the high-temperature oxidation of the crucible, and repeated several times to guarantee homogeneity. These samples were characterized both in the as-cast state and after annealing at 800 °C for 3 weeks.
To obtain single-phase samples of Yb2PdGe3 necessary for physical properties measurements, stoichiometric amounts of the constituents were inserted in an arc-welded Ta crucible and then closed in an evacuated quartz ampoule to avoid oxidation. Subsequently, the ampoule was hung in a resistance furnace and submitted to the following thermal cycle while rotating at a speed of 100 rpm: heating (10 °C min–1) up to 750 °C; heating (1 °C min–1) up to 950 °C; cooling (∼0.2 °C min–1) down to 800 °C. Then, the rotation was disabled, the sample kept at 800 °C for 1 week, and finally water quenched. The resulting alloy of metallic luster was ground to fine powders in an agate mortar and pressed into a pellet. The pellet was enclosed in an arc-sealed Ta crucible, put in an evacuated quartz phial, and annealed at 800 °C for 1 month prior to quenching in water.
Single crystals of Yb2PdGe3 suitable for X-ray diffraction analysis were grown from an indium flux. For this purpose, stoichiometric amounts of Yb, Pd, and Ge giving the Yb33.3Pd16.7Ge50.0 nominal composition were placed in an arc-sealed Ta crucible with 1:45 molar excess of In (chunk, 99.99%, supplied by NewMet Ltd., Waltham Abbey, U.K.). The total mass was of about 3 g. Thus, the Ta crucible, closed in an evacuated quartz ampoule, was hung in a resistance furnace, heated up to 750 °C in about 1 h, and kept at that temperature for 1 day. Then, it was cooled to room temperature in 24 h. During the whole treatment, a continuous rotation at 100 rpm was applied.
Aiming at separating the single crystals of Yb2PdGe3 from the In flux, pieces of the obtained ingot were laid down on a glass wool filter and sealed in a quartz tube. The specimen was then preheated at 300 °C in a resistance furnace and centrifugated at a speed of 600 rpm for about 1 min. This procedure was repeated several times, enabling to obtain shiny gray crystals of Yb2PdGe3. Residual indium deposited on the crystal surfaces was selectively oxidized by immersion and sonication of the crystals in glacial acetic acid for about 2 h.
2.2. Scanning Electron Microscopy and Elemental Analysis
Metallographic analysis was performed on each sample. Small pieces were embedded in a conductive carbon-containing phenolic resin by means of an automatic hot compression mounting press Opal 410 (ATM GmbH, Germany) and submitted to a multistep grinding (SiC papers from 600 to 1200 mesh) and polishing (from 6 to 1 μm diamond pastes) procedure with the aid of an automatic polishing machine Saphir 520 (ATM GmbH, Germany). After each polishing step, sample surfaces were cleaned for a few minutes in an ultrasonic bath using petroleum ether. Several Yb2PdGe3 single crystals separated from the In flux were placed on a conductive carbon resin and analyzed as such. Microstructure examination as well as semiquantitative elemental analysis of the observed phases were performed using a scanning electron microscope (SEM) Zeiss Evo 40 (Carl Zeiss SMT Ltd., Cambridge, England), equipped with an energy dispersive X-ray (EDX) spectroscope from Oxford Instruments (INCA X-ACT). The calibration was effectuated on a cobalt standard.
2.3. X-ray Diffraction (XRD) Experiments
Single crystals of Yb2PdGe3 with metallic luster were extracted both from the mechanically fragmented sample prepared by direct synthesis and from the metal flux medium (In) after suitable centrifugation and selective oxidation. Due to their quality (see Figure 1), the flux-separated crystals were measured by single-crystal X-ray diffraction. A complete data set was obtained in a routine fashion at ambient conditions on a three-circle Bruker Kappa APEXII CCD area-detector diffractometer equipped by the graphite monochromatized Mo Kα (λ = 0.71073 Å) radiation, operating in ω-scan mode. Crystals were glued on glass fibers, mounted on a goniometric head, and placed in the goniostat. Intensity data were collected over the reciprocal space up to ∼30° in θ (achieving a ∼0.7 Å resolution) with exposures of 20 s per frame.
Figure 1.
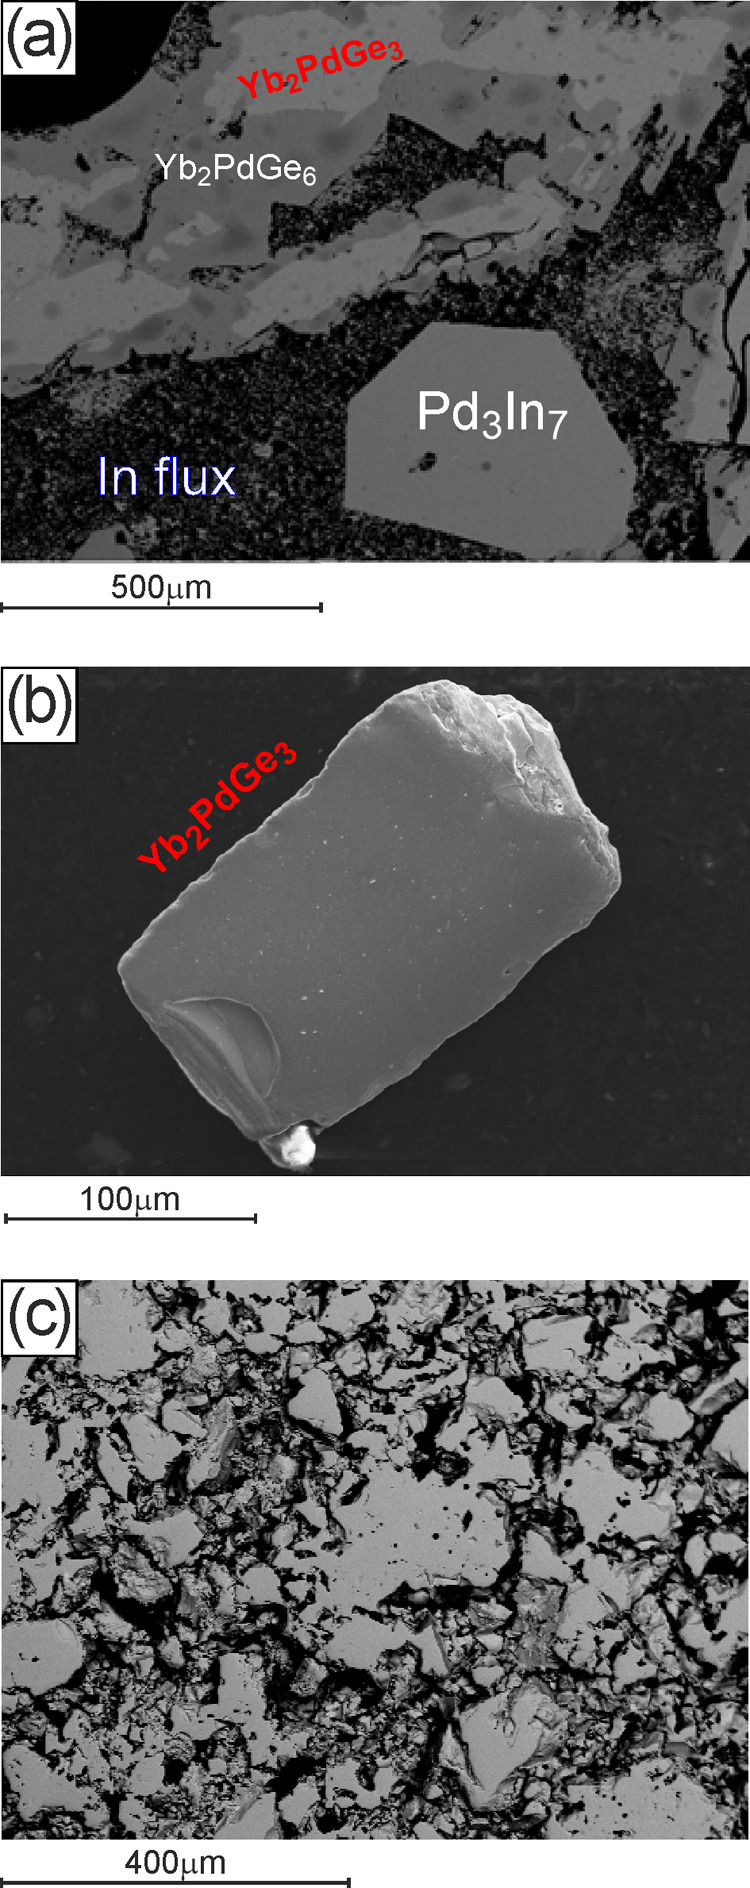
SEM micrographs of Yb–Pd–Ge samples: (a) synthesized by flux method, prior In removal (bulk)-BSE mode; (b) synthesized by flux method, after In removal (single crystal)-SE mode; and (c) obtained by direct synthesis followed by sintering at 800 °C-BSE mode.
Data collection was performed, and the unit cell was initially refined using APEX4 [v2021.10-0].23 Successively, data were reduced using SAINT [v8.30A]24 and XPREP [v2014/2].25 Lorentz, polarization, and absorption effects were corrected using SADABS [v2016/2].26 The structure was solved and refined with the aid of the programs JANA200627 and SHELXL-2019/1.28
The corresponding CIF file, available in the Supporting Information, has been deposited at the Cambridge Database with the depository number CSD-2230957. Selected crystallographic data and structure refinement parameters for the studied single crystal are listed in Table 2. Details on the structure solution are discussed in Section 3.2.
Table 2. Crystallographic Data for Yb2PdGe3.
| empirical formula | Yb2PdGe3 |
| EDXS data | Yb34.2Pd17.6Ge48.2 |
| space group, Z | P6/mmm, 2 |
| Pearson’s symbol/prototype | hP12-Ce2CoSi3 |
| Mw[g/mol] | 670.42 |
| a [Å] | 8.468(1) |
| c [Å] | 4.0747(7) |
| V [Å3] | 253.06(7) |
| calc. density [g/cm3] | 8.796 |
| abs coeff (μ), mm–1 | 57.5 |
| unique reflections | 204 |
| reflections I > 2σ(I) | 200 |
| Rsigma | 0.0143 |
| data/parameters | 204/13 |
| GOF on F2 (S) | 1.46 |
| R indices [I > 2σ(I)] | R1 = 0.0188; wR2 = 0.0782 |
| R indices [all data] | R1 = 0.0193; wR2 = 0.0785 |
| Δρfin(max/min), [e/Å3] | 1.74/–1.67 |
X-ray powder diffraction (XRPD) measurements were performed on all samples using a Philips X’Pert MPD vertical diffractometer (Cu Kα radiation, λ = 1.5406 Å, graphite crystal monochromator, PIXcel1D detector). Rietveld refinement was conducted using the Fullprof29 software on the powder pattern of the sample submitted to physical properties measurements.
2.4. Physical Properties Measurements
Magnetic measurements were carried out using a 7 T Squid magnetometer (S700 X from Cryogenics, Ltd.) on a polycrystalline sample with an approximate mass of 10–20 mg inside a transparent capsule of 5 mm diameter. Diamagnetic signals from the gelatine capsule and straw were corrected; ZFC (zero-field cooling) and FC (field cooling) magnetic susceptibility curves were taken at different DC magnetic fields, (2.5, 5, and 10 mT) in the temperature range 1.6–300 K. Isothermal magnetization curves and hysteresis loops up to 5 T at selected temperatures were also obtained.
2.5. Computational Details
The electronic structure of Yb2PdGe3 was calculated by means of the all-electron full-potential local-orbital FPLO code30,31 using the experimentally determined structure. The local spin density approximation (LSDA) to the density functional theory (DFT) as parametrized by Perdew and Wang (PW)32 were employed to account for exchange and correlation. Relativistic effects were treated at the scalar-relativistic level. Moreover, the LSDA+U method was applied due to the localized nature of the Yb 4f states. The on-site Coulomb repulsion parameter U was set to the characteristic FPLO value of 8 eV.33,34 The atomic limit (AL) method was selected as the double-count correction scheme. The Brillouin zone was sampled with a (4 4 8) k-point mesh. Position-space chemical bonding analysis was performed by combining topological analysis of the electron density (ED) and the electron localizability indicator, in its ELI-D35−37 representation, using the software DGrid.38,39 The two scalar fields were both calculated in an equidistant grid of about 0.05 Bohr using an implemented module within the FPLO code.40 The ED was analyzed within the framework of the Bader’s Quantum Theory of Atoms In Molecules (QTAIM).41 For this purpose, the crystal space was partitioned into nonoverlapping and space-filling regions, the atomic basins, based on the gradient vector field of the ED. Its integration within each QTAIM atom gives its average electronic population that is subtracted from the atomic number providing the atomic effective charges (Qeff). The application of the same procedure to the ELI-D separates the crystal space into core and valence basins, giving access to bonding interactions among the constituents. Molecular calculations for hexagermanbenzene, Ge6H6, and Ge66– were effectuated with the all-electron FHI-aims software. Atomic coordinates were optimized starting from planar geometries using the LDA/PW, GGA/PBE,42 and B3LYP43 exchange and correlation functionals. For both Ge and H, the predefined default “tight” basis sets were chosen and scalar-relativistic effects for all electrons were taken into account within the zero-order regular approximation (ZORA). The ED, ELI-D, and partial ELI-D (pELI)36,44 were evaluated using the program DGrid39 on the basis of the obtained wave functions. Scalar fields and the related basins for both Yb2PdGe3 and the molecules were visualized with the aid of the ParaView45,46 application.
3. Results and Discussion
3.1. Results of SEM/EDXS/XRPD Characterization
Characterization of the RE33.3Pd16.7Ge50.0 samples (RE = Y, La–Nd, Sm, Gd–Er) confirmed the literature data on the existence of the RE(PdxGe1–x)2 phases with an average composition close to the 2:1:3 stoichiometry and an AlB2-like crystal structure, where Pd and Ge share the 2d crystallographic site; phases comprising La and Ce turned out to be tetragonal (see Table S1). The Er-containing member of this series is here reported for the first time. As an example, the X-ray powder patterns of RE(PdxGe1–x)2 phases (RE = Ce, Pr, Tb) are shown in Figure S1.
However, the Yb-containing samples, prepared both by metal flux and direct synthesis followed by sintering, showed the presence of the Yb2PdGe3 ternary phase (see Table 3) with an ordered superstructure (see Section 3.2 for crystal structure details).
Table 3. Results of SEM/EDXS/XRPD Characterization for Yb33.3Pd16.7Ge50.0 Samples Prepared by Metal Flux (#1) and Direct Synthesis in Resistance Furnace (#2).
| composition
by (EDXS) [atom %] |
lattice
parameters [Å] |
||||||||
|---|---|---|---|---|---|---|---|---|---|
| sample code synthesis | phases | Yb | Pd | Ge | In | Pearson symbol prototype | a | b | c |
| #1 | Yb2PdGe3 | 34.2(3) | 17.6(4) | 48.2(3) | hP12-Ce2CoSi3 | 8.474(2) | 4.073(2) | ||
| Yb2PdGe6 | 23.0(2) | 12.1(2) | 64.9(1) | oS72-Ce2(Ga0.1Ge0.7)9 | 8.150(2) | 7.990(1) | 21.847(5) | ||
| Pd3In7 | 31.4(3) | 68.6(3) | cI40-Ru3Sn7 | 9.4275(6) | |||||
| Ge | 100.0 | cF8-C | 5.654 | ||||||
| #2 | Yb2PdGe3 | 34.6(6) | 16.9(7) | 48.5(7) | hP12-Ce2CoSi3 | 8.4629(4) | 4.0733(4) | ||
Indium flux turned out to be reactive: in sample #1, Pd3In7, Yb2PdGe6, recrystallized Ge and the new Yb2PdGe3 were detected both by SEM-EDXS (Figure 1a) and X-ray powder diffraction obtained after the flux separation (see Figure S2). The peaks associated to tetragonal In were not revealed in the X-ray powder pattern. Good-quality Yb2PdGe3 crystals, showing a plate-like morphology, were detected with SEM/EDXS (Figure 1b) with no traces of In impurities. From this sample, a single crystal was selected for X-ray analysis and structure solution.
Sample #2 was revealed to be Yb2PdGe3 single phase (see Figure 1c) with the same crystal structure as in the In-flux synthesized sample.
3.2. Crystal Structure of Yb2PdGe3 as the AlB2 Superstructure
A Yb–Pd–Ge ternary compound of composition ∼33.3 atom % Yb; ∼16.7 atom % Pd; and 50 atom % Ge was reported in the literature47 as AlB2-like (a = 4.2276(3) Å, c = 4.0686(6) Å), as the representatives with other rare-earth components.
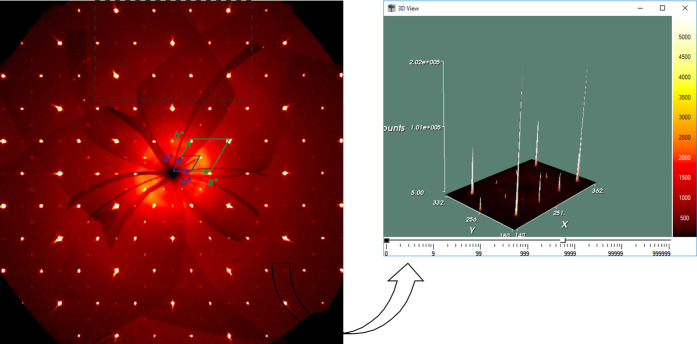
The analysis of the collected data highlights that the strongest diffraction peaks are compatible with the AlB2-type pattern; however, a regular distribution of weak superreflections cannot be neglected; including all of these in the indexation, a hexagonal unit cell with a ∼ 8.47 Å, c ∼ 4.07 Å is obtained, that is four times bigger than that of the AlB2 type.
In the reconstructed hk0 precession image, the reciprocal space relation between parent and derivative unit cells is evidenced (Figure 2, left); the intensity difference between the main and superreflections is well visible from the 3D plot (Figure 2, right).
Figure 2.
Intensity profiles for hk0 zone, with the unit cells of AlB2 parent type (green) and of the Yb2PdGe3 superstructure (blue). The presence of weak superreflections is well visible in the 3D view (on the right).
The analysis of the systematic absences suggests a primitive lattice centering and numerous possible space groups (P6/mmm, P622, P6mm, P-6, P6, etc.). Moreover, the |E2 – 1| criterion was ∼1.4, being noticeably far from the ideal value of 1 (centrosymmetric space group). These observations can be reasonably explained by the elevated number of weak superreflections in the data set. A chemically reasonable structure model was found in the P6/mmm space group. Further structure refinements were carried out by full-matrix least-squares methods on |F2| using the SHELXL program package.28 The site occupancy factors of all species were checked for deficiency, in separate cycles of refinement, obtaining values very close to unity. The final model was additionally checked with PLATON,48 indicating no missing symmetry elements. At this point, neither deficiency nor the statistical mixture were considered, and the stoichiometric Yb2PdGe3 (hP12-Ce2CoSi3) model was further anisotropically refined, giving acceptable residuals and a flat difference Fourier map. Selected crystallographic data are listed in Table 4.
Table 4. Atomic Coordinates and Equivalent Isotropic Displacement Parameters for the Investigated Yb2PdGe3 Single Crystal.
| atom | site | x/a | y/b | z/c | Ueq (Å2) |
|---|---|---|---|---|---|
| Yb1 | 3f | 1/2 | 0 | 0 | 0.0107(3) |
| Yb2 | 1a | 0 | 0 | 0 | 0.0090(3) |
| Pd | 2d | 1/3 | 2/3 | 1/2 | 0.0103(3) |
| Ge | 6m | 0.16616(2) | 0.33232(3) | 1/2 | 0.0108(3) |
The structural model was confirmed by X-ray powder diffraction analysis on the Yb2PdGe3 sample prepared by direct synthesis followed by sintering. Results of Rietveld refinement on this sample are visualized in Figure 3. Least-squares refinement cycles converged to RB = 0.0512, RF = 0.109, and χ2 = 3.93, confirming that the diffraction pattern calculated based on the established structural model of Yb2PdGe3 is in good agreement with the experimental data. The refined lattice parameters and atomic positions are in good agreement with single-crystal data.
Figure 3.
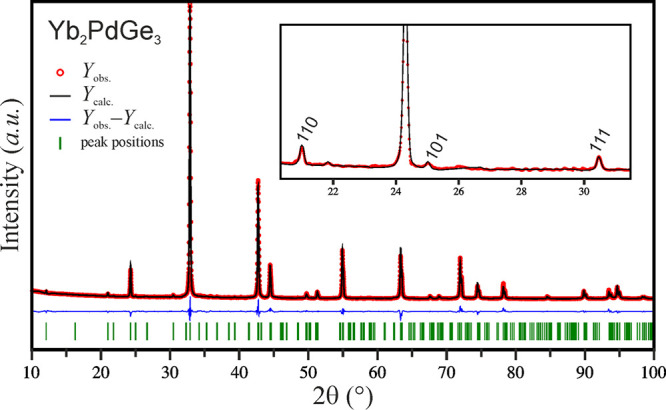
Observed (red circles), calculated (black line), and difference (bottom blue line) X-ray powder diffraction patterns for Yb2PdGe3. Indexed superreflections are visible in the inset.
The relationship between AlB2 (aristotype) and Yb2PdGe3 (four-order superstructure) is conveniently represented in terms of a group–subgroup relation already described in ref.11 Starting from AlB2, an isomorphic transition of index 4 (i4) yields to the Yb2PdGe3 structure, with doubled a and b axes (see Figure 4). As a consequence, Yb atoms occupy two different positions (1a and 3f), located in the correspondence to the centers of Ge6 and Ge4Pd2 hexagons, respectively, when viewed along the c direction. In each Ge4Pd2 hexagon, the Pd atoms are placed in para positions. Based on Ge–Ge (2.44 Å) and Ge–Pd (2.45 Å) interatomic distances, it is reasonable to interpret their planar layers as covalently bonded. Thus, the study of chemical bonding is of great interest in the framework of the chemistry of inorganic “graphene”.49,50
Figure 4.
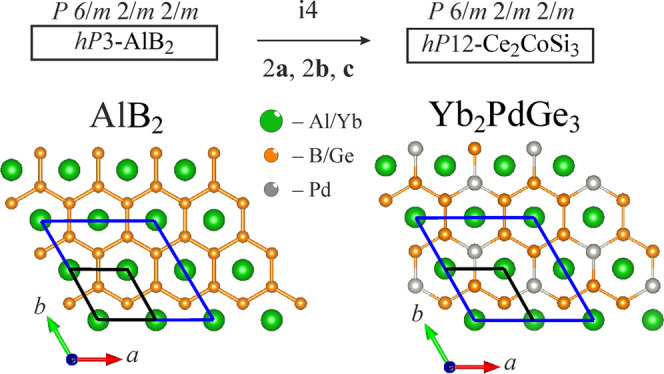
Bärnighausen symmetry reduction step relating the AlB2 aristotype and its Yb2PdGe3 derivative. The graphite-like layers composed of B6 (AlB2) and Ge6/Ge4Pd2 (Yb2PdGe3) are evidenced. The unit cells shown in black and blue highlight the metric relations between AlB2 and Yb2PdGe3, respectively.
The cell volumes of studied phases as a function of the RE3+ radius are plotted in Figure 5. A four times smaller cell volume (Vcell/4) was considered for the Yb2PdGe3 superstructure. The general trend is linear, being in line with the lanthanide contraction (the Y representative was not considered for linear regression). However, the datum for ytterbium is out of trend, suggesting a divalent or intermediated/mixed state for this species and motivating measurements of physical properties. Finally, it is worth noting that the lattice constants found for the RE(PdxGe1–x)2 phases are in good agreement with those already published.14
Figure 5.
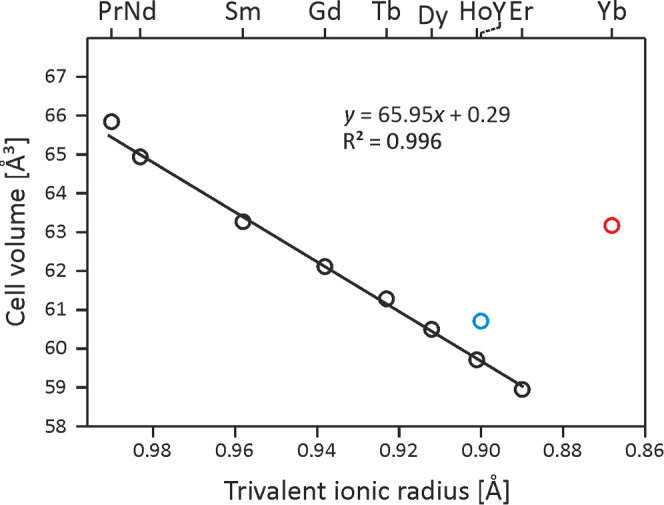
Cell volumes of RE(PdxGe1–x)2 and Yb2PdGe3 (red circle) compounds as a function of the RE3+ ionic radius. The blue circle indicates the datum for RE = Y.
3.3. Magnetic Properties of Yb2PdGe3
The temperature dependence of magnetic susceptibility for Yb2PdGe3 is depicted in Figure 6 for different low-DC fields. Both zero-field-cooled (ZFC) and field-cooled (FC) warming cycles were applied revealing a weak Pauli paramagnetism down to ∼50 K. The residual susceptibility obtained from a linear approximation corresponds to χ0 = 1.5 × 10⁻⁸ m3/mol. The upturn in χ(T) below 50 K is probably due to a minor paramagnetic impurity (i.e., invisible in the powder XRD and EDXS). Below 4.5 K, a strong diamagnetic signal appears due to a transition of Yb2PdGe3 into a superconducting state with a critical temperature, TC = 4 K. The appearance of a magnetic hysteresis (Figure 6 inset) confirms the studied germanide to be a superconductor of type II. The superconducting volume fraction is 94% at 2.5 mT and 7.6% at 5.0 mT (see Figure S3). The hysteresis closes at a second critical field Bc2 ≈ 80 mT at 1.8 K. Up to now, in the studied family of compounds, this behavior has only been reported for the Y representative, where a superconducting transition below 3 K was found.16,19 A more precise estimation of the superconducting parameters will become an object of further study.
Figure 6.
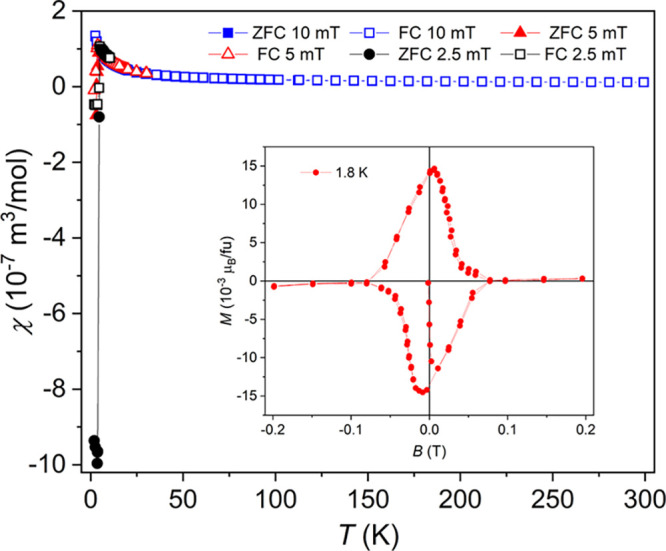
Temperature dependence of the magnetic susceptibility of Yb2PdGe3 as ZFC/FC cycles taken at 2.5, 5.0, and 10 mT. Inset corresponds to the field dependence of the magnetization below TC, at 1.8 K.
3.4. Electronic Structure and Chemical Bonding
Chemical bonding for intermetallic compounds containing p-block elements is generally assessed by applying the Zintl–Klemm approach together with a careful crystal-chemical analysis of the polyanionic fragments.
Interatomic Ge–Ge distances (dGe–Ge) equal to 2.44 Å leave no doubt about the covalent nature of such interactions. As a first approximation, if compared with dGe–Ge in cubic Ge (2.45 Å),14 they may be interpreted as single bonds, leading to the following ionic formula with two homopolar bonds per Ge atom: (Yb2+)2(Pd2+)[(2b)Ge2–]3. At the same time, the presence of planar, regular Ge6 hexagons with a 6/mmm (D6h) point symmetry hints toward a Hückel-like arene, formally bearing a −6 charge. In this case, the resulting ionic formula is (Yb2+)4(Pd–)2(Ge66–). A deeper analysis of interatomic distances for germanides evidences that, although both hypotheses are in line with the 8 – N rule, an intermediate bonding scenario might be expected. In fact, Ge–Ge single bonds in Zintl-like compounds are generally expected to be longer than 2.45 Å; this effect is often roughly explained, invoking the Coulombic repulsion among negatively charged Ge species.51 The double-bond length in molecular digermenes was reported to range from 2.20 to 2.50 Å52 depending on the substituents, being even longer in a few cases. A [Ge2]4– Zintl dumbbell, with dGe–Ge = 2.39 Å, was reported by Scherf et al.51 within the Li3NaGe2 phase and described as a solid-state equivalent of O2. It is worth mentioning another AlB2 derivative, Ba2LiGe3,53 that possesses Ge6 rings with dGe–Ge of 2.51 and 2.52 Å. This elongation with respect to the title compound probably stems from the enhanced charge transfer from the metal species, resulting in Ge610– anions, which were described as arene-like π-systems.53 At this point, a comparison with the simulated aromatic, Ge6H6, and Ge6 molecular species could give additional insights. In fact, the shortest dGe–Ge in Yb2PdGe3 is intermediate between 2.3 Å (Ge6H6) and 2.7 Å (Ge66–) (see Table S2 for further details), prompting an intermediate bonding scenario that may be ascribed to additional Ge–Pd/Yb interactions.
This concise survey on interatomic distances shows that a much more complicated bonding scenario than the Zintl one is realized, fostering deeper investigations based on DFT electronic structure calculations. For this purpose, total and species-projected densities of states (DOS and pDOS) were calculated (see Figure 7; the band structure together with the Brillouin zone is shown in Figure S4).
Figure 7.
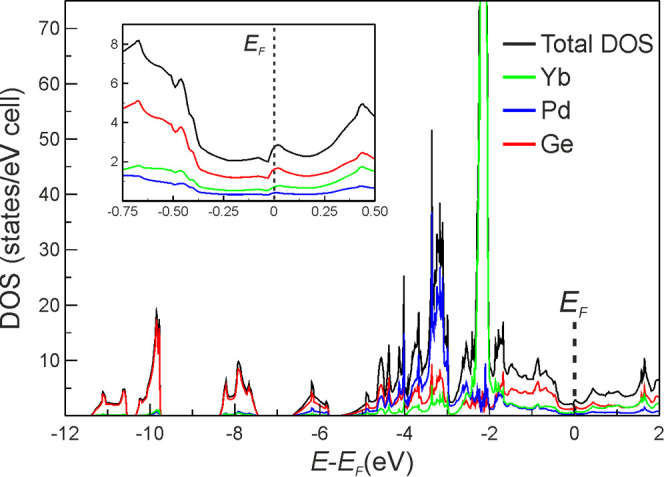
Calculated total and species-projected electronic density of states (DOS/pDOS) for Yb2PdGe3. The inset displays details around the Fermi level, which is indicated by a dotted line.
The presence of a pseudogap at the EF (see the inset in Figure 7) implies that Yb2PdGe3 has a metallic behavior. The DOS may be separated into two regions: one below −5.71 eV, which is mainly contributed by the Ge 4s states, and the other above, up to EF. The latter is built up by the Ge 4p states that energetically overlap with the Pd and Yb ones, suggesting the formation of polar Ge–Pd/Yb bonds. The active participation of the 4d states of Pd into chemical bonding is indicated by their width of about 1 eV. Moreover, the d state location far from the EF, between −5 and −4 eV, hints toward a Pd anionic behavior. The narrow peak at about −2.3 eV is due to the localized and fully occupied 4f states of both Yb1 and Yb2 species. If the Coulomb parameter U is not employed, the 4f states are practically located at EF and display a slight increase of the band width (see Figure S5 for the DOS and pDOS obtained from the LDA calculation). The goodness of the selected U parameter is also evident when the (p)DOS curves of Yb2PdGe3 are compared with those of Ca2PdGe3, calculated using, for consistency, the same computational setup (see Figure S5 to the right). Finally, it is worth noting that although the LSDA + U calculations were started with nonzero spin magnetic moments, the self-consistent solution was a nonmagnetic one. These findings support the nonmagnetic nature of the ground state and are consistent with the magnetization data reported in the previous paragraph, revealing a divalent state for Yb species.
To get more insights on chemical bonding, quantum-chemical techniques in position space were selected. The effective QTAIM charges are show in Figure 8. Yb species bear very similar positive charges, i.e., +1.1 for Yb1 and +1.0 for Yb2, and display quasi-spherical shapes, typical for rare-earth and alkaline-earth cations in similar compounds.54−56
Figure 8.
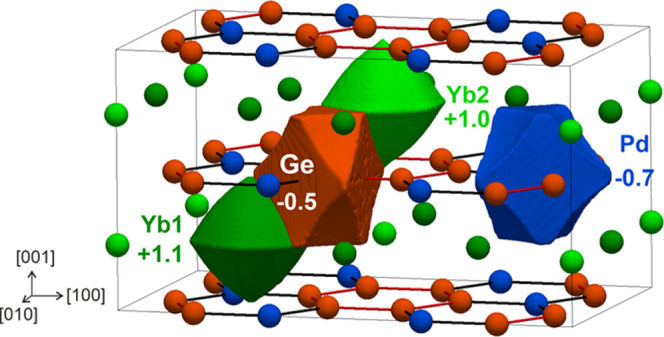
Shapes and effective charges of the QTAIM atomic basins for Yb2PdGe3. To enable a clearer view, an ortho-hexagonal cell was employed.
Their effective charges
are quite low if compared with the formal
values, suggesting an active participation in chemical bonding. Germanium
and palladium are both QTAIM anions and display very similar shapes
and charges. In fact, flat surfaces are found for Ge–Ge and
Ge–Pd contacts whereas rather convex surfaces point toward
the six-coordinating ytterbium atoms. Interestingly, these characteristic
features of covalently bonded p-block elements are
practically identical for both germanium and palladium. Such intriguing
anionic behavior of palladium and other transition metals (e.g., Ru,
Ir, Pt, Au, Ag) has been increasingly reported in the literature54,55,57−63 and considered responsible for unprecedented chemical properties.64,65 Hence, the QTAIM effective charges indicate that the crystal structure
of Yb2PdGe3 is composed of  honeycomb anionic layers
spaced by Yb cations.
To shed more light on the interactions among the constituents, a careful analysis of the topology of the Electron Localizability Indicator, in its ELI-D representation,66,67 was undertaken. Additionally, the crystal space is partitioned into valence and core basins by applying the Bader’s mathematical formalism to the ELI-D scalar field. The polarity of valence basins is evaluated through the intersection technique.68 The contribution, in terms of electronic population, of a QTAIM atom (X) intersecting an ELI-D basin (Bi) is quantified by the bond fraction p(BiX).69,70 The latter are further used to evaluate the covalent, cc(Bi), and lone pair, lpc(Bi), characters69,70 for each ELI-D valence basin. These tools permit to describe ELI-D basins as lone pairs, nonpolar, and heteropolar bonds, opening the door to a consistent and quantitative treatment of the latter.
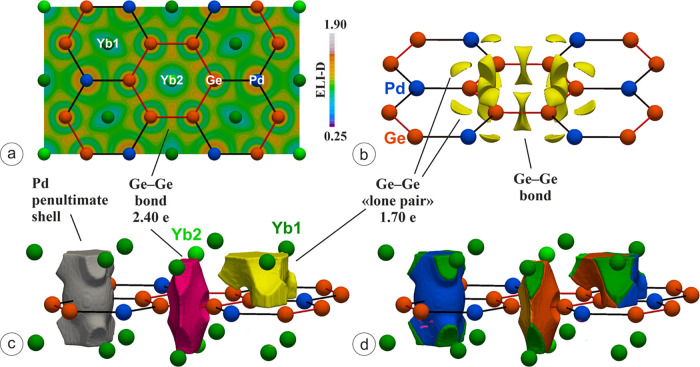
In the valence region, the ELI-D attractors are located around the germanium atoms, as shown in Figure 9a,b by means of its planar distribution and isosurfaces, respectively.
Figure 9.
(a) ELI-D distribution within the (001) plane and (b) isosurfaces enclosing 1.176-localization domains; (c) shape of the ELI-D basins; (d) intersection of the ELI-D basins by QTAIM atoms; the coloring scheme for the intersected regions follows that chosen for the atoms and QTAIM basins. Average electronic populations of selected ELI-D basins are also indicated.
The presence of covalent Ge–Ge bonding is confirmed by the ELI-D maxima distribution. A tiny splitting of the attractors is observed for this interaction that does not substantially affect the overall bonding interpretation (more details on this are discussed in Figure S6). Two maxima per germanium atom point toward the neighboring metals and may be interpreted at a first approximation as lone pairs (Figure 9b). No attractors are found along Pd–Ge, so that a graphite-like bonding scenario is unlikely.
The described ELI-D topology composed of two lone pairs and two bonds per germanium is quite characteristic for two-bonded (2b) species and has been recently reported for both binary and ternary germanides within Ge zigzag chains (e.g., RE2MGe6, CaGe,58 and LuGe71). Nonetheless, interesting differences may be detected when focusing on the average electronic populations. The bonding basins display a larger population than the lone pair ones, i.e., 2.40 vs 1.70 (see Figure 9c). This is in contrast with the expected overpopulation of lone pairs, along with a consequent bonds underpopulation, with respect to the ideal 2.00 electrons (e–).58,71,72 A comparative analysis with related intermetallic germanides is helpful; RE2MGe6 (M = another metal) compounds are particularly suitable for this purpose due to similar Ge coordination environments (see Figure S7). In Y2PdGe6,58 the population of 1.68 e–, found in the bonding basin associated to Ge–Ge contacts at 2.45 Å, is significantly lower than the 2.40 e– for the same basin in the title phase. In the analogous germanides, these populations were found to decrease together with increasing dGe–Ge, reaching the value of 1.12 e– for CaGe with a distance of 2.59 Å. Despite the structural similarities, Yb2PdGe3 is not following this trend and its enhanced bonding basin population can be considered an indication of a Ge–Ge bond order larger than one.
The bonding basin is intersected by two germanium and four ytterbium QTAIM atoms (see Figure 9d, orange and green portions). The contribution of the Yb species is negligible (0.12 e– in total) so that it is an effectively two-atomic (2a) interaction. In accordance with its nonpolar nature, the cc(Bi) is equal to 1. The valence basins indicated up to this point as “lone pairs” are intersected by 1Ge, 1Pd, 2Yb1, and 1Yb2. The main contribution comes from Ge, followed by Pd, leading to bond fraction values of 0.73 and 0.20, respectively, hinting toward a polar covalent bond rather than a lone pair. Whereas the Yb2 contribution should be neglected (0.012 e–), a different scenario is realized by the two Yb1 species. In fact, they yield a total bond fraction of 0.06 (0.03 per Yb2 atom), allowing to describe this basin as four-atomic (4a). Analogous bond fractions were recently reported for CaGe58 (0.08 per 4Ca atoms), where each Ge “lone pair” was definitely interpreted as a 5a-Ge1Ca4 basin after the application of the Penultimate Shell Correction method (PSC0), leading to a bond fraction of 0.15. Such approach was introduced to account for the rare-earth underestimated contributions due to a considerable charge storage in the penultimate shell. The same effect, although less severe, was reported for Ca, which displayed a core overpopulation of about 0.3 e–; for the actual calculations, a storage of 0.4 e– was obtained for Yb. The PSC0 approach is still not applicable to compounds containing transition metals with an ambiguous oxidation state, such as Pd. The cc(Bi) and lpc(Bi) for such 4a-Ge1Pd1Yb12 heteropolar bond are almost equal, being 0.53 and 0.47, respectively, supporting its covalent nature.
The shape of the Pd penultimate shell basin deserves further comments. It has six bulges that extend in the valence region (see Figure 9c) toward the six adjacent Yb1 species. In fact, each bulge is intersected by the corresponding Yb1 QTAIM atom (see dark green regions in Figure 9d). This kind of feature was observed for ternary intermetallics both with germanium, such as La2MGe6 (M = Pd, Ag)58 and without germanium, such as LaAuMg2,55 and described as 2a polar covalent metal–metal bonds, as also confirmed by the ELI-D relative Laplacian. Considering this, each Pd is covalently bonded with the six neighboring Yb1 species, located on the vertices of the trigonal coordination prism. The realization of RE–Pd covalent interactions was also reported for some related ternary germanides on the basis of different quantum-chemical approaches.54,73
3.5. Additional Details on Chemical Bonding: From Molecules to Solid State
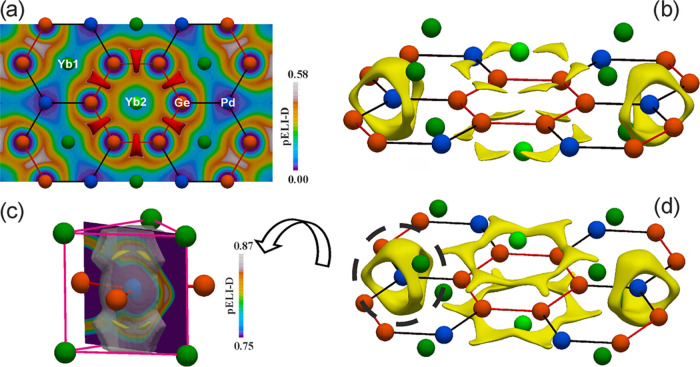
Further interesting details may be obtained analyzing the partial ELI-D (pELI, see Figure 10)44,67 that is calculated from the EDs obtained from separated states located in two DOS energy ranges (see Figure S8), indicated in the following with letters A (−12.0 eV < E < −5.71 eV) and B (−5.71 eV < E < 0.00 eV).
Figure 10.
Partial ELI-D (pELI) contributions for A (−12.0 to −5.71 eV) and B (−5.71 to EF) DOS regions: (a) slice with pELI distribution derived from region A in the honeycomb layer together with red isosurfaces enclosing 0.46-localization domains; (b–d) yellow pELI isosurfaces derived from region B enclosing 0.833- (b), 0.867- (c), and 0.823-localization domains (d). The penultimate shell ELI-D basin of Pd is shown as well (c).
Region A was selected since it is mainly dominated by the Ge 4s states and follows the same energy sequence found in the orbital schemes of Ge6H6 and Ge66– (red orbitals in Figure 11).
Figure 11.
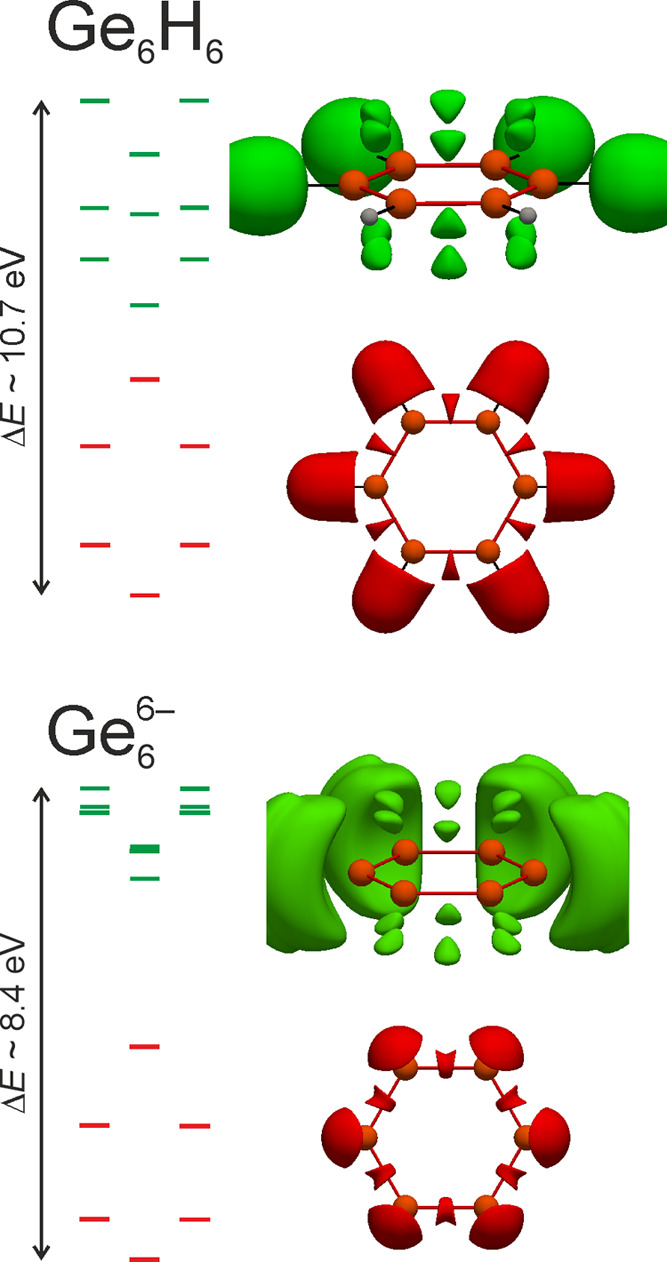
Molecular orbital energy diagrams of Ge6H6 (top) and Ge66– (bottom), together with pELI contributions. In the two figures representing pELI contributions derived from the highest energy orbitals (green), two domains in the exocyclic regions have been deleted to enable a better view for the reader.
In fact, states in A are separated into four bands populated by 2, 4, 4, and 2 e– per Ge6 ring of Yb2PdGe3. Thus, a comparative bonding analysis among the title crystalline solid and the molecules is enabled by the pELI function, which allows to recover orbital contributions in position space. Such comparison is even more interesting, keeping in mind that the two molecules both show one a2u and two e1g molecular orbitals with a shape characteristic for aromatic six-membered rings (see Figure S9). At this point, it is worth mentioning that based on computed magnetic criteria, it has been proven that Ge6H6, as its Si6H6 analogue, is less aromatic than benzene so that a nonplanar 3̅m (D3d) cyclic molecule is expected to be energetically favored.74 When the molecular structure optimization was performed starting from a planar 6/mmm molecule, it converges to a local energy minimum retaining the desired symmetry. On the contrary, if one Ge atom is located out of the plane, the final structure is the favored one being more stable by −0.563 eV (PW), −0.768 eV (PBE), and −0.784 eV (B3LYP) than 6/mmm, in accordance with the literature.74 Aiming at performing a consistent analysis, all-electron wave functions obtained from LDA/PW calculations were used for the comparative study. However, no relevant differences were detected among ELI and pELI calculated on the basis of the wave functions obtained employing the PBE or B3LYP functional.
Coming back to Yb2PdGe3, the states in the A energy interval of the DOS display pELI contribution only around the Ge6 ring on its very same plane (see pELI planar distribution in Figure 10a), with maxima located between the Ge–Ge contacts (red isosurfaces in Figure 10a). The pELI distribution resulting from the six energetically lower valence orbitals of Ge6H6 and Ge66– is analogue (red isosurfaces in Figure 11).
It is not straightforward to extend this analysis to the remaining energy range. In fact, the B region of the DOS is not separated into bands so that it is not trivial to compare it with the discrete orbitals of the reference molecules. Hence, clear differences are expected to occur between the pELI contributions coming from the B interval of the DOS and the remaining nine valence MOs of the molecules, indicated by green bars in Figure 11. They are formed by a linear combination of Ge 4p and H 1s for Ge6H6 and just by the Ge 4p for Ge66–. The resulting pELI (see green isosurfaces in Figure 11) distributions are practically identical and show two kinds of attractors: the first are symmetrically located above and below the mid-point of the Ge–Ge bond, representing the π-interactions; the second are in the exocyclic region signifying Ge–H bonds in the case of Ge6H6 and Ge lone pairs for Ge6. As expected, a somewhat different picture is obtained for Yb2PdGe3. The pELI attractors are still symmetrically positioned above and below the Ge6 planes but find their location in correspondence of the Ge atoms and not among them (see yellow isosurfaces in Figure 10b). Thus, they seem to indicate the polar interactions between Ge and the surrounding metals. Nevertheless, the visualization of pELI isosurfaces at lower values reveals two reducible localization domains spreading over the whole Ge6 fragments above and below their plane, pointing out rather high pELI contributions also in these regions. Such feature supports the idea of some π-interactions among the Ge atoms, even if reduced with respect to the selected molecular references. Consequently, the bonding scenario appears to be intermediate between that of a typical 2c–2e Ge–Ge bond and an aromatic picture, well in line with the conclusions drawn from the interatomic distances and the ELI-D basin population analysis.
Finally, the pELI distribution from the DOS region B gives some insights into the Pd–Yb bonds as well. Six pELI maxima around each palladium point toward the neighboring Yb, as displayed by the 0.867-irreducible localization domains shown in Figure 10c. When such attractors are visualized superimposed with the Pd penultimate shell basins (gray transparent basin in Figure 10c), they are located in the spatial region corresponding to the bulges. This finding is not just supporting the formation of Pd–Yb bonds but constitutes one more evidence of the correct afore-given interpretation of the bulges of ELI-D penultimate shell basins.
4. Conclusions
Ternary rare-earth germanides
of nominal composition RE33.3Pd16.7Ge50.0 were reinvestigated
along the RE series (RE = Y, La–Nd,
Sm, Gd–Er, Yb) aiming at checking for the existence of ordered
structures. The existence of the RE(PdxGe1–x)2 disordered phases, crystallizing with the hP3-AlB2 structure, has been confirmed with all RE, but Yb. X-ray diffraction analyses both on powders and single crystals,
indicate that the Yb2PdGe3 compound is a four-order
superstructure of AlB2, crystallizing with the hP12-Ce2CoSi3 type of structure. Based
on refined structural data and the calculated QTAIM effective charges,
the crystal structure may be described as composed of two-dimensional  honeycomb anionic layers
spaced by Yb cations.
Both DFT/LSDA + U calculations and measured magnetic
susceptibility as a function of temperature hint toward a divalent
state of Yb. Moreover, Yb2PdGe3 displays a type-II
superconducting behavior below the critical temperature of 4 K, a
feature shared only with the disordered Y(PdxGe1–x)2 phase.
Position-space chemical bonding analysis indicates, in addition to
homopolar Ge–Ge bonds, polar four-atomic Ge1Pd1Yb2 and two-atomic Pd–Yb bonds. Further
insights, with main regards to the nature of Ge–Ge interactions
within regular Ge6 hexagons, were obtained by analyzing
the partial ELI-D field that enabled a comparison between the crystalline
Yb2PdGe3 and the hypothetic Ge6H6 and Ge66– molecules. Finally, a bond order larger than one is proposed for
Ge–Ge bonds, suggesting a bonding scenario intermediate between
that of a typical 2c–2e Ge–Ge bond and an aromatic behavior.
Such results extend the chemistry of inorganic germanium and enrich
with one more representative the bonding outcomes for ternary RE–Pd–Ge, which shows similar features like
multiatomic interactions involving all species and RE–Pd bonds, here presented for the first time with RE = Yb. The search for appropriate doping, able to increase
the measured critical temperature, and for new RE2TGe3 representative, displaying
intriguing physical and chemical properties, is ongoing.
Acknowledgments
The authors thank D. M. Proserpio (Università degli Studi di Milano, Italy) for providing access to the single-crystal diffractometer. L.C.J.P. thanks the Portuguese National Funding Agency for Science, and Technology, FCT, under Projects UID/Multi/04349/2020 and LISBOA-01-0145-FEDER-022096.
Supporting Information Available
The Supporting Information is available free of charge at https://pubs.acs.org/doi/10.1021/acs.inorgchem.2c03303.
Results of EDXS and XRPD analysis for RE–Pd–Ge samples, X-ray powder patterns for some representative samples, optimized structural data for the simulated Ge6H6 and Ge66– molecules, superconducting volume fraction, band structure and Brillouin zone for Yb2PdGe3, DOS and pDOS for Yb2PdGe3 and Ca2PdGe3 based on both DFT and DFT + U calculations, ELI-D attractors splitting along the Ge–Ge contacts, structural similarities among Yb2PdGe3 and Yb2PdGe6, DOS energy windows selected to calculate the pELI-D of Yb2PdGe3, and π molecular orbitals of the simulated Ge6H6 and Ge6 molecules (PDF)
The authors declare no competing financial interest.
Supplementary Material
References
- Lin Q.; Miller G. J. Electron-Poor Polar Intermetallics: Complex Structures, Novel Clusters, and Intriguing Bonding with Pronounced Electron Delocalization. Acc. Chem. Res. 2018, 51, 49–58. 10.1021/acs.accounts.7B00488. [DOI] [PubMed] [Google Scholar]
- Gumeniuk R.; Schöneich M.; Kvashnina K. O.; Akselrud L.; Tsirlin A. A.; Nicklas M.; Schnelle W.; Janson O.; Zheng Q.; Curfs C.; Burkhardt U.; Schwarz U.; Leithe-Jasper A. Intermetallic Germanides with Non-Centrosymmetric Structures Derived from the Yb3Rh4Sn13 Type. Dalton Trans. 2015, 44, 5638–5651. 10.1039/C4DT03155E. [DOI] [PubMed] [Google Scholar]
- Giovannini M.; Curlík I.; Freccero R.; Solokha P.; Reiffers M.; Sereni J. Crystal Structure and Magnetism of Noncentrosymmetric Eu2Pd2Sn. Inorg. Chem 2021, 60, 8085–8092. 10.1021/acs.inorgchem.1c00678. [DOI] [PMC free article] [PubMed] [Google Scholar]
- Chen J.; Gamza M. B.; Banda J.; Murphy K.; Tarrant J.; Brando M.; Grosche F. M. Unconventional Bulk Superconductivity in YFe2Ge2 Single Crystals. Phys. Rev. Lett. 2020, 125, 237002 10.1103/PHYSREVLETT.125.237002. [DOI] [PubMed] [Google Scholar]
- Roychowdhury S.; Ochs A. M.; Guin S. N.; Samanta K.; Noky J.; Shekhar C.; Vergniory M. G.; Goldberger J. E.; Felser C. Large Room Temperature Anomalous Transverse Thermoelectric Effect in Kagome Antiferromagnet YMn6Sn6. Adv. Mater. 2022, 34, 2201350 10.1002/ADMA.202201350. [DOI] [PubMed] [Google Scholar]
- Lin Q.; Aguirre K.; Saunders S. M.; Hackett T. A.; Liu Y.; Taufour V.; Paudyal D.; Budko S.; Canfield P. C.; Miller G. J. Polar Intermetallics Pr5Co2Ge3 and Pr7Co2Ge4 with Planar Hydrocarbon-Like Metal Clusters. Chem. – Eur. J. 2017, 23, 10516–10521. 10.1002/CHEM.201702798. [DOI] [PubMed] [Google Scholar]
- Freccero R.Study of New Ternary Rare-Earth Intermetallic Germanides with Polar Covalent Bonding; Springer International Publishing: Cham, 2020. [Google Scholar]
- Oliynyk A. O.; Stoyko S. S.; Mar A. Ternary Rare-Earth Ruthenium and Iridium Germanides RE3M2Ge3 (RE = Y, Gd–Tm, Lu; M = Ru, Ir). J. Solid State Chem. 2013, 202, 241–249. 10.1016/J.JSSC.2013.03.050. [DOI] [Google Scholar]
- Solokha P.; De Negri S.; Proserpio D. M.; Blatov V. A.; Saccone A. Vacancy Ordering as a Driving Factor for Structural Change in Ternary Germanides: The R2Zn1-xGe6 Series of Polar Intermetallics (R = Rare-Earth Metal). Inorg. Chem. 2015, 54, 2411–2424. 10.1021/IC5030313. [DOI] [PubMed] [Google Scholar]
- Penc B.; Baran S.; Hoser A.; Szytuła A. Magnetic Properties and Magnetic Structures of R2TGe6 (T = Ni, Cu; R = Tb, Ho and Er). J. Alloys Compd. 2019, 803, 307–313. 10.1016/J.JALLCOM.2019.06.027. [DOI] [Google Scholar]
- Hoffmann R. D.; Pöttgen R. AlB2-Related Intermetallic Compounds - A Comprehensive View Based on Group-Subgroup Relations. Z. Kristallogr. – Cryst. Mater. 2001, 216, 127–145. 10.1524/ZKRI.216.3.127.20327. [DOI] [Google Scholar]
- Nagamatsu J.; Nakagawa N.; Muranaka T.; Zenitani Y.; Akimitsu J. Superconductivity at 39 K in Magnesium Diboride. Nature 2001, 410, 63–64. 10.1038/35065039. [DOI] [PubMed] [Google Scholar]
- Pan Z.-Y.; Cao C.-D.; Bai X.-J.; Song R.-B.; Zheng J.-B.; Duan L.-B. Structures and Physical Properties of R2TX3 Compounds. Chin. Phys. B 2013, 22, 056102 10.1088/1674-1056/22/5/056102. [DOI] [Google Scholar]
- Villars P.; Cenzual K.. Pearson’s Crystal Data: Crystal Structure Database for Inorganic Compounds; ASM International: Materials Park, OH, 2022. [Google Scholar]
- Rossi D.; Ferro R. Ternary Rare Earth (R) Alloys Occurring in Some ∼RPd2–xGex Sections. Intermetallics 2002, 10, 399–402. 10.1016/S0966-9795(02)00002-X. [DOI] [Google Scholar]
- Majumdar S.; Sampathkumaran E. V. Observation of Enhanced Magnetic Transition Temperature in Nd2PdGe3 and Superconductivity in Y2PdGe3. Phys. Rev. B 2001, 63, 172407 10.1103/PhysRevB.63.172407. [DOI] [Google Scholar]
- Szytuła A.; Hofmann M.; Penc B.; Ślaski M.; Majumdar S.; Sampathkumaran E. V.; Zygmunt A. Magnetic Behaviour of R2PdSi3 Compounds with R=Ce, Nd, Tb–Er. J. Magn. Magn. Mater. 1999, 202, 365–375. 10.1016/S0304-8853(99)00410-2. [DOI] [Google Scholar]
- Jones C. D. W.; Gordon R. A.; DiSalvo F. J.; Pöttgen R.; Kremer R. K. Magnetic Behaviour of Two AlB2-Related Germanides: CePd0.63Ge1.37 and CeAu0.75Ge1.25. J. Alloys Compd. 1997, 260, 50–55. 10.1016/S0925-8388(97)00159-X. [DOI] [Google Scholar]
- Sampathkumaran E. V.; Majumdar S.; Schneider W.; Molodtsov S. L.; Laubschat C. Superconductivity in Y2PdGe3. Phys. B: Condens. Matter 2002, 312–313, 152–154. 10.1016/S0921-4526(01)01559-9. [DOI] [Google Scholar]
- Nesper R.; Curda J.; Von Schnering H. G. Li8MgSi6, a Novel Zintl Compound Containing Quasi-Aromatic Si5 Rings. J. Solid State Chem. 1986, 62, 199–206. 10.1016/0022-4596(86)90232-X. [DOI] [Google Scholar]
- Nesper R.; Antonio C.; Wengert S. Nonaromatic Planar Si12 Ring System of Approximate D6h Symmetry in Ca7Mg7.5±δSi14. Chem. – Eur. J. 1998, 4, 2251.. [DOI] [Google Scholar]
- Lupu C.; Downie C.; Guloy A. M.; Albright T. A.; Mao J. G. Li17Ag3Sn6: A Polar Intermetallic π-System with Carbonate-like [AgSn3]11– Anions and Trefoil Aromatic [Ag2Sn3]6– Layers. J. Am. Chem. Soc. 2004, 126, 4386–4397. 10.1021/ja038868n. [DOI] [PubMed] [Google Scholar]
- APEX4 V2021.10-0; Bruker AXS Inc.: Madison, WI, 2021.
- SAINT v8.30A; Bruker AXS Inc.: Madison, WI, 2012.
- XPREP V2014/2; Bruker AXS Inc.: Madison, WI, 2014.
- SADABS V2016/2; Bruker AXS Inc.: Madison, WI, 2016.
- Petrícek V.; Dušek M.; Palatinus L. Crystallographic Computing System JANA2006: General Features. Z. Kristallogr. 2014, 229, 345–352. 10.1515/ZKRI-2014-1737. [DOI] [Google Scholar]
- Sheldrick G. M.SHELXL-2019/1; Bruker AXS Inc.: Madison, WI, 2019.
- Rodriguez-Carvajal J. FullProf. IUCr Newsl. 2001, 26, 12–19. [Google Scholar]
- Eschrig H.; Koepernik K.; Chaplygin I. Density Functional Application to Strongly Correlated Electron Systems. J. Solid State Chem. 2003, 176, 482–495. 10.1016/S0022-4596(03)00274-3. [DOI] [Google Scholar]
- Koepernik K.; Eschrig H. Full-Potential Nonorthogonal Local-Orbital Minimum-Basis Band-Structure Scheme. Phys. Rev. B 1999, 59, 1743–1757. 10.1103/PhysRevB.59.1743. [DOI] [Google Scholar]
- Perdew J. P.; Wang Y. Accurate and Simple Analytic Representation of the Electron-Gas Correlation Energy. Phys. Rev. B 1992, 45, 13244–13249. 10.1103/PhysRevB.45.13244. [DOI] [PubMed] [Google Scholar]
- Juckel M.; Koželj P.; Prots Y.; Ormeci A.; Burkhardt U.; Leithe-Jasper A.; Svanidze E. Intermediate Valence Behavior of Yb2Cu9Al8. Z. Anorg. Allg. Chem. 2020, 646, 1238–1243. 10.1002/ZAAC.202000118. [DOI] [Google Scholar]
- Grin Y.; Pöttgen R.; Ormeci A.; Kremer R. K.; Wagner F. E. Intermediate-Valence Intermetallic Phase YbIn1-xAu1+x(x = 0-0.3). Cryst. Technol. 2017, 52, 1700101 10.1002/crat.201700101. [DOI] [Google Scholar]
- Kohout M. A Measure of Electron Localizability. Int. J. Quantum Chem. 2004, 97, 651–658. 10.1002/qua.10768. [DOI] [Google Scholar]
- Wagner F. R.; Bezugly V.; Kohout M.; Grin Y. Charge Decomposition Analysis of the Electron Localizability Indicator: A Bridge between the Orbital and Direct Space Representation of the Chemical Bond. Chem. – Eur. J. 2007, 13, 5724–5741. 10.1002/chem.200700013. [DOI] [PubMed] [Google Scholar]
- Wagner F. R.; Kohout M.; Grin Y. Direct Space Decomposition of ELI-D: Interplay of Charge Density and Pair-Volume Function for Different Bonding Situations. J. Phys. Chem. A 2008, 112, 9814–9828. 10.1021/jp8022315. [DOI] [PubMed] [Google Scholar]
- Kohout M.DGrid-4.6, 2014.
- Kohout M.DGrid-5.0, 2018.
- Ormeci A.; Rosner H.; Wagner F. R.; Kohout M.; Grin Y. Electron Localization Function in Full-Potential Representation for Crystalline Materials. J. Phys. Chem. A 2006, 110, 1100–1105. 10.1021/jp054727r. [DOI] [PubMed] [Google Scholar]
- Bader R. F. W.Atoms in Molecules – A Quantum Theory; Oxford University Press: New York, 1990. [Google Scholar]
- Perdew J. P.; Burke K.; Ernzerhof M. Generalized Gradient Approximation Made Simple. Phys. Rev. Lett. 1996, 77, 3865–3868. 10.1103/PhysRevLett.77.3865. [DOI] [PubMed] [Google Scholar]
- Vosko S. H.; Wilk L.; Nusair M. Accurate Spin-Dependent Electron Liquid Correlation Energies for Local Spin Density Calculations: A Critical Analysis. Can. J. Phys. 1980, 58, 1200–1211. 10.1139/p80-159. [DOI] [Google Scholar]
- Börrnert C.; Grin Y.; Wagner F. R. Position-Space Bonding Indicators for Hexaborides of Alkali, Alkaline-Earth, and Rare-Earth Metals in Comparison to the Molecular Crystal K2[B6H6]. Z. Anorg. Allg. Chem. 2013, 639, 2013–2024. 10.1002/ZAAC.201200514. [DOI] [Google Scholar]
- Baranov A.Visualization Plugin for ParaView, 2015.
- Ayachit U.The ParaView Guide: A Parallel Visualization Application Kitware; 2015.
- Seropegin Y. D.; Borisenko O. L.; Bodak O. I.; Nikiforov V. N.; Kovachikova M. V.; Kochetkov Y. V. Investigation of Phase Relationships and Physical Properties of Yb□Pd□Ge Compounds. J. Alloys Compd. 1995, 216, 259–263. 10.1016/0925-8388(94)01266-K. [DOI] [Google Scholar]
- Spek A. L. Structure Validation in Chemical Crystallography. Acta Crystallogr., Sect. D 2009, 65, 148–155. 10.1107/S090744490804362X. [DOI] [PMC free article] [PubMed] [Google Scholar]
- Miller G. J.; Schmidt M. W.; Wang F.; You T. S. Quantitative Advances in the Zintl–Klemm Formalism. Struct. Bond. 2011, 139, 1–55. 10.1007/430_2010_24. [DOI] [Google Scholar]
- You T. S.; Miller G. J. Theoretical Interpretation of the Structural Variations along the Eu(Zn1- XGex)2 (0 <x <1) Series. Inorg. Chem. 2009, 48, 6391–6401. 10.1021/ic900629t. [DOI] [PubMed] [Google Scholar]
- Scherf L. M.; Karttunen A. J.; Pecher O.; Magusin P. C. M. M.; Grey C. P.; Fässler T. F. [Ge2]4– Dumbbells with Very Short Ge–Ge Distances in the Zintl Phase Li3NaGe2: A Solid-State Equivalent to Molecular O2. Angew. Chem., Int. Ed. 2016, 55, 1075–1079. 10.1002/ANIE.201508044. [DOI] [PubMed] [Google Scholar]
- Lee V. Y. Digermenes >Ge=Ge<, Distannenes >Sn=Sn<and Diplumbenes >Pb=Pb<. Chem 2012, 2, 35–46. 10.5618/chem.2012.v2.n1.5. [DOI] [Google Scholar]
- von Schnering H. G.; von Bolle U.; Curda J.; Peters K.; Carrillo-Cabrera W.; Somer M.; Schultheiss M.; Wedig U. Hückel-Arene Mit Zehn π-Elektronen: Die Cyclischen Zintl-Anionen Si610– Und Ge610–, Isoster Mit P64– Und As64–. Angew. Chem. 1996, 108, 1062–1064. 10.1002/ANGE.19961080911. [DOI] [Google Scholar]
- Freccero R.; De Negri S.; Rogl G.; Binder G.; Michor H.; Rogl P. F.; Saccone A.; Solokha P. La2Pd3Ge5 and Nd2Pd3Ge5 Compounds: Chemical Bonding and Physical Properties. Inorg. Chem. 2021, 60, 3345–3354. 10.1021/acs.inorgchem.0c03744. [DOI] [PMC free article] [PubMed] [Google Scholar]
- Freccero R.; De Negri S.; Saccone A.; Solokha P. Solid State Interactions in the La-Au-Mg System: Phase Equilibria, Novel Compounds and Chemical Bonding. Dalton Trans. 2020, 49, 12056–12067. 10.1039/d0dt02359k. [DOI] [PubMed] [Google Scholar]
- Schwarz U.; Castillo R.; Hübner J. M.; Wosylus A.; Prots Y.; Bobnar M.; Grin Y. The Untypical High-Pressure Zintl Phase SrGe6. Z. Naturforsch. B 2020, 75, 209–216. 10.1515/ZNB-2019-0197. [DOI] [Google Scholar]
- Grin Y.; Armbrüster M.; Baranov A. I.; Finzel K.; Kohout M.; Ormeci A.; Rosner H.; Wagner F. R. Atomic Interactions in the Intermetallic Catalyst GaPd. Mol. Phys. 2016, 114, 1250–1259. 10.1080/00268976.2015.1093664. [DOI] [Google Scholar]
- Freccero R.; Solokha P.; De Negri S.; Saccone A.; Grin Y.; Wagner F. R. Polar-Covalent Bonding Beyond the Zintl Picture in Intermetallic Rare-Earth Germanides. Chem. – Eur. J. 2019, 25, 6600–6612. 10.1002/chem.201900510. [DOI] [PubMed] [Google Scholar]
- Freccero R.; Solokha P.; De Negri S. Unpredicted but It Exists: Trigonal Sc2Ru with a Significant Metal-Metal Charge Transfer. Inorg. Chem. 2021, 60, 10084–10088. 10.1021/ACS.INORGCHEM.1C01168. [DOI] [PMC free article] [PubMed] [Google Scholar]
- Agnarelli L.; Prots Y.; Schmidt M.; Krnel M.; Svanidze E.; Burkhardt U.; Leithe-Jasper A.; Grin Y. Be3Ru: Polar Multiatomic Bonding in the Closest Packing of Atoms. ChemistryOpen 2022, 11, 2200118 10.1002/OPEN.202200118. [DOI] [PMC free article] [PubMed] [Google Scholar]
- Amon A.; Svanidze E.; Ormeci A.; König M.; Kasinathan D.; Takegami D.; Prots Y.; Liao Y.; Tsuei K.; Tjeng L. H.; Leithe-Jasper A.; Grin Yu. Interplay of Atomic Interactions in the Intermetallic Semiconductor Be5Pt. Angew. Chem., Int. Ed. 2019, 58, 15928–15933. 10.1002/anie.201909782. [DOI] [PMC free article] [PubMed] [Google Scholar]
- Sichevych O.; Prots Y.; Schnelle W.; Wagner F. R.; Grin Y. Polycation-Polyanion Architecture of the Intermetallic Compound Mg3-xGa1+xIr. Molecules 2022, 27, 659. 10.3390/MOLECULES27030659. [DOI] [PMC free article] [PubMed] [Google Scholar]
- Solokha P.; Eremin R. A.; Leisegang T.; Proserpio D. M.; Akhmetshina T.; Gurskaya A.; Saccone A.; De Negri S. New Quasicrystal Approximant in the Sc–Pd System: From Topological Data Mining to the Bench. Chem. Mater. 2020, 32, 1064–1079. 10.1021/acs.chemmater.9b03767. [DOI] [Google Scholar]
- Jiménez A. M. B.; Ormeci A.; Burkhardt U.; Altendorf S. G.; Kaiser F.; Veremchuk I.; Auffermann G.; Grin Y.; Antonyshyn I. Intermetallic Compounds M2Pt (M = Al, Ga, In, Sn) in the Oxygen Evolution Reaction. Sustainable Energy Fuels 2021, 5, 5762–5772. 10.1039/D1SE01190A. [DOI] [Google Scholar]
- Antonyshyn I.; Sichevych O.; Rasim K.; Ormeci A.; Burkhardt U.; Titlbach S.; Schunk S. A.; Armbrüster M.; Grin Y. Anisotropic Reactivity of CaAg under Ethylene Epoxidation Conditions. Inorg. Chem. 2018, 57, 10821–10831. 10.1021/acs.inorgchem.8b01449. [DOI] [PubMed] [Google Scholar]
- Kohout M. A Measure of Electron Localizability. Int. J. Quantum Chem. 2004, 97, 651–658. 10.1002/QUA.10768. [DOI] [Google Scholar]
- Wagner F. R.; Bezugly V.; Kohout M.; Grin Y. Charge Decomposition Analysis of the Electron Localizability Indicator: A Bridge between the Orbital and Direct Space Representation of the Chemical Bond. Chem. – Eur. J. 2007, 13, 5724–5741. 10.1002/CHEM.200700013. [DOI] [PubMed] [Google Scholar]
- Raub S.; Jansen G. A Quantitative Measure of Bond Polarity from the Electron Localization Function and the Theory of Atoms in Molecules. Theor. Chem. Acc. 2001, 106, 223–232. 10.1007/S002140100268. [DOI] [Google Scholar]
- Bende D.; Wagner F. R.; Grin Y. 8 - N Rule and Chemical Bonding in Main-Group Mgagas-Type Compounds. Inorg. Chem. 2015, 54, 3970–3978. 10.1021/acs.inorgchem.5b00135. [DOI] [PubMed] [Google Scholar]
- Wagner F. R.; Bende D.; Grin Y. Heteropolar Bonding and a Position-Space Representation of the 8 – N Rule. Dalton Trans. 2016, 45, 3236–3243. 10.1039/C5DT04140F. [DOI] [PubMed] [Google Scholar]
- Freccero R.; Hübner J.-M.; Prots Y.; Schnelle W.; Schmidt M.; Wagner F. R.; Schwarz U.; Grin Y. “Excess” Electrons in LuGe. Angew. Chem., Int. Ed. 2021, 60, 6457–6461. 10.1002/ANIE.202014284. [DOI] [PMC free article] [PubMed] [Google Scholar]
- Zheng Q.; Wagner F. R.; Ormeci A.; Prots Y.; Burkhardt U.; Schmidt M.; Schnelle W.; Grin Y.; Leithe-Jasper A. Interpenetration of a 3D Icosahedral M@Ni12 (M=Al, Ga) Framework with Porphyrin-Reminiscent Boron Layers in MNi9B8. Chem. – Eur. J. 2015, 21, 16532–16540. 10.1002/CHEM.201502266. [DOI] [PubMed] [Google Scholar]
- Freccero R.; Solokha P.; Proserpio D.; Saccone A.; De Negri S. Lu5Pd4Ge8 and Lu3Pd4Ge4: Two More Germanides among Polar Intermetallics. Crystals 2018, 8, 205. 10.3390/cryst8050205. [DOI] [Google Scholar]
- von Ragué Schleyer P.; Schleyer R.; Jiao H.; Van N. J. R.; Hommes E.; Malkin V. G.; Malkina O. L. An Evaluation of the Aromaticity of Inorganic Rings: Refined Evidence from Magnetic Properties. J. Am. Chem. Soc. 1997, 119, 12669–12670. 10.1021/ja9719135. [DOI] [Google Scholar]
Associated Data
This section collects any data citations, data availability statements, or supplementary materials included in this article.


