Abstract
In this paper, we report an array of fiber-optic sensors based on the Fabry–Perot interference principle and machine learning-based analyses for identifying volatile organic liquids (VOLs). Three optical fiber tip sensors with different surfaces were included in the array of sensors to improve the accuracy for identifying liquids: an intrinsic (unmodified) flat cleaved endface, a hydrophobic-coated endface, and a hydrophilic-coated endface. The time-transient responses of evaporating droplets from the optical fiber tip sensors were monitored and collected following the controlled immersion tests of 11 different organic liquids. A continuous wavelet transform was used to convert the time-transient response signal into images. These images were then utilized to train convolution neural networks for classification (identification of VOLs). We show that diversity in the information collected using the array of three sensors helps machine learning-based methods perform significantly better. We explore different pipelines for combining the information from the array of sensors within a machine learning framework and their effect on the robustness of models. The results showed that the machine learning-based methods achieved high accuracy in their classification of different liquids based on their droplet evaporation time-transient events.
1. Introduction
A liquid droplet in contact with a planar surface can be classified as either pendant or sessile based on the orientation of the surface normal with respect to the direction of gravity. Pendant droplets are nonmoving droplets formed on flat surfaces that have their normal oriented along a gravitational force field. These droplets appear suspended on a supporting surface and may be elongated due to the action of gravity. On the other hand, a sessile droplet is formed when the droplet rests on a supporting surface with its normal oriented opposite to a gravitational force field and may be axisymmetrically depressed due to the action of gravity. Thus, such droplets appear to look flattened on the surface, due to the action of gravity. Numerous properties of liquid droplets, such as formation, geometry, and evaporation, have been investigated.1 These properties of liquid droplets are affected by various factors, including chemical composition, surface tension, and liquid viscosity.2 When there is enough thermal activation energy, molecules of a substance transition from a liquid phase to a gas phase, causing evaporation.3 Many applications and modern instruments are used to monitor and observe a droplet evaporation phenomenon and to understand particles in case of solutions such as printing with an inkjet system4 and confocal microscopes.5 Real-time monitoring of droplet evaporation events is important in medical applications, where it has been used to successfully detect patients with gland dysfunctions.6
Fiber-optic sensors (FOSs) have been employed effectively in various sensing applications, including structural health monitoring,7 down-hole monitoring,8 chemical and biological sensing,9 and seismic detection.10 FOSs have exploded in popularity in engineering societies because they outperform traditional electronic sensors by offering unique benefits such as small size, immunity to electromagnetic interference, high sensitivity and resolution, robustness in harsh environments, remote operation, and multiplexing/distributed sensing capabilities.11 FOSs have been used for measuring various parameters such as displacement, strain, temperature, and pressure.12−15 Currently, FOSs are fabricated following different designs, such as the fiber-optic gyroscopes,16 the fiber grating sensors,17 the interferometer sensors,18 and so forth. Fiber-optic interferometers are widely utilized in the analysis of liquid droplets,19−21 especially, the extrinsic Fabry–Perot interferometer (EFPI)-based sensor, which has demonstrated tremendous potential because it is simple and highly sensitive.14,22 Using the EFPI approach to monitor liquid droplet evaporation events has been previously reported in the literature.23−25 However, the previous studies focused on evaporation dynamics, but they did not use the experiment data to identify liquids. Moreover, the model employed in the present study provides a substantial improvement over the classification models used in the previous studies.
Over the last few decades, many studies have been published on the development and application of sensor arrays for the identification and quantification of organic compounds.26 The concept of the array of sensors is inspired by the mammalian olfactory system where large numbers of receptors in the senses of taste and smell generate distinct responses to the same taste/smell. The information collected by all the receptors is used to identify and discriminate different tastes and smells. These receptor arrays are known for providing extraordinary sensitivity and selectivity. Similarly, in some cases, the response from a single sensor is not adequate for the identification and discrimination of various liquids. However, if several sensors are employed that generate varied responses to the same liquid, different liquids can be identified and discriminated by combining information provided by all the sensors in an array. Researchers have investigated the use of such arrays of sensors for various applications, such as identifying and quantifying vapors by exploiting different modalities like surface acoustic27 and the electrical resistance of conducting polymers.28 Fusing signals from electronic-nose, electronic-tongue, and electronic-eye for tea quality detection using machine learning algorithms have also been done and achieved high accuracy.29 Chemometrics and curve-fitting methods have also been used for the identification of analytes and to compare the results with spectrophotometric methods.30
Convolution neural networks (CNNs) are a set of machine learning models that are primarily used for image processing and computer vision tasks. CNN models are inspired by the function of the human eye31 and involve a set of learnable filters. Deep convolutional neural networks are used to great effect in many difficult computer vision tasks like image classification, segmentation, object detection, and so forth. Extensions and modifications of machine learning models can also be adapted for use with other kinds of data, which include time-series data, graphical data, as well as tabular data. Heartbeat categorization from electrocardiogram waveforms is an example of such an application.32 Machine learning approaches have been used in a variety of fields, including, seismology, medicine, and remote sensing.33−35
In this study, the novelty is the array of FOSs with different functional (chemical) coatings used to produce interconnected data that results in higher accuracy of classification of the test liquids. This approach mimics the established concept used in electronic noses, electronic tongues, and electronic eyes.29 The data from an array of optical sensors considered here are the results of three different time-transient droplet evaporation signals, where one is from an innate cleaved surface, another from a surface treated to be hydrophobic, and the third from a surface treated to be hydrophilic. The interactions of the liquids with the different surfaces lead to differences in their time-transient droplet evaporation signals due to the interaction of the fiber-optic surface and the chemical nature of each liquid. Instead of estimating the evaporation rates of the liquid droplets based on the recorded time-transient signal, the time-transient droplet evaporation signals from the array of sensors are transformed to image data for liquid identification. The combined interrelated information from the three fiber-optic surfaces should give more robust predictive outcomes than using time-transient droplet evaporation signals from a single type of fiber-optic surface. This paper presents the development and characterization of an array of FOSs for recording time-transient droplet evaporation signals. In comparison to our previous paper,36 the capacity of the array of FOSs to provide adequate information for discriminating liquids was evaluated using a larger set of analytes.
2. Experimental Section
The basic configuration of the EFPI-based system composed of an array of FOSs for recording liquid droplet evaporation time-transient signals is illustrated in Figure 1. Figure 1a shows a schematic illustration of the experiment setup. A single wavelength (3 dBm at 1550 nm) butterfly-packed semiconductor laser was employed as the light source. The laser light was then routed to the fiber-optic tip sensor through a fiber-optic circulator. The reflected light from the optical fiber tip containing the droplet information was then sent to a high-speed photodetector (Nirvana Detector, Model 2017). The optical signal will be converted into an electrical signal, and the time-domain electrical signal will be captured by a portable oscilloscope (PicoScope 4642, Pico Technology). The time-domain signal contains information related to the liquid droplet modulated by evaporation, and the data were then stored and analyzed on a computer. A linear stage stepper motor (FCL50, Newport) was employed for sensor handling when dipping the FOS into and pulling the sensor out of the target liquid. Figure 1b depicts the reflections produced by the liquid droplet at the fiber endface, one at the liquid-fiber interface and the other at the liquid-air interface. Both reflectors combine to create a low-finesse Fabry–Perot interferometer cavity system. In the experiment, the fiber tip is dipped into the test volatile organic liquid (VOL) and pulled out from the VOL using the computer-controlled motorized linear stage. As a result, a liquid droplet is formed at the surface of the cleaved optical fiber endface. The liquid droplet at the endface of the optical fiber can be treated as a transitory EFPI cavity.
Figure 1.
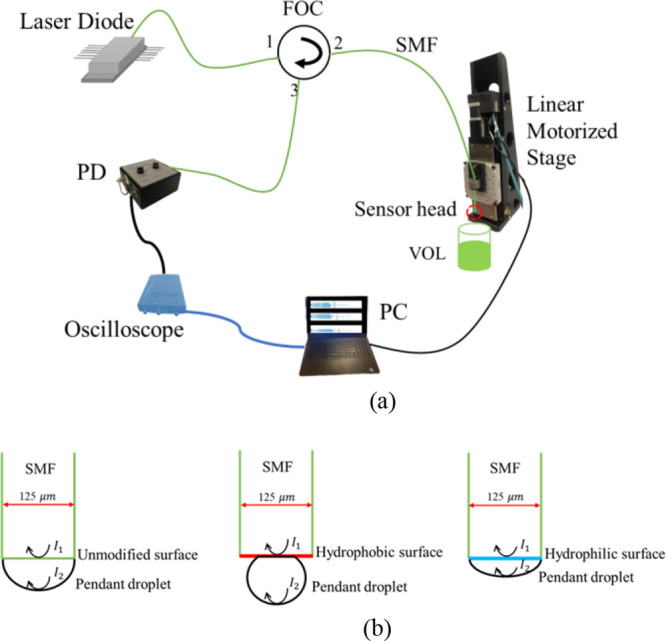
Schematic of the experiment setup for liquid evaporation studies and illustration of pendant droplets (EFPI cavities) forming an EFPI-based sensor device. (a) Schematic diagram of the experiment setup used to perform controlled immersions for recording the evaporation of a liquid droplet. (b) Schematic illustration of pendant droplets hanging from the three different surfaces of three tip sensors included in the array of sensors: an innate surface (unmodified), a hydrophobic surface, and a hydrophilic surface. PD: Photodetector; FOC: Fiber optical circulator; SMF: Single-mode fiber; PC: Personal computer; VOL: Volatile organic liquid; I1 and I2: Intensities from first and second EFPI reflectors, respectively.
The evaporation of the pendant droplet causes the length of the droplet to continuously decrease, resulting in quasi-periodic variations in the reflected light intensity, according to the physical variables described in ref (36). The oscilloscope converts the intensity of the two interfering light beams into an electrical signal, which was monitored as a function of time. The time-transient signal for each droplet evaporation event was recorded and processed for use in creating and improving CNN models for liquid identification.
The array of sensors consists of three optical fiber tip sensors with different endface surfaces, an innate (untreated cleaved tip sensor), a hydrophobic surface tip sensor created by treating the endface of an optical fiber with polydimethylsiloxane (PDMS), and a hydrophilic surface tip sensor created by treating the endface with diethylene glycol (DEG). A hydrophobic surface repels water and causes water droplets with high contact angles to form on the surface. In contrast, hydrophilic surfaces are those that have a special affinity for water. Water is attracted to hydrophilic surfaces, tending to spread across them, resulting in low contact angles between the water and the surface.
In this study, PDMS was used to create a hydrophobic surface. PDMS is a commercially available and widely used organic polymer. PDMS is a water-repellant material and can be employed to create hydrophobic surfaces.37 DEG is another commercially available organic compound with hydrophilic properties.38 DEG is widely used as a humectant for products like printing ink and glue. The hygroscopic properties of DEG were exploited in this study to create a hydrophilic surface at the endface of an optical fiber. Many methods exist for the creation of robust hydrophilic and hydrophobic surfaces on glass.39−41 The primary drawback in most of the methods is the time taken for the formation of such a surface and/or the cost of the method. Since our method involves the construction and use of many fiber-optic tip sensors (with different surfaces), we need a quick, inexpensive, and easily repeatable process that reduces the turnaround time required for the completion of the experiment. To create the different surfaces involved (hydrophobic and hydrophilic) in our experiment, we employ a simple and rapid immersion method. The tip of a flat cleaved optical fiber was immersed in a PDMS solution vertically using a motorized linear stage and then pulled out. The immersion of the optical fiber lasted for 5 seconds. After removal of the immersed tip, the optical fiber sample was allowed to dry for 30 min. A hydrophilic fiber-optic tip surface was made in a similar manner by repeating the abovementioned process with DEG. In this study, 11 different liquids were used for the controlled immersion dip/droplet evaporation experiments, namely, decane, dimethylformamide (DMF), isooctane, 2-propanol, ethanol, trichloroethylene, acetonitrile, ethyl acetate, methanol, acetone, and dichloromethane (DCM). A list of physical properties of these liquids is included in Table 1, ordered by increasing vapor pressure. A series of immersion experiments were conducted, where a set of three different optical fibers were used to perform 55 identical immersion/droplet evaporation tests each. First, a flat cleaved innate surface was immersed into and subsequently pulled out from the test liquid after 1 s. The time-transient signal for the droplet evaporation event was collected. Next, a second cleaved optical fiber coated with PDMS was used to perform an immersion/droplet evaporation test on the same test liquid and the resulting time-transient signal for the droplet evaporation event was collected. The procedure was repeated with a third cleaved optical fiber coated with DEG. So, three different optical fiber tip sensors were used to perform tests using the same liquid (without cleaning the individual tips with each of the different surfaces) but were never reused to perform tests in a different liquid. For the PDMS-coated fiber tip, the process of surface treatment was accomplished by immersing the tip of a flat cleaved optical fiber into and subsequently pulling the fiber out from the PDMS (to make the surface hydrophobic) in a vertical direction using a motorized linear stage. The optical fiber remained in the PDMS for 5 s. After removal from the PDMS, the optical fiber sample was allowed to dry for 30 min under ambient conditions (room temperature, 298 ± 3 K; relative humidity, 40 ± 10%). 11 such cleaved optical fibers treated with PDMS were constructed. Similarly, 11 flat cleaved optical fibers treated with DEG (to make the surface hydrophilic, the optical fiber remained in the DEG for five seconds.). Then, a set of three sensor heads (intrinsic surface, with a hydrophobic surface and, with a hydrophobic surface each) were used to perform 55 identical immersion/droplet evaporation tests in one of the 11 test liquids. The overall data collection was done over a period of 12 days, and we switch between three different containers to hold the liquids. The data collection for a single surface spans 4 days until all 11 liquids have been tested. On each day we use three liquids (except the last day for a surface when we use only two liquids) in three different containers and perform the dip experiments. We use the same three containers throughout all the experiments spanning 12 days. After one surface has been used on all 11 liquids, we switch to a different surface and perform the experiments again till we have used all the surfaces on all the liquids. There is no distinction between signals collected for the same liquid with the same surface that can be observed visually even across different days and different containers.
Table 1. Physical and Chemical Properties of 11 Liquids Identified Using a Fiber-Optic Droplet Evaporation Method, Ordered by Increasing Vapor Pressurea.
| name | formula | molar mass (g/mol) | boiling point (F) | vapor pressure at 25 °C (mmHg) | density (kg/m3) | refractive index | viscosity at 25 °C (mPa·s) | relative polarity |
|---|---|---|---|---|---|---|---|---|
| decane | C10H22 | 142.29 | 345.4 | 1.43 | 730 | 1.412 | 0.838 | 0.300 (hydrophobic) |
| dimethyl-formamide (DMF) | C3H7NO | 73.09 | 307.4 | 3.87 | 944 | 1.4305 | 0.802 | 0.386 (hydrophilic) |
| isooctane | C8H18 | 114.23 | 210.2 | 14.25 | 690 | 1.39145 | 0.50 | 0.537 (hydrophobic) |
| 2-propanol | C3H8O | 60.1 | 180.5 | 43.65 | 786 | 1.377 | 2.04 | 0.546 (hydrophilic) |
| ethanol | C2H5OH | 46.07 | 173.1 | 58.75 | 789 | 1.361 | 1.040 | 0.654 (hydrophilic) |
| trichloro-ethylene | C2HCl3 | 131.4 | 189 | 69.0 | 1.46 | 1.4777 | 0.532 | 0.259 (hydrophobic) |
| acetonitrile | C2H3N | 41.05 | 179.6 | 91.19 | 786 | 1.344 | 0.343 | 0.460 (hydrophilic) |
| ethyl acetate | C4H8O2 | 88.11 | 170.8 | 93.20 | 902 | 1.3724 | 0.428 | 0.228 (hydrophobic) |
| methanol | CH3OH | 32.04 | 148.5 | 126.87 | 792 | 1.33 | 0.543 | 0.762 (hydrophilic) |
| acetone | C3H6O | 58.08 | 132.8 | 229.47 | 784 | 1.359 | 0.306 | 0.355 (hydrophilic) |
| dichloromethane (DCM) | CH2Cl2 | 84.93 | 103.3 | 435.0 | 1.33 | 1.4244 | 0.413 | 0.309 (hydrophobic) |
| polydimethyl-siloxane (PDMS) | (C2H6OSi)n | 74.0 | 213.8 | 5.0 | 764 | 1.4035 | 10.0 | (hydrophobic)b |
| diethylene glycol (DEG) | C4H10O3 | 106.12 | 473.5 | 0.002 | 1110 | 1.4472 | 35.7 | 0.713 (hydrophilic) |
The two organic compounds, PDMS and DEG, used to modify the end surfaces of optical fibers are also included in the table.
Relative polarity was not available for PDMS.
The sensors were never reused in a different test liquid. Time-transient signals for droplet evaporations of all 11 liquids were recorded in this manner. To summarize the method, 11 flat cleaved optical fiber tip sensors, 11 hydrophobic-coated tip sensors, and 11 hydrophilic-coated tip sensors were used to perform 11 × 3 × 55 = 1815 immersion/droplet evaporation tests. Figure 2 shows examples of the response signals measured with respect to time for acetonitrile from the three different optical fiber endface surfaces collected by the EFPI sensor system over a 1 s time window. The differences between the time-domain transients from the three different fiber-optic endface surfaces can be easily observed for the 11 different liquids used in the experiment. While visually inspecting the recorded time-domain signals to clearly correlate them to the 11 liquids is difficult, a deep learning model may be utilized as a robust predictive model that can be trained to identify each liquid. Because of the EFPI sensor systems’ great sensitivity, the recorded time-transient signal for a droplet evaporation event provides extensive information, such as the initial droplet size and the evaporation rate, implicitly. Alternatively, these informative time-domain signals can also be used with conventional machine learning models like random forests,42 support vector machines,43 fully connected NNs,44 and so forth. For most such approaches to be viable, feature engineering and extraction must be performed first. We can circumvent this step by relying on a deep learning model to extract relevant features automatically as it is trained. As the raw signal is a time-domain signal, the task can be considered as time-series classification, and hence, the existing time-series classification methods can be applied to the data set as well. In-depth surveys of such methods reported in refs (45−47) can be used to explore other possible approaches. It is also possible to use ideas from sensor fusion and data fusion48,49 to explore more ways of combining the information in the response signals from the three different surfaces.
Figure 2.
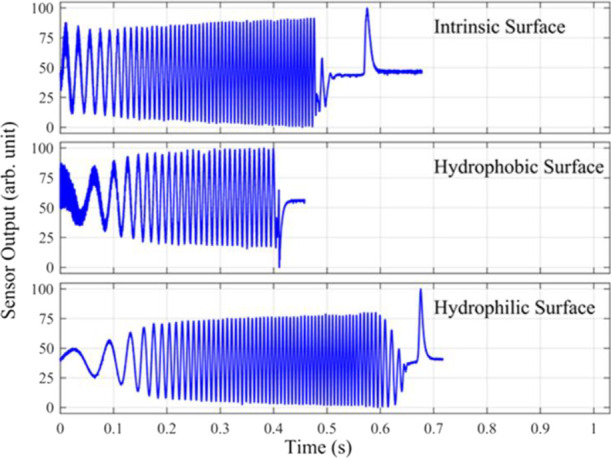
Example of time-domain evaporation transient response signals for evaporating droplets of acetonitrile using an array of three fiber-optic sensors. Each signal corresponds to an evaporation event of a single acetonitrile droplet from a single surface from one optical fiber from the array of sensors. For comparison, the X-axis is set to a range of 0 to 1.0 s for all evaporation transients, so that response signals of varying durations can be compared. The remainder of the plots can be found in the Supporting Information.
3. Data Collection and Curation
The main proposal of this paper relates to combining an array of three endface-modified FOSs and then use the evaporation events generated to categorize the liquids. A CNN is used to categorize liquids from the metered pendant droplet evaporation events. First, we provide an overview of the data collection and pre-processing step; then, we discuss data set curation and machine learning model construction; and finally, we analyze our results and justify our conclusions.
In the data collection and curation step, we selected 11 different types of pure liquids as analytes for our experiment. The liquids, ordered in Table 1 according to increasing vapor pressure, are decane, DMF, isooctane, 2-propanol, ethanol, trichloroethylene, acetonitrile, ethyl acetate, methanol, acetone, and DCM. Some relevant physical properties of these liquids are also included in Table 1. We began the experiment by employing the EFPI sensor system to record droplet evaporation events from three different sensor heads. Figure 2 shows an example of the measured time-domain transient response signals for the evaporation events generated by a pendent droplet of acetonitrile on the three different endfaces of the three FOSs. Time-domain transient response signals recorded for droplet evaporation events of the other 10 pure liquids and three graphs demonstrating the reproducibility of the droplet evaporation events for acetonitrile from three different optical fiber endface surfaces are included in the Supporting Information.
We shall refer to these time-domain transient response signals as just response signals for the sake of brevity in the remainder of the article. As can be seen in Figure 2, differences between the response signals from the three different sensor heads are apparent. These differences can be attributed to the different surfaces of the three sensor heads having different chemical coatings and hence resulting in varying droplet shapes and sizes. Instead of further expenditure of time and labor spent on calculating the evaporation rates of droplets from the different surface heads based on the response signals, droplet size, droplet shape, physicochemical properties, and other experiment parameters and then attempting liquid identification, we use machine learning to categorize the recorded response signals by framing it as a classification problem in the context of machine learning. The challenging task of finding the correlations between the time-domain response signals, the three different surfaces, and the 11 different pure liquids is difficult through visual inspection. Deep learning models, being powerful nonlinear function approximators, may therefore be employed to identify each liquid. Due to the high sensitivity of the EFPI sensor system, the measured time-transient signals from the evaporation events are rich with information such as droplet sizes and the evaporation rates, although the information may not be directly accessible without further processing. Therefore, a data-driven machine learning approach is used to overcome this limitation.
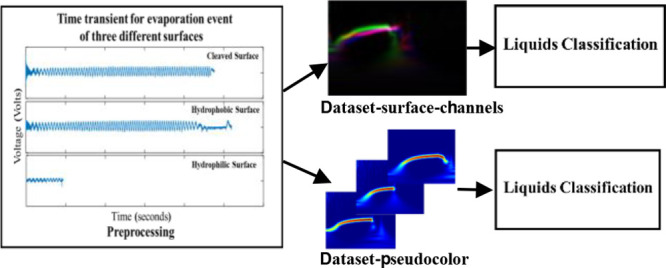
For the purpose of training our deep learning model, we assumed that the training is performed on liquid test samples that are experimentally distinguishable. Maintaining the room temperature within a desired range and assuring that the sample area under test is invariant, other variations like container size or order of dipping did not cause changes in the measurements taken from each liquid test sample. In real-world applications, the three different surfaces could be employed consecutively or simultaneously to collect three distinct measurements/response signals from a single liquid test sample. We used this assumption to combine response signals from the three different fiber-optic endfaces to show different use cases and thus to create varied data sets and tasks, which can then be applied to machine learning models. Here, the creation of a single data sample for a test liquid was taken to consist of first performing three simultaneous or consecutive dips with the three different sensor heads and recording the response signals (giving three measurements/response signals from each surface); we call this a “three-dip” test. This data sample is further processed in accordance with the data set creation process described below to become a single or multiple data points or entries in a data set. To clarify further, a “three-dip” test is the method of dipping all three of the three sensor heads in the test liquid, recording the response signals using the same liquid sample. This gives us three response signals per liquid test sample within a single data sample. A total of 55 data samples were collected for each of the 11 liquids, yielding a total of 605 data samples. We then construct two different kinds of data sets with the names data set pseudocolor and data set surface channels. For both data sets, we begin by converting the response signals to an equivalent time-frequency representation using the continuous wavelet transform. The response signal representation is referred to as a scalogram. We convert all individual response signals into their scalogram representations. Figure 3 shows the scalograms (in pseudocolor) of the three signals for acetonitrile shown in Figure 2. Depending on the data set, the assumptions about the response signals in a data sample and the processing of the scalograms are different. Below we describe the process for constructing the two different data sets mentioned above and the underlying assumptions.
Figure 3.
Comparison of the scalograms for the droplet evaporation events for acetonitrile from the “three-dip” test. Response signals from acetonitrile droplet evaporation on (a) intrinsic surface, (b) hydrophobic surface, and (c) hydrophilic surface for the “three-dip” test are shown.
3.1. Data Set Pseudocolor
In this data set, we treat each individual dip of the “three-dip” tests as independent and split apart. This means that after processing 55 response signals per three different sensor surfaces and 11 pure liquids, we have 1815 individual data points in total. The scalograms generated after processing the individual responses are matrices of size 169 × 128,700. We then scale the entries of the matrices to the range 0 to 1. The matrices are then scaled and quantized again to the range 0–255 and finally converted to three-channel pseudocolor (contour) images; these three channels can be considered as the red, green, and blue channels of an RGB image for displaying purposes, as seen in Figure 3. The pre-trained deep learning models used expect three-channel images with entries in the range 0–255 as inputs, as they were originally trained on RGB images for visual object recognition. This gives us 1815 scalogram images (data points) in this data set. The pseudocolor images are then resized to the desired sizes of either 224 × 224 × 3 or 227 × 227 × 3, depending on the requirements of the model used and the input to the model.
3.2. Data Set Surface Channels
In the pursuit of eventually building a model which combines the information coming from the three sensors, we create a three-channel image data set. In this data set, each of the individual scalograms from the same “three-dip” data sample are processed to become one of the channels in the three-channel image. The three-channel images are composed of three scalogram images, one for each type of sensor head, with the channels ordered based on which sensor head the scalogram image is from. This order is consistent for all three-channel images (data points) in the data set. Each channel in the three-channel image is a scalogram image processed in the same manner as for data set pseudocolor except the step of converting them to pseudocolor images. This means that each three-channel image has each of its individual channels scaled and quantized to be between 0 and 255. This allows us to again display and treat these images as RGB images. After processing, the data set has a total of 605 three-channel scalogram images (data points) corresponding to each of the 605 “three-dip” data samples/tests. They are then resized to the desired image sizes, either 224 × 224 × 3 or 227 × 227 × 3, depending on the model used. An example of such a three-channel RGB scalogram image for acetonitrile is shown in Figure 4.
Figure 4.
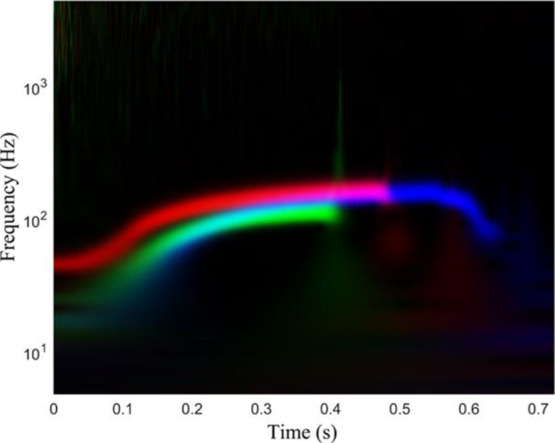
Example of a three-channel image from data set surface channels displayed as an RGB image, where scalogram images of response signals from a single complete data collection step or “three-dip” test for acetonitrile are used. Each channel corresponds to the response collected from a droplet evaporation event of acetonitrile from one of the three differently treated cleaved optical fiber sensor head surfaces, namely, intrinsic (red channel), hydrophobic (green channel), and hydrophilic (blue channel).
4. Experimental Results and Discussion
In this work, there are three pipelines for training machine learning models using the data sets mentioned above. The three pipelines vary depending on which data set is used for training and where, if at all, the information from the three different sensors is fused or combined. Using the data fusion terminology as presented in ref (50), we present two distinct types of fusion, pixel-level fusion (Pipeline 1), where the pixels in an image are fused to a combined representation of different images for a task (data set surface channels), and decision-level fusion (Pipeline 2). We first describe each of the pipelines and why they are used and then later expand upon the machine learning model architectures and training regimes. The pipelines used are described below.
4.1. Pipeline 1
In this pipeline, we use the images from data set surface channels for training our models. Here, the model learns to identify the liquid from a single “three-dip” test processed as mentioned in the creation process for data set surface channels. In this case, the information from the three different kinds of sensors is essentially combined at the input end of the model. We do this to see how the models perform when they can use three different sources of information coming from a single “three-dip” test for a particular liquid. The information fusion happens within the model, and we rely on the model to learn the best way to leverage the data for liquid identification.
For model training in this pipeline, we start with splitting the 605 images in data set surface channels into three groups, 50% of the data set being reserved as the training data set, 30% as the validation set, and the last 20% as a hold-out test set (hold-out set) for final evaluation of the model. This results in 303 images in the training set, 181 in the validation set, and 121 in the hold-out set. In view of comparing the different pipelines, we use the same response signals that constitute the training, validation, and hold-out set for the other pipelines, albeit processed according to the data set used for that pipeline.
The model then outputs a score vector of size 11 × 1 with values in the range 0 to 1. Here, each entry in the score vector corresponds to the probability that the image is from a particular class (liquid). During the decision-making step, we identify the liquid using the index of the highest score in the vector.
4.2. Pipeline 2
For this pipeline, we use the images from data set pseudocolor, where each individual response signal/data sample is treated as an independent data point once it is converted to a pseudocolor scalogram image. In this pipeline, we essentially disassociate the three signals of a “three-dip” test from each other, while training the model and instead try to use this association only at the decision-making step to combine the decisions for the signals from the same “three-dip” test during validation and evaluation on the hold-out set. We do this by first obtaining the 11 × 1 vector of output scores for each image from the same “three-dip” test. This gives us three score vectors, each one corresponding to the signal from one of the three sensor heads for a particular liquid. We then average the scores such that the result is a 11 × 1 averaged score vector. The highest score in this averaged vector is then used to identify and assign the class for all the three response signals from the “three-dip” test.
During training, validation, and evaluation, we use the same response signals as in Pipeline 1 but with all the individual signals processed into pseudocolor scalogram images. This ensures that results from the pipelines on the hold-out set are comparable. Hence, we have 909 pseudocolor images in the training set, 543 images in the validation set, and 363 images in the hold-out set.
4.3. Pipeline 3
Pipeline 3 is a minor modification on Pipeline 2 where no fusion of information takes place, neither in the model nor at the decision-making step. We use the same models trained for Pipeline 2, but during model evaluation, we do not combine the scores for images from the same “three-dip” test. Here, each response signal from a “three-dip” test is assumed to be independent of one another. We do this to observe model performance without any fusion of information and to construct a simple baseline for comparing the improvement gained by combining information from the three different sensors as done in Pipelines 1 and 2.
For Pipelines 1 and 2, we train five different deep learning architectures each. The training regime is the same as reported in ref (34). The ADAM optimizer is used with a constant learning rate of 1 × 10⁻⁴, batch size of 32, and the maximum number of epochs set to 7. The models are trained using cross-entropy loss similar to what was done in ref (36). We use early stopping of three epochs based on the loss for the validation set to prevent overfitting. If no improvement in the validation set loss is seen for three epochs, then training is stopped, and the model is saved.
The results of testing the models are shown in Table 2. The different models used were AlexNet,51 DenseNet-201,52 GoogLeNet,53 ResNet-18, and ResNet-50.54 All the models used were pre-trained on the ImageNet,55 data set. The lowest accuracy on the hold-out set across all pipelines is for Pipeline 3, for all the models, as shown in Table 2. The ResNet-18 model shows the highest classification accuracy among the five model architectures across all pipelines. Furthermore, the highest accuracy is achieved when using Pipeline 1 with the ResNet-18 model. DenseNet-201, ResNet-18, and ResNet-50 all show the highest achievable classification accuracies among the five models in both Pipelines 1 and 2.
Table 2. Accuracies (%) on the Hold-Out Set for the Classification of Liquids Using Different Pre-Trained CNN Models.
| models | Pipeline 1 | Pipeline 2 | Pipeline 3 |
|---|---|---|---|
| AlexNet | 96.69 | 94.21 | 87.33 |
| DenseNet-201 | 100 | 100 | 99.17 |
| GoogLeNet | 98.35 | 97.52 | 90.36 |
| RestNet-18 | 100 | 100 | 99.72 |
| RestNet-50 | 100 | 100 | 97.25 |
We see that for the baseline (Pipeline 3) performance taken directly, we have the poorest scores across all models. Pipeline 3 is not directly comparable to Pipelines 1 and 2; Pipeline 2 is in fact a variation of Pipeline 3 to see the effect of fusing (via score averaging) the output scores for scalograms from a single three-dip test, giving us a final “fused” score for the three-dip test. We can then compare this fused output score with the scores from Pipeline 1 directly. In pipeline 2 where we use the same models as pipeline 3 but score averaging is performed, we can see that model accuracies show improvement. Our poorest performing models AlexNet and GoogLeNet show an improvement of almost 7% over the baseline and our performant models attain 100% accuracy. Pipeline 1 performs the best; we believe that this is because the models internally find the best features from the three-channel images and learn how to combine the information optimally.
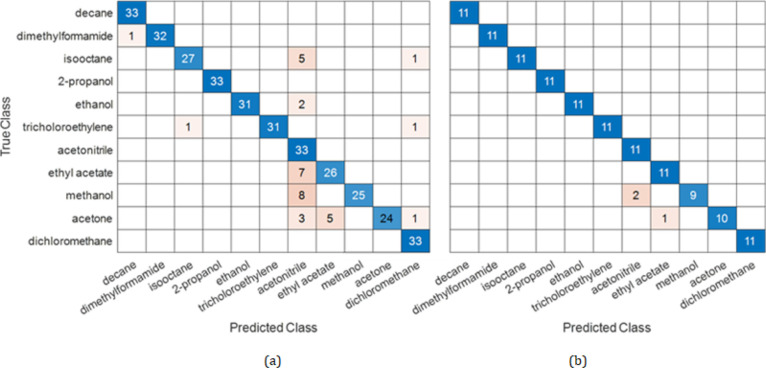
We use AlexNet, our worst performing model—which still gives an accuracy of around 87% on the hold-out set—to analyze the kind of misclassifications that happen and later compare it to the improvements seen for the same model in Pipelines 2 and 3. In Figure 5, we show the confusion matrix for classification results in Pipeline 3 from the AlexNet model. The confusion matrix indicates the number of correct and incorrect classifications of data points to liquid class using our model. The columns correspond to the true classes for data, and the rows report the predicted classes. Diagonal elements of the matrix, therefore, correspond to the number of correctly classified data points and off-diagonal entries correspond to the number of incorrectly classified data points. We see that a significant number of isooctane and acetonitrile data points are misclassified; we attribute the misclassifications to similarities in the pseudocolor images of response signals from at least one of the surfaces being similar to another because of similar evaporation times.
Figure 5.
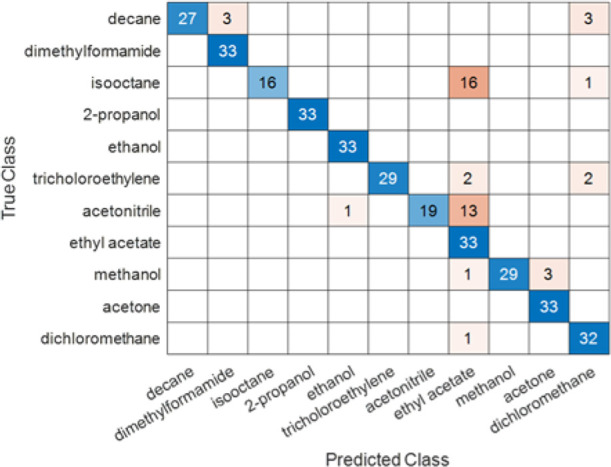
Confusion matrix from the results employing the AlexNet model for Pipeline 3. The confusion matrix shows the number of correct and incorrect predictions for each class (test liquid). The True Class and Predicted Class labels are ordered according to increasing vapor pressure from top to bottom and left to right, respectively.
With the de-association between responses from different surfaces, the signals which evaporate faster/slower on a surface evaporate more quickly/slowly giving us a shorter/longer response signal, which may then be misclassified as a liquid which has a similar evaporation duration on one of the surfaces. An example can be seen in Figure 6. Once we move to Pipeline 2, we see that averaging the scores from the same “three-dip” test improves the overall accuracy and corrects some misclassifications. A single data point in Pipeline 2 corresponds to three individual data samples and hence three individual data points in Pipeline 3, which means that a single misclassification in Pipeline 2 amounts to misclassifying 3 data points in Pipeline 2. Comparing the confusion matrices from Figure 5 and Figure 7, and the results for all the other models, we see that this averaging has a net ameliorative effect.
Figure 6.
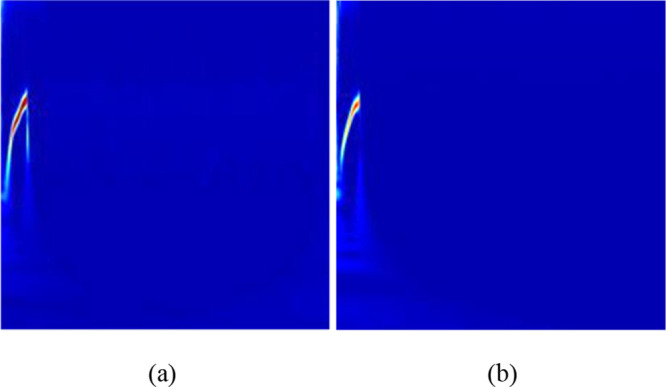
Comparison of pseudocolor images for two different liquids generating similar responses when using a sensor head with a different surface. (a) Pseudocolor scalogram image for ethyl acetate using a response signal from an innate cleaved surface and (b) for isooctane from a hydrophobic surface.
Figure 7.
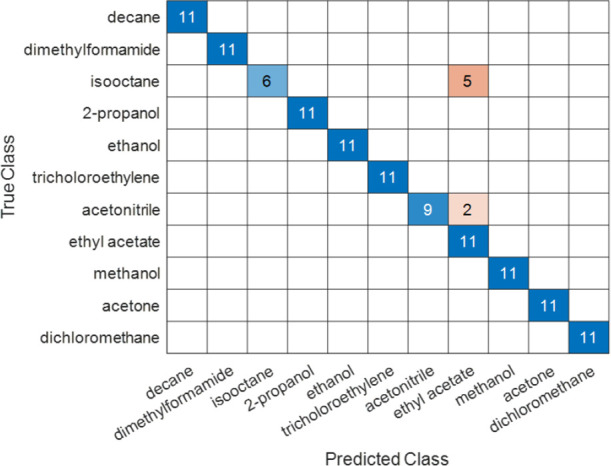
Confusion matrix from the results employing the AlexNet model across the 11 test liquids with the hold-out test data set for Pipeline 2. The confusion matrix shows the number of correct and incorrect classifications for each class (test liquid). For example, the AlexNet model classified isooctane correctly for six data points and misclassified isooctane as ethyl acetate for five data points, and acetonitrile was identified correctly for nine data points and misidentified as ethyl acetate for two data points.
For the AlexNet model, our accuracy on Pipeline 3 is 87.33% and improves to 94.21%. The AlexNet model corrects the misclassifications of the decane data points as DMF and dichloromethane; the isooctane data points as ethyl acetate and dichloromethane; the trichloroethylene data points as ethyl acetate and dichloromethane; the acetonitrile data points as ethanol and ethyl acetate; the methanol data points as ethyl acetate and acetone; the dichloromethane data points as ethyl acetate. Misclassification of the isooctane data points and the acetonitrile data points to ethyl acetate persists. These misclassifications vary from model to model. We present the confusion matrices for the GoogLeNet model in Figure 8 with the majority of the misclassifications happening when classes are predicted as ethyl acetate.
Figure 8.
Comparison of confusion matrices using the GoogLeNet model for predicting liquid class (liquid identification/classification) on the hold-out set. (a) Confusion matrix for Pipeline 3 and (b) confusion matrix for Pipeline 2.
Our results using Pipeline 1 improve upon the accuracies from both Pipelines 2 and 3, as shown in Figure 9. The confusion matrix showed that for acetone, 7 of 11 data points were correctly classified, 3 of them were wrongly classified into the class of ethyl acetate, and 1 of them was wrongly classified into the class of dichloromethane.
Figure 9.
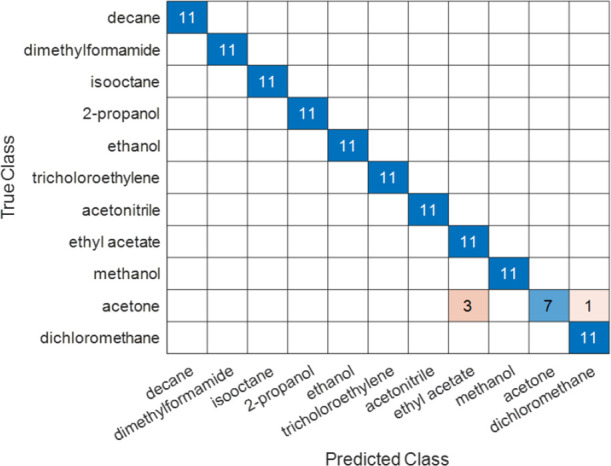
Confusion matrix from the results employing the AlexNet model across the 11 liquids with the test data set for Pipeline 1. The confusion matrix shows the number of correct and incorrect predictions for each class (test liquid). For example, the AlexNet model identified acetone correctly for seven tests and misidentified acetone as ethyl acetate for three tests and dichloromethane for one test.
We believe that the misclassifications are because of the diversity of information in a single input in Pipeline 1. The model learns how to combine information/features of the responses coming from the three different surfaces to better distinguish the input data points provided to it. When using the AlexNet model, the accuracy increases by around 2% over Pipeline 2. The improvement in accuracy is also reflected in our second-worst model, which is GoogLeNet. The performances of the models mirror what we have seen in ref (28) where AlexNet and GoogLeNet performed relatively poorly when compared to the other models on data sets that were processed as done for data set pseudocolor.
5. Conclusions
This paper proposed and demonstrated an effective array of FOSs based on an EFPI system and machine learning (ML) techniques, which were employed for the identification of VOLs. Combining the responses of three different tip sensors in the array of three FOSs for liquid evaporation events provided more robust predictive information for liquid identification compared to using only one optical fiber tip sensor. The array of three FOSs, in combination with ML-based analyses, effectively identified 11 different liquids. The CNN models were employed to learn a hierarchy of abstract features from the image data sets (image data sets correspond to time-transient responses from the array of three FOSs to the evaporation events for the 11 test liquids).
The trained CNN models achieved 100% accuracy in identifying 11 different liquids. The proposed array of three FOSs can find many applications and be very useful in chemical industries because it is easy to fabricate and provides high sensitivity, a rapid response time, and high fidelity. In conclusion, diversifying the kinds of sensor heads to gain varied responses improves the distinguishability of liquids within a machine learning/deep learning framework, as presented here. This approach can aid in the improvement and development of new arrays of fiber-optic sensor devices for chemical analyses.
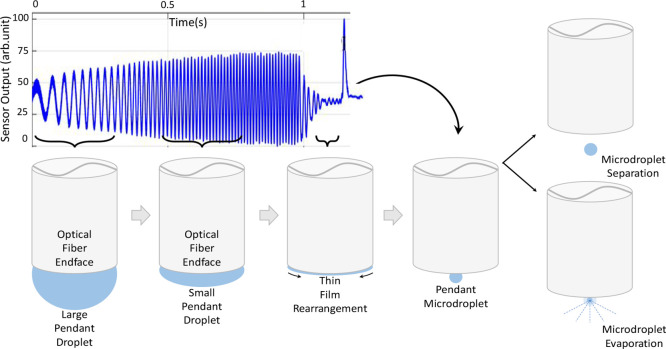
Please note that some of the time-transient signals in the Supplementary Information exhibit a sudden re-appearance in the form of a spike after the main transient signals appear to terminate. This so-called “quantum jump” is repeatable. One hypothesis of the quantum jump observation that we may test in a future study is that the droplet evaporation process culminates in a thin film that spans the diameter of the optical fiber endface and has a surface energy that can be substantially reduced if the film reorganizes into a pendant microdroplet. Due to the reduced overlap and interaction with the optical fiber endface, the newly formed microdroplet instantly vanishes by mechanically separating and falling away from the supporting face of the optical fiber or through evaporation. Because the microdroplet extends further from the center of the optical fiber endface compared to the thickness of the thin film, an effectively larger FP cavity is formed for an instant before separating or evaporating. In the two processes of thin-film rearrangement and pendant microdroplet separation, the fringe visibility changes dramatically. The fringe visibility is determined by the similarity of the two effective reflection intensities (I1 and I2) of the FP cavity.36Figure 10 illustrates the aforementioned hypothesis. Testing the hypothesis more thoroughly is beyond the scope of the current work.
Figure 10.
Schematic illustration of a hypothesis that explains the sudden re-appearance of the time-transient signals in the form of a spike after the main transient signals appear to terminate, the so-called “quantum jump.” See text for explanation.
Acknowledgments
This research was supported by the Lightwave Technology Lab at the Missouri University of Science and Technology, Rolla, MO. J.H. is grateful for support from the Roy A. Wilkens Professorship Endowment. W.N. gratefully acknowledges a scholarship from the Royal Thai Government.
Supporting Information Available
The Supporting Information is available free of charge at https://pubs.acs.org/doi/10.1021/acsomega.2c05451.
Examples of time-domain transient response signals generated by evaporation of droplets for all liquids over an array of three FOSs, comparison of the scalograms for the evaporation events of all liquids from the “three-dip” test, figures of three-channel RGB images of all liquids used, and examples of time-domain evaporation transient response signals for droplet evaporation experiments using acetonitrile (PDF)
The authors declare no competing financial interest.
Supplementary Material
References
- Kumar M.; Bhardwaj R. A combined computational and experi-mental investigation on evaporation of a sessile water droplet on a heated hydrophilic substrate. Int. J. Heat Mass Transfer 2018, 122, 1223–1238. 10.1016/j.ijheatmasstransfer.2018.02.065. [DOI] [Google Scholar]
- Arcamone J.; Dujardin E.; Rius G.; Pérez-Murano F.; Ondarçuhu T. Evaporation of femtoliter sessile droplets monitored with nanome-chanical mass sensors. J. Phys. Chem. B. 2007, 111, 13020–13027. 10.1021/jp075714b. [DOI] [PubMed] [Google Scholar]
- Tro N. J.Chemistry: A molecular approach, 4th ed.; Pearson: Boston, MA, 2017; pp 502–512. [Google Scholar]
- Kawase T.; Sirringhaus H.; Friend R. H.; Shimoda T. Inkjet printed via-hole interconnections and resistors for all-polymer transistor circuits. Adv. Mater. 2001, 13, 1601–1605. . [DOI] [Google Scholar]
- Gao A.; Liu J.; Ye L.; SchOnecker C.; Kappl M.; Butt H.-J.; Steffen W. Control of Droplet Evaporation on Oil-Coated Surfaces for the Synthesis of Asymmetric Supraparticles. Langmuir 2019, 35, 14042–14048. 10.1021/acs.langmuir.9b02464. [DOI] [PMC free article] [PubMed] [Google Scholar]
- Goto E.; Endo K.; Suzuki A.; Fujikura Y.; Matsumoto Y.; Tsubo-ta K. Tear evaporation dynamics in normal subjects and subjects with obstructive meibomian gland dysfunction. Invest. Ophthalmol. Vis. Sci. 2003, 44, 533–539. 10.1167/iovs.02-0170. [DOI] [PubMed] [Google Scholar]
- Guo H.; Xiao G.; Mrad N.; Yao J. Fiber optic sensors for struc-tural health monitoring of air platforms. Sensors 2011, 11, 3687–3705. 10.3390/s110403687. [DOI] [PMC free article] [PubMed] [Google Scholar]
- Kersey A. D. Opticaleiber sensors for permanent downwell monitoring applications in the oil and gas industry. IEICE Trans. Electron. 2000, 83, 400–404. 10.1117/12.2302132. [DOI] [Google Scholar]
- Wolfbeis O. S. Fiber-optic chemical sensors and biosensors. Anal. Chem. 2006, 78, 3859–3874. 10.1021/ac060490z. [DOI] [PubMed] [Google Scholar]
- Lary D. J.; Alavi A. H.; Gandomi A. H.; Walker A. L. Machine learning in geosciences and remote sensing. Geosci. Front. 2016, 7, 3–10. 10.1016/j.gsf.2015.07.003. [DOI] [Google Scholar]
- Udd E.; Spillman W. B.. Fiber Optic Sensors: An Introduction for Engineers and Scientists, 2nd ed.; John Wiley and Sons, 2011; pp 1–8. [Google Scholar]
- Zhu C.; Chen Y.; Zhuang Y.; Du Y.; Gerald R. E.; Tang Y.; Huang J. An optical interferometric triaxial displacement sensor for structural health monitoring: Characterization of sliding and debonding for a delamination process. Sensors 2017, 17, 5–7. 10.3390/s17112696. [DOI] [PMC free article] [PubMed] [Google Scholar]
- Huang Y.; Wei T.; Zhou Z.; Zhang Y.; Chen G.; Xiao H. An extrinsic Fabry-Perot interferometer-based large strain sensor with high resolution. Meas. Sci. Technol. 2010, 21, 105308 10.1088/0957-0233/21/10/105308. [DOI] [Google Scholar]
- Zhu C.; Chen Y.; Zhuang Y.; Fang G.; Liu X.; Huang J. Optical Interferometric Pressure Sensor Based on a Buckled Beam with Low-Temperature Cross-Sensitivity. IEEE Trans. Instrum. Meas. 2018, 67, 950–955. 10.1109/TIM.2018.2791258. [DOI] [Google Scholar]
- Zhao Y.; Li X. G.; Cai L.; Zhang Y. N. Measurement of RI and Temperature Using Composite Interferometer with Hollow-Core Fiber and Photonic Crystal Fiber. IEEE Trans. Instrum. Meas. 2016, 65, 2631–2636. 10.1109/TIM.2016.2584390. [DOI] [Google Scholar]
- Passaro V. M. N.; Cuccovillo A.; Vaiani L.; De Carlo M.; Cam-panella C. E. Gyroscope technology and applications: A review in the industrial perspective. Sensors 2017, 17, 2284. 10.3390/s17102284. [DOI] [PMC free article] [PubMed] [Google Scholar]
- Chen J.; Liu B.; Zhang H. Review of fiber Bragg grating sensor technology. Front. Optoelectron. China 2011, 4, 204–212. 10.1007/s12200-011-0130-4. [DOI] [Google Scholar]
- Lee B. H.; Kim Y. H.; Park K. S.; Eom J. B.; Kim M. J.; Rho B. S.; Choi H. Y. Interferometric fiber optic sensors. Sensors 2012, 12, 2467–2486. 10.3390/s120302467. [DOI] [PMC free article] [PubMed] [Google Scholar]
- Preter E.; Preloznik B.; Artel V.; Sukenik C. N.; Donlagic D.; Zadok A. Monitoring the evaporation of fluids from fiber-optic micro-cell cavities. Sensors 2013, 13, 15261–15273. 10.3390/s131115261. [DOI] [PMC free article] [PubMed] [Google Scholar]
- Salazar-Haro V.; Márquez-Cruz V.; Hernández-Cordero J.. Liquids analysis using back reflection single-mode fiber sensors; 22nd Congress of the International Commission for Optics: Light for the Development of the World; SPIE, 2011; Vol. 8011; pp 1298 −1307. [Google Scholar]
- Moura J. P.; Baierl H.; Auguste J.-L.; Jamier R.; Roy P.; Santos J. L.; Frazão O.. Evaporation of fluids in suspended-core fibres; Third Mediterranean Photonics Conference; 2014; pp 2–4. [DOI] [PubMed]
- Zhuang Y.; Chen Y.; Zhu C.; Gerald R. E.; Huang J. Probing changes in tilt angle with 20 nanoradian resolution using an extrinsic Fabry-Perot interferometer-based optical fiber inclinometer. Opt. Express 2018, 26, 2546. 10.1364/OE.26.002546. [DOI] [PubMed] [Google Scholar]
- Lim O. R.; Cho H. T.; Seo G. S.; Kwon M. K.; Ahn T. J.. Evaporation Rate Sensor of Liquids Using a Simple Fiber Optic Configuration; Conference on Lasers and Electro-Optics Pacific Rim (CLEO-PR); IEEE, 2018; Vol. 2018; pp 1–2. [Google Scholar]
- Preter E.; Katzman M.; Oren Z.; Ronen M.; Gerber D.; Zadok A. Fiber-optic evaporation sensing: Monitoring environmental conditions and urinalysis. J. Light. Technol. 2016, 34, 4486–4492. 10.1109/JLT.2016.2535723. [DOI] [Google Scholar]
- Lim O. R.; Ahn T. J. Fiber-optic measurement of liquid evaporation dynamics using signal processing. J. Light. Technol. 2019, 37, 4967–4975. 10.1109/JLT.2019.2926480. [DOI] [Google Scholar]
- Bariáin C.; Matías I. R.; Romeo I.; Garrido J.; Laguna M. Detection of volatile organic compound vapors by using a vapochromic material on a tapered optical fiber. Appl. Phys. Lett. 2000, 77, 2274–2276. 10.1063/1.1316074. [DOI] [Google Scholar]
- Zellers E. T.; Batterman S. A.; Han M.; Patrash S. J. Optimal Coating Selection for the Analysis of Organic Vapor Mixtures with Polymer-Coated Surface Acoustic Wave Sensor Arrays. Anal. Chem. 1995, 67, 1092–1106. 10.1021/ac00102a012. [DOI] [PubMed] [Google Scholar]
- Freund M. S.; Lewis N. S. A chemically diverse conducting polymer-based ‘electronic nose. Proc. Natl. Acad. Sci. U. S. A. 1995, 92, 2652–2656. 10.1073/pnas.92.7.2652. [DOI] [PMC free article] [PubMed] [Google Scholar]
- Xu M.; Wang J.; Zhu L. The qualitative and quantitative assessment of tea quality based on E-nose, E-tongue and E-eye combined with chemometrics. Food Chem. 2019, 289, 482–489. 10.1016/j.foodchem.2019.03.080. [DOI] [PubMed] [Google Scholar]
- Ni Y.; Kokot S. Does chemometrics enhance the performance of electroanalysis?. Anal. Chim. Acta 2008, 626, 130–146. 10.1016/j.aca.2008.08.009. [DOI] [PubMed] [Google Scholar]
- Lecun Y.; Bengio Y.; Hinton G. Deep learning. Nature 2015, 521, 436–444. 10.1038/nature14539. [DOI] [PubMed] [Google Scholar]
- Qibin Z.; Liqing Z.. ECG feature extraction and classification using wavelet transform and support vector machines; International Conference on Neural Networks and Brain; IEEE, 2005; Vol. 2; pp 1089 −1092.
- Erickson B. J.; Korfiatis P.; Akkus Z.; Kline T. L. Machine learning for medical imaging. Radiographics. 2017, 37, 505–515. 10.1148/rg.2017160130. [DOI] [PMC free article] [PubMed] [Google Scholar]
- Lary D. J.; Alavi A. H.; Gandomi A. H.; Walker A. L. Machine learning in geosciences and remote sensing. Geosci. Front. 2016, 7, 3–10. 10.1016/j.gsf.2015.07.003. [DOI] [Google Scholar]
- Maxwell A. E.; Warner T. A.; Fang F. Implementation of ma-chine-learning classification in remote sensing: An applied review. Int. J. Remote Sens. 2018, 39, 2784–2817. 10.1080/01431161.2018.1433343. [DOI] [Google Scholar]
- Naku W.; Zhu C.; Nambisan A. K.; Gerald R. E.; Huang J. Machine learning identifies liquids employing a simple fiber-optic tip sensor. Opt. Express 2021, 29, 40000. 10.1364/OE.441144. [DOI] [PubMed] [Google Scholar]
- Stanton M. M.; Ducker R. E.; MacDonald J. C.; Lambert C. R.; Grant McGimpsey W. Super-hydrophobic, highly adhesive, polydime-thylsiloxane (PDMS) surfaces. J. Colloid Interface Sci. 2012, 367, 502–508. 10.1016/j.jcis.2011.07.053. [DOI] [PubMed] [Google Scholar]
- Kao M. J.; Tien D. C.; Jwo C. S.; Tsung T. T. The study of hy-drophilic characteristics of ethylene glycol. J. Phys.: Conf. Ser. 2005, 13, 442–445. 10.1088/1742-6596/13/1/102. [DOI] [Google Scholar]
- Gong X.; He S. Highly Durable Superhydrophobic Polydime-thylsiloxane/Silica Nanocomposite Surfaces with Good Self-Cleaning Ability. ACS Omega 2020, 5, 4100–4108. 10.1021/acsomega.9b03775. [DOI] [PMC free article] [PubMed] [Google Scholar]
- Manoharan K.; Bhattacharya S. Superhydrophobic surfaces re-view: Functional application, fabrication techniques and limitations. J. Micromanufacturing 2019, 2, 59–78. 10.1177/2516598419836345. [DOI] [Google Scholar]
- Yu Y.; Sun Y.; Cao C.; Yang S.; Liu H.; Li P.; Huang P.; Song W. Graphene-based composite supercapacitor electrodes with diethylene glycol as inter-layer spacer. J. Mater. Chem. A 2014, 2, 7706–7710. 10.1039/C4TA00905C. [DOI] [Google Scholar]
- Gokgoz E.; Subasi A. Comparison of decision tree algorithms for EMG signal classification using DWT. Biomed. Signal Process. Control 2015, 18, 138–144. 10.1016/j.bspc.2014.12.005. [DOI] [Google Scholar]
- Martínez-Manuel R.; Valentín-Coronado L. M.; Esquivel-Hernández J.; Monga K. J.-J.; LaRochelle S. Machine learning implementation for unambiguous refractive index measurement using a self-referenced fiber refractometer. IEEE Sens. J. 2022, 14, 14134–14141. 10.1109/JSEN.2022.3183475. [DOI] [Google Scholar]
- Nagabushanam P.; George S. T.; Radha S. EEG signal classification using LSTM and improved neural network algorithms. Soft Comput. 2020, 24, 9981–10003. 10.1007/s00500-019-04515-0. [DOI] [Google Scholar]
- Ismail Fawaz H.; Forestier G.; Weber J.; Idoumghar L.; Muller P.-A. Deep learning for time series classification: a review. Data Min. Knowl. Disc. 2019, 4, 917–963. 10.1007/s10618-019-00619-1. [DOI] [Google Scholar]
- Gupta A.; Gupta H. P.; Biswas B.; Dutta T. Approaches and applications of early classification of time series: A review. IEEE Trans. Artif. Intell. 2020, 1, 47–61. 10.1109/TAI.2020.3027279. [DOI] [Google Scholar]
- Ali M.; Alqahtani A.; Jones M. W.; Xie X. Clustering and classification for time series data in visual analytics: A survey. IEEE Access 2019, 7, 181314–181338. 10.1109/ACCESS.2019.2958551. [DOI] [Google Scholar]
- Meng T.; Jing X.; Yan Z.; Pedrycz W. A survey on machine learning for data fusion. Inf. Fusion 2020, 115–129. 10.1016/j.inffus.2019.12.001. [DOI] [Google Scholar]
- Gao J.; Li P.; Chen Z.; Zhang J. A survey on deep learning for multimodal data fusion. Neural Computation 2020, 32, 829–864. 10.1162/neco_a_01273. [DOI] [PubMed] [Google Scholar]
- Meng T.; Jing X.; Yan Z.; Pedrycz W. A survey on machine learning for data fusion. Inf. Fusion 2020, 57, 115–129. 10.1016/j.inffus.2019.12.001. [DOI] [Google Scholar]
- Krizhevsky A.; Sutskever I.; Hinton G. E. Imagenet classification with deep convolutional neural networks. Commun. ACM 2017, 60, 84–90. 10.1145/3065386. [DOI] [Google Scholar]
- Zhang J.; Lu C.; Li X.; Kim H. J.; Wang J. A full convolutional network based on DenseNet for remote sensing scene classification. Math. Biosci. Eng. 2019, 16, 3345–3367. 10.3934/mbe.2019167. [DOI] [PubMed] [Google Scholar]
- Szegedy C.; Liu W.; Jia Y.; Sermanet P.; Reed S.; Anguelov D.; Erhan D.; Vanhoucke V.; Rabinovich A.. Going deeper with convolutions; IEEE Conference on Computer Vision and Pattern Recognition (CVPR); IEEE, 2015; Vol. 7; pp 1 −9. [Google Scholar]
- He K.; Zhang X.; Ren S.; Sun J.. Deep residual learning for image recognition; IEEE Conference on Computer Vision and Pattern Recognition (CVPR); IEEE, 2016; pp 770–778. [Google Scholar]
- Deng J.; Dong W.; Socher R.; Li L. J.; Li K.; Fei-Fei L.. Imagenet: A large-scale hierarchical image database; IEEE Conference on Computer Vision and Pattern Recognition; IEEE, 2009; pp 248 −255. [Google Scholar]
Associated Data
This section collects any data citations, data availability statements, or supplementary materials included in this article.


