Abstract
Since the advent of the draft human genome sequence there has been growing interest in transcriptome analysis based on genomic data. The Gene Resource Locator (GRL) assembles gene maps that include information on gene-expression patterns, cis-elements in regulatory regions and alternatively spliced transcripts. The database was constructed using customized software, and currently contains 2.2 million alignments (exon–intron structures). The alignments have been annotated and integrated into a system that encompasses approximately 90 000 EST loci sharing common exons, 8091 alternatively spliced transcript groups, 10 801 expression-profile groups, 8066 candidate regulatory regions in full-length cDNAs, and 1 million SNP loci. We have used Flash technology to build a dynamic web viewer that facilitates browsing through the millions of alignments. All of the information is available through the World Wide Web at the Gene Resource Locator web site (http://grl.gi.k.u-tokyo.ac.jp).
INTRODUCTION
Controversy persists regarding the number of genes in the human genome (1–5). However, it appears that there are no more than 40 000 individual genes (1,2) which, surprisingly, is only double the number of genes (19,000) present in Caenorhabditis elegans. This indicates that the correlation between species complexity and gene number is not stringent and that complexity is determined by other factors, such as alternative splicing, tissue-specific expression and cis-regulatory mechanisms at the transcriptome level. Therefore, we analyzed the entire draft human genome sequence and mapped millions of expressed sequence tags (ESTs), in order to develop a novel annotation scheme for transcriptome analysis.
BEYOND THE GENE LOCUS MAP AND TOWARDS TRANSCRIPTOME ANALYSIS
Although several excellent genomic maps have been constructed, such as those at UCSC, EBI and NCBI, we adopted a different approach to transcriptome analysis that included: (i) the association of gene-expression patterns with genetic loci; (ii) the annotation of regulatory regions with putative cis-regulatory elements; and (iii) the identification of alternatively spliced variants. This strategy involved the alignment of ESTs from various sources, such as UniGene (6,7), BodyMap (8), dbSNP (9) and full-length cDNA databases (10). In general, EST alignments rely upon sets of non-redundant transcripts, such as UniGene representative sequences (6), and curated reference sequences, such as RefSeq (11), largely because current information regarding transcripts consists of anonymous and highly redundant ESTs. However, this type of analysis may discard polymorphisms and levels of complexity that involve tissue-specific gene expression and splice variants. To avoid this simplification, we first aligned all the available sequences in the UniGene human dataset (Build 141; http://www.ncbi.nlm.nih.gov/UniGene/Hs.Home.html) against the draft human genome sequences (UCSC Golden Path Aug freeze; http://genome.ucsc.edu/), and then integrated the alignments to determine the positional clustering of genes and global tissue-specificities. Complex computational obstacles had to be overcome to allow the alignment of millions of ESTs. In order to efficiently compute the alignments, we developed optimization techniques (data not shown) for accelerating dynamic programming algorithms. Thus, 3 million ESTs were aligned to a newly revised draft genome in just 1 day. Millions of EST alignments were placed in groups by iterating the process of merging two alignments sharing common exons, until no new members could be added to the groups. This clustering of genes is helpful, not only in identifying a group of ESTs coded at the same locus, but also in gathering information on alternatively spliced transcripts and in associating expression patterns with specific loci. These aspects are illustrated in the following sections.
STATISTICS
We selected alignments where: (i) the matching ratio was at least 90%; (ii) the coverage ratio was at least 50%; (iii) the exon length was at least 15 bp; and (iv) the intron length was maximally 400 000 bp. Table 1 illustrates the statistical analysis of EST alignment numbers and other relevant data. An alignment identity cutoff of 85% might be too low, as it would result in the cross-alignment of paralogous genes. On the other hand, too high an identity cutoff might discard reliable alignments that contain a few mismatches, because one-path sequencing generates 5% mismatched sequences on average. Bearing these considerations in mind, we chose a default cutoff value of 90%.
Table 1. The statistics of the numbers of EST alignments and other relevant data.
| Chromosome | Number of EST loci | Number of EST alignments | |||||||
|---|---|---|---|---|---|---|---|---|---|
| EST loci with alignments of multiple exons | EST loci | EST loci with alternative splicing patterns | EST loci with BodyMap tags | EST loci with full-length cDNAs | UniGene EST | BodyMap EST | dbSNP sequence | RefSeq gene | |
| 1 | 2619 | 8675 | 835 | 1064 | 946 | 205 756 | 1221 | 97 071 | 1230 |
| 2 | 1891 | 6965 | 536 | 712 | 627 | 141 929 | 820 | 79 948 | 721 |
| 3 | 1576 | 5892 | 440 | 617 | 456 | 116 066 | 701 | 70 696 | 623 |
| 4 | 1114 | 4351 | 289 | 504 | 333 | 87 053 | 562 | 60 820 | 415 |
| 5 | 1323 | 5006 | 344 | 575 | 398 | 120 422 | 625 | 81 987 | 597 |
| 6 | 1394 | 5231 | 462 | 639 | 361 | 131 431 | 729 | 74 426 | 734 |
| 7 | 1348 | 5306 | 411 | 504 | 367 | 117 973 | 572 | 55 939 | 550 |
| 8 | 969 | 3811 | 242 | 383 | 286 | 72 368 | 439 | 40 911 | 397 |
| 9 | 1107 | 3872 | 352 | 455 | 385 | 96 236 | 509 | 44 219 | 443 |
| 10 | 1150 | 4409 | 326 | 487 | 360 | 83 741 | 549 | 46 537 | 417 |
| 11 | 1629 | 4867 | 495 | 622 | 396 | 131 404 | 711 | 62 425 | 701 |
| 12 | 1457 | 4733 | 437 | 570 | 423 | 146 069 | 659 | 46 338 | 673 |
| 13 | 528 | 2371 | 159 | 254 | 164 | 50 584 | 293 | 42 911 | 212 |
| 14 | 900 | 2867 | 257 | 380 | 316 | 73 158 | 451 | 37 051 | 403 |
| 15 | 932 | 3266 | 249 | 360 | 300 | 81 183 | 420 | 27 855 | 347 |
| 16 | 1173 | 3377 | 342 | 430 | 363 | 75 957 | 483 | 28 655 | 466 |
| 17 | 1446 | 4191 | 459 | 545 | 376 | 112 823 | 639 | 23 594 | 728 |
| 18 | 494 | 1992 | 118 | 210 | 136 | 35 531 | 238 | 35 163 | 173 |
| 19 | 1551 | 3614 | 502 | 490 | 388 | 102 051 | 543 | 20 084 | 724 |
| 20 | 712 | 2148 | 243 | 262 | 262 | 62 297 | 319 | 24 738 | 346 |
| 21 | 340 | 1201 | 106 | 128 | 60 | 28 445 | 143 | 17 230 | 144 |
| 22 | 649 | 1837 | 226 | 230 | 141 | 50 667 | 253 | 21 682 | 335 |
| X | 926 | 2712 | 241 | 350 | 215 | 76 722 | 388 | 23 143 | 540 |
| Y | 141 | 384 | 20 | 30 | 7 | 7763 | 32 | 482 | 60 |
| Total | 27 369 | 93 078 | 8091 | 10 801 | 8066 | 2 207 629 | 12 299 | 1 063 905 | 11 979 |
TOOLS FOR GENE FUNCTION ANALYSIS
The GRL provides several tools for the functional analysis of transcriptomes.
Associations between BodyMap gene-expression patterns and alignment clusters
The correlation of expression patterns with gene clusters is a crucial step in functional analysis. To this end, we used the BodyMap gene expression database containing site-directed, 3′-ESTs. This database has been generated and maintained at Osaka University and the University of Tokyo (http://bodymap.ims.u-tokyo.ac.jp/). To date, the database contains 18 998 non-redundant representative sequences from 64 human tissues. The expression levels of representative genes in 30 distinct human tissues have been published. We aligned all of the BodyMap representative sequences to the genome sequence. Thus, alignment clusters having BodyMap alignments were labeled with the expression patterns of the BodyMap sequences; 10 801 tissue expression patterns were thereby assigned to alignment clusters (Fig. 1)
Figure 1.
The gene-expression levels in 30 distinct human tissues are incorporated into BodyMap tags.
Annotation of putative cis-regulatory elements
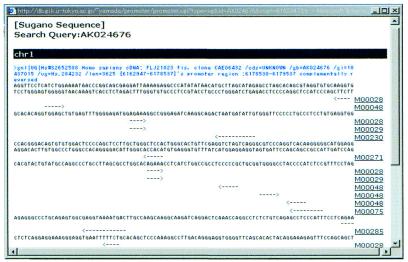
One of the first steps towards the resolution of gene transcription mechanisms is the identification of promoter regions. For this purpose, we aligned full-length enriched cDNA sequences (http://cdna.ims.u-tokyo.ac.jp) with authentic 5′-terminal start-points, and extracted 8066 upstream regions from these sequences. These upstream regions probably contain regulatory elements, such as promoters, suppressors and enhancers. We further annotated the upstream regions with candidate cis-acting elements using TRANSFAC (12). Figure 2 illustrates an example of an upstream region that has been annotated with various theoretical binding sites.
Figure 2.
Representation of candidate cis-acting elements in the upstream region of an aligned full-length cDNA that was derived from the TRANSFAC database.
Identification of alternatively spliced transcripts
A cluster of alignments containing putative alternatively spliced transcripts is shown in Figure 3. The lower alignment has six exons, but some of the other alignments do not use the third, fourth or fifth exon. It is also noteworthy that two different lengths of the third exon exist. Of the 27 369 alignment clusters with multiple exons, alternatively spliced candidates were identified in 8091 clusters and displayed graphically in the viewer.
Figure 3.
Alternatively spliced transcripts: each thick line represents the alignment of a single EST, wherein the narrow orange boxes represent exons and the blue boxes represent introns.
Data cleansing and SNP classification
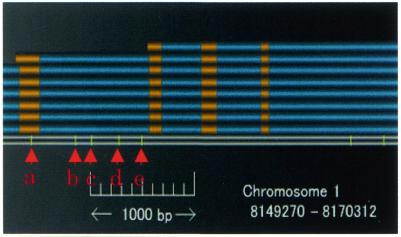
To classify SNPs according to their positional context, we aligned the sequences in the dbSNP (http://www.ncbi.nlm.nih.gov/SNP). The following criteria were used to identify SNP locations and to remove uninformative SNPs: (i) the sequence mapped to a unique location in the draft genome; (ii) the matching ratio was at least 99%; (iii) the coverage ratio was 100%; and (iv) the alignment did not contain any gaps. The matching ratio was defined as the number of nucleotides in the EST that aligned with the draft genome relative to the length of the aligned EST. The coverage ratio was defined as the number of aligned nucleotides relative to the full length of the EST. The aligned SNPs were classified as regulatory, coding or non-coding, depending on their location. For example, in Figure 4, the SNP labeled ‘a’ is a coding SNP, while the other SNPs (labeled ‘b’ to ‘e’) are non-coding SNPs.
Figure 4.
Representation of SNPs: the SNP labeled ‘a’ is a coding SNP, whereas the other SNPs (‘b’ to ‘e’) are non-coding SNPs.
Processed pseudogenes arising from retro-transposition
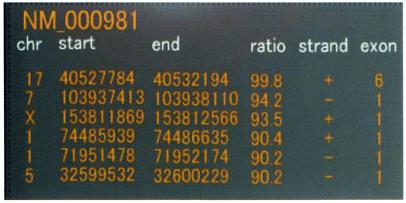
In some cases, an EST could be mapped to more than one location. In Figure 5, for instance, a RefSeq sequence was mapped to six distinct loci. One alignment, at 99.8% identity, consisted of six exons, while the others were all intronless alignments with a <95% matching ratio. The genomic sequences surrounding this type of intronless alignment with low matching ratio often reveal processed pseudogenes that have arisen from retro-transposition. Thus, information on matching ratios and the number of exons is useful for detecting potential pseudogenes.
Figure 5.
Distinct alignments of the same RefSeq sequence. Information on matching ratios and the numbers of exons is useful for detecting potential pseudogenes.
Querying the database with identifiers
The GRL accepts database queries containing accession numbers, RefSeq (11) symbol names or BodyMap GS numbers. If more than one alignment exists for the requested EST, the system displays the location, the strand, the matching ratio and the number of exons for each alignment. The user then clicks on one of the alignments to browse its structure in the structure window. The list of distinct alignments for the same EST is also helpful in elucidating the real EST gene and pseudogenes.
GRAPHICAL REPRESENTATION OF EST ALIGNMENTS
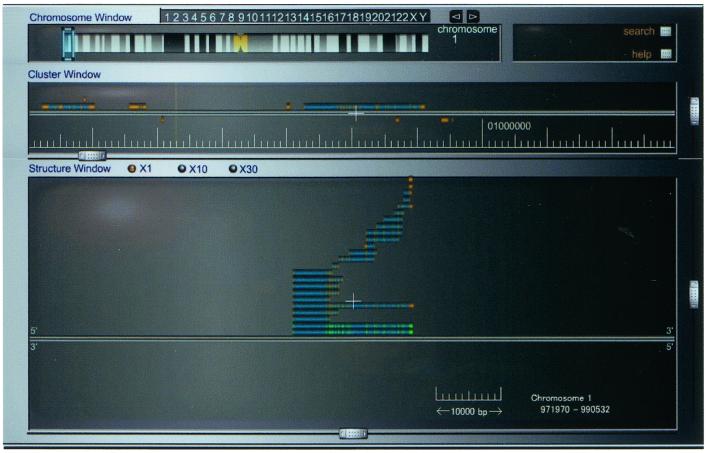
To facilitate the browsing of millions of alignments, we developed a GRL viewer with dynamic GUI. Figure 6 shows the top-level representation of the GRL viewer, which offers chromosome, cluster and structure windows. To access alignments, the chromosome number in the chromosome window is selected. Clicking the region of interest on each chromosome displays the alignment clusters in that region in the cluster window. This system is capable of representing 10 million base pairs dynamically along a genome sequence. Each cluster is represented by a sequence of orange/green boxes showing representative exon–intron structures within the cluster. Clicking on one of the clusters brings up the individual alignments in the structure window. A collection of EST alignments in the structure window and associated splice variants are shown in Figure 2; each thick line represents the alignment of one EST wherein the narrow orange boxes represent exons and the blue boxes represent introns. Exons are colored orange by default, but we have used additional colors to attract attention to special classes of ESTs. For example, full-length enriched cDNA sequences or cap-trapped 5′-ESTs, which identify promoter regions, are colored green. On the other hand, BodyMap tags, which refer to gene-expression patterns in various human tissues, are colored yellow. Clicking an alignment pops up a window showing details, such as exon location, strand orientation and matching ratio, for each alignment.
Figure 6.
The GRL front end: the viewer offers chromosome, cluster and structure windows; http://grl.gi.k.u-tokyo.ac.jp.
DYNAMIC GRAPHICAL VIEWER AND DATABASE ARCHITECTURES
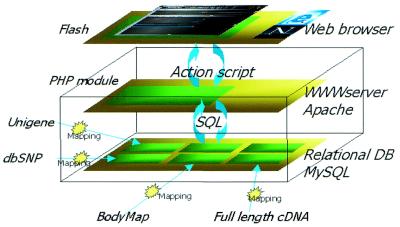
Since the GRL server offers millions of alignments, it is important to use visualization tools that work efficiently, even on low-bandwidth networks connecting World Wide Web data servers and users’ browsers. We chose Macromedia Flash, because of its widespread acceptance and the capability that it offers to design and deliver low-bandwidth dynamic representations. The viewer is implemented in ActionScript (Flash) and PHP. GRL uses a freely available relational database, MySQL, as a back-end. The dataflow diagram is shown in Figure 7. The collection of PHP scripts executes pre-defined SQL queries on the database, manipulates the data and presents it in a variety of forms. The server provides an interface that allows querying of the database, so one can look for and browse gene alignments. The Macromedia Flash software designs and delivers dynamic representations in which millions of ESTs’ locations and structures, along with a wide variety of genomic sequence annotations, can be displayed interactively. The Flash-based browser is available through the World Wide Web on the Gene Resource Locator home page (http://grl.gi.k.u-tokyo.ac.jp).
Figure 7.
Dataflow diagram for the GRL database and browser.
UPDATES AND FUTURE DIRECTIONS
Our mapping software can align millions of ESTs to a newly revised draft genome in a single day. Therefore, we will frequently update the entire database as the draft genomes are revised or EST sets (UniGene, BodyMap, Full length cDNAs) are updated. We also plan to provide analytical tools via the GRL database, not only for human genomes, but also for the genomes of experimental-model species, such as mouse and rat, thus making cross-species comparisons possible. To facilitate the further analysis of expression profiles and cis-acting elements, we are also considering the incorporation of SAGE (serial analysis of gene expression) tags and Microarray probe sequences into the GRL database. Furthermore, to aid experimentation, a computational tool for designing primers and probes will be added. These primers will be useful in studies of gene-expression patterns and in elucidating which exon combinations function in different tissues. All of these tools will be made available, via a free license, for academic and non-profit use through the GRL database.
Acknowledgments
ACKNOWLEDGEMENTS
Special thanks go to Jun Sese for help in the construction of the GRL server. We are also grateful to Prof. Kousaku Okubo at Osaka University, Prof. Sumio Sugano at IMS, University of Tokyo, James Kent at UCSC and the UniGene team at NCBI. The Gene Resource Locator is supported by grant 12208003, a Grant-in-Aid for Scientific Research on Priority Areas from the Ministry of Education, Science and Culture, Japan.
REFERENCES
- 1.International Human Genome Sequencing Consortium (2001) Initial sequencing and analysis of the human genome. Nature, 409, 860–921. [DOI] [PubMed] [Google Scholar]
- 2.Venter J.C., Adams,M.D., Myers,E.W., Li,P.W., Murai,R.J., Sutton,G.G., Smith,H.O., Yandell,M., Evans,C.A., Holt,R.A. et al. (2001) The sequence of the human genome. Science, 291, 1304–1351. [DOI] [PubMed] [Google Scholar]
- 3.Ewing B. and Green,P. (2000) Analysis of expressed sequence tags indicates 35,000 human genes. Nature Genet., 25, 232–234. [DOI] [PubMed] [Google Scholar]
- 4.Roest C.H., Jaillon,O., Bernot,A., Dasilva,C., Bouneau,L., Fischer,C., Fizames,C., Wincker,P., Brottier,P., Quetier,F., Saurin,W. and Weissenbach,J. (2000) Estimate of human gene number provided by genome-wide analysis using Tetraodon nigroviridis DNA sequence. Nature Genet., 25, 235–238. [DOI] [PubMed] [Google Scholar]
- 5.Liang F., Holt,I., Pertea,G., Karamycheva,S., Salzberg,S.L. and Quackenbush,J. (2000) Gene index analysis of the human genome estimates approximately 120,000 genes. Nature Genet., 25, 239–240. [DOI] [PubMed] [Google Scholar]
- 6.Schuler G.D. (1997) Pieces of the puzzle: expressed sequence tags and the catalog of human genes. J. Mol. Med., 75, 694–698. [DOI] [PubMed] [Google Scholar]
- 7.Wheeler D.L., Church,D.M., Lash,A.E., Leipe,D.D., Madden,T.L., Pontius,J.U., Schuler,G.D., Schriml,L.M., Tatusova,T.A., Wagner,L. and Rapp,B.A. (2001) Database resources of the National Center for Biotechnology Information. Nucleic Acids Res., 29, 11–16. Updated article in this issue: Nucleic Acids Res. (2002), 30, 13–16. [DOI] [PMC free article] [PubMed] [Google Scholar]
- 8.Sese J., Nikaidou,H., Kawamoto,S., Minesaki,Y., Morishita,S. and Okubo,K. (2001) BodyMap incorporated PCR-based expression profiling data and a gene ranking system. Nucleic Acids Res., 29, 156–158. [DOI] [PMC free article] [PubMed] [Google Scholar]
- 9.Sherry S.T., Ward,M.H., Kholodov,M., Baker,J., Phan,L., Smigielski,E.M. and Sirotkin,K. (2001) dbSNP: the NCBI database of genetic variation. Nucleic Acids Res., 29, 308–311. [DOI] [PMC free article] [PubMed] [Google Scholar]
- 10.Suzuki Y., Tsunoda,T., Sese,J., Taira,H., Mizushima-Sugano,J., Hata,H., Ota,T., Isogai,T., Tanaka,T., Nakamura,Y., Suyama,A., Sakaki,Y., Morishita,S., Okubo,K. and Sugano,S. (2001) Identification and characterization of the potential promoter regions of 1031 kinds of human genes. Genome Res., 11, 677–684. [DOI] [PMC free article] [PubMed] [Google Scholar]
- 11.Pruitt K.D. and Maglott,D.R. (2001) RefSeq and LocusLink: NCBI gene-centered resources. Nucleic Acids Res., 29, 137–140. [DOI] [PMC free article] [PubMed] [Google Scholar]
- 12.Wingender E., Chen,X., Fricke,E., Geffers,R., Hehl,R., Liebich,I., Krull,M., Matys,V., Michael,H., Ohnhauser,R., Pruss,M., Schacherer,F., Thiele,S. and Urbach,S. (2001) The TRANSFAC system on gene expression regulation. Nucleic Acids Res., 29, 281–283. [DOI] [PMC free article] [PubMed] [Google Scholar]


