

Abstract
Real-time monitoring in the tumor microenvironment provides critical insights of cancer progression and mechanistic understanding of responses to cancer treatments. However, clinical challenges and significant questions remain regarding assessment of limited clinical tissue samples, establishment of validate, controllable pre-clinical cancer models, monitoring of static versus dynamic markers, and the translation of insights gained from in vitro tumor microenvironments to systematic investigation and understanding in clinical practice. State-of-art tumor-on-a-chip strategies will be reviewed herein, and emerging real-time sensing and monitoring platforms for on-chip analysis of tumor microenvironment will also be examined. The integration of the sensors with tumor-on-a-chip platforms to provide spatiotemporal information of the tumor microenvironment and the associated challenges will be further evaluated. Though optimal integrated systems for in situ monitoring are still in evolution, great promises lie ahead that will open new paradigm for rapid, comprehensive analysis of cancer development and assist clinicians with powerful tools to guide the diagnosis, prognosis and treatment course in cancer.
Keywords: Tumor Microenvironment, tumor-on-a-chip, real-time monitoring, in situ biosensing, spatiotemporal analysis, integrated system
1. Introduction
During the initiation and progression of cancer, tumor cells trigger neighboring cellular, molecular, and physical changes and interact with ambient environment (Anderson and Simon 2020). The cellular and extracellular components surrounding tumor cells together form the so-called tumor microenvironment (TME), a complex and continuously evolving entity in promoting cancer progression (Truffi et al. 2020). The cellular components in TME consist of tumor cells and tumor stromal cells, including fibroblasts, endothelial cells, pericytes and immune cells. The non-cellular components are mainly extracellular matrix (ECM), extracellular vesicles, cell-released cytokines, and metabolic factors (Baghban et al. 2020; Labani-Motlagh et al. 2020; Milotti et al. 2020; Ribeiro Franco et al. 2020)(Figure 1). The mutual interactions between tumor cells and cellular and non-cellular components in TME compromise the tissue integrity, and facilitate carcinogenesis and tumor progression (Jahanban-Esfahlan et al. 2019; Seidi et al. 2018). Dynamic exchanges among tumor cells, reactive non-neoplastic cells, and ECM in TME play essential roles in tumorigenesis by regulating clonal evolution, cancer heterogeneity, epithelial-mesenchymal transition (EMT), migration, invasion, angiogenesis, apoptosis and drug resistance (Baghban et al. 2020; Cova et al. 2019; Li et al. 2018; Tsao et al. 2016; Ungefroren et al. 2011). Oncology studies have suggested that a comprehensive analysis of the interplays among the complex components in TME is essential to unveil the hidden mechanisms of tumor growth and metastasis and to the development of novel therapeutics to improve patient outcome (Jahanban-Esfahlan et al. 2018). The emerging cancer immunotherapies, featured as the future of cancer treatment, have showcased the latest development in deciphering the tumor immune microenvironment. However, the heterogeneous patient responses are still not well clarified (Waldman et al. 2020), highlighting the importance of systematic investigation of TME to gain mechanistic insights in tumor-immune interactions.
Figure 1. Components of the tumor microenvironment.
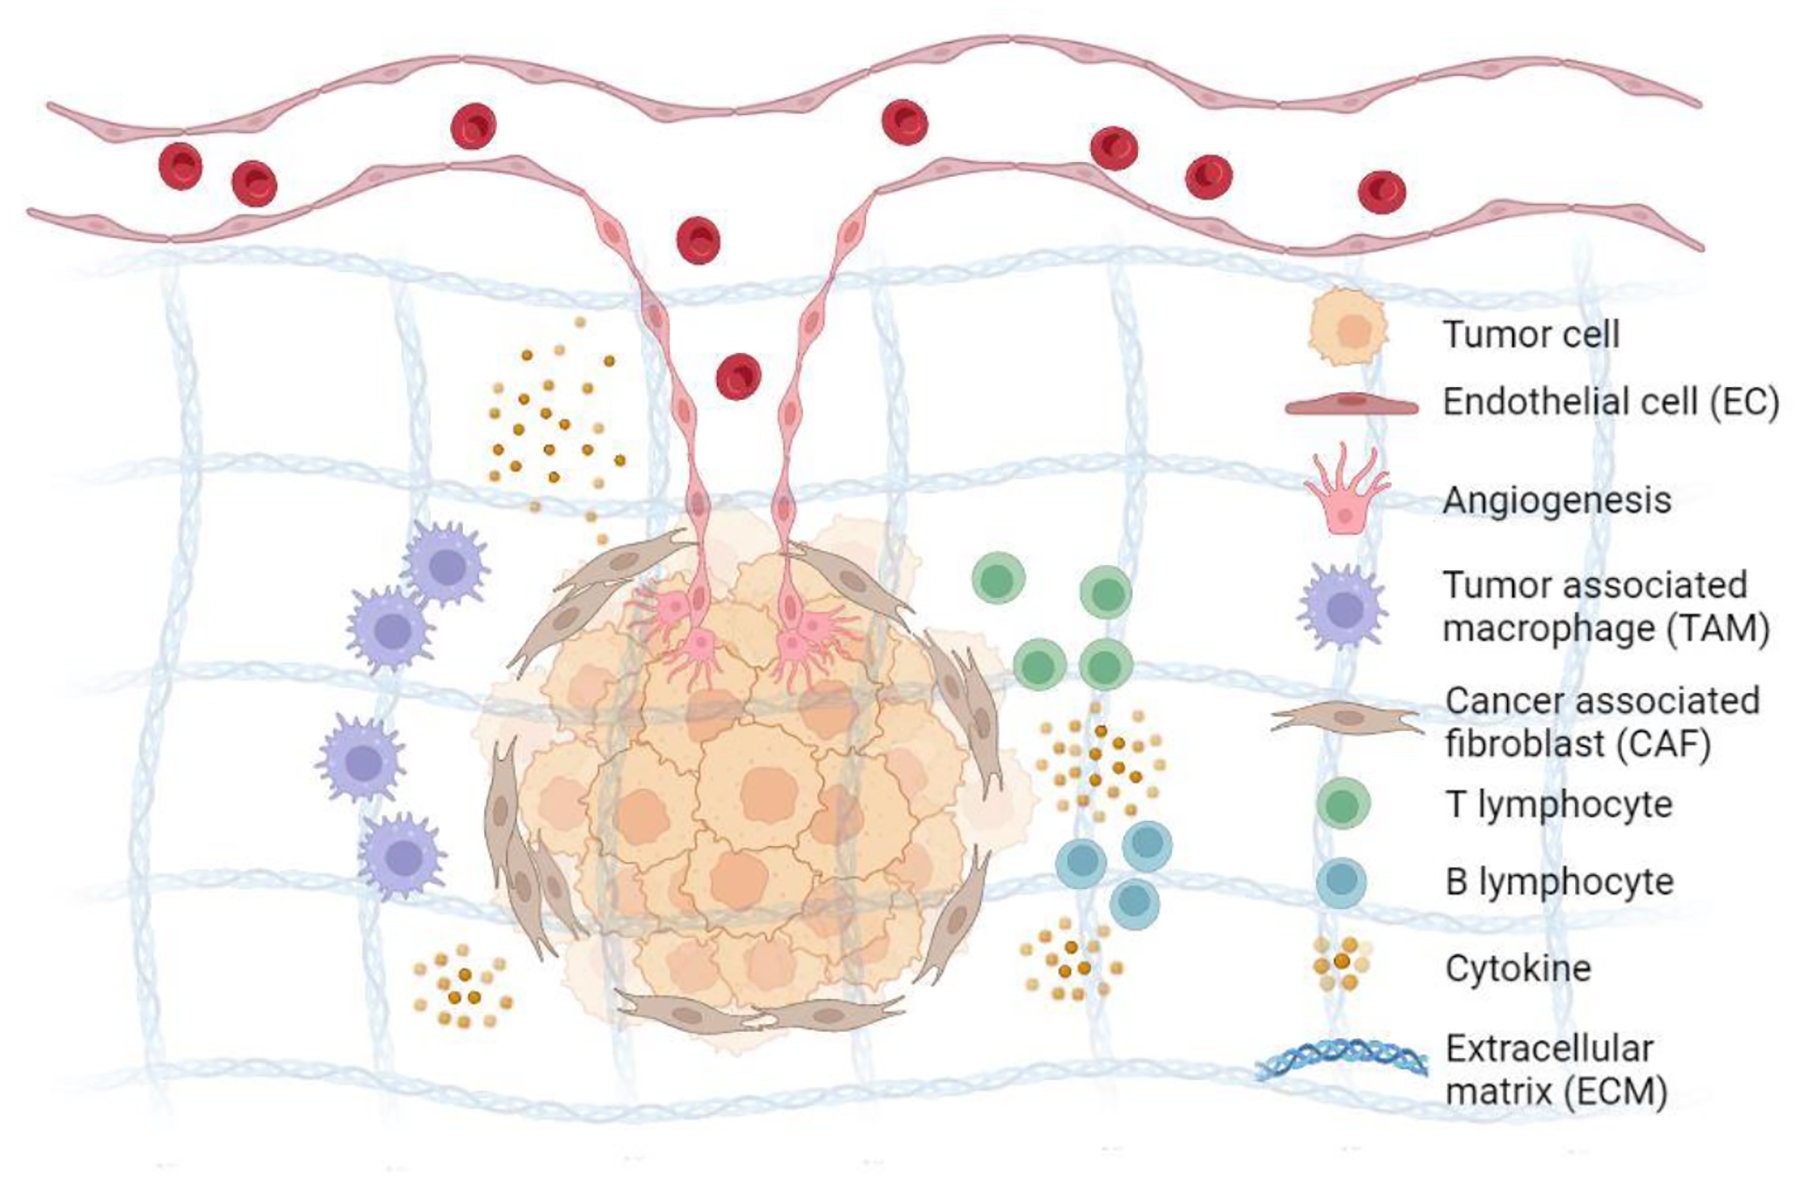
Tumor microenvironment consists of multiple cells including tumor cells, endothelial cells forming vasculature participating in angiogenesis and metastasis, cancer associated fibroblasts, tumor associated macrophages, and lymphocytes. Cytokines and chemokines released by malignant and stromal cells inhibit the function of resident immune cells, leading to the TME immunosuppression. Extracellular matrices facilitate invasion of tumor cells through matrix remodeling. Metabolic factors like pH and glucose are suppressed in tumor milieu. Lastly, hypoxia, the lack of oxygen, also plays a key role in the evolution of tumors, contributing to tumor invasion and metastasis.
Various cancer model systems have been developed for cancer research, anti-cancer drug screening, and therapeutic discoveries, such as in vitro two-dimensional (2D) or 3D cell culture and animal models using human cell lines or patient-derived xenografts (PDXs)(Ribeiro Franco et al. 2020). The immortalized cancer cell lines, characterized by low cost, high reproducibility, and ease of use, have been widely employed for drug screening and in vitro cell biology studies (Efremov et al. 2013; Ehsan et al. 2014; Fong Eliza Li et al. 2013; Sokol et al. 2016). However, the cell cultures are not ideal to study TME due to the lack of spatial architecture and arrangements, and limited capability to recapitulate the system nature of tumor (Tsai et al. 2017). The PDXs retain a more comprehensive tumor molecular profile and can produce complex cancer-stroma interactions in vivo, but the time-consuming and labor intensive generation processes and the incompatibility with human immune system have become the major obstacles for their clinical applications in cancer immunotherapies (Begley and Ellis 2012).
Recently, organ-on-a-chip (OOC), by growing microtissues inside a microfluidic chip, provides a unique opportunity to in vitro recapitulate the in vivo structures and physiological conditions of human organs, rendering them an ideal platform to offer complex model systems with better engineered microenvironments in cancer research and treatment (Leung et al. 2022; Liu et al. 2021). OOCs are mostly fabricated by soft lithography based on polydimethylsiloxane (PDMS), an elastomer with optical transparency facilitating imaging, and high biocompatibility and fabricability (Qin et al. 2010; Wang et al. 2012). During the soft lithography process, the silicon wafer is firstly coated with photoresist, then exposed to UV light under a mask and etched to generate the mold of the OOCs. PDMS will be cast and solidified on the mold, and peeled off with designed microfluidic patterns by the so-called replica molding process. Besides, inject molding is suitable for thermoplastic-based (e.g., polycarbonate (PC) and polymethylmethacrylate (PMMA)) device fabrication, exceling in mass production efficiency and meeting the need of high throughput testing (Chen et al. 2010; Galateanu et al. 2022; Ren et al. 2013). 3D printing in OOC fabrication emerges in recent years due to the features of assembly-free and rapid prototyping of complex structures with high freedom of design (Prabhakar et al. 2021). Such layer-by-layer method ensures a high spatial resolution, controllability and repeatability in TOC establishment (Bishop et al. 2017).
Leveraging the advances of OOC technique, tumor-on-a-chip (TOC) systems have emerged as a new tool for creating functional 3D in vitro human tumor models for oncology research (Caballero et al. 2017; Shang et al. 2019; Sun et al. 2019; Tsai et al. 2017). By reconstructing TME on chip with key cancer-associated cellular and non-cellular components, TOC allows in vitro studies of simulated in vivo tumor pathological processes like expansion, angiogenesis, metastasis, and tumor-stromal-immune cell interactions in the TME (Albanese et al. 2013; Wang et al. 2018). In particular, the reproduced specific traits of TME in TOC, such as the biological gradient, niche factors, dynamic cellular interactions, and 3D configurations of the tumor and stroma cells, have become critical factors to generate reliable, well-controlled preclinical models for studying tumor evolution, cancer-immune interactions, and developing novel chemo- and immune-therapies, of which conventional cell cultures or animal models are not amenable to do (Astolfi et al. 2016; Fetah et al. 2019; Han et al. 2016; Kennedy et al. 2019; Kumar and Varghese 2019; Shirure et al. 2018).
Despite the continuous development in TOC for cancer research, accurate and real-time measurements of tumor-related pathological processes in a biomimetic TME remain challenging. Particularly, quantitative and spatiotemporal analysis of various cellular and molecular markers in the TME is essential for in-depth characterization of the TME, determination of new biological mechanisms, and validation of clinical interventions. To obtain such readouts containing cellular and molecular insights of TME in TOC, various sensing and analytical technologies, such as immunofluorescence (IF), enzyme-linked immunosorbent assay (ELISA), and polymerase chain reaction (PCR), have been exploited for on-chip and off-chip analysis. Nonetheless, most of the current methods require complicated and time-consuming experimental procedures and bulky instrumentations, thus fall short to provide in situ, real-time sensing and monitoring of the rapid changing characteristics in the TME.
In this review, we discuss the status of TOC research, highlight the emerging needs for in situ monitoring in TOC, and evaluate the advanced imaging, sensing and analytical tools that could be integrated with TOCs to acquire spatiotemporal information to tightly monitor and regulate the TME. We further discuss the critical technical challenges and future direction in the development of integrated TOC technology to deepen the understanding of TME and facilitate its translational applications in cancer prevention and treatments.
2. Critical Features of TME
The main cellular components in TME include cancer associated fibroblasts (CAFs) that stimulate cancer cell invasion and proliferation (Ribeiro Franco et al. 2020), endothelial cells (ECs) that form vasculatures to promote tumor growth and metastasis (Chen et al. 2013), and immune cells like tumor associated macrophages (TAMs) that assist tumor cells escape from immune surveillance (Zhou et al. 2020). Detailed characterization of these cellular features in TME can lead to a better understanding of the pathophysiological interactions in TME, which is key to the development of novel strategies for cancer treatments (Ahn et al. 2017). For example, measuring the proliferation and viability of different types of cells can reveal the stimulation or suppression factors in TME and further evaluate their synergetic or antagonistic effects and immunocompetence. Investigations on the migration of cells offer cues of tropism and chemotaxis in the mutual interactions between tumor and neighboring cells. Besides, angiogenesis, the formation of new blood vessels from existing vasculature, is regarded as a main facilitator of nutrient supply in tumor and a major route for cancer cells to enter the circulation system (Ahn et al. 2017; Papetti and Herman 2002). Thus, the study of vascular perfusion in TME can provide valuable insights on the role of vasculature changes in tumor growth and metastasis.
Non-cellular components in the TME, including cytokines, growth factors, ligands, small RNAs, DNA, soluble factors, metabolite, and ECM, have been evidenced to direct the interactions with cellular components and play a critical role in shaping the tumor niche and promoting the tumor progression (Patel et al. 2018). For instance, the TME cytokines, especially the anti-inflammatory ones (Baldridge et al. 2011; Goldstein and Kim 1993; Grivennikov and Karin 2011), create a tumor-supportive microenvironment via inhibition of anti-tumor immunity and exerting direct tumor-promoting functions (Kartikasari et al. 2021). Thus, the analysis of cytokine components in TME can provide a better understanding of the complex, mutual, and dynamic signal network in malignant transformation (Elsawa et al. 2011). Metabolic factors in TME (i.e., nutrient deficiency, hypoxia, acidity) are another type of major contributors to the modulation of immune metabolism and reprogramming of immune cells towards pro- or anti-inflammatory phenotypes (El Sayed et al. 2021). In addition, the ECM surrounding the cancer cells serves as a structural and biochemical support and regulates cell-cell or cell-matrix cross-talks (Brassart-Pasco et al. 2020). In TME, ECM differs significantly from that in normal niches, which is strongly associated with intra-tumoral signaling, transport mechanisms, metabolisms, oxygenation, and immunogenicity. With such effects, ECM exerts great influences on the malignancy and growth of tumor as well as its response to treatments (Henke et al. 2020). The following sections present a brief introduction of current methods to characterize these cellular and non-cellular components of TME on TOC.
3. Modeling TME with TOC
Generally, TOC allows for the recreation of various cellular and non-cellular TME features such as multicellular interactions, ECM-based biochemical properties, biophysical cues like hypoxia and their gradients (Ando et al. 2017; Apoorva et al. 2018). Tumors, together with vasculatures, and stromal and immune cells, could grow on a chip with a complex tissue structure either self-organized or spatially organized by design, mimicking the in vivo counterparts (Figure 2A), outperforming 2D models and 3D tumor spheroids/organoids models in complexity, physiological relevance, repeatability or controllability (Choi et al. 2015; Jeong et al. 2016; Tsai et al. 2017). Vasculature, a key feature in TME affecting tumor progression and metastasis but mostly lacking in 2D culture and 3D spheroids/organoids, can be well maintained in TOC to achieve a high degree of biomimicry to human body. Specifically, a vascularized TOC can recapitulate the perfusable tumor vascular network, mimicking cellular and biochemical transport and drug delivery (Hu et al. 2022; Jeon Jessie et al. 2015; Kameda et al. 2022; Kim et al. 2013; Nashimoto et al. 2017; Nashimoto et al. 2020; Zhang et al. 2021). Although endothelial cells have been mixed in 3D tumor spheroids, such co-culture strategy cannot faithfully model the vascular network in vitro because the grown structures are not perfusable (Ehsan et al. 2014; Shoval et al. 2017). By loading the tumor spheroid in the center of the microfluidic device and vascularizing it with angiogenetic sprouts from neighboring microfluidic channels, a TOC platform established a perfusable vascular network enabling the transport of nutrition, oxygen and drugs and evaluation of tumor activities with intraluminal flow (Figure 2B)(Nashimoto et al. 2020). Drug administration under perfusion condition was conducted and showed findings cannot be reflected by traditional static culturing condition, making the TOC a promising platform for drug screening.
Figure 2. Modeling TME on tumor-on-a-chip with multiple components.
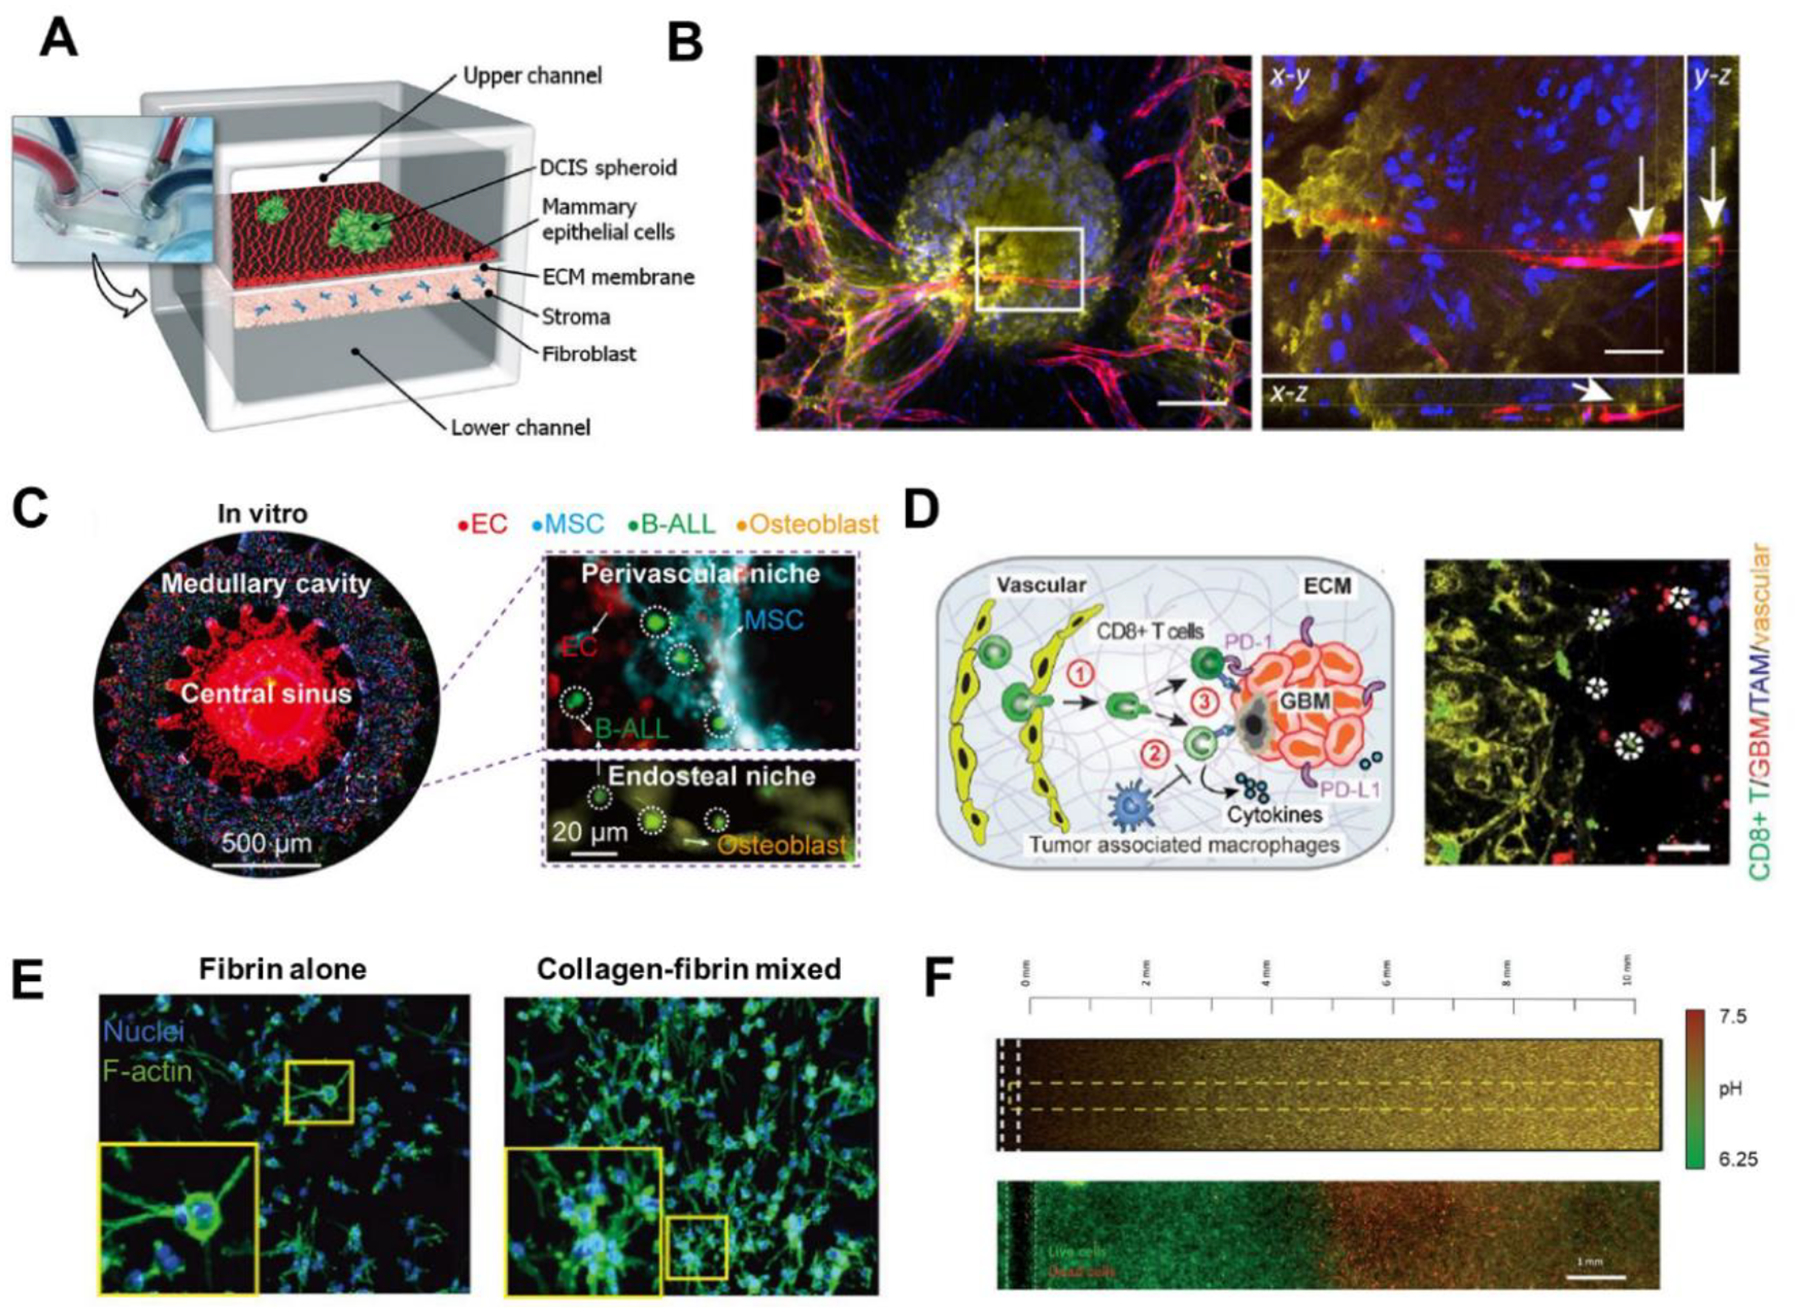
(A) A human breast-cancer-on-a-chip replicating the microarchitecture of breast ductal carcinoma with integration of tumor spheroids, mammary ductal epithelial cells, and mammary fibroblasts. Adapted with permission. Copyright 2015, the Royal Society of Chemistry. (Choi et al. 2015). (B) Immunofluorescence images of the tumor spheroid integrated with the blood vessels on a vascularized TOC. Lumen structure of vasculatures was observed, indicating the perfusability of vascular network. Adapted with permission. Copyright 2020, Elsevier. (Nashimoto et al. 2020). (C) Whole scan of the leukemic BM niche system. Compartments on chip resembled the in vivo counterparts like central sinus and medullary cavity with niche cells. Adapted under the terms of the CC-BY-NC license. Copyright 2020, the Authors. (Ma et al. 2020) (D) Immunosuppressive TME on GBM-on-a-chip. The reconstituted GBM TME recapitulated the infiltration of T cells and interactions among T cells, TAMs, and GBM tumor cells. Adapted under the terms of the CC-BY license. Copyright 2020, the Authors. (Cui et al. 2020) (E) Various components of ECM loaded on TOC revealed the distinct phenotypic changes of cancer cells in response to different ECM conditions. Adapted with permission. Copyright 2017, Wiley. (Chung et al. 2017). (F) pH gradient and necrotic region were formed on TOC under metabolic starvation gradients. Adapted with permission. Copyright 2019, the Royal Society of Chemistry. (Ayuso et al. 2019).
Apart from vascular networks, complex interactions of stromal and immune cells with tumor cells in TME can be studies using the biomimicking co-culture system of TOC as well (Aref et al. 2018; Bersini et al. 2014; Businaro et al. 2013; Chen Michelle et al. 2018; Cui et al. 2020; Cui et al. 2018; Hsu et al. 2012; Jeon Jessie et al. 2015; Ma et al. 2020; Mattei et al. 2014; Menon et al. 2014; Moore et al. 2018; Nguyen et al. 2018; Sung et al. 2011; Zheng et al. 2016). Conventional 2D and 3D models are oversimplified thus cannot reconstitute the in vivo architecture and corresponding niche containing stromal and immune cells. Ma et al. designed a TOC mimicking bone marrow structure with central sinus, medullar cavity and endosteal space (Figure 2C)(Ma et al. 2020). By introducing essential niche cells of bone marrow like bone marrow stem cells, osteoblasts, and bone marrow mononuclear cells on a microfluidic chip, they integrated key features replicating in vivo BM tissue and compared the TOC TME with the in vivo counterparts. Besides, the proposed TOC enabled dynamically monitoring of leukemic cells and BM niche interactions and TME evolution, which cannot be achieved by animal models. By applying niche-cotargeting treatments on chip, the TOC showed great potential to be translated as a preclinical model for patient-specific therapy-screening. In a separate study, Cui et al. recapitulated the immunosuppressive TAMs, CD8+ T cells, and brain tissue-mimicking hydrogel in a glioblastoma (GBM)-on-a-Chip TME model (Figure 2D)(Cui et al. 2020). To bridge the gap between the preclinical findings in animal models/patient explant models and clinical results based on patients, the designed TOC created a humanized TME by adopting patient-derived samples of different GBM subtypes with higher biological relevance to human bodies. The chip achieved spatiotemporal resolution analysis of TME with recording the migration trajectories of infiltrated CD8+ T on chip. By investigating the heterogeneous responses to anti-PD-1 therapy across different GBM subtypes and screening novel combinational immunotherapy with co-targeting TAMs, the TOC demonstrated the ability in predicting immunotherapy efficacy and facilitating precision immune-oncology as a high-throughput low-cost method.
ECM, another essential component in TME, affects the growth and malignancy of tumor and its response to therapies (Henke et al. 2020). By including ECM components in TOC, a 3D structural framework for cell growth with mechanical context and dimensionality can be achieved in vitro (Anguiano et al. 2017; Carvalho et al. 2019; Chung et al. 2017; Del Piccolo et al. 2021; Huang et al. 2009; Kwak et al. 2014; Shin et al. 2014; Sung et al. 2011; Young 2013). In a microfluidic platform, by co-culturing cancer cells and fibroblasts in components-varied ECM, the growth and invasion of tumor cells of different types were characterized (Figure 2E)(Chung et al. 2017). Due to the structural complexity and modular design of the TOC, the platform showed higher controllability and repeatability and enabled a more comprehensive study of the crosstalk between different kinds of ECM and tumor cells than 2D, 3D or animal models. It was found that, compared to fibrin alone, ovarian cancer cells exhibited larger cytoplasmic volume and more clustered nuclei when cultured in collagen-fibrin mixed ECM, highlighting the role of ECM composition, concentration, and stiffness in tumor cells proliferation and revealing the advantages of TOC in combining different TME components to study their interactions.
The heterogeneity of metabolic factors like oxygen, nutrient, pH, growth factors and cell viability gradients altered the progression of tumor and drug resistance, especially in solid tumors (Bader et al. 2020; Shi et al. 2020). Due to the high amenability and flexibility, TOCs have been designed to generate these TME cues, mimicking the in vivo tumor metabolism (Albanese et al. 2013; Ayuso et al. 2020; Ayuso et al. 2019; Bhattacharya et al. 2020; DelNero et al. 2015; Menon et al. 2014; Palacio-Castañeda et al. 2020; Song et al. 2018; Weltin et al. 2014). Current widely applied 3D spheroids to reconstitute the metabolic milieu in vitro are oversized for imaging and not ideal to study factors of interest individually. By loading tumor cells in the center chamber and using a lumen on the flank of the chamber as blood vessels for medium perfusion, a microfluidic tumor slice model created the gradients of viability, proliferation, and pH in three different cell populations (proliferating, stationary, and dead cells) along the chip (Figure 2F)(Ayuso et al. 2019). The established controllable TME can be characterized by on chip imaging, decoupled from other unconcerned factors, and disassembled to retrieve cells for downstream analysis, which cannot be afforded by multicellular tumor spheroid models.
4. Current Methods to Analyze TME on TOC
Based on the unique features presented by the TME and the various TOC models been developed, we summarized the current methods that have been applied for TME analysis in three main categories: fluorescence-based methods for visualizing cellular components and ECM in TME, ELISA-based assays for molecular analysis, and gene expression analysis with RT-PCR and single-cell RNA sequencing (scRNA-seq) techniques.
4.1. Fluorescence-based methods
Fluorescence labelling has been the most used approach for identification of specific biomolecule markers and visualization of molecular and cellular features and biological processes in TME. For example, in an in-vitro cancer model for simulating the recruitment of pericytes to angiogenetic sprouts, cells were stained and the fluorescent signals showed the attachment of pericytes to the endothelial-derived collagen IV with stretched morphology (Figure 3A)(Kim et al. 2013). Cell-labeling regents turned highly fluorescent in a reducing environment for viable cells, allowing qualitative analysis of cell proliferation in the TME (Menon et al. 2014). The quantification of cells can also be achieved by double-stranded DNA (dsDNA) fluorescent stain (Lai et al. 2020). Cell staining to differentiate live and dead cells has been widely used to characterize the cell viability on-chip, exemplified by the quantification of anti-PD-1 antibody treatment effect to determine the CD8 T-cell-mediated tumor cell cytotoxicity (Figure 3B)(Aref et al. 2018), and the induced apoptosis of target GBM cells treated with combined immunotherapies (Figure 3C)(Cui et al. 2020). Fluorescent proteins, due to their excellent biocompatibility, have been utilized to monitor cell migration by transfection of target cells without compromising the cell viability and function. Breast cancer cells labeled with green fluorescent protein (GFP) were cultured on a microfluidic device to visualize the cell migration during tumor growth (Figure 3D)(Mi et al. 2016). By tagging cocultured tumor cells and endothelial cells with different fluorescent dyes, the trans-endothelial invasion of tumor under the stimulation of chemokine in TME was observed in vitro (Figure 3E)(Zhang et al. 2012). In another microfluidic tumor-vascular model, fluorescent dextran was applied to measure the diffusive permeability of the vascular networks to study the cancer cell invasion and intravasation. The vascular networks were observed to be more permeable than normal vessel in the presence of tumor cells (Figure 3F)(Nagaraju et al. 2018).
Figure 3. Fluorescence-based methods.
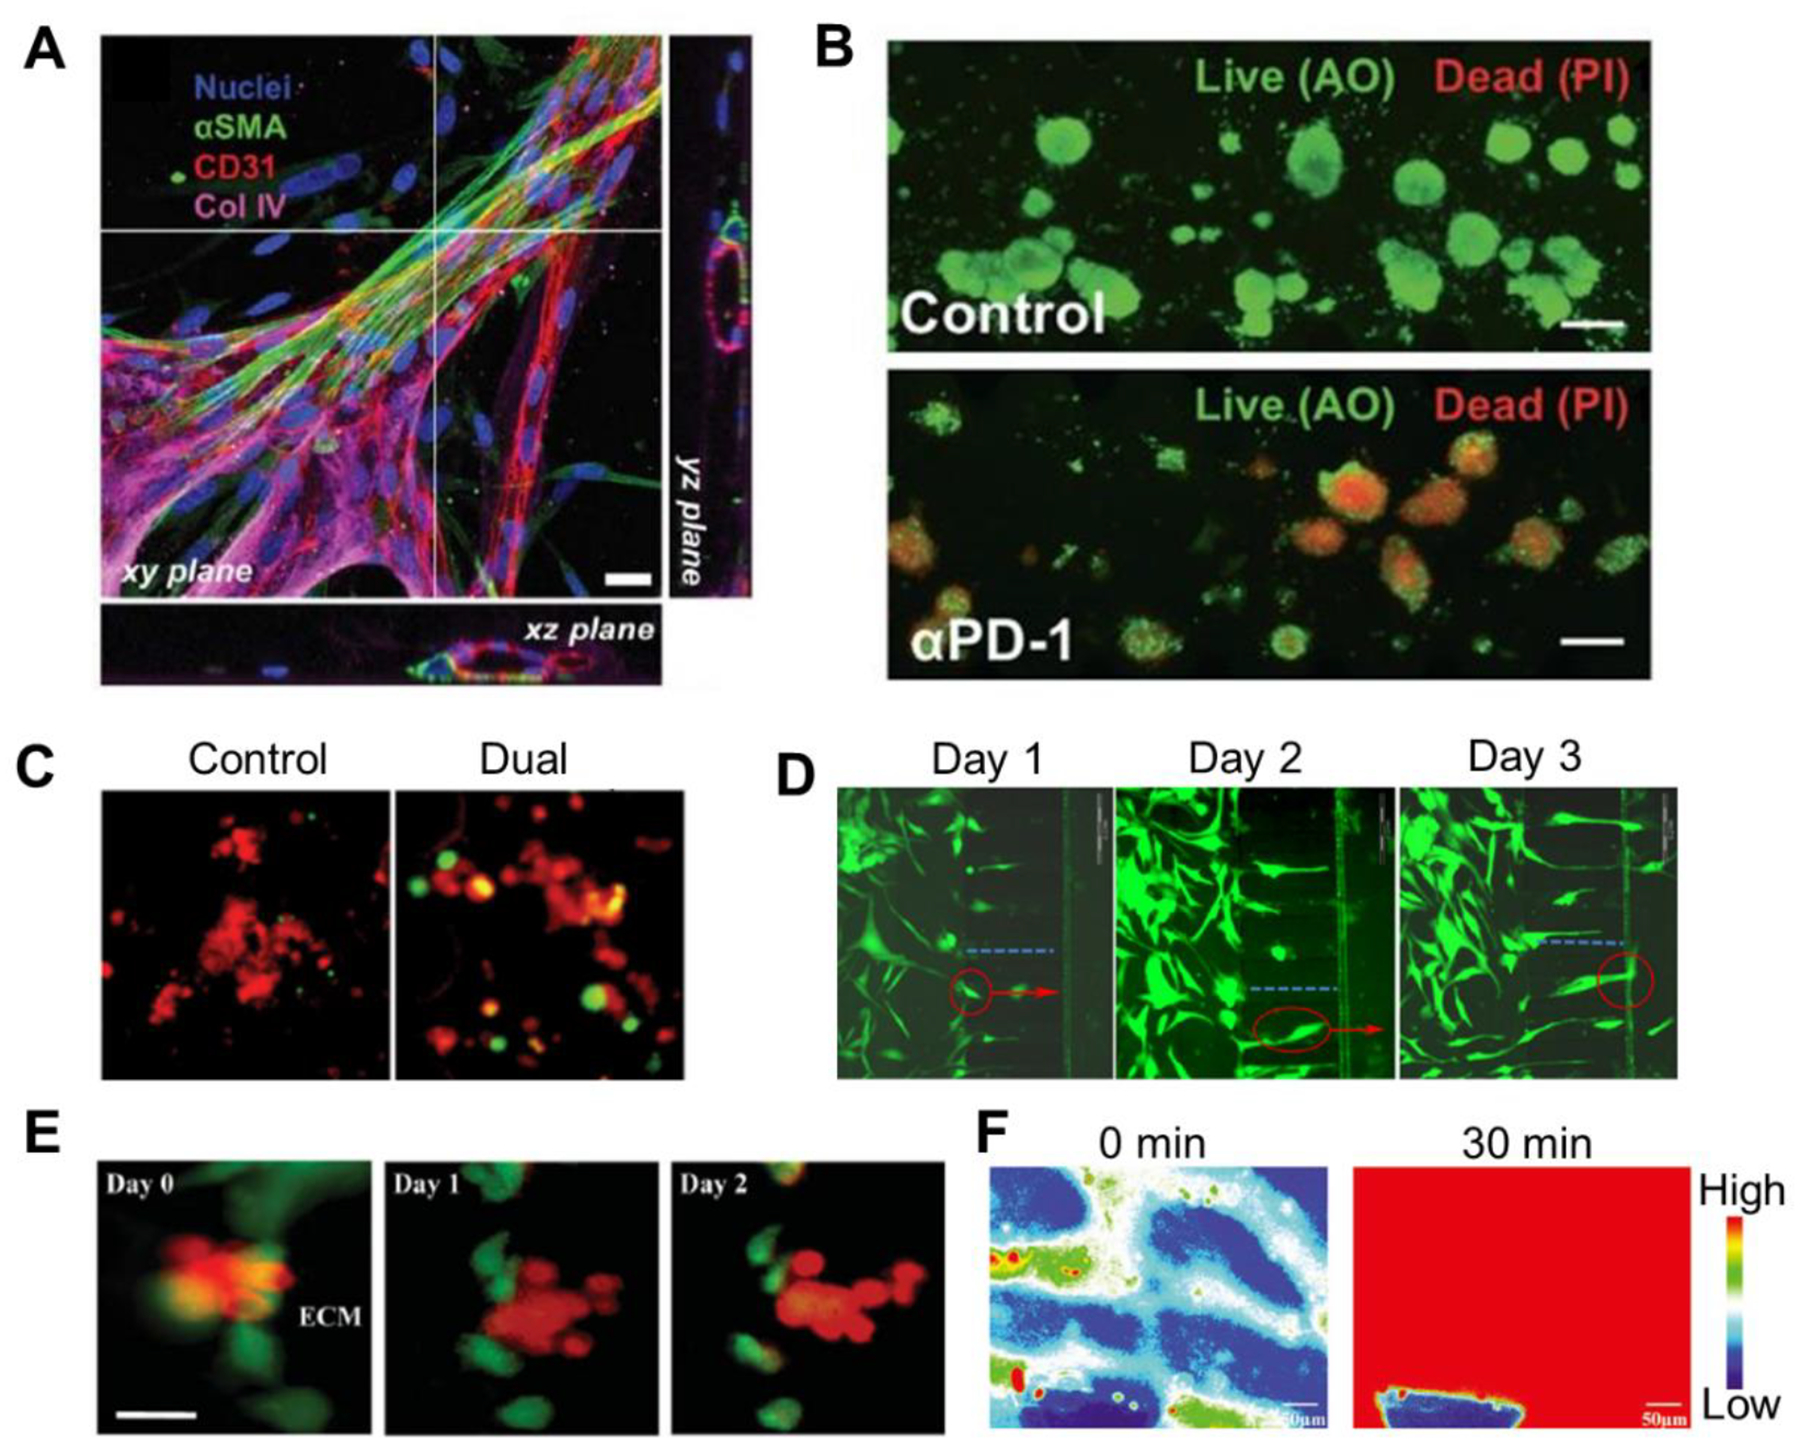
(A) Immunostaining image of a pericyte-decorated blood vessel: microvascular network (CD31, red) covered with pericytes (a-SMA, green) Adapted with permission. Copyright 2013, the Royal Society of Chemistry. (Kim et al. 2013) (B) Live/Dead imaging of organotypic tumor spheroids with acridine orange (AO) and propidium iodide (PI) labelling. Adapted with permission. Copyright 2018, the Royal Society of Chemistry. (Aref et al. 2018) (C) Increased apoptosis of tumor cells when receiving combinational immunotherapy was shown by caspase-3/7 activation. Adapted under the terms of the CC-BY license. Copyright 2020, the Authors. (Cui et al. 2020). (D) Temporal images of GFP-labeled cancer cell migration, where red circle indicated the same cancer cell in different time points. Adapted under the terms of the CC-BY license. Copyright 2016, the Authors. (Mi et al. 2016) (E) Transendothelial invasion of tumor aggregates induced by CXCL12, where cancer cells were labeled with CellTracker Red (red) and endothelial cells were labeled with CellTracker Green (green). Adapted with permission. Copyright 2012, the Royal Society of Chemistry. (Zhang et al. 2012). (F) Heat map of fluorescence intensity denotes diffusion of FITC-dextran from a more permeable vascular network due to the presence of tumor cells. Adapted with permission. Copyright 2018, Wiley. (Nagaraju et al. 2018).
Apart from cellular components, ECM like laminin, fibronectin, collagen and hyaluronic acid can be fixed with immunofluorescent dyes to provide molecular insights about the compositions (Cui et al. 2020). To measure the robustness and stiffness of ECM under shear stress, fluorescent beads have been applied in a tri-layer hydrogel system to determine whether the interlayer structures were differentially compressed at varied flow rates (Aung et al. 2016). Besides, reactive oxygen species (ROS), an important metabolic factor in cell signaling and homeostasis, was measured by an oxidative stress indicator in a microfluidic co-culture system to monitor the tumor-stromal interactions (Menon et al. 2014). The labeling reagent diffused into the cells and the oxidation resulted in a fluorescent adduct trapped inside the cell.
4.2. ELISA-based methods
In TOC studies, the “gold standard” method to quantify the secretory proteins (i.e., cytokines) is ELISA: the detected ligand is against the specific antibody linked to an enzyme which produces signals in substrate-enzyme reactions (Figure 4A)(Zhang et al. 2014). Such assay can be transformed to other sandwich-based sensing platforms based on the signal transduction mechanisms, including color change, bioluminescence, chemiluminescence, electrochemiluminescence, etc. Advances in membrane-, microbeads-, and microarray-based technologies have created new tools that further allows high-throughput, multiplex detection in these assays. For instance, ELISA was applied to determine the amount of TGF-β1 in the conditioned media of a lung cancer-on-a-chip, and to confirm its functional roles in the interactions between cancer cells and fibroblasts (Hsu et al. 2011). Massive parallel analysis of ten angiogenesis-related cytokines were achieved by a microarray based immunoassay for identification of signaling molecules in tumor-vascular microenvironment (Figure 4B)(Nagaraju et al. 2018). Bioluminescence complementation provides a facile approach to validate and quantify the protein-protein interactions (Luker and Luker 2011). To investigate chemokine (different isoforms of CXCL12) guided migration of cancer cells and the role of CXCR7 in the migration of CXCR4, CXCL12-isoforms to Gaussia luciferase and luciferase complementation between CXCR4 or CXCR7 and β-arrestin 2 were exploited (Cavnar et al. 2014). By replacing the enzyme tag with chemiluminescence or electrochemiluminescent labels, sandwich-based immunoassays were employed for on-chip membrane-based proteomic analysis and cytokine detection in TMEs (Figure 4C, 4D)(Hassell et al. 2017; Lee et al. 2018a; Zhao et al. 2020a). Recently, microbeads-based sandwich immunoassays have emerged as a highly multiplex detection platform that can conduct up to 100 types of protein analysis simultaneously (Figure 4E)(Khalifian et al. 2015). Based on this method, time-lapse cytokine profiling was performed in a 3D microfluidic platform modelling immune checkpoint treatment with only a small volume of conditioned media, demonstrating the evident evolution of cytokine and growth factor secretion under different treatments over time (Figure 4F)(Aref et al. 2018).
Figure 4. ELISA-based analysis.
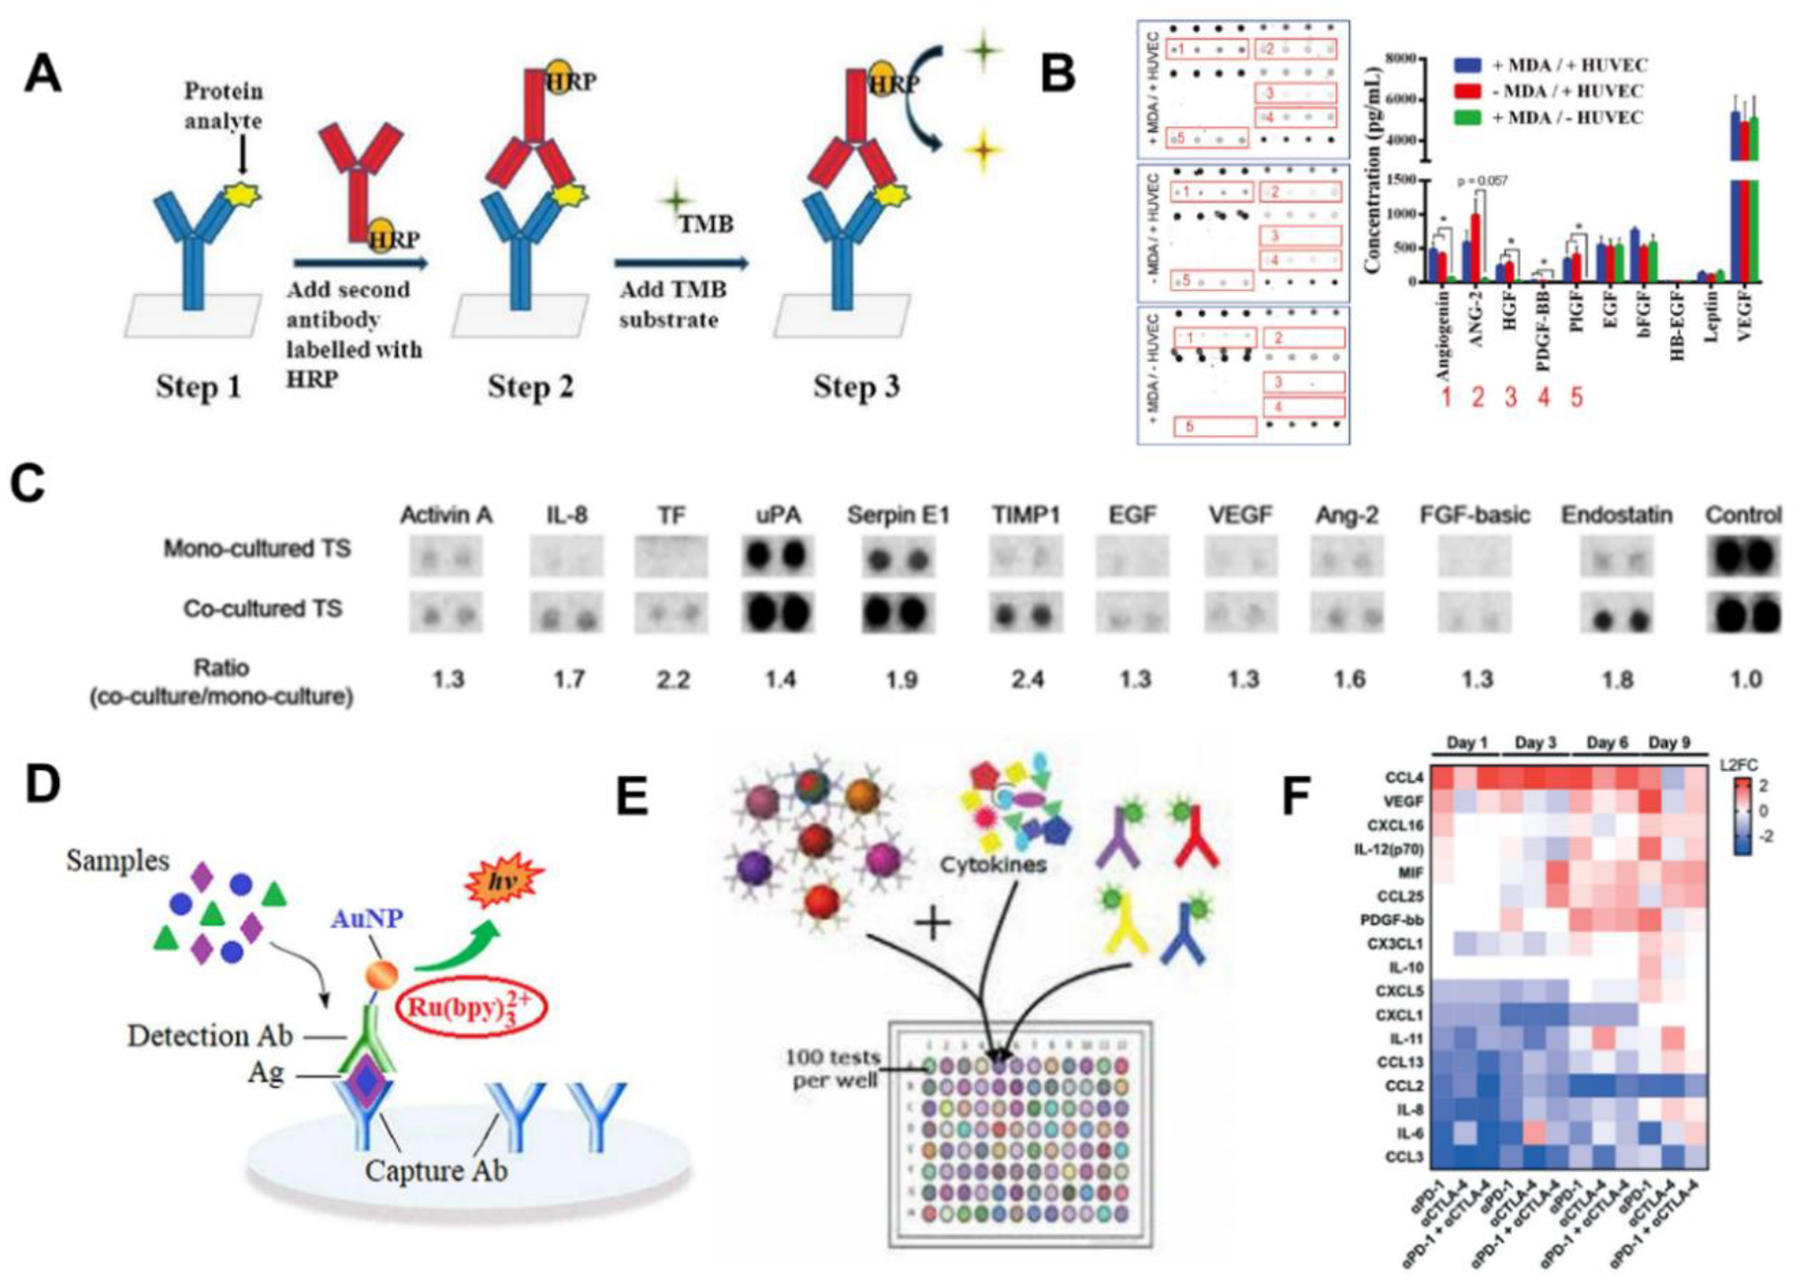
(A) Concepts of ELISA. Adapted with permission. Copyright 2014, the Royal Society of Chemistry. (Zhang et al. 2014) (B) Profiling ten angiogenesis-related cytokines in the tumor-vascular TME on chip with multiplex ELISA. Adapted with permission. Copyright 2018, Wiley. (Nagaraju et al. 2018) (C) Chemiluminescence-based proteome array analysis of angiogenesis and metastasis-related cytokines in tumor spheroids-stellate cells co-culture system. 11 factors among 55 tested cytokines showed significant statistic differences. Adapted under the terms of the CC-BY license. Copyright 2018, the Authors. (Lee et al. 2018a) (D) Concepts of a sandwich-based ECLIA using gold nanoparticles as both label and co-reactant. Adapted with permission. Copyright 2020, Elsevier. (Zhao et al. 2020a) (E) Principle of microbead-based sandwich immunoassay. Plastic beads with red and infrared fluorescent dyes provide unique signatures to samples while the detection antibodies conjugated with a reporter dye are added to measure cytokines. Adapted with permission. Copyright 2015, Elsevier. (Khalifian et al. 2015). (F) Time-lapse heatmap of secretory cytokines under different immune checkpoint blockade treatments from tumor spheroids on a chip measured by bead-based immunoassay. Adapted with permission. Copyright 2018, the Royal Society of Chemistry. (Aref et al. 2018).
4.3. Gene expression analysis
Gene expression analysis provides genetic details and transcriptomic signals of the functional RNA species or protein products as key molecular classifiers in TME. Currently, the most widely applied techniques are PCR, expression microarrays, and RNA-seq (Segundo-Val and Sanz-Lozano 2016).
Real-time PCR (RT-PCR) has been broadly accepted as a general approach for gene quantitation as well as protein expression analysis due to its large dynamic range, tremendous sensitivity, high sequence-specificity, little post-amplification processing, and amenability to increasing sample throughput (Wong and Medrano 2005). In a 3D microfluidic tumor vascular model, RT-PCR was applied on the expression levels of target genes in cancer cells during co-culture or mono-culture to determine the effect of wall shear stress upon exposure to endothelial cells (Buchanan et al. 2014). With microarray assay, thousands of genes from a sample can be detected simultaneously and have been applied to study tumor cell hypoxia response for cancer classification (DelNero et al. 2015). Single cell mRNA sequencing (scRNA-seq) technology examines the genetic information of individual cells with optimized next-generation sequencing (NGS) technologies, which can identify and characterize cellular compositions and provide a better understanding of individual cell function in the context of its microenvironment (Eberwine et al. 2014). A leukemia-on-a-chip study comparatively mapped the B-ALL subtype-specific niche signals utilizing scRNA-seq and validated that the niche-enhanced downstream signaling and cellular quiescence in B-ALL blasts could promote chemotherapy resistance (Ma et al. 2020).
4.4. Other analysis methods
Phase-contrast microscope can produce high contrast images of transparent biological samples, rending it an ideal technique for on-chip cell observation. The angiogenic sprouting morphogenesis of endothelial cells towards leukemia cells were observed with phase-contrast microscope (Figure 5A)(Zheng et al. 2016), in which the small differences in thickness and refractive index of the cells would induce phase changes of light and could be easily traced by the brightness change via transformation of phase condenser and phase retardation plate. Second-harmonic generation (SHG) microscopy is highly sensitive to the collagen fibril/fiber structure and diseases-related conditions like cancer, fibrosis and connective tissue disorders, and has thus emerged as a powerful tool for imaging fibrillar collagen in ECM (Chen et al. 2012). In a 3D multicellular co-culture microfluidic platform, two different adjoined collagen gels were observed with SHG, revealing that an acellular gel remained intact while a gel channel containing cancer cells displayed empty areas devoid of collagen fibrils, demonstrating that cancer cells can remodel ECM by proteolysis and tractional stress (Figure 5B)(Huang et al. 2009). Atomic force microscope (AFM) was implemented to measure the tissue elasticity on chip under conditions of tumor organoids culturing with or without fibroblasts (Lai et al. 2020). Each AFM indentation measurement was performed using a custom spherio-conical tip with a polystyrene bead to cantilevers, indicating organoids-fibroblasts crosstalk increases tissue elasticity. To detect metabolic factors, a microfluidics based-multiparametric microphysiometry system was developed by integrating oxygen or pH sensors upstream in the inlet channel, inside the cell cultivation area, and downstream in the outlet channel. To measure nutrition factor like glucose or lactate, the analytes reacted with O2 and the produced electrons were detected on-chip based on amperometric measurements (Figure 5C)(Weltin et al. 2014).
Figure 5. Other current analysis methods.
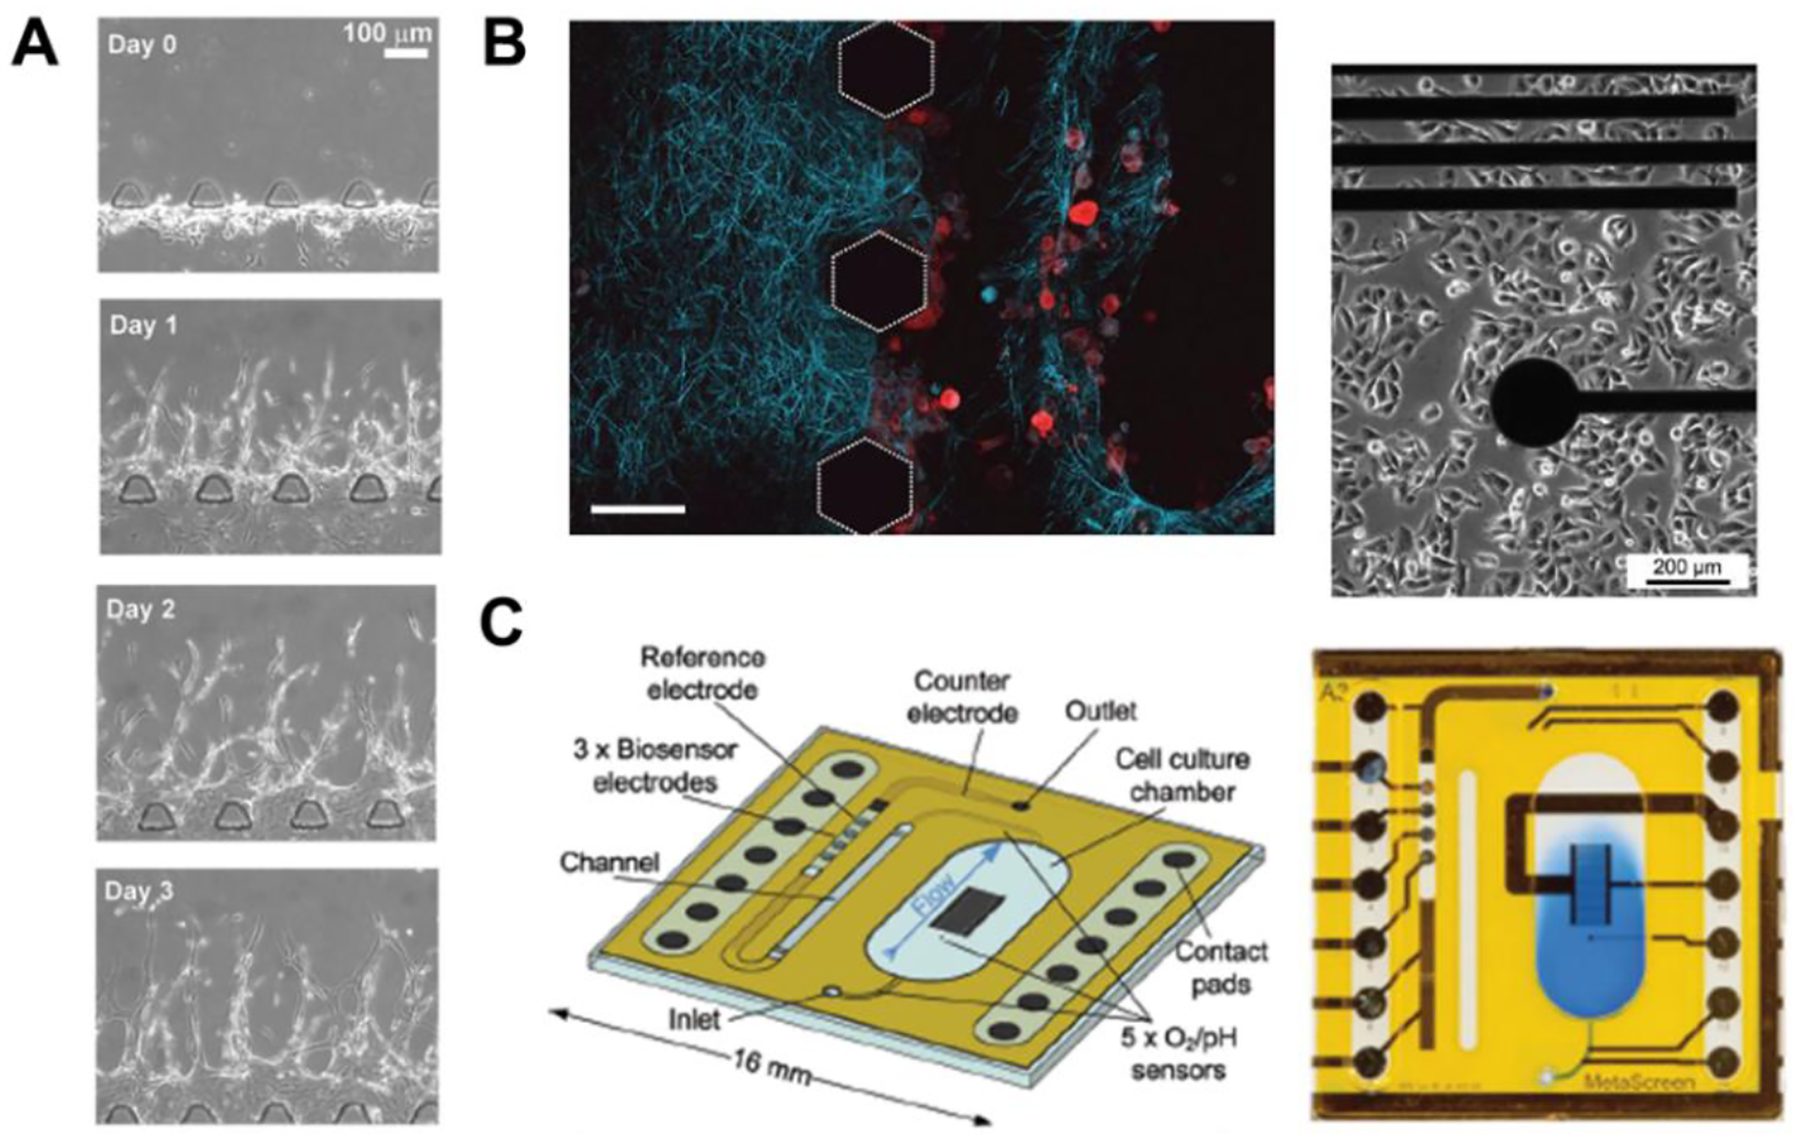
(A) Phase contrast microphotographs of migration of endothelial cells towards leukemia cells over time on a biomimetic angiogenesis chip. Adapted with permission. Copyright 2017, Wiley. (Zheng et al. 2016) (B) The degradation of collagen fibrils (in blue) caused by the migration of breast cancer cells (in red) was imaged via SHG within a microfluidic device. Adapted with permission. Copyright 2009, the Royal Society of Chemistry. (Huang et al. 2009). (C) Metabolic factors sensing chip by integrating O2, pH, glucose and lactate biosensors in one microfluidic device. Adapted with permission. Copyright 2014, the Royal Society of Chemistry. (Weltin et al. 2014)
4.5. Limitations of current measuring methods
Based on the above discussions, we summarized current measuring technologies that have been utilized in investigating TME on TOC and categorized them based on different key components (stromal cells, vasculatures, immune cells, non-cellular components) studied in TME (Table 1).
Table 1.
Measuring assays applied in TME studies on TOC.
| TME components | Specific types | Cancers | Measuring assays | References |
|---|---|---|---|---|
| Stromal cells | CAFs | Salivary gland adenoid cystic carcinoma | Immunofluorescence, CCD camera | (Liu et al. 2010) |
| CAFs | Lung adenocarcinoma | Inverted microscope; immunofluorescence; ELISA | (Hsu et al. 2011) | |
| CAFs | Colorectal carcinoma | Immunofluorescence; proteome array analysis | (Jeong et al. 2016) | |
| CAFs | Pancreatic ductal adenocarcinoma | Fluorescent dye; immunofluorescence; live/dead staining; chemiluminescence-based human proteome array analysis | (Lee et al. 2018a) | |
| CAFs | Breast cancer | Phase-contrast image; fluorescent dye; immunofluorescence | (Truong et al. 2016) | |
| CAFs | Breast cancer | Fluorescent dye, apoptosis: Cell-event, fluorescence-based live apoptosis and nuclei stain, flow cytometry | (Nguyen et al. 2018) | |
| CAFs | Pancreatic ductal adenocarcinoma | Luminesce; Immunofluorescence; TPF; AFM; Multiplex ELISA assay; fluorescent nucleic acid stain, fluorescent dye | (Lai et al. 2020) | |
| Human mammary fibroblasts | Mammary | Immunofluorescence; signal harmonic generation (SHG) | (Sung et al. 2011) | |
| Bone marrow stromal cells | Liver tumor | Immunofluorescence; absorbance | (Menon et al. 2014) | |
| Osteo-differentiated human bone marrow-derived mesenchymal stem cells (OD hBM-MSCs) | Breast cancer | Immunofluorescence | (Bersini et al. 2014) | |
| OD hBM-MSCs, human bone marrow-derived mesenchymal stem cells (hBM-MSCs), | Breast cancer | Immunofluorescence | (Jeon Jessie et al. 2015) | |
| MSCs, osteoblasts | Leukemia | Fluorescent protein; chemiluminescence-based ELISA kit, WB; immunofluorescence; live/dead stain; scRNA-sq | (Ma et al. 2020) | |
| Vasculatures | ECs | Breast cancer | Brightfield images; fluorescent dextran; immunofluorescence; fluorescent beads; intrinsic fluorescence of drugs | (Aung et al. 2016) |
| ECs | Breast cancer | Immunofluorescence; vasculature permeability: FITC-dextran; Cytokine: angiogenesis ELISA | (Nagaraju et al. 2018) | |
| ECs | Kidney cancer | qPCR, beads-based assay (Luminex Assays) | (Miller et al. 2018) | |
| ECs | Glioblastoma | Immunofluorescence | (Kim et al. 2013) | |
| ECs | Leukemia | Immunofluorescence; phase-contrast images; angiogenesis antibody array kit; RT-PCR | (Zheng et al. 2016) | |
| ECs | No real tumor; mimic the presence of proangiogenic factors secreted from the tumor | Immunofluorescence, fluorescent protein | (Kim et al. 2015) | |
| ECs | Breast cancer | Fluorescent dextran; fluorescent dye; live/dead staining | (Chen et al. 2013) | |
| Immune cells | TAMs | Metastatic breast cancer | Fluorescent and phase micrograph; SHG, two photon fluorescence (TPF) | (Huang et al. 2009) |
| TAMs | Fibrosarcoma | Fluorescent dye, fluorescent protein; fluorescent dextran; immunofluorescence; bead-based cytokine array | (Zervantonakis Ioannis et al. 2012) | |
| TAMs | Glioblastoma | Fluorescent dye, immunofluorescence, caspase-3/7; ELISA activation fluorescent dye; flow cytometry; qPCR | (Cui et al. 2020) | |
| TAMs | Lung adenocarcinoma | Immunostaining; ELISA | (Hsu et al. 2012) | |
| Neutrophils | Melanoma | Chemiluminescence-based cytokine array, immunofluorescence; fluorescent dye | (Chen Michelle et al. 2018) | |
| Dendritic cells | Colorectal cancer | Fluorescent dye; flow cytometry; immunofluorescence; qRT-PCR | (Parlato et al. 2017) | |
| Spleen cells | Melanoma | Phase-contrast image; flow cytometry; fluorescence: cell-tracker | (Businaro et al. 2013) | |
| Tumor-infiltrating lymphocyte (TILs) | Colon adenocarcinoma | Fluorescent dye | (Moore et al. 2018) | |
| Tumor fragments including immune cells | Colon adenocarcinoma | Live/dead stain; Immunofluorescence; beads-based cytokine profiling; RNA-seq | (Aref et al. 2018) | |
| Non-cellular components | CXCR4, CXCL12 | Salivary gland adenoid cystic carcinoma | Fluorescent dye, immunofluorescence, phase-contrast imaging, fluorescent dextran | (Zhang et al. 2012) |
| CXCL12, CXCR7, CXCR4 | Breast cancer | Western blot (WB), ELISA, qRT-PCR, fluorescent protein, phase-contrast image, bioluminescence | (Cavnar et al. 2014) | |
| IL-6 | Breast cancer | Live/dead staining; fluorescent protein | (Mi et al. 2016) | |
| Wall shear stress | Breast carcinoma | ELISA, qRT-PCR, immunofluorescence | (Buchanan et al. 2014) | |
| Oxygen | Squamous cell carcinoma, lung carcinoma, gastric signet ring carcinoma, breast cancer | Immunofluorescence; microarray analysis, ELISA, qRT-PCR | (DelNero et al. 2015) | |
| Breathing | Lung cancer | Fluorescent protein; absorbance: cell proliferation; flow cytometry; immunofluorescence; histology; electrochemiluminescence immunoassay (ECLIA) | (Hassell et al. 2017) | |
| pH, O2, glucose or lactate | Brain cancer | Thin-film platinum, iridium oxide electrodes, electrochemical biosensor | (Weltin et al. 2014) | |
| Cut-off pore size, interstitial fluid pressure | Breast cancer | Immunofluorescence | (Kwak et al. 2014) | |
| Physiological flow | Melanoma | Fluorescence; hematoxylin, eosin and silver staining kit | (Albanese et al. 2013) |
Although various methods have been successfully used to characterize the cellular and non-cellular components of TME in cancer-on-a-chip models, assessment of cell response by these approaches are mostly labor- and time-consuming and only provide end-point results, which pose significant challenges towards real-time and in situ analysis of TME on chip. Taking immunofluorescence as an example, it requires invasive collection of cells, ex situ cell fixation, and overnight incubation, and suffers from photobleaching for real-time imaging and time-lapse monitoring. For secretory protein analysis, current ELISA-based methods are mostly performed off-chip and fall short to provide sensitive detection especially for rare biomarkers or at low cell count. Moreover, the collection of the target containing medium from TOC would unavoidably disrupt the TME and result in an averaged measurement that cannot pinpoint the original state of the system (Kumar and Varghese 2019). Most importantly, the intratumor heterogeneity and the rapidly evolving status of TME, which fosters tumor evolution and adaption, have become the major obstacles for continuous assessment of TME. These emerging challenges have spurred the demand for new technologies that can be well adopted to dissect the spatial and temporal information of TME in the TOC.
5. Technologies Available for In Situ, Real-time Sensing, Monitoring, and Regulation of TME
To overcome the obstacles mentioned above, novel sensing technologies are critically needed with the capability to allow in situ, real-time sensing, monitoring, and regulation of TME and should be highly compatible with a TOC. Comparing to fluorescence-based, ELISA-based, or traditional gene analysis methods, novel fluorescence molecular imaging, real-time detection assays, label free biosensors, and on-chip high-throughput RNA/DNA sequencing offer diverse features in analyzing a variety of important targets in TME (cytokines, growth factors, ligands, RNA, DNA, metabolite, ECM, etc.) and provide promising sensing performance, particularly in spatiotemporal measurements.
5.1. Real-time detection biosensors/assays for extracellular protein analysis
Secretory proteins in TME, such as cytokines, play a significant role in the cellular processes that drive the malignant progression. Therefore, a comprehensive analysis of secretory proteins in TME is pivotal for us to understand the complex malignant progression, and mutual interaction between TME and malignant transformation. Current methods for secretory protein analysis are used tangentially to access the TME that only present a global snapshot of the protein profiles at the time of analysis. To achieve the in situ real-time detection of secreted proteins in TME, we summarized state-of-art biosensors/assays that can be potentially integrated with TOCs and classified them based on sensing modalities.
5.1.1. Electrochemical biosensors
Electrochemical detection features low cost, fast response, simplicity and high sensitivity, and is ideally suited for remote and/or embedded real-time detection of biomarkers in TME on TOCs (Ronkainen et al. 2010). Electrochemical biosensors have been applied in TME of TOCs, such as the detection of cellular metabolites (i.e., lactate and glucose)(Misun et al. 2016), and secreted proteins (i.e., albumin and glutathione-S-transferase-alpha (GST-α)(Shin et al. 2017)). The signal transduction is based on label-free electrochemical impedance, charge transfer induced by electrochemically activated labelling molecules, or oxidation reaction catalyzed by enzymes. For example, Ali’s group reported aptamer and antibody based electrochemical immunobiosesnors for continual embedded monitoring of cell secreted biomarkers (Riahi et al. 2016; Zhang et al. 2017). A label-free electrochemical immunobiosensor was developed for automated on-chip monitoring of liver function biomarkers GST-α and albumin, and cardiac biomarker creatine kinase MB (CK-MB), secreted from hepatic and cardiac organoids (Zhang et al. 2017). The changes of charge transfer resistance on an antibody functionalized electrode were measured to quantify the captured biomarkers. After each measurement, a dual-step cleaning process was performed to regenerate the electrode surface, allowing long-term continuous monitoring of these biomarkers. By further integrating two dual-organ platforms with the electrochemical biosensor module, a time-course measurement of drug-induced organ toxicity was demonstrated by a human liver-and-heart-on-a-chip platform insulted with acetaminophen (APAP) for up to 5 days, and a human liver-cancer-and-heart-on-a-chip platform challenged with doxorubicin (DOX) for up to 24 h. This platform showed enormous potential in anticancer drug screening by providing continual sensing of the microenvironmental and biochemical parameters that was not available previously. Despite the capability in continuous biomarker monitoring, these electrochemistry-based TME studies still require sample collection and preparation from on-chip cell cultures to provide the quantitative analysis of the secretory proteins in TOCs. This drawback could be overcome through in situ electrochemical sensors that capture the proteins in proximity to the secretion sites. Liu et al. have demonstrated the first in situ electrochemical sensors that integrate a novel design of half-ring electrodes with a microfluidic cell culture module, to measure the secretory cytokine in a real-time fashion (Liu et al. 2015).
On the other hand, the temporal resolution of electrochemical sensor is greatly limited by the slow analyte diffusion rate over large surface areas on commonly used planar electrodes. Nanoelectrodes exhibit enhanced mass transport and higher current density due to radial diffusion, thus providing not only higher temporal resolution and faster response, but also significantly improved detection sensitivity (Figure 6A). Nanoelectrodes have been used to detect α-fetoprotein with a detection limit of 0.01 pg/mL (Hong et al. 2020), monitor neurotransmitter secretion at single-vesicle resolution in 0.1 millisecond intervals (White and Kim 2021), and map intracellular recordings from 1700 connected neurons (Abbott et al. 2020). The ultrahigh detection sensitivity afforded by nanoelectrodes allowed rapid characterization of cell membrane proteins and secretory chemicals at single-cell level (Liu et al. 2022). In addition, high-throughput electrochemical analysis enabled by electrode arrays has been demonstrated for simultaneous monitoring of isoforms of parathyroid hormone-related peptide (Otieno et al. 2016), and cytokines on wounds (Gao et al. 2021a). With appropriate integration with TOCs, these novel electrochemical techniques could achieve rapid, ultra-sensitive detection of secretory protein in TOCs at high throughput.
Figure 6. Secretory protein analysis via real-time detection biosensors.
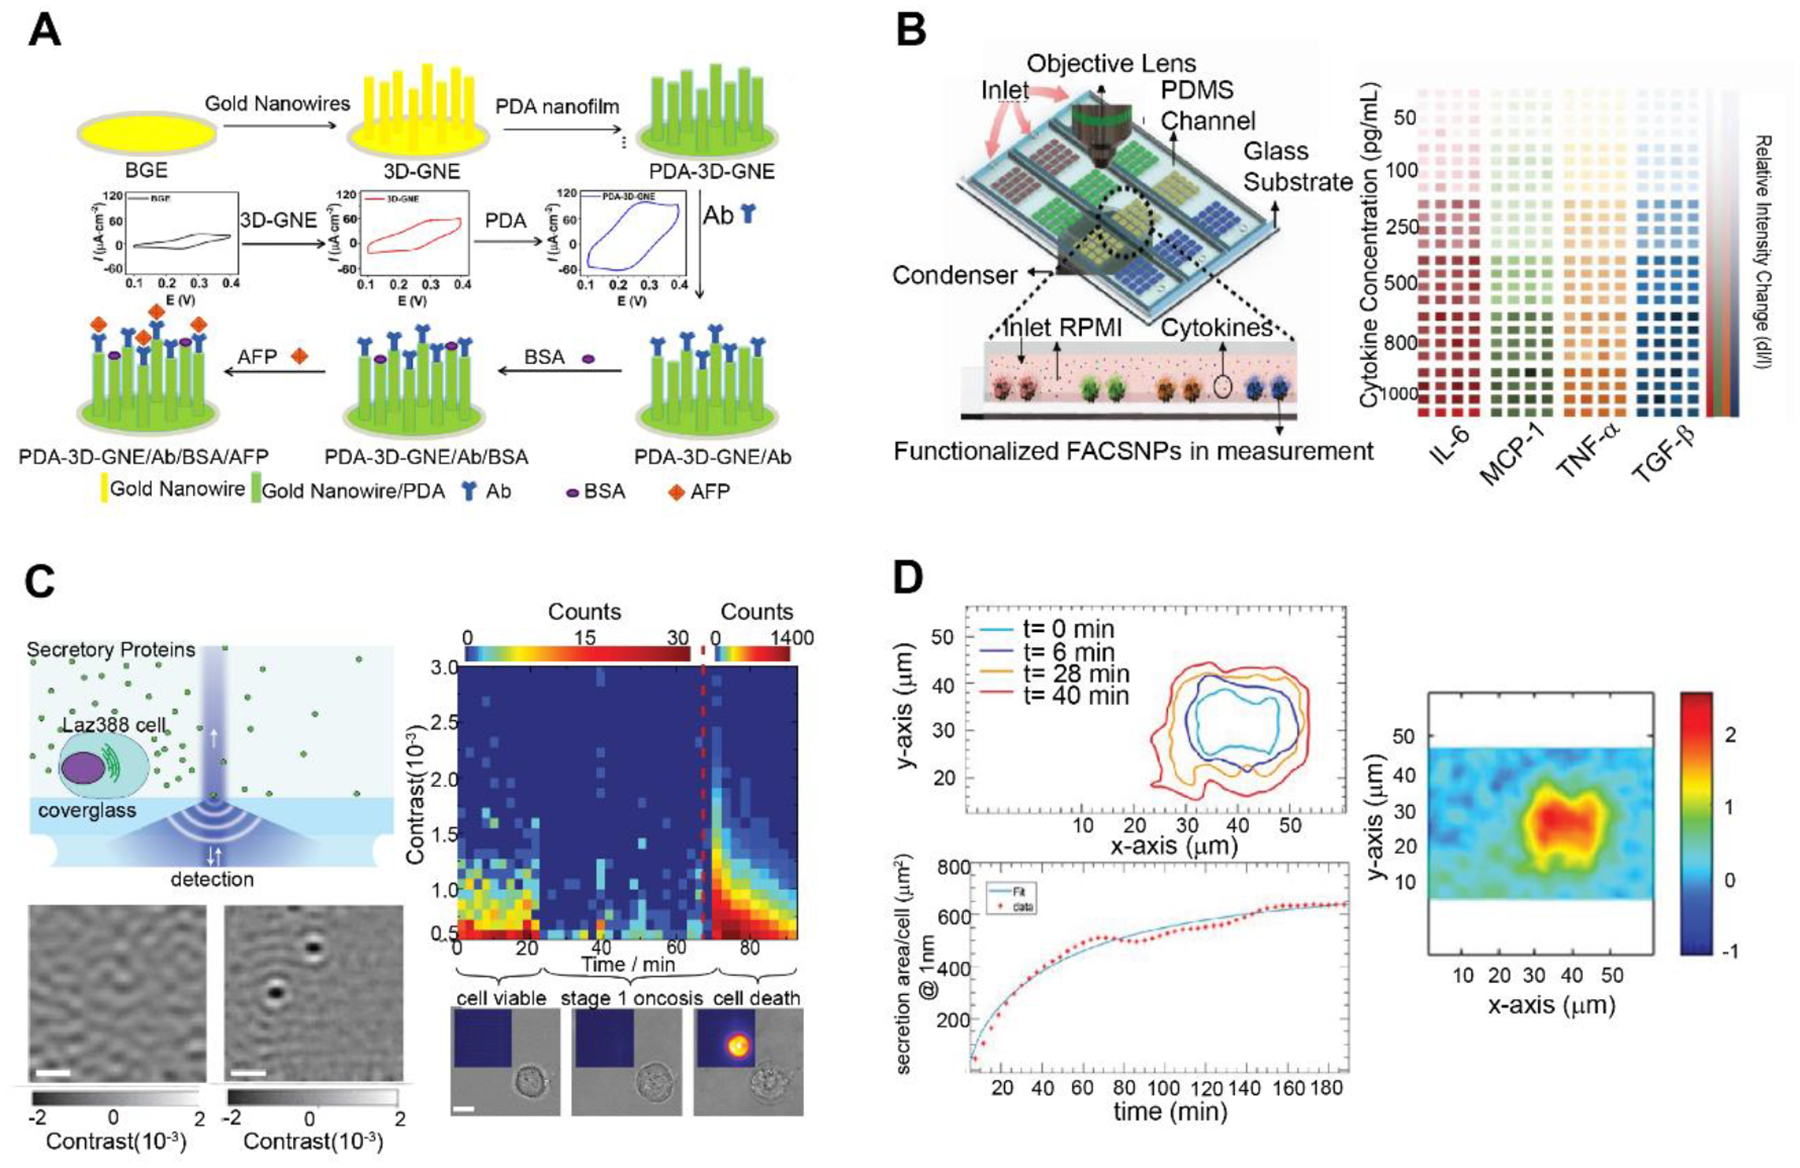
(A) Nanoelectrodes for detection of α-fetoprotein with a detection limit of 0.01 pg/mL. Adapted with permission. Copyright 2020, Elsevier. (Hong et al. 2020) (B) multiarrayed LSPR optical immunoassay based on a magnet patterned Fe3O4/Au core–shell nanoparticle sensing array for simultaneous real-time detection of four cytokines in complex biological samples, with limit of detection at ~20 pg/mL. Adapted with permission. Copyright 2019, Wiley. (Cai et al. 2019) (C) Interferometric detection of scattered light (iSCAT) method for in-situ real-time imaging of secreted proteins by Epstein−Barr virus -transformed B cell line. Reprinted adapted with permission from (McDonald et al. 2018). Copyright 2018, American Chemical Society. (D) Photonic crystal resonant (PCR) imaging of thrombopoientin secretion at single-cell level, with fine resolution of 2~6 μm and detection limit below 125 ng/mL. Adapted under the terms of the CC-BY license. Copyright 2018, the Authors. (Juan-Colaás et al. 2018)
5.1.2. Plasmonic biosensors
Plasmonic sensors rely on surface plasmons generated at metal-dielectric boundary, where the refractive index change of surrounding medium leads to spectrum shift of the plasmonic resonance. Therefore, they are sensitive to specific binding events occurring on functionalized sensing surface. Its signal transduction does not require labeled sensing probes and multi-step incubation and washing processes, hence is suitable for in situ real-time detection and monitoring of biomarkers. Surface Plasmon Resonance (SPR) is one of major sensing modalities in plasmonic sensors that can detect refractive index change in the vicinity of the sensor surface up to 200 nm, thus suitable for label-free detection of large molecule (1 – 500 kDa.) secretion and bulk refractive index measurement. Liu et al. (2012) performed in situ monitoring of vascular endothelial growth factor (VEGF) secretion from human ovarian carcinoma SKOV-3 cells by attaching the cells on the ceiling of the flow chamber, while recording the signals from embedded SPR sensor at the bottom of the flow cell. Compared to SPR, nanoplasmonic biosensors build upon noble nanostructures with local enhancement of the electric field in the vicinity (less than 30 nm) of the surface, yielding a high detection sensitivity for localized binding events. Real-time monitoring of Interleukin 6 (IL-6) secretion at single-cell level was demonstrated by Zhu et al. (2020) using gold-capped nanopillar-structured cyclo-olefin-polymer film with a detection limitation of 10 ng/mL based on spectrum shift measurement. Recently, intensity based nanoplasmonic biosensors have emerged as a new approach that detect the optical responses of scattered light upon target binding, enabling simultaneous multiplex quantification of secretory proteins (Cai et al. 2019; Chen et al. 2015; Faridi et al. 2019; Gao et al. 2021b; Javed et al. 2019; Wang et al. 2021). Cai et al. (2019) developed a high-throughput, label-free, multiplex nanoplasmonic biosensor based on a magnet patterned Fe3O4/Au core–shell nanoparticle sensing array (Figure 6B). This optical plasmonic sensor can achieve real-time, high throughput detection of four cytokines in complex biological samples, with limit of detection at ~20 pg/mL. Extraordinary Optical Transmission (EOT) biosensor utilizes periodic nanohole arrays to generate localized and propagating surface plasmons and is another major plasmonic sensing scheme that measures transmission spectra due to refractive index change at surface (Lee et al. 2018b; Soler et al. 2017). Li et al. (2017) developed a microfluidic device combining the cell culture and EOT sensing modules, thus in situ monitoring of VEGF secreted from cancer cells was achieved at real-time with limit detection of 145 pg/mL.
5.1.3. In-situ real-time imaging
Despite the aforementioned techniques can provide in situ real-time quantification of biomarkers, imaging tools for direct visualization of secretory biomarkers to provide spatial information of cellular secretion in TME have been rare. A few nice attempts have been made using innovative imaging systems that can provide in situ real-time mapping of the secretion profile with micron level resolution. McDonald et al. (2018) reported an interferometric detection of scattered light (iSCAT) method for real-time imaging of secreted proteins from Epstein-Barr virus transformed B cell line (Figure 6C). The principle was based on the interference of the scattered light produced by the target protein binding with a reference light, which generated iSCAT contrast as the characteristic readout. The hypersensitive real-time imaging of secreted IgG antibodies was accomplished by counting the binding events at different pixels over certain integration period with a throughput of ~100 molecules per second. However, the limited sensitivity in detection of low molecular weight molecules (< 100 kDa.) hinders its applications for small biomarker (i.e., cytokines and growth factors) monitoring. Juan-Colaás et al. (2018) performed secretion mapping of thrombopoietin from individual cells using photonic crystal resonant (PCR) imaging (Figure 6D). The PCR platform leveraged the constructive or destructive interference of light on photonic crystals (PCs) to monitor the refractive index changes at the surface upon binding with secreted thrombopoietin. The transmission and reflection intensities were recorded for each pixel across a specific range of wavelengths, thus the peak shift can be recognized with a fine resolution of 2 – 6 μm. Shiraskaki et al. (2014) exploited total internal reflection fluorescence microscopy (TIRFM) for real-time imaging of IL-1β secreted by monocytes. Fluorophore labeled detection antibodies that bound to IL-1β in the vicinity of sensor were excited with strong fluorescence emission due to enhanced near-field intensity, which provided high signal-to-background ratio to allow real-time cytokine detection using a single-step incubation at a limit of detection reaching single molecular level.
5.2. Advanced fluorescence molecular imaging for intracellular dynamic biomarker analysis
Fluorescence Molecular Imaging (FMI) has been widely used for in vivo analysis of molecular and cellular activities during physiological and pathological processes. FMI resolves molecular features of interest in vivo using specific fluorescent probes and reports their presence in a noninvasive fashion. Recent advances in fluorescence microscopic technology have led to the development of novel probes that offer further improved spatial resolution beyond the diffraction limit and ultrahigh sensitivity down to single-molecule level. The previously mentioned fluorescent staining probes used in TME are mostly “always-on” fluorescence probes that provide enhanced contrast signals through accumulation and retention at target binding sites. It often requires a long incubation time for probes to be excreted to generate a high signal-to-noise ratio, limiting their sensitivity and capability in real-time imaging (Figure 7A). In contrast, novel activatable probes are fluorescently switched on only in response to specific microenvironment indicators and can be interrogated more rapidly upon systemic administration (Zhao et al. 2017). The most common fluorescence switching mechanisms for activatable fluorophores are Förster Resonance Energy Transfer (FRET), self-quenching, and photoinduced electron transfer.
Figure 7. Fluorescence Molecular Imaging for dynamic biomarker analysis.
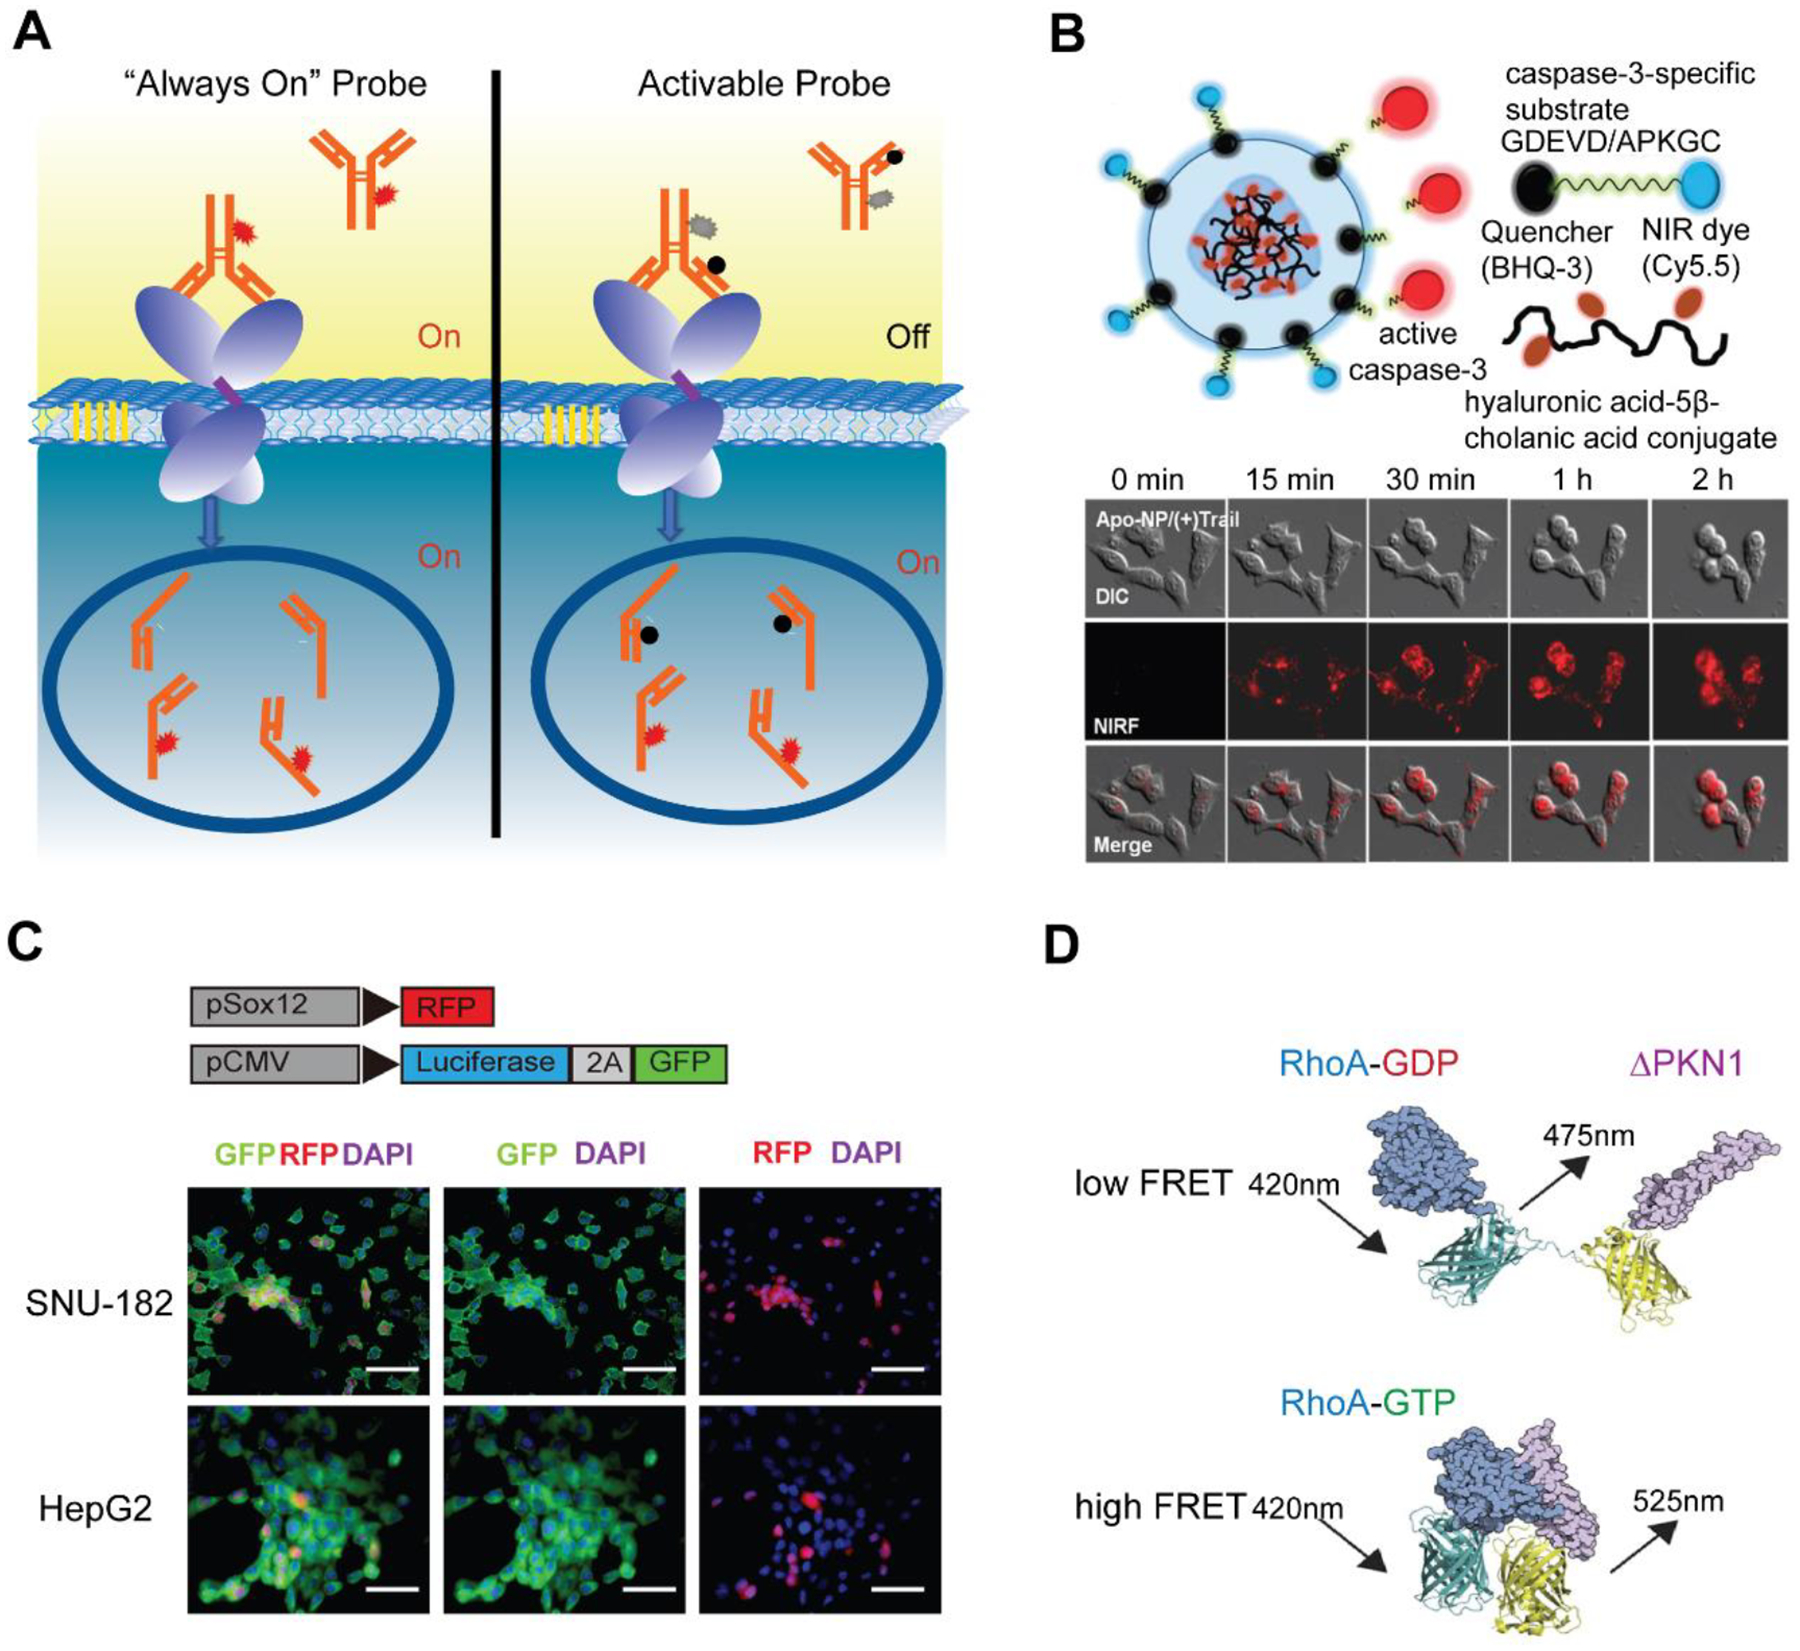
(A) Principles of “always on” and activatable probe for biomarker recognition. (B) FRET based activatable probes (dual-quenched caspase-3-sensitive peptides) used for monitoring caspase-3 activity. Reprinted adapted with permission from (Lee et al. 2011). Copyright 2011, American Chemical Society. (C) Reporter red fluorescence protein (RFP) gene fused with a Sox12 promoter for the study of Sox12 as a potential cancer stem-like Cell marker in Hepatocellular Carcinoma. Adapted under the terms of the CC-BY license. Copyright 2017, the Authors. (Zou et al. 2017) (D) FRET-based FP biosensor used for activity imaging of plasma membrane restricted small GTPase RhoA. Adapted under the terms of the CC-BY license. Copyright 2015, the Authors. (Van Unen et al. 2015)
The FRET probes primarily consisted of a fluorophore/quencher pair that conjugate to different sites in vicinity on a probe. The FRET is activated upon target binding that separates the fluorophore/quencher pair, resulting in images with low background and high activation in designated conditions. Lee et al. (2011) designed a dual-quenched caspase-3-sensitive peptide that achieved 15-fold fluorescence recovery based on caspase-3 activation (Figure 7B). Since caspase-3 is known as a relevant molecular mechanism in apoptosis signaling, direct visualization of apoptosis in living cells can be achieved through real-time monitoring of the caspase activity. Self-quenching probes adapt FRET principle as well, except that the energy transfer occurs between a ligand protein and an organic dye. Indocyanine green (ICG) has been reported to be effectively quenched by antibody conjugation, and can thus provide fluorescence recovery as high as 50-fold at target site (Nakajima et al. 2011; Watanabe et al. 2014). Photon-induced Electron Transfer (PET) probes, composed of a fluorophore and a redox active receptor ligand, are highly sensitive to pH change or target binding (Urano et al. 2009). Urano et al. (2009) designed acidic pH–activatable probes based on the boron-dipyrromethene fluorophore conjugated to a cancer-targeting antibody. The protonated probe became highly fluorescent with a greater than 300-fold increase in emission in an acidic tumor environment.
Recent advancement in genetic engineering further allows the introduction of reporter genes (i.e., fluorescent protein (FP) gene) in target host cells for in-situ imaging of transcriptional regulation, intracellular protein biomarker expression, and protein-protein interactions. By performing a plasmid transfection containing PEG10 promoter and near-infrared protein 682 reporter gene, Shapovalova et al. (2019) analyzed the retrotransposon-derived protein expression via paternally expressed gene 10 (PEG10) in AR-splice variant prostate cancer cells. They discovered that the PEG10 promoter was a powerful and specific tool for noninvasive detection of aggressive prostate cancer subtypes. Thiagarajan et al. (2015) fused a green fluorescent protein (GFP) reporter with the promoter of the well-established pluripotency gene NANOG, observing enhanced enrichment for tumorigenic cancer stem cells through real-time GFP imaging. Zou et al. (2017) constructed a red fluorescence protein (RFP) reporter under the control of a Sox12 promoter, to study the function of Sox12 as a potential cancer stem-like Cell marker in Hepatocellular Carcinoma (Figure 7C). These genetically encoded FPs can be engineered as activatable reporters that are highly sensitive to the intracellular changes of pH, calcium ions (Horikawa et al. 2010) or ATP (Berg et al. 2009) and have been used for dynamic imaging the biological processes within subcellular environments. In addition, more sophisticated strategies by pairing FRET FPs (Figure 7D) have been applied in intracellular tracking of various biomarkers including metabolites, such as NADH (Zhao and Yang 2015), gluocose (Takanaga et al. 2008), lactate (San Martín et al. 2013), pyruvate (San Martin et al. 2014), glutamin (Marvin et al. 2018), and signaling pathways such as epidermal growth factor receptor (Itoh et al. 2005), Rho family GTPases (Lam et al. 2012; Van Unen et al. 2015), myosin light chain kinase (Khuon et al. 2010), etc. All these advanced molecular imaging probes provide target specific signals with significantly enhanced sensitivity and high tumor-to-background contrast, which can be well integrated as homogeneous sensing and real-time imaging approaches for on-chip analysis of intracellular biomarker, environment and metabolites in the TME.
5.3. On-chip nucleic acid sequencing for genetic and transcriptomic analysis
Nucleic acid sequencing technologies allow for the interrogation of the genetic and transcriptomic information of a tumor and its TME. High-throughput sequencing can identify microenvironmental marker genes and signatures with single-cell resolution that provide genetic fingerprints and spatial information for revealing the intra- and inter- tumor phenotypic and genotypic heterogeneity. In situ DNA/RNA sequence tools, in particular for monitoring mRNAs in the TME on-chip, can provide additional information about tumor initiation and progression (Zhao et al. 2020b) and have significant value in prognostics.
5.3.1. Microfluidic assisted high throughput nucleic acid sequencing
The state-of-art high throughput gene sequencing technologies have been widely involved with microfluidics integration for genomic, transcriptomic, and epigenomic single-cell analysis. Four main steps are commonly included in single-cell sequencing: cell enrichment, isolation, lysis, molecular amplification and sequencing. The cell enrichment usually requires identification of specific cellular biomarkers, followed by cell sorting by external force from an actuator to direct them towards desired locations. Many microfluidic cell sorting techniques have been developed, including acoustophoresis (Urbansky et al. 2019), dielectrophoresis (Mazutis et al. 2013), optics (Qi et al. 2017), and magnetophoresis (Blue Martin et al. 2017; Lee et al. 2014). The sorted cells can subsequently be confined in microwells (Manzoor et al. 2021), valve-based microfluidics, (Briones et al. 2021) or droplet microfluidics (Ding et al. 2019; Matuła et al. 2020) for on-chip lysing. A variety of rapid lysis techniques have thus been reported to minimize the interference with the reactions, such as chemical (Jen et al. 2011), electrical (Jeon et al. 2018; Lo and Lei 2019), thermal (Privorotskaya et al. 2010) and mechanical lysis (Flaender et al. 2018). The final molecular amplification and sequencing procedures have been mostly accomplished off-chip by various techniques. The details of these techniques have been discussed elsewhere (Hu et al. 2021; Huang et al. 2015; Wang et al. 2022b). Though single-cell sequencing provides powerful means to characterize the TME, the off-chip manipulation inevitably increases the system complexity and overall analysis time and falls short in providing the genomic spatial distribution in tumor organoids (Payne et al. 2021; Wang et al. 2022a). Therefore, several on-chip in situ DNA/RNA sequencing techniques have been explored to fill the gap.
5.3.2. In Situ hybridization/sequencing
Instead of extracting DNAs/RNAs from the cells, in situ hybridization/sequencing technology enables direct visualization of these molecules in their original environment. In situ hybridization/sequencing takes advantage of molecular barcodes, which provide spatial and quantitative gene information without the need for amplification. Barcoding can be fulfilled by inclusion of distinct short DNA oligonucleotides into already prepared cDNA library. Each base of DNA molecules could represent four possible values, thus a short sequence of oligonucleotides can create enormous numbers of combinations for barcoding. The decoding of the barcode integrated with a complimentary probe could then reveal the information of the presence of target genes in situ. The decoding could be accomplished through in situ hybridization (ISH) or in situ sequencing (ISS). The readout in ISH leverages multiple fluorescently labeled probes to hybridize with predefined targets while the readout of ISS is achieved by sequencing-by-ligation (SBL). Xia et al. (2019) developed multiplexed error-robust fluorescence in situ hybridization (MERFISH) to achieve simultaneous measurements of RNA transcripts from ~10,000 genes in individual cells and enable the identification of RNA species enriched in different subcellular compartments (Figure 8A). Maïno et al. (2019) demonstrated an automated microfluidic system for in situ sequencing of barcoded mRNA amplicons in fixed cells (Figure 8B). This platform was composed of a microfluidic unit, a thermal controller unit, and a reagent delivery unit, allowing automated ligation and hybridization of padlock probes, rolling circle amplification of the barcoded amplicons, and amplicons identification via barcode sequencing. With this system, a higher detection efficiency, shorter protocol time, and lower consumption of oligonucleotide reagents were achieved. Nguyen et al. (2020) successfully performed 3D mapping of 66 genes across 6 chromosomes in hundreds to thousands of cells through SBL. Combining Oligopaints with fluorescence in situ sequencing (FISSEQ), they obviated the need for amplification process and achieved genome-wide super-resolution imaging for human diploid fibroblast cells.
Figure 8. In situ hybridization/sequencing for TME validation.
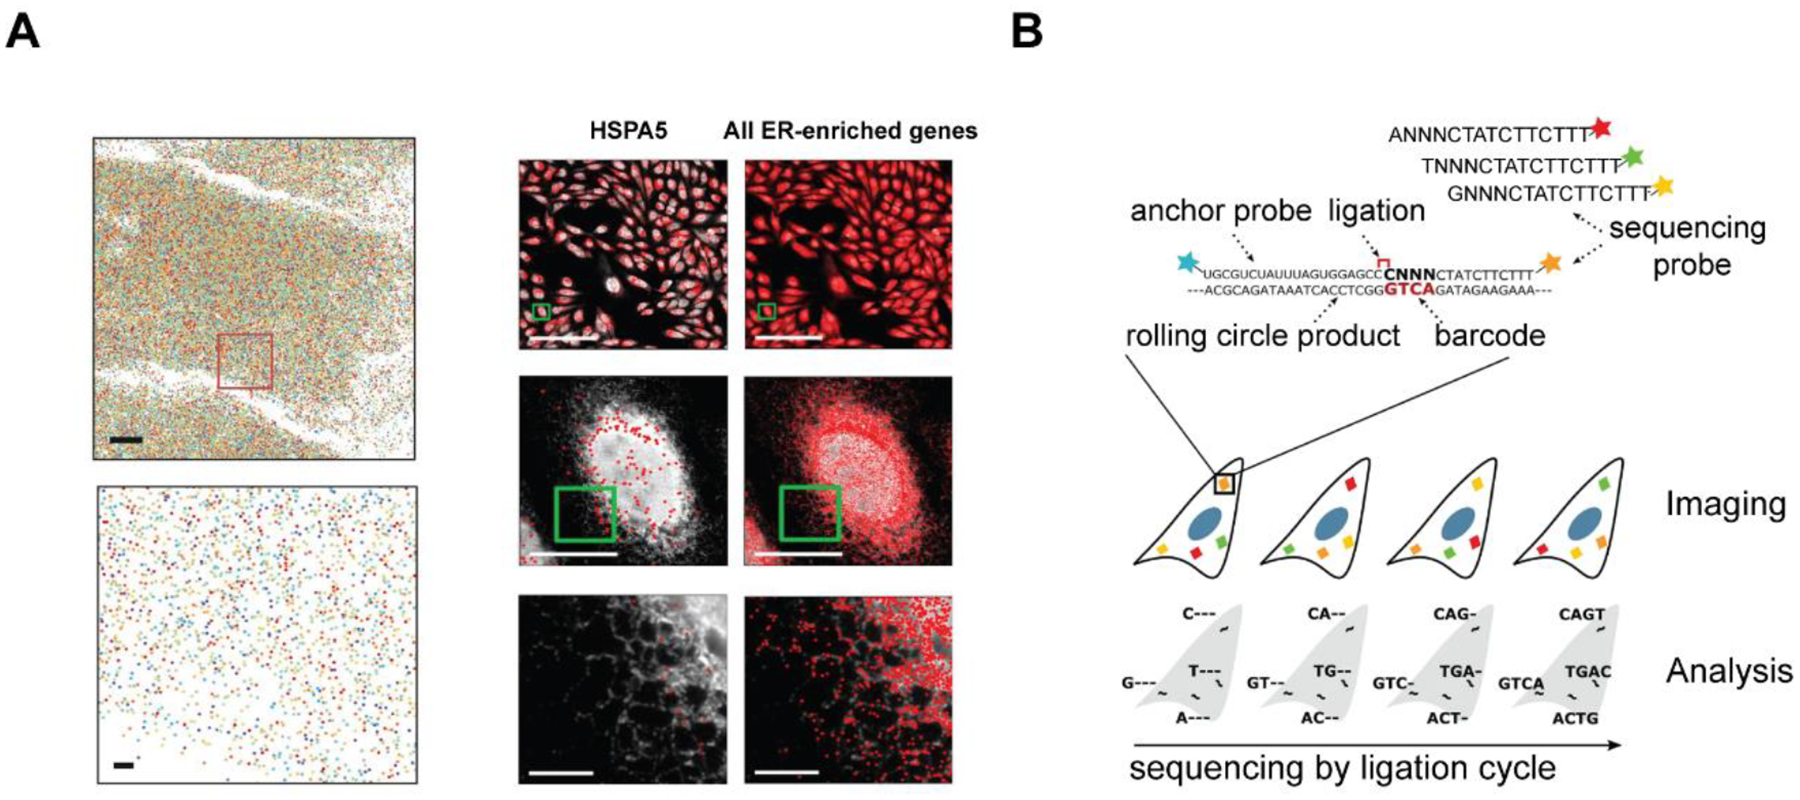
(A) Multiplexed error-robust fluorescence in situ hybridization (MERFISH) for 10,050-gene imaging in individual U-2 OS cells. Left: U-2 OS sample stained with encoding probes targeting 10,050 RNA species and a zoomed-in image below (Scale bar: 1 μm.). Right: identification of RNAs enriched at the endoplasmic reticulum. Adapted under the terms of the CC BY-NC-ND license. Copyright 2020, the Authors. (Xia et al. 2019) (B) Schematic for in situ sequencing of barcoded mRNA amplicons in fixed cells. Adapted under the terms of the CC-BY license. Copyright 2019, the Authors. (Maïno et al. 2019)
6. The Challenges and Future of Integrated TOC for In Situ, Spatiotemporal Analysis of TME
6.1. Spatiotemporal resolution
Due to the complexity of tumorigenesis and metastasis, tumor cells in the TME can display distinct properties and behaviors at the molecular and genetic levels and evolve rapidly along with the cancer development. This heterogeneity has been found to exhibit high spatiotemporal discrepancy in histology, protein signatures, genetic profiles, and the expression of specific markers. A thorough and comprehensive investigation of these variables places high demands on biosensing technologies that can conduct versatile measurements with unprecedented spatiotemporal resolution on chip. Recent progresses in advanced cancer models including 3D TOC systems have given rise to new challenges for current imaging and sensing platforms by adding another degree of freedom. Thereby, novel engineering tools enabling on-chip homogeneous detection and/or imaging of mechanical forces, chemotaxis, biomarker expression, and bio- and drug distribution are further needed to better understand the complex physiological architecture and gain precise spatiotemporal control of the TME in a 3D approach.
6.2. Non-specific adsorption
The undesired molecular adsorption on polymeric materials, such as PDMS, is a fundamental issue faced by most of the TOC systems, making it extremely challenging to precisely control and monitor the concentration and distribution of the target molecules in the TME. While various novel coatings (i.e., poly (ethylene glycol) (PEG)-, polyzwitterionic-, saccharide-, polyhydroxy-, amide-containing-hydrophilic-polymers) are being developed to improve the adsorption resistance, the non-specific adsorption remains a technical challenge, particularly for small hydrophobic molecules, due to their strong interactions with the porous PDMS and possible binding onto the coating materials. Similarly, these unintended interactions have also been a critical bottleneck for biosensor technologies, especially when integrated with the TOCs for spatiotemporal measurements. Ideally, the real-time, in situ detection of specific molecular binding events in a sea of nonspecific interactions would require either a highly regenerative sensing interface or homogeneous biosensing without the need of separation and washing steps. In-depth fundamental understanding of this phenomenon through theoretical models would also be highly valuable to predict the behaviors of the biomolecules in the TOCs and optimize the sensing performance in complex physiological environments. Such combined experimental and computational efforts would be essential to the development of practical approaches to tackle the nonspecific binding challenge for on-chip sensing and monitoring of the TME.
6.3. High-throughput capacity
Current TOC technologies have shown great potency as predictive preclinical models for cancer research and drug discovery, bridging the gap between animal studies and clinical trials. Though some of the TOCs have demonstrated high-throughput, continuous fabrication of tumor organoids on microfluidics, majority of the models still require labor-intensive and cumbersome processes in preparation, sorting, separation, reagent administration, and characterization. This becomes even more challenging when applying the model systems for high-throughput on-chip analysis of the TME. A recently reported high-throughput TOC platform has exemplified such a system that integrated 192 micropumps, 96 individual TOCs, and 384 electrical sensors for high content screening and evaluation of gene expression. (Azizgolshani et al. 2021) Nonetheless, unremitting efforts are still needed in sample sparing, device miniaturization and automation, large-scale parallelization, and integration of rapid, highly multiplexed control and sensor systems and massive data acquisition and analysis capability empowered by machine learning, to provide a truly high-throughput TOC platform for on-chip TME analysis.
6.4. Integration and standardization
Though aforementioned TOCs and the biosensing techniques show great promise in modeling and analysis of the molecular traits, growth, and inter-cellular interactions in the dynamic TME, the compatibility to seamlessly connect the workflows and modules of different functions for an integrated platform has not been well established. This compatibility will involve dedicated efforts to design material interface and flexible and robust sensing interface with high compliance with tumor tissues for real-time, long-term monitoring of the TME. In addition, current TOCs, as an emerging in vitro models, lack standardization in cell type, composition, condition, and protocol, which can be technically challenging to create an integrated system with high reproducibility and throughput. Advancements in 3D bioprinting have shown promising features in standardized, large-scale production of fluidic chips for constructing vascularized TME. Further improvement in standardization of TOCs, including the materials selection, device design and manufacturing, workflows, downstream assays, and data acquisition and analysis, will provide robust tumor models for practical applications and open new avenues for patient specific modeling and monitoring systems.
In conclusion, great promises exist in recent advances in TOC devices and biosensing systems for comprehensive characterization of extracellular and intracellular components in TME. The fulfillment of dissection of the complicated TME in TOCs with high spatiotemporal resolution remains challenging that would ultimately require an integrative approach to synergistically combine the viable real-time sensing and monitoring tools with emerging TOC systems (summarized as Figure 9). Such new technologies capable of accurately observing and manipulating the TME offer immense value in understanding cancer progression and would ultimately gear clinicals with translational diagnostic and therapeutic strategies in cancer treatment.
Figure 9. Conceptual illustration of integrated TOC systems.
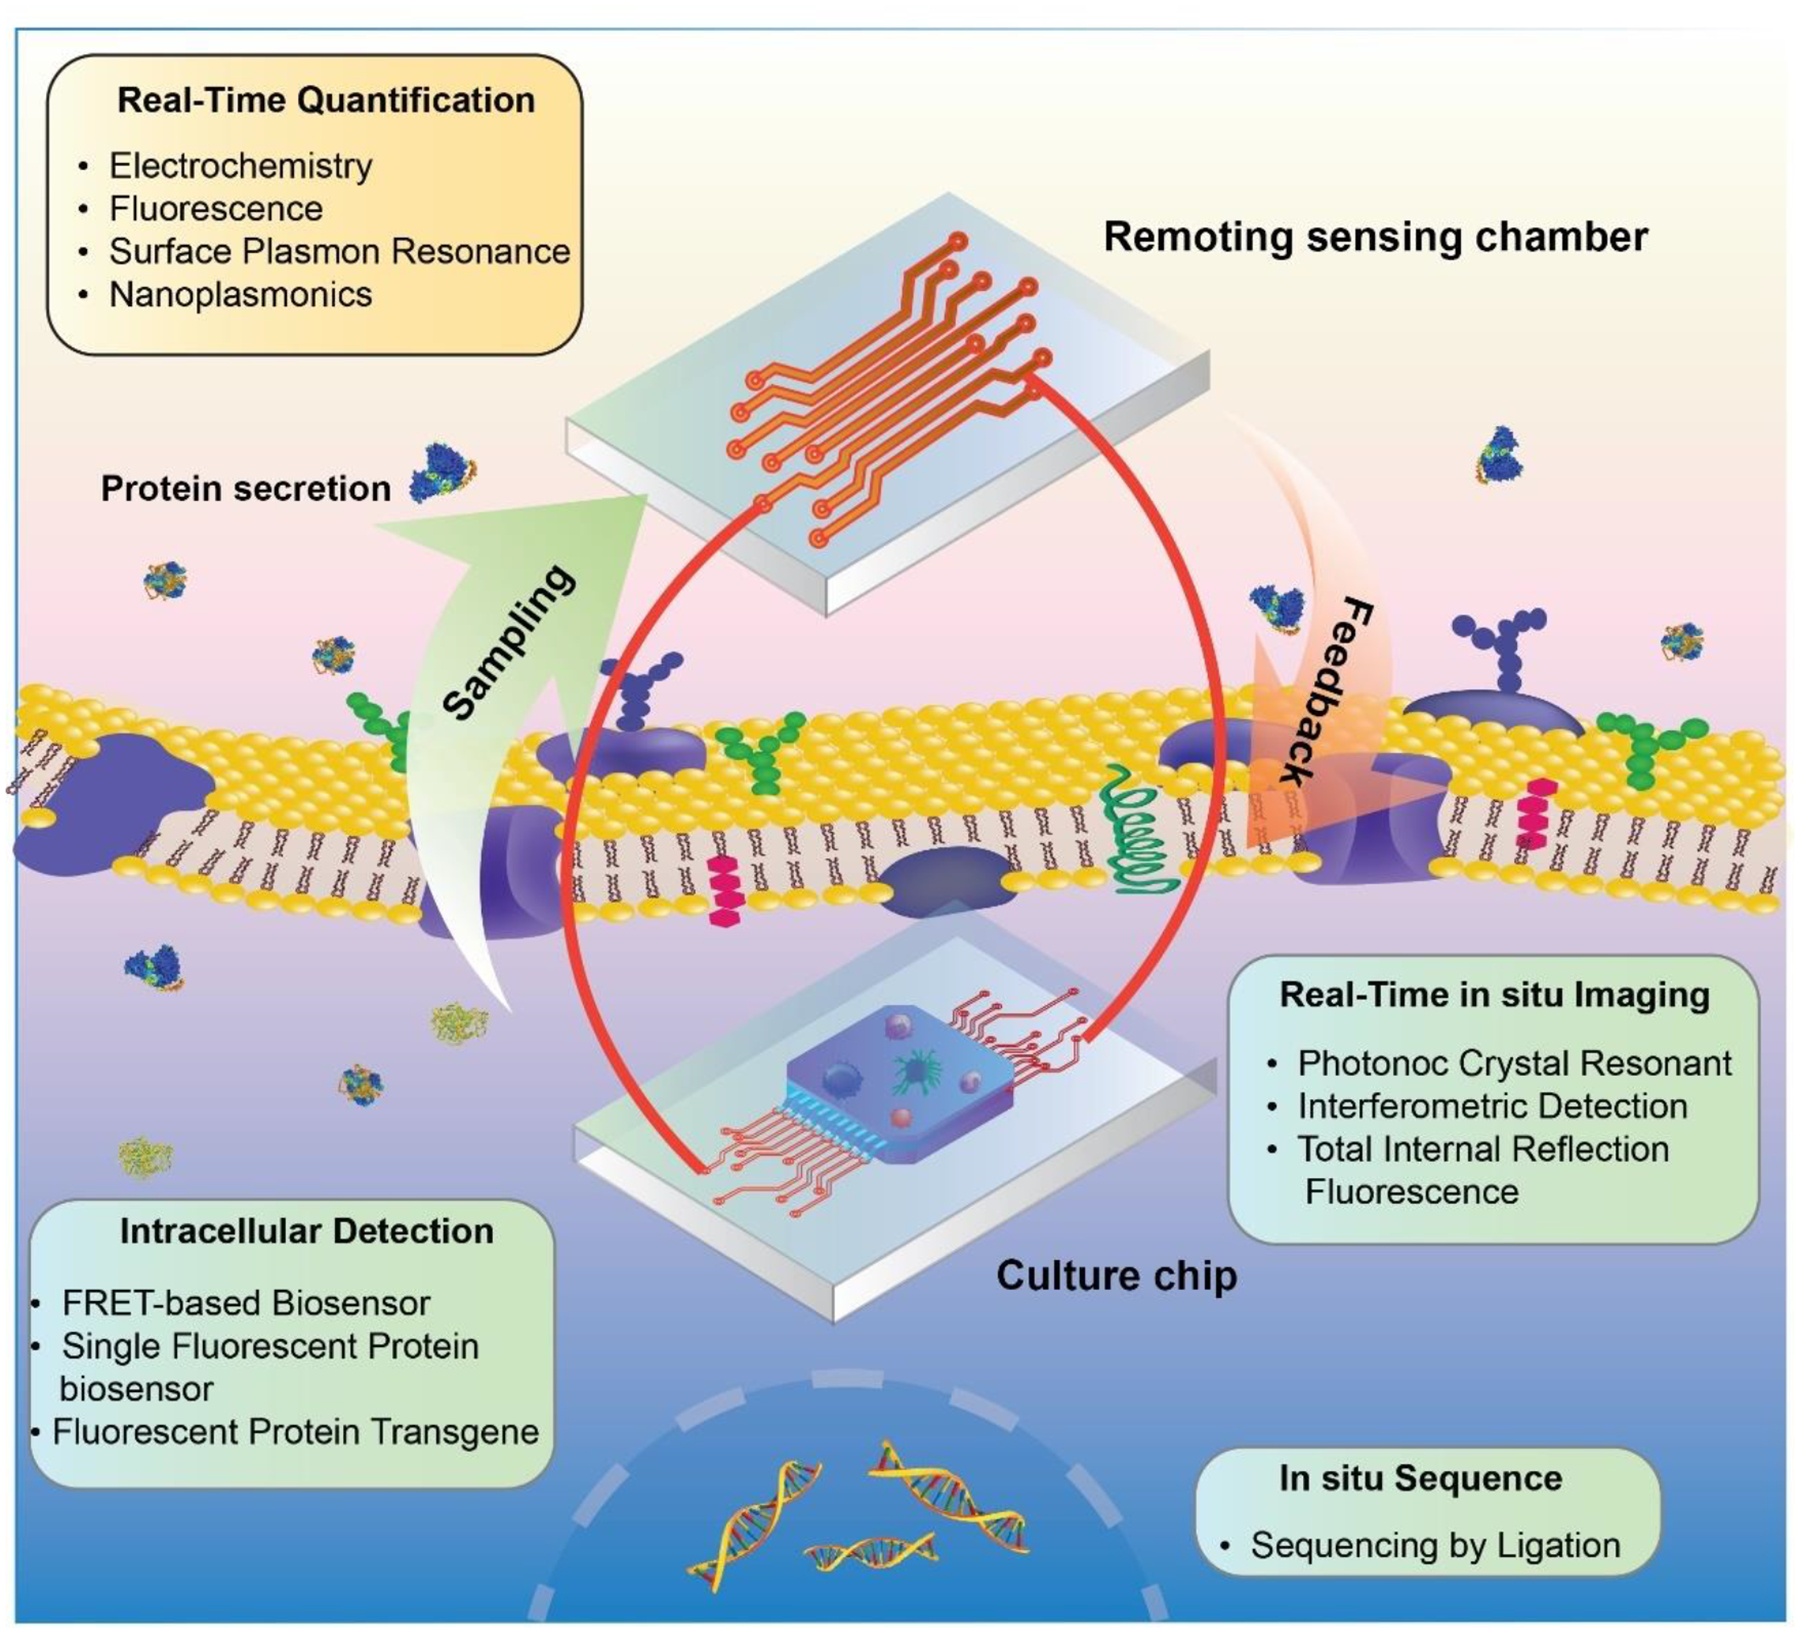
The integration of viable techniques for real-time sensing and monitoring of TME in TOCs.
Highlights:
The significance of in-situ sensing and monitoring of tumor microenvironment in tumor-on-a-chip is highlighted.
State-of-art tumor-on-a-chip strategies are reviewed.
Technologies available for in situ, real-time sensing, monitoring, and regulation of tumor microenvironment are summarized.
Perspectives on challenges and future directions of integrated tumor-on-a-chip for in situ, spatiotemporal analysis of tumor microenvironment are provided.
Acknowledgments
This work was supported by the NIH MIRA R35GM133795 and NSF CAREER CBET-1943302 (P. Chen), NSF CBET 2103219 and NIH MIRA R35GM133646 (W. Chen), and the Cancer Research Institute Irvington Postdoctoral Fellowship (CRI4018; C. Ma).
Footnotes
Publisher's Disclaimer: This is a PDF file of an unedited manuscript that has been accepted for publication. As a service to our customers we are providing this early version of the manuscript. The manuscript will undergo copyediting, typesetting, and review of the resulting proof before it is published in its final form. Please note that during the production process errors may be discovered which could affect the content, and all legal disclaimers that apply to the journal pertain.
Conflict of interest
The authors declare no conflict of interest.
References
- Abbott J, Ye T, Krenek K, Gertner RS, Ban S, Kim Y, Qin L, Wu W, Park H, Ham D, 2020. Nat. Biomed. Eng 4(2), 232–241. [DOI] [PMC free article] [PubMed] [Google Scholar]
- Ahn J, Sei YJ, Jeon NL, Kim Y, 2017. Bioengineering 4(3). [DOI] [PMC free article] [PubMed] [Google Scholar]
- Albanese A, Lam AK, Sykes EA, Rocheleau JV, Chan WCW, 2013. Nat. Commun 4(1), 2718. [DOI] [PMC free article] [PubMed] [Google Scholar]
- Anderson NM, Simon MC, 2020. Curr. Biol 30(16), R921–R925. [DOI] [PMC free article] [PubMed] [Google Scholar]
- Ando Y, Ta HP, Yen DP, Lee S-S, Raola S, Shen K, 2017. Sci. Rep 7(1), 15233. [DOI] [PMC free article] [PubMed] [Google Scholar]
- Anguiano M, Castilla C, Maška M, Ederra C, Pelaáez R, Morales X, Muñoz-Arrieta G, Mujika M, Kozubek M, Muñoz-Barrutia A, Rouzaut A, Arana S, Garcia-Aznar JM, Ortiz-de-Solorzano C, 2017. PLoS One 12(2), e0171417. [DOI] [PMC free article] [PubMed] [Google Scholar]
- Apoorva F, Loiben AM, Shah SB, Purwada A, Fontan L, Goldstein R, Kirby BJ, Melnick AM, Cosgrove BD, Singh A, 2018. Cell Rep. 23(2), 499–511. [DOI] [PMC free article] [PubMed] [Google Scholar]
- Aref AR, Campisi M, Ivanova E, Portell A, Larios D, Piel BP, Mathur N, Zhou C, Coakley RV, Bartels A, Bowden M, Herbert Z, Hill S, Gilhooley S, Carter J, Cañadas I, Thai TC, Kitajima S, Chiono V, Paweletz CP, Barbie DA, Kamm RD, Jenkins RW, 2018. Lab on a Chip 18(20), 3129–3143. [DOI] [PMC free article] [PubMed] [Google Scholar]
- Astolfi M, Péant B, Lateef MA, Rousset N, Kendall-Dupont J, Carmona E, Monet F, Saad F, Provencher D, Mes-Masson AM, Gervais T, 2016. Lab on a Chip 16(2), 312–325. [DOI] [PubMed] [Google Scholar]
- Aung A, Theprungsirikul J, Lim HL, Varghese S, 2016. Lab on a Chip 16(10), 1886–1898. [DOI] [PMC free article] [PubMed] [Google Scholar]
- Ayuso JM, Rehman S, Farooqui M, Virumbrales-Muñoz M, Setaluri V, Skala MC, Beebe DJ, 2020. Int. J. Mol. Sci 21(23), 9075. [DOI] [PMC free article] [PubMed] [Google Scholar]
- Ayuso JM, Virumbrales-Munoz M, McMinn PH, Rehman S, Gomez I, Karim MR, Trusttchel R, Wisinski KB, Beebe DJ, Skala MC, 2019. Lab on a Chip 19(20), 3461–3471. [DOI] [PMC free article] [PubMed] [Google Scholar]
- Azizgolshani H, Coppeta J, Vedula E, Marr E, Cain B, Luu R, Lech M, Kann S, Mulhern T, Tandon V, 2021. Lab on a Chip 21(8), 1454–1474. [DOI] [PubMed] [Google Scholar]
- Baghban R, Roshangar L, Jahanban-Esfahlan R, Seidi K, Ebrahimi-Kalan A, Jaymand M, Kolahian S, Javaheri T, Zare P, 2020. Cell Commun. Signal 18(1), 59. [DOI] [PMC free article] [PubMed] [Google Scholar]
- Bader JE, Voss K, Rathmell JC, 2020. Mol. Cell 78(6), 1019–1033. [DOI] [PMC free article] [PubMed] [Google Scholar]
- Baldridge MT, King KY, Goodell MA, 2011. Trends Immunol. 32(2), 57–65. [DOI] [PMC free article] [PubMed] [Google Scholar]
- Begley CG, Ellis LM, 2012. Nature 483(7391), 531–533. [DOI] [PubMed] [Google Scholar]
- Berg J, Hung YP, Yellen G, 2009. Nat. Methods 6(2), 161–166. [DOI] [PMC free article] [PubMed] [Google Scholar]
- Bersini S, Jeon JS, Dubini G, Arrigoni C, Chung S, Charest JL, Moretti M, Kamm RD, 2014. Biomaterials 35(8), 2454–2461. [DOI] [PMC free article] [PubMed] [Google Scholar]
- Bhattacharya S, Calar K, de la Puente P, 2020. J. Exp. Clin. Cancer Res 39(1), 75. [DOI] [PMC free article] [PubMed] [Google Scholar]
- Bishop ES, Mostafa S, Pakvasa M, Luu HH, Lee MJ, Wolf JM, Ameer GA, He T-C, Reid RR, 2017. Genes & Diseases 4(4), 185–195. [DOI] [PMC free article] [PubMed] [Google Scholar]
- Blue Martin A, Wu W-T, Kameneva MV, Antaki JF, 2017. Ann. Biomed. Eng 45(12), 2888–2898. [DOI] [PMC free article] [PubMed] [Google Scholar]
- Brassart-Pasco S, Brézillon S, Brassart B, Ramont L, Oudart J-B, Monboisse JC, 2020. Front. Oncol 10. [DOI] [PMC free article] [PubMed] [Google Scholar]
- Briones J, Espulgar W, Koyama S, Takamatsu H, Tamiya E, Saito M, 2021. Sci. Rep 11(1), 1–12. [DOI] [PMC free article] [PubMed] [Google Scholar]
- Buchanan CF, Verbridge SS, Vlachos PP, Rylander MN, 2014. Cell Adh. Migr 8(5), 517–524. [DOI] [PMC free article] [PubMed] [Google Scholar]
- Businaro L, De Ninno A, Schiavoni G, Lucarini V, Ciasca G, Gerardino A, Belardelli F, Gabriele L, Mattei F, 2013. Lab on a Chip 13(2), 229–239. [DOI] [PubMed] [Google Scholar]
- Caballero D, Kaushik S, Correlo VM, Oliveira JM, Reis RL, Kundu SC, 2017. Biomaterials 149, 98–115. [DOI] [PubMed] [Google Scholar]
- Cai Y, Zhu J, He J, Yang W, Ma C, Xiong F, Li F, Chen W, Chen P, 2019. Adv. Healthc. Mater 8(4), 1801478. [DOI] [PMC free article] [PubMed] [Google Scholar]
- Carvalho MR, Barata D, Teixeira LM, Giselbrecht S, Reis RL, Oliveira JM, Truckenmüller R, Habibovic P, 2019. Sci. Adv 5(5), eaaw1317. [DOI] [PMC free article] [PubMed] [Google Scholar]
- Cavnar SP, Ray P, Moudgil P, Chang SL, Luker KE, Linderman JJ, Takayama S, Luker GD, 2014. Integr. Biol 6(5), 564–576. [DOI] [PMC free article] [PubMed] [Google Scholar]
- Chen CS, Chen SC, Liao WH, Chien RD, Lin SH, 2010. Int. Commun. Heat Mass Transf 37(9), 1290–1294. [Google Scholar]
- Chen MB, Whisler JA, Jeon JS, Kamm RD, 2013. Integr. Biol 5(10), 1262–1271. [DOI] [PMC free article] [PubMed] [Google Scholar]
- Chen Michelle B, Hajal C, Benjamin David C, Yu C, Azizgolshani H, Hynes Richard O, Kamm Roger D, 2018. Proc. Natl. Acad. Sci. U.S.A 115(27), 7022–7027. [DOI] [PMC free article] [PubMed] [Google Scholar]
- Chen P, Chung MT, McHugh W, Nidetz R, Li Y, Fu J, Cornell TT, Shanley TP, Kurabayashi K, 2015. ACS nano 9(4), 4173–4181. [DOI] [PMC free article] [PubMed] [Google Scholar]
- Chen X, Nadiarynkh O, Plotnikov S, Campagnola PJ, 2012. Nat. Protoc 7(4), 654–669. [DOI] [PMC free article] [PubMed] [Google Scholar]
- Choi Y, Hyun E, Seo J, Blundell C, Kim HC, Lee E, Lee SH, Moon A, Moon WK, Huh D, 2015. Lab on a Chip 15(16), 3350–3357. [DOI] [PMC free article] [PubMed] [Google Scholar]
- Chung M, Ahn J, Son K, Kim S, Jeon NL, 2017. Adv. Healthc. Mater 6(15), 1700196. [DOI] [PubMed] [Google Scholar]
- Cova T, Bento DJ, Nunes SCC, 2019. Pharmaceutics 11(3). [DOI] [PMC free article] [PubMed] [Google Scholar]
- Cui X, Ma C, Vasudevaraja V, Serrano J, Tong J, Peng Y, Delorenzo M, Shen G, Frenster J, Morales R-TT, Qian W, Tsirigos A, Chi AS, Jain R, Kurz SC, Sulman EP, Placantonakis DG, Snuderl M, Chen W, 2020. eLife 9, e52253. [DOI] [PMC free article] [PubMed] [Google Scholar]
- Cui X, Morales RT, Qian W, Wang H, Gagner JP, Dolgalev I, Placantonakis D, Zagzag D, Cimmino L, Snuderl M, Lam RHW, Chen W, 2018. Biomaterials 161, 164–178. [DOI] [PMC free article] [PubMed] [Google Scholar]
- Del Piccolo N, Shirure VS, Bi Y, Goedegebuure SP, Gholami S, Hughes CCW, Fields RC, George SC, 2021. Adv. Drug Del. Rev 175, 113798. [DOI] [PubMed] [Google Scholar]
- DelNero P, Lane M, Verbridge SS, Kwee B, Kermani P, Hempstead B, Stroock A, Fischbach C, 2015. Biomaterials 55, 110–118. [DOI] [PMC free article] [PubMed] [Google Scholar]
- Ding Y, Howes PD, deMello AJ, 2019. Anal. Chem 92(1), 132–149. [DOI] [PubMed] [Google Scholar]
- Eberwine J, Sul JY, Bartfai T, Kim J, 2014. Nat. Methods 11(1), 25–27. [DOI] [PubMed] [Google Scholar]
- Efremov AN, Stanganello E, Welle A, Scholpp S, Levkin PA, 2013. Biomaterials 34(7), 1757–1763. [DOI] [PubMed] [Google Scholar]
- Ehsan SM, Welch-Reardon KM, Waterman ML, Hughes CCW, George SC, 2014. Integr. Biol 6(6), 603–610. [DOI] [PMC free article] [PubMed] [Google Scholar]
- El Sayed R, Haibe Y, Amhaz G, Bouferraa Y, Shamseddine A, 2021. Int. J. Mol. Sci 22(4). [DOI] [PMC free article] [PubMed] [Google Scholar]
- Elsawa SF, Novak AJ, Ziesmer SC, Almada LL, Hodge LS, Grote DM, Witzig TE, Fernandez-Zapico ME, Ansell SM, 2011. Blood 118(20), 5540–5549. [DOI] [PMC free article] [PubMed] [Google Scholar]
- Faridi A, Yang W, Kelly HG, Wang C, Faridi P, Purcell AW, Davis TP, Chen P, Kent SJ, Ke PC, 2019. Biomacromolecules 20(11), 4208–4217. [DOI] [PMC free article] [PubMed] [Google Scholar]
- Fetah KL, DiPardo BJ, Kongadzem E-M, Tomlinson JS, Elzagheid A, Elmusrati M, Khademhosseini A, Ashammakhi N, 2019. Small 15(50), 1901985. [DOI] [PMC free article] [PubMed] [Google Scholar]
- Flaender M, den Dulk R, Flegeau V, Ventosa J, Delapierre G, Berthier J, Bourdat A-G, 2018. Sens. Actuators B Chem 258, 148–155. [Google Scholar]
- Fong Eliza Li S, Lamhamedi-Cherradi S-E, Burdett E, Ramamoorthy V, Lazar Alexander J, Kasper FK, Farach-Carson Mary C, Vishwamitra D, Demicco Elizabeth G, Menegaz Brian A, Amin Hesham M, Mikos Antonios G, Ludwig Joseph A, 2013. Proc. Natl. Acad. Sci. U.S.A 110(16), 6500–6505. [DOI] [PMC free article] [PubMed] [Google Scholar]
- Galateanu B, Hudita A, Biru EI, Iovu H, Zaharia C, Simsensohn E, Costache M, Petca R-C, Jinga V, 2022b. Polymers 14(9), 1668. [DOI] [PMC free article] [PubMed] [Google Scholar]
- Gao Y, Nguyen DT, Yeo T, Lim SB, Tan WX, Madden LE, Jin L, Long JYK, Aloweni FAB, Liew YJA, 2021a. Sci. Adv 7(21), eabg9614. [DOI] [PMC free article] [PubMed] [Google Scholar]
- Gao Z, Song Y, Hsiao TY, He J, Wang C, Shen J, MacLachlan A, Dai S, Singer BH, Kurabayashi K, 2021b. ACS nano 15(11), 18023–18036. [DOI] [PMC free article] [PubMed] [Google Scholar]
- Goldstein H, Kim A, 1993. J. Immunol 151(12), 6701–6711. [PubMed] [Google Scholar]
- Grivennikov SI, Karin M, 2011. Ann. Rheum. Dis 70(Suppl 1), i104. [DOI] [PubMed] [Google Scholar]
- Han B, Qu C, Park K, Konieczny SF, Korc M, 2016. Cancer Lett. 380(1), 319–329. [DOI] [PMC free article] [PubMed] [Google Scholar]
- Hassell BA, Goyal G, Lee E, Sontheimer-Phelps A, Levy O, Chen CS, Ingber DE, 2017. Cell Rep. 21(2), 508–516. [DOI] [PubMed] [Google Scholar]
- Henke E, Nandigama R, Ergün S, 2020. Front. mol. biosci 6: 160. [DOI] [PMC free article] [PubMed] [Google Scholar]
- Hong Y, Wang Y, Zhu Y, 2020. Electrochimica Acta 364, 137328. [Google Scholar]
- Horikawa K, Yamada Y, Matsuda T, Kobayashi K, Hashimoto M, Matsu-ura T, Miyawaki A, Michikawa T, Mikoshiba K, Nagai T, 2010. Nat. Methods 7(9), 729–732. [DOI] [PubMed] [Google Scholar]
- Hsu T-H, Xiao J-L, Tsao Y-W, Kao Y-L, Huang S-H, Liao W-Y, Lee C-H, 2011. Lab on a Chip 11(10), 1808–1814. [DOI] [PubMed] [Google Scholar]
- Hsu TH, Kao YL, Lin WL, Xiao JL, Kuo PL, Wu CW, Liao WY, Lee CH, 2012. Integr. Biol. (Camb.) 4(2), 177–182. [DOI] [PubMed] [Google Scholar]
- Hu T, Chitnis N, Monos D, Dinh A, 2021. Hum. Immunol 82(11), 801–811. [DOI] [PubMed] [Google Scholar]
- Hu Z, Cao Y, Galan EA, Hao L, Zhao H, Tang J, Sang G, Wang H, Xu B, Ma S, 2022. ACS Biomater. Sci. Eng 8(3), 1215–1225. [DOI] [PubMed] [Google Scholar]
- Huang CP, Lu J, Seon H, Lee AP, Flanagan LA, Kim H-Y, Putnam AJ, Jeon NL, 2009. Lab on a Chip 9(12), 1740–1748. [DOI] [PMC free article] [PubMed] [Google Scholar]
- Huang L, Ma F, Chapman A, Lu S, Xie XS, 2015. Annu. Rev. Genom. Hum. Genet 16, 79–102. [DOI] [PubMed] [Google Scholar]
- Itoh RE, Kurokawa K, Fujioka A, Sharma A, Mayer BJ, Matsuda M, 2005. Exp. Cell Res 307(1), 142–152. [DOI] [PubMed] [Google Scholar]
- Jahanban-Esfahlan R, de la Guardia M, Ahmadi D, Yousefi B, 2018. J. Cell. Physiol 233(3), 2019–2031. [DOI] [PubMed] [Google Scholar]
- Jahanban-Esfahlan R, Seidi K, Manjili MH, Jahanban-Esfahlan A, Javaheri T, Zare P, 2019. Cancers (Basel) 11(8). [DOI] [PMC free article] [PubMed] [Google Scholar]
- Javed I, He J, Kakinen A, Faridi A, Yang W, Davis TP, Ke PC, Chen P, 2019. ACS Appl. Mater. Interfaces 11(11), 10462–10471. [DOI] [PubMed] [Google Scholar]
- Jen C-P, Hsiao J-H, Maslov NA, 2011. Sensors 12(1), 347–358. [DOI] [PMC free article] [PubMed] [Google Scholar]
- Jeon H, Kim S, Lim G, 2018. Microelectron. Eng 198, 55–72. [Google Scholar]
- Jeon Jessie S, Bersini S, Gilardi M, Dubini G, Charest Joseph L, Moretti M, Kamm Roger D, 2015. Proc. Natl. Acad. Sci. U.S.A 112(1), 214–219. [DOI] [PMC free article] [PubMed] [Google Scholar]
- Jeong SY, Lee JH, Shin Y, Chung S, Kuh HJ, 2016. PLoS One 11(7), e0159013. [DOI] [PMC free article] [PubMed] [Google Scholar]
- Juan-Colaás J, Hitchcock IS, Coles M, Johnson S, Krauss TF, 2018. Proc. Natl. Acad. Sci. U.S.A 115(52), 13204–13209. [DOI] [PMC free article] [PubMed] [Google Scholar]
- Kameda Y, Chuaychob S, Tanaka M, Liu Y, Okada R, Fujimoto K, Nakamura T, Yokokawa R, 2022. Lab on a Chip 22(3), 641–651. [DOI] [PubMed] [Google Scholar]
- Kartikasari AER, Huertas CS, Mitchell A, Plebanski M, 2021. Front. Oncol 11. [DOI] [PMC free article] [PubMed] [Google Scholar]
- Kennedy R, Kuvshinov D, Sdrolia A, Kuvshinova E, Hilton K, Crank S, Beavis AW, Green V, Greenman J, 2019. Sci. Rep 9(1), 6327. [DOI] [PMC free article] [PubMed] [Google Scholar]
- Khalifian S, Raimondi G, Brandacher G, 2015. J. Invest. Dermatol 135(4), 1–5. [DOI] [PubMed] [Google Scholar]
- Khuon S, Liang L, Dettman RW, Sporn PH, Wysolmerski RB, Chew T-L, 2010. J. Cell Sci 123(3), 431–440. [DOI] [PMC free article] [PubMed] [Google Scholar]
- Kim C, Kasuya J, Jeon J, Chung S, Kamm RD, 2015. Lab on a Chip 15(1), 301–310. [DOI] [PMC free article] [PubMed] [Google Scholar]
- Kim S, Lee H, Chung M, Jeon NL, 2013. Lab on a Chip 13(8), 1489–1500. [DOI] [PubMed] [Google Scholar]
- Kumar V, Varghese S, 2019. Adv. Healthc. Mater 8(4), 1801198. [DOI] [PMC free article] [PubMed] [Google Scholar]
- Kwak B, Ozcelikkale A, Shin CS, Park K, Han B, 2014. J. Control. Release 194, 157–167. [DOI] [PMC free article] [PubMed] [Google Scholar]
- Labani-Motlagh A, Ashja-Mahdavi M, Loskog A, 2020. Front. immunol 11. [DOI] [PMC free article] [PubMed] [Google Scholar]
- Lai BFL, Lu RXZ, Hu Y, Davenport Huyer L, Dou W, Wang EY, Radulovich N, Tsao MS, Sun Y, Radisic M, 2020. Adv. Funct. Mater 30(48), 2000545. [DOI] [PMC free article] [PubMed] [Google Scholar]
- Lam AJ, St-Pierre F, Gong Y, Marshall JD, Cranfill PJ, Baird MA, McKeown MR, Wiedenmann J, Davidson MW, Schnitzer MJ, 2012. Nat. Methods 9(10), 1005–1012. [DOI] [PMC free article] [PubMed] [Google Scholar]
- Lee J-H, Kim S-K, Khawar IA, Jeong S-Y, Chung S, Kuh H-J, 2018a. J. Exp. Clin. Cancer Res 37(1), 4. [DOI] [PMC free article] [PubMed] [Google Scholar]
- Lee J-J, Jeong KJ, Hashimoto M, Kwon AH, Rwei A, Shankarappa SA, Tsui JH, Kohane DS, 2014. Nano Lett. 14(1), 1–5. [DOI] [PubMed] [Google Scholar]
- Lee S, Choi KY, Chung H, Ryu JH, Lee A, Koo H, Youn I-C, Park JH, Kim I-S, Kim SY, 2011. Bioconjug. Chem 22(2), 125–131. [DOI] [PubMed] [Google Scholar]
- Leung CM, de Haan P, Ronaldson-Bouchard K, Kim GA, Ko J, Rho HS, Chen Z, Habibovic P, Jeon NL, Takayama S, Shuler ML, Vunjak-Novakovic G, Frey O, Verpoorte E, Toh YC, 2022. Nat. Rev. Dis. Primers 2(1), 33. [Google Scholar]
- Lee Y, Song H, Ahn H, Choi J.-r., Kim K, 2018b. Sens. Actuators B Chem 274, 595–600. [Google Scholar]
- Li W, Ng JM, Wong CC, Ng EKW, Yu J, 2018. Oncogene 37(36), 4903–4920. [DOI] [PMC free article] [PubMed] [Google Scholar]
- Li X, Soler M, Özdemir CI, Belushkin A, Yesilköy F, Altug H, 2017. Lab on a Chip 17(13), 2208–2217. [DOI] [PubMed] [Google Scholar]
- Liu C, Lei T, Ino K, Matsue T, Tao N, Li C-Z, 2012. Chem. Commun 48(84), 10389–10391. [DOI] [PMC free article] [PubMed] [Google Scholar]
- Liu T, Lin B, Qin J, 2010. Lab on a Chip 10(13), 1671–1677. [DOI] [PubMed] [Google Scholar]
- Liu X, Fang J, Huang S, Wu X, Xie X, Wang J, Liu F, Zhang M, Peng Z, Hu N, 2021. Microsyst. Nanoeng 7(1), 50. [DOI] [PMC free article] [PubMed] [Google Scholar]
- Liu Y-L, Zhao Y-X, Li Y-B, Ye Z-Y, Zhang J-J, Zhou Y, Gao T-Y, Li F, 2022. J. Anal. Test, 1–15. [Google Scholar]
- Liu Y, Matharu Z, Rahimian A, Revzin A, 2015. Biosens. Bioelectron 64, 43–50. [DOI] [PubMed] [Google Scholar]
- Lo Y-J, Lei U, 2019. Micromachines 10(4), 247. [DOI] [PMC free article] [PubMed] [Google Scholar]
- Luker GD, Luker KE, 2011. Luciferase Protein Complementation Assays for Bioluminescence Imaging of Cells and Mice. In: Shah K (Ed.), Molecular Imaging: Methods and Protocols, pp. 29–43. Humana Press, Totowa, NJ. [DOI] [PMC free article] [PubMed] [Google Scholar]
- Ma C, Witkowski Matthew T, Harris J, Dolgalev I, Sreeram S, Qian W, Tong J, Chen X, Aifantis I, Chen W, 2020. Sci. Adv 6(44), eaba5536. [DOI] [PMC free article] [PubMed] [Google Scholar]
- Maïno N, Hauling T, Cappi G, Madaboosi N, Dupouy D, Nilsson M, 2019. Sci. Rep 9(1), 1–10. [DOI] [PMC free article] [PubMed] [Google Scholar]
- Manzoor AA, Romita L, Hwang DK, 2021. Can. J. Chem. Eng 99(1), 61–96. [Google Scholar]
- Marvin JS, Scholl B, Wilson DE, Podgorski K, Kazemipour A, Müller JA, Schoch S, Quiroz FJU, Rebola N, Bao H, 2018. Nat. Methods 15(11), 936–939. [DOI] [PMC free article] [PubMed] [Google Scholar]
- Mattei F, Schiavoni G, De Ninno A, Lucarini V, Sestili P, Sistigu A, Fragale A, Sanchez M, Spada M, Gerardino A, Belardelli F, Businaro L, Gabriele L, 2014. J. Immunotoxicol 11(4), 337–346. [DOI] [PubMed] [Google Scholar]
- Matuła K, Rivello F, Huck WT, 2020. Adv. Biosyst 4(1), 1900188. [DOI] [PubMed] [Google Scholar]
- Mazutis L, Gilbert J, Ung WL, Weitz DA, Griffiths AD, Heyman JA, 2013. Nat. Protoc 8(5), 870–891. [DOI] [PMC free article] [PubMed] [Google Scholar]
- McDonald MP, Gemeinhardt A, König K, Piliarik M, Schaffer S, Völkl S, Aigner M, Mackensen A, Sandoghdar V, 2018. Nano Lett. 18(1), 513–519. [DOI] [PubMed] [Google Scholar]
- Menon NV, Chuah YJ, Cao B, Lim M, Kang Y, 2014. Biomicrofluidics 8(6), 064118. [DOI] [PMC free article] [PubMed] [Google Scholar]
- Mi S, Du Z, Xu Y, Wu Z, Qian X, Zhang M, Sun W, 2016. Sci. Rep 6(1), 35544. [DOI] [PMC free article] [PubMed] [Google Scholar]
- Miller CP, Tsuchida C, Zheng Y, Himmelfarb J, Akilesh S, 2018. Neoplasia 20(6), 610–620. [DOI] [PMC free article] [PubMed] [Google Scholar]
- Milotti E, Fredrich T, Chignola R, Rieger H, 2020. Adv Exp Med Biol 1259, 53–76. [DOI] [PubMed] [Google Scholar]
- Misun PM, Rothe J, Schmid YRF, Hierlemann A, Frey O, 2016. Microsyst. Nanoeng 2(1), 1–9. [DOI] [PMC free article] [PubMed] [Google Scholar]
- Moore N, Doty D, Zielstorff M, Kariv I, Moy LY, Gimbel A, Chevillet JR, Lowry N, Santos J, Mott V, Kratchman L, Lau T, Addona G, Chen H, Borenstein JT, 2018. Lab on a Chip 18(13), 1844–1858. [DOI] [PubMed] [Google Scholar]
- Nagaraju S, Truong D, Mouneimne G, Nikkhah M, 2018. Adv. Healthc. Mater 7(9), e1701257. [DOI] [PubMed] [Google Scholar]
- Nakajima T, Mitsunaga M, Bander NH, Heston WD, Choyke PL, Kobayashi H, 2011. Bioconjug. Chem 22(8), 1700–1705. [DOI] [PMC free article] [PubMed] [Google Scholar]
- Nashimoto Y, Hayashi T, Kunita I, Nakamasu A, Torisawa YS, Nakayama M, Takigawa-Imamura H, Kotera H, Nishiyama K, Miura T, Yokokawa R, 2017. Integr. Biol. (Camb.) 9(6), 506–518. [DOI] [PubMed] [Google Scholar]
- Nashimoto Y, Okada R, Hanada S, Arima Y, Nishiyama K, Miura T, Yokokawa R, 2020. Biomaterials 229, 119547. [DOI] [PubMed] [Google Scholar]
- Nguyen HQ, Chattoraj S, Castillo D, Nguyen SC, Nir G, Lioutas A, Hershberg EA, Martins N, Reginato PL, Hannan M, 2020. Nat. Methods 17(8), 822–832. [DOI] [PMC free article] [PubMed] [Google Scholar]
- Nguyen M, De Ninno A, Mencattini A, Mermet-Meillon F, Fornabaio G, Evans SS, Cossutta M, Khira Y, Han W, Sirven P, Pelon F, Di Giuseppe D, Bertani FR, Gerardino A, Yamada A, Descroix S, Soumelis V, Mechta-Grigoriou F, Zalcman G, Camonis J, Martinelli E, Businaro L, Parrini MC, 2018. Cell Rep. 25(13), 3884–3893.e3883. [DOI] [PubMed] [Google Scholar]
- Otieno BA, Krause CE, Jones AL, Kremer RB, Rusling JF, 2016. Anal. Chem 88(18), 9269–9275. [DOI] [PMC free article] [PubMed] [Google Scholar]
- Palacio-Castañeda V, Kooijman L, Venzac B, Verdurmen WPR, Le Gac S, 2020. Micromachines 11(4), 382. [DOI] [PMC free article] [PubMed] [Google Scholar]
- Papetti M, Herman IM, 2002. Am. J. Physiol. Cell Physiol 282(5), C947–970. [DOI] [PubMed] [Google Scholar]
- Parlato S, De Ninno A, Molfetta R, Toschi E, Salerno D, Mencattini A, Romagnoli G, Fragale A, Roccazzello L, Buoncervello M, Canini I, Bentivegna E, Falchi M, Bertani FR, Gerardino A, Martinelli E, Natale C, Paolini R, Businaro L, Gabriele L, 2017. Sci. Rep 7(1), 1093. [DOI] [PMC free article] [PubMed] [Google Scholar]
- Patel H, Nilendu P, Jahagirdar D, Pal JK, Sharma NK, 2018. Cancer Biol. Ther 19(1), 3–12. [DOI] [PMC free article] [PubMed] [Google Scholar]
- Payne AC, Chiang ZD, Reginato PL, Mangiameli SM, Murray EM, Yao C-C, Markoulaki S, Earl AS, Labade AS, Jaenisch R, 2021. Science 371(6532), eaay3446. [DOI] [PMC free article] [PubMed] [Google Scholar]
- Prabhakar P, Sen RK, Dwivedi N, Khan R, Solanki PR, Srivastava AK, Dhand C, 2021. Front. Nanotechnol 3, 609355. [Google Scholar]
- Privorotskaya N, Liu Y-S, Lee J, Zeng H, Carlisle JA, Radadia A, Millet L, Bashir R, King WP, 2010. Lab on a Chip 10(9), 1135–1141. [DOI] [PubMed] [Google Scholar]
- Qi X, Carberry DM, Cai C, Hu S, Yuan Z, Rubinsztein-Dunlop H, Guo J, 2017. Biomed. Opt. Express 8(2), 934–942. [DOI] [PMC free article] [PubMed] [Google Scholar]
- Qin D, Xia Y, Whitesides GM, 2010. Nat. Protoc 5(3), 491–502. [DOI] [PubMed] [Google Scholar]
- Ren K, Zhou J, Wu H, 2013. Acc. Chem. Res 46(11), 2396–2406. [DOI] [PubMed] [Google Scholar]
- Riahi R, Shaegh SAM, Ghaderi M, Zhang YS, Shin SR, Aleman J, Massa S, Kim D, Dokmeci MR, Khademhosseini A, 2016. Sci. Rep 6(1), 1–14. [DOI] [PMC free article] [PubMed] [Google Scholar]
- Ribeiro Franco PI, Rodrigues AP, de Menezes LB, Pacheco Miguel M, 2020. Pathol. Res. Pract 216(1), 152729. [DOI] [PubMed] [Google Scholar]
- Ronkainen NJ, Halsall HB, Heineman WR, 2010. Chem. Soc. Rev 39(5), 1747–1763. [DOI] [PubMed] [Google Scholar]
- San Martin A, Ceballo S, Baeza-Lehnert F, Lerchundi R, Valdebenito R, Contreras-Baeza Y, Alegria K, Barros LF, 2014. PLoS One 9(1), e85780. [DOI] [PMC free article] [PubMed] [Google Scholar]
- San Martín A, Ceballo S, Ruminot I, Lerchundi R, Frommer WB, Barros LF, 2013. PLoS One 8(2), e57712. [DOI] [PMC free article] [PubMed] [Google Scholar]
- Segundo-Val IS, Sanz-Lozano CS, 2016. Methods Mol. Biol 1434, 29–43. [DOI] [PubMed] [Google Scholar]
- Seidi K, Neubauer HA, Moriggl R, Jahanban-Esfahlan R, Javaheri T, 2018. J. Control. Release 275, 142–161. [DOI] [PubMed] [Google Scholar]
- Shang M, Soon RH, Lim CT, Khoo BL, Han J, 2019. Lab on a Chip 19(3), 369–386. [DOI] [PubMed] [Google Scholar]
- Shapovalova M, Lee JK, Li Y, Vander Griend DJ, Coleman IM, Nelson PS, Dehm SM, LeBeau AM, 2019. Cancer Res. 79(21), 5668–5680. [DOI] [PMC free article] [PubMed] [Google Scholar]
- Shi R, Tang Y-Q, Miao H, 2020. MedComm 1(1), 47–68. [DOI] [PMC free article] [PubMed] [Google Scholar]
- Shin SR, Kilic T, Zhang YS, Avci H, Hu N, Kim D, Branco C, Aleman J, Massa S, Silvestri A, 2017. Adv. Sci 4(5), 1600522. [DOI] [PMC free article] [PubMed] [Google Scholar]
- Shin Y, Han S, Chung E, Chung S, 2014. Integr. Biol 6(7), 654–661. [DOI] [PubMed] [Google Scholar]
- Shirasaki Y, Yamagishi M, Suzuki N, Izawa K, Nakahara A, Mizuno J, Shoji S, Heike T, Harada Y, Nishikomori R, 2014. Sci. Rep 4(1), 1–8. [DOI] [PMC free article] [PubMed] [Google Scholar]
- Shirure VS, Bi Y, Curtis MB, Lezia A, Goedegebuure MM, Goedegebuure SP, Aft R, Fields RC, George SC, 2018. Lab on a Chip 18(23), 3687–3702. [DOI] [PMC free article] [PubMed] [Google Scholar]
- Shoval H, Karsch-Bluman A, Brill-Karniely Y, Stern T, Zamir G, Hubert A, Benny O, 2017. Sci. Rep 7(1), 10428. [DOI] [PMC free article] [PubMed] [Google Scholar]
- Sokol ES, Miller DH, Breggia A, Spencer KC, Arendt LM, Gupta PB, 2016. Breast Cancer Res. 18(1), 19. [DOI] [PMC free article] [PubMed] [Google Scholar]
- Soler M, Belushkin A, Cavallini A, Kebbi-Beghdadi C, Greub G, Altug H, 2017. Biosens. Bioelectron 94, 560–567. [DOI] [PubMed] [Google Scholar]
- Song J, Miermont A, Lim CT, Kamm RD, 2018. Sci. Rep 8(1), 17949. [DOI] [PMC free article] [PubMed] [Google Scholar]
- Sun W, Luo Z, Lee J, Kim H-J, Lee K, Tebon P, Feng Y, Dokmeci MR, Sengupta S, Khademhosseini A, 2019. Adv. Healthc. Mater 8(4), 1801363. [DOI] [PMC free article] [PubMed] [Google Scholar]
- Sung KE, Yang N, Pehlke C, Keely PJ, Eliceiri KW, Friedl A, Beebe DJ, 2011. Integr. Biol 3(4), 439–450. [DOI] [PMC free article] [PubMed] [Google Scholar]
- Takanaga H, Chaudhuri B, Frommer WB, 2008. Biochim. Biophys. Acta - Biomembr 1778(4), 1091–1099. [DOI] [PMC free article] [PubMed] [Google Scholar]
- Thiagarajan PS, Hitomi M, Hale JS, Alvarado AG, Otvos B, Sinyuk M, Stoltz K, Wiechert A, Mulkearns-Hubert E, Jarrar AM, 2015. Stem Cells 33(7), 2114–2125. [DOI] [PMC free article] [PubMed] [Google Scholar]
- Truffi M, Sorrentino L, Corsi F, 2020. Fibroblasts in the Tumor Microenvironment. In: Birbrair A (Ed.), Tumor Microenvironment: Non-Hematopoietic Cells, pp. 15–29. Springer International Publishing, Cham. [DOI] [PubMed] [Google Scholar]
- Truong D, Puleo J, Llave A, Mouneimne G, Kamm RD, Nikkhah M, 2016. Sci. Rep 6(1), 34094. [DOI] [PMC free article] [PubMed] [Google Scholar]
- Tsai H-F, Trubelja A, Shen AQ, Bao G, 2017. J. R. Soc. Interface 14(131), 20170137. [DOI] [PMC free article] [PubMed] [Google Scholar]
- Tsao AS, Scagliotti GV, Bunn PA Jr., Carbone DP, Warren GW, Bai C, de Koning HJ, Yousaf-Khan AU, McWilliams A, Tsao MS, Adusumilli PS, Rami-Porta R, Asamura H, Van Schil PE, Darling GE, Ramalingam SS, Gomez DR, Rosenzweig KE, Zimmermann S, Peters S, Ignatius Ou SH, Reungwetwattana T, Jänne PA, Mok TS, Wakelee HA, Pirker R, Mazières J, Brahmer JR, Zhou Y, Herbst RS, Papadimitrakopoulou VA, Redman MW, Wynes MW, Gandara DR, Kelly RJ, Hirsch FR, Pass HI, 2016. J. Thorac. Oncol 11(5), 613–638. [DOI] [PubMed] [Google Scholar]
- Ungefroren H, Sebens S, Seidl D, Lehnert H, Hass R, 2011. Cell Commun Signal 9, 18. [DOI] [PMC free article] [PubMed] [Google Scholar]
- Urano Y, Asanuma D, Hama Y, Koyama Y, Barrett T, Kamiya M, Nagano T, Watanabe T, Hasegawa A, Choyke PL, 2009. Nat. Med 15(1), 104–109. [DOI] [PMC free article] [PubMed] [Google Scholar]
- Urbansky A, Olm F, Scheding S, Laurell T, Lenshof A, 2019. Lab on a Chip 19(8), 1406–1416. [DOI] [PubMed] [Google Scholar]
- Van Unen J, Reinhard NR, Yin T, Wu YI, Postma M, Gadella TW, Goedhart J, 2015. Sci. Rep 5, 14693. [DOI] [PMC free article] [PubMed] [Google Scholar]
- Waldman AD, Fritz JM, Lenardo MJ, 2020. Nat. Rev. Immunol 20(11), 651–668. [DOI] [PMC free article] [PubMed] [Google Scholar]
- Wang C, Huang C-H, Gao Z, Shen J, He J, MacLachlan A, Ma C, Chang Y, Yang W, Cai Y, 2021. ACS sensors 6(9), 3308–3319. [DOI] [PMC free article] [PubMed] [Google Scholar]
- Wang J, Chen C, Wang L, Xie M, Ge X, Wu S, He Y, Mou X, Ye C, Sun Y, 2022a. Front. Oncol, 1382. [DOI] [PMC free article] [PubMed] [Google Scholar]
- Wang JD, Douville NJ, Takayama S, ElSayed M, 2012. Ann. Biomed. Eng 40(9), 1862–1873. [DOI] [PubMed] [Google Scholar]
- Wang X, Liu Y, Liu H, Pan W, Ren J, Zheng X, Tan Y, Chen Z, Deng Y, He N, 2022b. MedComm 3(1), e116. [DOI] [PMC free article] [PubMed] [Google Scholar]
- Wang Y, Cuzzucoli F, Escobar A, Lu S, Liang L, Wang S, 2018. Nanotechnology 29(33), 332001. [DOI] [PubMed] [Google Scholar]
- Watanabe R, Sato K, Hanaoka H, Harada T, Nakajima T, Kim I, Paik CH, Wu AM, Choyke PL, Kobayashi H, 2014. ACS Med. Chem. Lett 5(4), 411–415. [DOI] [PMC free article] [PubMed] [Google Scholar]
- Weltin A, Slotwinski K, Kieninger J, Moser I, Jobst G, Wego M, Ehret R, Urban GA, 2014. Lab on a Chip 14(1), 138–146. [DOI] [PubMed] [Google Scholar]
- White KA, Kim BN, 2021. Nat. Commun 12(1), 1–8. [DOI] [PMC free article] [PubMed] [Google Scholar]
- Wong ML, Medrano JF, 2005. BioTechniques 39(1), 75–85. [DOI] [PubMed] [Google Scholar]
- Xia C, Fan J, Emanuel G, Hao J, Zhuang X, 2019. Proc. Natl. Acad. Sci. U. S. A 116(39), 19490–19499. [DOI] [PMC free article] [PubMed] [Google Scholar]
- Young EWK, 2013. Integr. Biol 5(9), 1096–1109. [DOI] [PubMed] [Google Scholar]
- Zervantonakis Ioannis K, Hughes-Alford Shannon K, Charest Joseph L, Condeelis John S, Gertler Frank B, Kamm Roger D, 2012. Proc. Natl. Acad. Sci. U.S.A 109(34), 13515–13520. [DOI] [PMC free article] [PubMed] [Google Scholar]
- Zhang Q, Liu T, Qin J, 2012. Lab on a Chip 12(16), 2837–2842. [DOI] [PubMed] [Google Scholar]
- Zhang S, Garcia-D’Angeli A, Brennan JP, Huo Q, 2014. Analyst 139(2), 439–445. [DOI] [PubMed] [Google Scholar]
- Zhang S, Wan Z, Kamm RD, 2021. Lab on a Chip 21(3), 473–488. [DOI] [PMC free article] [PubMed] [Google Scholar]
- Zhang YS, Aleman J, Shin SR, Kilic T, Kim D, Shaegh SAM, Massa S, Riahi R, Chae S, Hu N, 2017. Proc. Natl. Acad. Sci. U.S.A 114(12), E2293–E2302. [DOI] [PMC free article] [PubMed] [Google Scholar]
- Zhao C, Niu L, Wang X, Sun W, 2020a. Bioelectrochemistry 135, 107585. [DOI] [PubMed] [Google Scholar]
- Zhao D, Yin Q, Chang Y, Liu M, 2020b. TrAC, Trends Anal. Chem 122, 115706. [Google Scholar]
- Zhao J, Jin G, Weng G, Li J, Zhu J, Zhao J, 2017. Drug Discovery Today 22(9), 1367–1374. [DOI] [PubMed] [Google Scholar]
- Zhao Y, Yang Y, 2015. Curr. Opin. Biotechnol 31, 86–92. [DOI] [PubMed] [Google Scholar]
- Zheng Y, Sun Y, Yu X, Shao Y, Zhang P, Dai G, Fu J, 2016. Adv. Healthc. Mater 5(9), 1014–1024. [DOI] [PMC free article] [PubMed] [Google Scholar]
- Zhou J, Tang Z, Gao S, Li C, Feng Y, Zhou X, 2020. Front. Oncol 10. [DOI] [PMC free article] [PubMed] [Google Scholar]
- Zhu C, Luo X, Espulgar WV, Koyama S, Kumanogoh A, Saito M, Takamatsu H, Tamiya E, 2020. Micromachines 11(1), 107. [DOI] [PMC free article] [PubMed] [Google Scholar]
- Zou S, Wang C, Liu J, Wang Q, Zhang D, Zhu S, Xu S, Kang M, He S, 2017. Mol. Cells 40(11), 847. [DOI] [PMC free article] [PubMed] [Google Scholar]