

Abstract

Hydrogels have been suggested as novel drug delivery systems for sustained release of therapeutic proteins in various neurological disorders. The main advantage these systems offer is the controlled, prolonged exposure to a therapeutically effective dose of the released drug after a single intracerebral injection. Characterization of controlled release of therapeutics from a hydrogel is generally performed in vitro, as current methods do not allow for in vivo measurements of spatiotemporal distribution and release kinetics of a loaded protein. Importantly, the in vivo environment introduces many additional variables and factors that cannot be effectively simulated under in vitro conditions. To address this, in the present contribution, we developed a noninvasive in vivo magnetic resonance imaging (MRI) method to monitor local protein release from two injected hydrogels of the same chemical composition but different initial water contents. We designed a biodegradable hydrogel formulation composed of low and high concentration thermosensitive polymer and thiolated hyaluronic acid, which is liquid at room temperature and forms a gel due to a combination of physical and chemical cross-linking upon injection at 37 °C. The in vivo protein release kinetics from these gels were assessed by MRI analysis utilizing a model protein labeled with an MR contrast agent, i.e. gadolinium-labeled albumin (74 kDa). As proof of principle, the release kinetics of the hydrogels were first measured with MRI in vitro. Subsequently, the protein loaded hydrogels were administered in male Wistar rat brains and the release in vivo was monitored for 21 days. In vitro, the thermosensitive hydrogels with an initial water content of 81 and 66% released 64 ± 3% and 43 ± 3% of the protein loading, respectively, during the first 6 days at 37 °C. These differences were even more profound in vivo, where the thermosensitive hydrogels released 83 ± 16% and 57 ± 15% of the protein load, respectively, 1 week postinjection. Measurement of volume changes of the gels over time showed that the thermosensitive gel with the higher polymer concentration increased more than 4-fold in size in vivo after 3 weeks, which was substantially different from the in vitro behavior where a volume change of 35% was observed. Our study demonstrates the potential of MRI to noninvasively monitor in vivo intracerebral protein release from a locally administered in situ forming hydrogel, which could aid in the development and optimization of such drug delivery systems for brain disorders.
Keywords: in situ hydrogel, contrast MRI, drug delivery, sustained release, protein release, IVIVR
Introduction
The blood-brain barrier (BBB), part of the vasculature of the central nervous system, is a gateway for selective entry and provides a physical barrier that inhibits the passage of various molecules, including pharmaceutical proteins to the brain.1 Circulating molecules in the blood enter the brain or cerebrospinal fluid (CSF) through the endothelial cells or choroid plexus via several mechanisms: paracellular transportation (small hydrophilic substances), transcellular passive diffusion (small lipophilic substances), solute carrier (SLC) transporters present in the BBB (polar hydrophilic small molecules like amino acids and carbohydrates), and receptor-mediated transporter endocytosis (macromolecular biomolecules such as insulin, transferrin).2−4 Effective treatment of neurological disorders, such as brain tumors and neurodegenerative diseases, depends on the successful delivery of therapeutically active proteins to the brain.5
The concentration of intravenously administered proteins is relatively high directly after injection, which significantly increases the risk of toxicity. Moreover, therapeutic proteins with hydrodynamic radii below the renal filtration thresholds (Mw < 30 kDa) are mostly rapidly eliminated from the circulation.6 Thus, frequent injections are required to obtain therapeutic effects, which often result in undesired side effects.7 To bypass the BBB and to avoid the unfavorable pharmacokinetic properties of many pharmaceutical proteins after intravenous administration, these drugs can be injected intracerebrally to directly reach their target site in the brain with minimal systemic exposure and toxicity.8 However, this invasive approach typically creates a temporary local maximum drug level at the site of administration that decreases in time due to diffusion resulting in subtherapeutic drug levels after a certain time postadministration. To achieve satisfactory long-term treatment response, therapeutic effective tissue concentrations of pharmaceutical proteins should ideally be maintained for prolonged periods of time. For this, the active protein needs to be repeatedly administered in the local (intracerebral) target zone or delivered through a cannula inserted into the brain tissue. These approaches are not only impractical for clinical applications, but also increase the risk of high peak concentrations, possibly causing detrimental neurotoxic effects on brain tissue.9 This is particularly relevant for cerebral pathologies like stroke, where tissue surrounding the primary lesion can undergo secondary neurodegenerative changes over prolonged periods of time.10,11
A strategy for obtaining therapeutically effective drug concentrations in the brain for prolonged times is the use of implantable biomaterials with controlled polymer degradation that allows for radial diffusion of the loaded drug.12−14 Such implants can be based on hydrogels that are under investigation for various biomedical applications, including regenerative medicine and controlled drug release.15−17 These three-dimensional networks of hydrophilic polymers absorb and maintain large amounts of water, which create possibilities for neural tissue engineering by providing a way to recreate the extracellular matrix (ECM).18,19 The versatile nature of hydrogels also allows for drug/protein loading and tailored release depending on diffusivity of the loaded protein in the hydrogel matrix. This in turn depends on the size of the protein and the mesh size of the hydrogel network, e.g., its cross-link density.20 The latter, however, can change in time due to swelling and degradation of the matrix. Thus, local cerebral injection of a hydrogel loaded with a drug/protein may bypass the BBB and create a local depot for controlled release.
In the past decades, stimuli-sensitive hydrogels, which are responsive to environmental stimuli such as chemical substances, temperature, pH, pressure, electric field, etc., have gained increasing attention.21,22 Among the stimuli-sensitive hydrogels, in situ gel-forming hydrogels are attractive drug delivery systems for treatment of injuries and diseases of the central nervous system (CNS). These gels are in a liquid state before administration but form a three-dimensional structure after injection into, for example, the brain.23,24 Polymers exhibiting lower critical solution temperature (LCST) behavior with their cloud point preferably between room and body temperature are soluble in water at low temperature, and self-assemble at elevated temperatures, making them suitable for the design of thermosensitive hydrogels.25 As many pathological conditions affecting the brain require prolonged protection against ongoing injurious events or enduring promotion of recovery processes, hydrogel-based drug delivery systems are an attractive approach for local controlled release of therapeutic doses of protective and trophic factors. The effectiveness of the three-dimensional porous structure of thermosensitive hydrogels to load and release drugs and growth factors in the central nervous system (CNS) for tissue regeneration has been investigated in a number of studies.26−29
The potential of a drug delivery system depends on the precise tailoring of the design and release properties, in order to sustain the presence of the therapeutic compound at the site of administration, while at the same time maintaining biocompatibility. Thus, adequate measurement and knowledge of release kinetics is a crucial step toward clinical translation. Conventional in vitro analyses of drug release, particularly protein-loaded hydrogels, often involve placing samples of the material under near sink conditions, i.e., phosphate-buffered saline (PBS) on top of the gel and withdrawing samples from the release medium at different time intervals, followed by replacement with fresh PBS conditions.30 Subsequently, the drug concentration in the withdrawn release samples is determined by Ultra Performance Liquid Chromatography (UPLC)31 or UV–visible spectrophotometry.32 Also, more advanced approaches, such as fluorescence recovery after photobleaching, have been implemented to study the mobility of proteins in hydrogel matrices.33,34 These methods are, however, only suitable for characterization of protein release under well-defined in vitro conditions. Thus, there is a need for methods that allow the evaluation of protein drug delivery from locally injected depots in a noninvasive way.
Magnetic resonance imaging (MRI) is a versatile imaging modality featured by excellent soft-tissue contrast and no constraints on imaging depth, which can offer the opportunity for in vivo measurement of the distribution or release of locally delivered drugs, as well as their effects on tissue structure and function.35,36 For example, local drug release after systemic administration of thermosensitive liposomes loaded with a drug-MRI contrast agent complex has been successfully evaluated in tumor-bearing mice, where transient MRI contrast enhancement after focused hyperthermia provided information on the location and timing of triggered content release.37 Besides monitoring drug release, MRI can also be applied to detect changes in hydrogel volume, e.g. due to variation in environmental conditions, such as temperature, pH, light, electric field, and pressure,38 or as a result of degradation and subsequent swelling of hydrogel material.39
The objective of the present study was to establish an MRI method for in vivo monitoring of hydrogel characteristics, protein release and possible tissue responses following intracerebral injection of hydrogels. To this end, we injected two thermosensitive hydrogels of the same chemical composition but of different initial water content31 in the brain of rats. Albumin, which has a molecular weight (66 kDa)40 comparable to many growth factors that are currently under investigation for treatment of CNS diseases, e.g. angiopoietins,41 was chosen as the model protein. To enable serial MRI-based release monitoring, albumin labeled with the paramagnetic contrast agent gadolinium, i.e. gadolinium-labeled albumin (74 kDa), was loaded in the hydrogels. Importantly, hydrogel volume changes and tissue status were monitored with structural MRI.
Materials and Methods
1.1. Hydrogel Formation
All commercial chemicals were obtained from Sigma-Aldrich (Zwijndrecht, The Netherlands) and used as received unless indicated otherwise. Hyaluronic acid (HA, 31 kDa) was supplied by Lifecore Biomedical (Chaska, MN, USA) and thiolated as described previously,31 resulting in a degree of thiolation of 60% (HA-SH, structure shown in Scheme 1). The ABA-triblock copolymer consisting of a poly(ethylene glycol) (PEG, 10 kDa) midblock, flanked by thermosensitive blocks of partially acrylated N-(2-hydroxypropyl) methacrylamide-mono/dilactate (pHPMAmlac) (mono/dilactate molar ratio = 75:25) outer blocks was synthesized according to previously described methods (structure shown in Scheme 2).31,33 The degree of acrylation was 15%, referring to the percentage of OH side groups that was functionalized by acrylate moieties. The number-average molecular weight (Mn) of the ABA-triblock polymer, determined by 1H NMR (DMSO), was 38.8 kDa. This polymer has an LCST of 15 °C, which means that upon heating an aqueous solution of this ABA-triblock polymer, abbreviated as pHPta, and HA-SH above the LCST to 37 °C, a gel is formed which is stabilized over time by Michael type addition reaction between thiol groups of HA-SH and acrylate groups of the thermosensitive pHPta. Once formed, the hydrogel degrades over time under physiological conditions due to the presence of hydrolytically sensitive ester bonds in the cross-links of the gel.31
Scheme 1. Chemical Structure of Partially Thiolated Hyaluronic Acid (HA-SH).

The degree of thiolation was 60%.
Scheme 2. Chemical Structure of ABA-Triblock Copolymer Based on a Polyethylene Glycol (PEG10000) B-Block Flanked by Two Acrylated Poly(N-(2-hydroxypropyl) Methacrylamide Mono/Dilactate) (pHPMA-lac) A-Blocks.

Characteristics of the A-blocks: Mn was 14 kDa as determined by 1H-NMR (DMSO), molar ratio of mono/dilactate was 75:25 and the degree of acrylation was 15%. The average molecular weight (Mn) of the ABA-triblock polymer (pHPta), determined by 1H-NMR (DMSO), was 38.8 kDa, and the cloud point was 15 °C.
The thermosensitive hydrogels were prepared by mixing the triblock copolymer in phosphate-buffered saline (PBS; 137 mM NaCl, 10 mM phosphate, 2.7 mM KCl, and a pH of 7.4) with a HA-SH stock solution in the same buffer at 37 °C. The concentrations were 15 wt % triblock and 4 wt % HA-SH for low concentration thermosensitive (LC Thermo) and 27 wt % triblock and 7 wt % HA-SH for high concentration thermosensitive (HC Thermo) hydrogels, corresponding to a molar ratio thiol/acrylate groups of 1:1. The polymers were dissolved and degassed as previously described.31 Solutions of both the triblock and HA-SH were chilled on ice before mixing in order to slow the reaction rate of the thiol groups and the acrylates, thus preventing cross-linking during handling.
To enable MRI-based measurement of release properties, gadolinium-labeled albumin (Galbumin, BioPAL Inc., Worcester, MA, USA) was loaded in the hydrogels. There are approximately 10 to 15 gadolinium atoms per albumin molecule and the final molecular weight is ∼74 kDa. The protein loaded hydrogels were prepared as follows: 2.4 mg (LC Thermo) or 4.2 mg (HC Thermo) of HA-SH were dissolved at 4 °C in 28.2 μL of PBS and 1.8 μL of Galbumin (25 mg/mL) to reach a volume of 30 μL (concentrations of HA-SH and Galbumin were 80 and 1.50 mg/mL, respectively). For the blank gels, HA-SH was dissolved in 30 μL of PBS. Next, 12.0 mg (LC Thermo) or 21.6 mg (HC Thermo) of thermosensitive triblock copolymer was dissolved in 40 μL PBS at 4 °C. Finally, 30 μL of the obtained thermosensitive triblock copolymer solution were transferred into a tube also containing the HA-SH with or without Galbumin solution at 4 °C (30 μL), thus bringing the final Galbumin concentration to 0.75 mg/mL (or 0 mg/mL for blank), and the final LC Thermo or HC Thermo concentration to 150 and 270 mg/mL, respectively. This solution was introduced in either tubes for MR imaging (200 μL test tubes containing 40 μL of hydrogel covered by 160 μL of PBS) or syringes for the in vitro and in vivo release studies, respectively. Gel formation was triggered by bringing the different formulations to 37 °C (in vitro) and incubation for 30 min or by injection into the brain.
1.2. Oscillatory Rheology Measurements
Bulk oscillatory rheology time-sweep measurements were conducted at 37 °C during 5 h on a stress-controlled AR-G2 rheometer equipped with a Peltier plate (TA Instruments, New Castle, Delaware, USA) with a 20 mm steel cone (1°) geometry equipped with a solvent trap, to obtain values for the storage and loss modules (G′ and G″, respectively). Rheological properties were examined at a frequency of 1 Hz at fixed strain of 1%. A solvent trap was used to prevent solvent evaporation. Experiments were repeated three times per sample and representative data are presented.
1.3. Hydrogel Injection in Rat Brain
All animal procedures were approved by the Ethical Committee on Animal Experiments of the University Medical Center Utrecht and Utrecht University, (DEC: 2012.I.11.116) and conducted in accordance with the guidelines set by the European Community Council Directives 86/609/EEC. Experiments are reported in compliance with the ARRIVE 2.0 guidelines (Animal Research: Reporting in Vivo Experiments).
Male Wistar rats (300–330 g) (Harlan, Horst, The Netherlands) were endotracheally intubated and mechanically ventilated with a mixture of 2% isoflurane in 70% air/30% O2 for anesthesia, and placed in a stereotaxic apparatus (Kopf Instrument, Tujunga, CA, USA). The skull was exposed between bregma and lambda. A burr hole was drilled using a dental drill during continuous irrigation with 0.9% saline at room temperature to prevent overheating of the underlying cortex.
Five microliters of each hydrogel formulation was stereotaxically injected over a 10 min period in the right striatum (stereotaxic coordinates from bregma (mm): AP, 0.3; ML, 3.0; DV, 4.0 from dura) using a 26-G Hamilton microsyringe (80330, Hamilton Company, Reno, NV). The following hydrogels were used: LC Thermo (blank: n = 2; Galbumin-loaded: n = 3) and HC Thermo (blank: n = 3; Galbumin-loaded: n = 3). In each case, the needle was left in place after injection for 7 min before being slowly withdrawn.
1.4. Behavioral Assessment
To assess possible adverse effects of intrastriatal hydrogel injection on animal behavior, rats were tested before stereotaxic injection and postinjection at days 2, 7, 14, and 21 using a modified sensorimotor performance score.43 This test was selected due to its sensitivity to detect gross neurologic and behavioral abnormalities. The test has seven limb-placing tasks, which assess forelimb and hindlimb responses to tactile and proprioceptive stimulation. Tactile stimulation was elicited by contacting the limb to a table surface, and proprioceptive stimulation was elicited by pulling down the limb (with limb position in space).44 Scores range from 0 (no deficits) to 9 (severe sensorimotor dysfunction). Behavioral testing was carried out by a person blinded to treatment.
1.5. MR Relaxation and Relaxivity Measurements
MRI measurements were performed on a 4.7 T/40 cm horizontal bore MR system (Agilent Technologies, Santa Clara, CA, USA) with a custom-built solenoid coil (3 cm diameter). T1 values of fresh samples of Galbumin with increasing concentrations (0.093, 0.19, 0.37, 0.74 mg/mL) in PBS or Galbumin in HC Thermo and LC Thermo hydrogels at 37 °C were measured directly after preparation, inside PCR tubes that were placed in a custom-made sample holder, using a Look-Locker-based inversion recovery protocol (8-shot gradient echo EPI; image repetition time (TR) 25 ms; number of images 100; flip angle 5°; inversion time 10 ms; echo time (TE) 4.2 ms; total TR 10000 ms; 100 images per 180° inversion pulse; 2 averages; 3 slices with 0.188 × 0.188 × 1 mm3 resolution).
Longitudinal relaxivity r1 (mM–1 s–1) of the contrast agent in PBS, LC thermo, and HC thermo was calculated from the measured T1 values based on the following equation:
| 1 |
where T1(0) is the T1 value (s) without contrast agent and [CA] is the concentration of the contrast agent (mM).45
1.6. MRI of In Vitro Protein Release From Hydrogels
PCR tubes were filled with 40 μL of hydrogel, equilibrated for 30 min at 37 °C, and subsequently covered with 160 μL of PBS at 37 °C. Next, samples were placed in a custom-made sample holder and transferred into the MR scanner for 24 h monitoring. The sample temperature during MRI and in between MRI sessions was maintained at 37 °C up to 27 days after preparation, and PBS supernatant was refreshed 24 h before each subsequent MRI measurement. The MRI measurements of nonlabeled hydrogel (n = 3) and Galbumin-loaded hydrogel (n = 3) samples from the two hydrogel formulations (LC Thermo and HC Thermo) were performed at 4.7 T in the same solenoid coil used for relaxivity measurements. T1 maps were acquired using the Look-Locker-based inversion recovery protocol that was identical to the protocol used for the in vitro relaxivity measurements (Look-Locker 8-shot gradient echo EPI; image repetition time (TR) 25 ms; number of images 100; flip angle 5°; inversion time 10 ms; echo time (TE) 4.2 ms; total TR 10000 ms; 100 images per 180° inversion pulse; 2 averages; 3 slices with 0.188 × 0.188 × 1 mm3 resolution). Serial T1 maps were continuously acquired from 1.5 to 24 h after preparation to measure Galbumin release. In addition, gradient echo 3D (GE3D) MRI (TR/TE 10/2.57 ms; pulse angle 20°; FOV 40 × 40 × 40 mm3; data matrix 128 × 128 × 256; voxel resolution 0.313 × 0.313 × 0.156 mm3) and spin echo (SE) MRI (TR/TE 500/15.54 ms; 2 averages; 3 slices; voxel resolution 0.188 × 0.18 × 1 mm3) data were collected for assessment of gel volume and delineation of regions-of-interest (ROIs), respectively. Additional T1 maps, GE3D and SE images were acquired at 2, 4, 6, 9, 12, 21, and 27 days after preparation, using identical imaging protocols.
1.7. MRI of In Vivo Protein Release From Intracerebrally Injected Hydrogel Formulations
In vivo MRI measurements were performed on a 4.7 T/40 cm horizontal bore MR system (Agilent Technologies, Santa Clara, CA, USA) with a custom-built (2.5 cm diameter) surface coil for signal reception, and a Helmholtz volume coil for signal transmission. Rats were secured in a MR-compatible cradle using ear bars and a bite bar, and mechanically ventilated with a mixture of 2% isoflurane in 70% air/30% O2 for anesthesia. Blood oxygenation, expired CO2, and heart rate were continuously measured throughout imaging and remained within physiological ranges. The core temperature was maintained at 37.0 ± 0.5 °C. Serial MRI was performed directly after, and 2, 7, 14, and 21 days after stereotaxic hydrogel injection. GE3D MR images, similar to those described for the in vitro release measurement, were collected to localize the injected hydrogel. T1 maps were acquired from a Look-Locker-based inversion recovery protocol with EPI read-out (8 shots; image TR 25 ms; flip angle 5°; inversion time 10 ms; TE 8.75 ms; total TR 6000 ms; 28 images per 180° inversion pulse; 24 averages 5 slices with 0.15 × 0.15 × 1 mm3 resolution).
1.8. Image Processing and Analysis
T1 maps were obtained by voxel-wise three-parameter fitting of the Look-Locker-based inversion recovery magnitude images in Matlab (MathWorks, Natick, MA, USA), using the equation as described by Deichmann and Haasse.67
| 2 |
where T1* is the effective relaxation time, A = M0* and B = M0 + M0*. True T1 values were calculated from the fitted parameters using the following equation:
| 3 |
To assess hydrogel swelling or shrinkage under in vitro and in vivo conditions, hydrogel volumes were automatically segmented using a region-growing algorithm.46 A seed voxel was selected in the center of the gel on GE3D images (in vitro study) or T1 maps (in vivo study), after which neighboring voxels with similar intensity or T1 values were automatically added.47
For the in vitro MRI study, two ROIs were manually outlined on the SE images for each sample, i.e. one inside the hydrogel and one in the PBS supernatant (Figure 1A). For the in vivo MRI study, two ipsilateral ROIs were manually outlined on the multislice R1 (1/T1) maps, i.e. one inside the hydrogel at the injection site (Figure 1B) and one in an adjacent tissue area in the striatum. The border of the ROI inside the hydrogel was kept at 2 voxels distance from the hydrogel’s rim area. The adjacent tissue ROI was drawn at 10 voxels from the outer rim of the hydrogel. These ROIs were mirrored to the contralateral hemisphere. For each time point, mean R1 values for the ROIs were converted to Galbumin concentration, based on the differences in R1 values between the nonlabeled and Galbumin-labeled samples and the corresponding relaxivities according to the following formula:
| 4 |
where R1 is the relaxation rate (1/T1) and r1 is the longitudinal relaxivity in PBS, LC Thermo, or HC Thermo.
Figure 1.
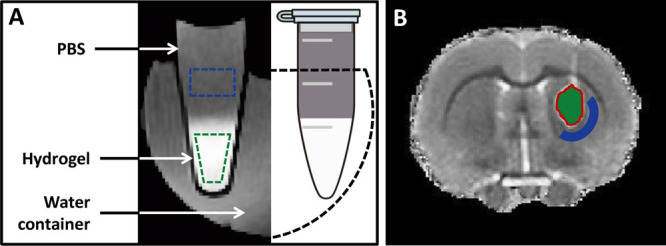
Regions-of-interest on in vitro and in vivo MR images of hydrogels: (A) Illustration of in vitro MRI setup for measurement of the release of Galbumin from hydrogels (identified at the bottom of the tube by high signal intensity on GE3D image) into the supernatant. Regions-of-interest (ROIs) are depicted in the hydrogel (green) and the PBS supernatant (blue). (B) T1 map of a coronal rat brain slice after stereotaxic injection of nonlabeled hydrogel in the right striatum. The corresponding ROIs for further image analysis are overlaid on the image. Green color represents implanted hydrogel; blue is surrounding peri-injection tissue. The red line indicates the 2-voxel wide rim area that was excluded from analyses.
We calculated apparent (measured) and corrected Galbumin release from the hydrogels by taking into account the volume changes in vitro (at 37 °C). Briefly, Galbumin release from the hydrogels (% of initial dose in the gel at the first MRI time point) was calculated from the hydrogel, using the following equation:
| 5 |
where V(t1)gel and V(t)gel are the gel volumes at the first MRI time point t1 and at subsequent time points t, respectively.
The in vitro release rate constants from the gels were assessed by linear regression analysis of the cumulative Galbumin release versus the square root of time.48,49 In order to further establish the nature of the release mechanism, the mesh size of the hydrogels was calculated using the following equation:
| 6 |
where G′ is the storage modulus, Na is the Avogadro’s number, R is the gas constant, and T is the temperature in K.42
An estimate of the diffusion coefficients of Galbumin in the two thermosensitive hydrogels were calculated using a modified form of the Fick’s law for short release times from a slab of gel using the formula:48,49
| 7 |
where Mt/M∞ is the cumulative % released at time t (in seconds), D is the diffusion coefficient of Galbumin within the system, and L represents the hydrogel slab thickness at the bottom of the PCR test tube (L = 5.5 mm).
1.9. Statistical Analysis
The results are presented as the means ± the standard deviation. A one-way repeated measures analysis of variance (ANOVA) followed by Bonferroni’s post-testing was done to identify significant differences between groups for each time point. Statistical analysis of T1 of surrounding ipsilateral and homologous contralateral brain tissue at different time points after unilateral implantation of hydrogels was performed using two-way repeated measures ANOVA with Bonferroni’s post-testing. P values of less than 0.05 were considered statistically significant.
Results and Discussion
2.1. Gel Formation and Rheological Properties
The polymer gelation behavior of the two different Thermo gels was quantitatively assessed by rheological measurements. Figure 2 shows the storage modulus (G′) and loss modulus (G″) of the gels as a function of time, where time = 0 min is the moment of inserting liquid pregel in the rheometer at 37 °C. The storage modulus (G′) increased steeply over time for the HC Thermo gel and reached a value of 6320 Pa at the end of the experiment (after 310 min). The loss modulus (G″) reached a value of 721 Pa. The LC Thermo gel on the other hand, had a more gradual increase of G′ to about 3000 Pa (obtained after 230 min), which remained relatively constant until end point. The loss modulus (G″) reached a value of 461 Pa.
Figure 2.

Rheological properties of the hydrogels. Storage modulus (G′) and loss modulus (G″) of low concentration (LC Thermo) and high concentration (HC Thermo) thermosensitive hydrogels in time measured in situ for 5 h at 37 °C. At time = 0, the liquid pregel samples were inserted in the rheometer.
2.2. Longitudinal Relaxivity
The longitudinal relaxivity of an MR contrast agent represents its potency to generate contrast in T1-weighted MR images. The longitudinal relaxivities (r1) of Galbumin in PBS, LC Thermo, and HC Thermo hydrogels, determined from the dependence of the measured R1 relaxation rate on the contrast agent concentration at 37 °C, were 95.5 ± 5.6, 93.2 ± 0.4, and 63.2 ± 3.9 mM–1 s–1, respectively. Based on the relaxivity measurements, incorporation of 0.75 mg/mL Galbumin in the two hydrogels was selected for an optimal signal-to-noise ratio.
2.3. MRI Volumetry
The swelling of implanted hydrogels may have an impact on their mechanical properties. For CNS delivery, in vivo swelling is a particularly critical confounder that could exacerbate brain injury. Volume changes of hydrogels are structurally predetermined from the nature of the composing polymer chains and their cross-link density, and can also be strongly affected by in vivo environmental conditions, external pH, ionic strength, temperature stimuli, etc.38 Thus, understanding the swelling behavior of hydrogels in vitro as well as in vivo is important from both theoretical and practical points of view for drug delivery applications.
In vitro, the gels were identified as bulk materials deposited on the bottom of the tube with relatively high signal intensity on GE3D images, and covered with PBS with lower signal intensity (see Figure 1A). The high signal intensity of the gels resulted from the Galbumin-induced reduction in T1 relaxation time. The initial volume of each sample in liquid state was 40 μL. The measured volumes after completion of the first MRI session (V0), approximately 70 min after initiation of the gelation process, were 39.6 ± 1.5 and 43.5 ± 1.1 μL for the LC and HC Thermo gels, respectively (Figure 3A). The HC Thermo gel gradually increased in volume and reached a value of 54.7 ± 1.1 μL after 24 h. On the other hand, the LC Thermo gel was dimensionally stable with a volume of 40.4 ± 1.1 μL during the same time frame. At the final MRI time point, i.e. 27 days after preparation, the volumes of the LC Thermo and HC Thermo hydrogels were 41.8 ± 2.0 μL and 61.5 ± 1.9 μL, respectively (Figure 3A).
Figure 3.

MRI volumetry of LC Thermo and HC Thermo gels: (A) in vitro, from day 0 to day 27, and (B) in vivo, from day 0 to day 21. In vitro measurements were started 75 min after the initiation of the gelation process. The first in vivo MRI data was acquired approximately 60 min after the stereotaxic gel injection. Volumetric analysis was performed on GE3D images and T1 maps for the in vitro and in vivo MRI measurements, respectively. Data are shown as mean ± SD (n = 3).
In vivo, at 1 h after stereotaxically injecting 5 μL of hydrogel, the volumes of the LC and HC Thermo gels were 5.3 ± 0.4 and 5.3 ± 0.7 μL, respectively (Figure 3B). In time, the LC Thermo gel increased in volume up to 10.8 ± 0.6 μL 7 days postadministration, followed by a volume decrease to 5.5 ± 0.8 μL by the end of the experiment after 3 weeks, likely due to degradation. The HC Thermo gel volume increased up to day 21 to 21.6 ± 0.5 μL. Thus, our results demonstrate a substantial discrepancy between in vivo and in vitro volume changes. This can probably be explained by differences in the volume (5 μL in vivo versus 40 μL in vitro) and surface area of the gels, as well as by differences in the properties of the environment. In vitro, the hydrogel, which is confined to the bottom of the test tube, had access to the PBS almost exclusively from the top, leaving this the only possible direction to swell. On the other hand, when injected in the brain tissue, it could theoretically expand in every direction with less constraint.
2.4. Assessment of In Vitro Protein Release Using MRI
The release of Galbumin from LC and HC Thermo gels in PBS at 37 °C was evaluated with serial MRI. The first set of GE3D images and corresponding T1 maps were obtained approximately 1 h after initiation of the gelation process.
Figure 4 shows representative GE3D images and T1 maps of the tubes at approximately 1 and 24 h after hydrogel preparation. Nonloaded (blank) hydrogels displayed a slight increase in T1 over time, most probably due to leakage of hydrogel building blocks not incorporated in the formed network into the supernatant. In contrast, Galbumin-loaded hydrogels showed a more substantial increase in T1 as a function of time, which is due to release of Galbumin from the hydrogel.
Figure 4.

MRI of protein release from in vitro hydrogel samples: GE3D images (top) and T1 maps (bottom) of PCR tubes filled with 40 μL of Galbumin-loaded and nonloaded (blank) LC Thermo and HC Thermo gels, covered with 160 μL of PBS. The images were acquired 1 (left) and 24 (right) h after gelation. The signal intensity of the supernatant increased in GE3D images and T1 values in supernatant decreased (T1 maps) with time as a result of Galbumin release (white arrows).
The released Galbumin from the gels in % of the initial loading was calculated from the T1 values using formulas 4 and 5 (Materials and Methods, section 1.8). Figure 5 shows the release profile of the gels, where LC Thermo gel had a faster release rate.
Figure 5.

In vitro release of Galbumin from the LC and HC hydrogels: in vitro cumulative release (%) of Galbumin from the LC Thermo and HC Thermo gels at 37 °C over 27 days after gelation. Each point represents the mean value ± SD (n = 3).
The first 24 h showed a rapid release of Galbumin from both hydrogels, where 38 ± 6% of the Galbumin content in the LC Thermo gel and 25 ± 1% of that in HC Thermo gel was discharged. PBS in the tubes was refreshed thereafter 24 h before each scan in order to prevent any effect of increasing Galbumin concentration in the medium on the free diffusion from the gel. During the following days, the concentration of Galbumin in the thermosensitive hydrogels progressively decreased, corresponding with 64 ± 3% and 43 ± 3% release of their initial load from the LC and HC Thermo gel, respectively at day 6. After that, the release seemed to slow down, and at the end point, day 27, the Galbumin released was 71 ± 2% for LC Thermo and 50 ± 6.0% for HC Thermo gels. The residual amount of Galbumin at day 27 may probably be explained by the formation of chemical bonds between Galbumin and the hydrogel. Free thiol groups (HA-SH) and acrylates react spontaneously. However, in the presence of a protein, such as Galbumin, the acrylates may also react partially (with less affinity) with the amino groups of the protein. The higher the polymer concentration, the more free acrylates available to react with Galbumin, which may explain the differences in residual Galbumin amounts between LC and HC Thermo gels.
The cumulative fraction of Galbumin released from the gel into the supernatant was calculated with eq 5, and scaled linearly with the square root of time (R2 > 0.98) over the first 24 h after gelation (Figure 6). Linear correlation with the square root of time reflects first order kinetics, signifying that the release is governed predominantly by diffusion.49,50 In the first 24 h, release rate constants of Galbumin from LC Thermo and HC Thermo were 10.3 ± 0.3 and 7.5 ± 0.2% per hour1/2, respectively. Diffusion of Galbumin was significantly faster from the LC Thermo gel as compared to the HC Thermo gel (F(DFn, DFd) = F(1, 72) = 1105, p < 0.0001).
Figure 6.

In vitroGalbumin release from the hydrogels at 37 °C: Galbumin concentration of LC Thermo and HC Thermo as a function of the square root of time up to 24 h after gelation. Each point represents the mean of three samples. The lines represent the linear fit of the data.
The diffusion based release mechanism was verified by calculating the mesh size of the hydrogel and comparing it with the size of albumin, using eq 6. Based on the approximate G′ value of 3.0 and 6.3 kPa for LC Thermo and HC Thermo, respectively, we estimated a mesh size of 11.3 and 8.8 nm. The mean hydrodynamic diameter of albumin is 7.2 nm,51 which is marginally smaller than the mesh size of both hydrogels, supporting the diffusion based release kinetics of the protein. Based on a simplified method calculation, the diffusion coefficient of Galbumin in the hydrogel was determined to be a factor 10–15 slower compared to the diffusion in water (see Supporting Information).
2.5. in Vivo Protein Release Evaluated by MRI
The hydrogels injected in the center of the striatum were clearly detectable on in vivo rat brain GE3D images (Figure 7). Serial MRI over the 21 days observation period revealed clear changes in T1 values at the hydrogel injection site (Figure 8). Significant T1 shortening in the paramagnetic Galbumin-loaded gels resulted in a hypointense appearance on T1 maps. The blank LC and HC Thermo gels showed a gradual T1 prolongation toward the final measurement on day 21, when the injected gels appeared as distinctive bright volumes on T1 maps. Besides swelling, degradation of the gel matrix likely contributes to the T1 prolongation. Based on previous data, we do not expect degradation of the hydrogels within the time window of the in vitro (27 days) or the in vivo experiments (21 days).31 In the Galbumin-loaded thermosensitive gels, T1 normalized during the first week, pointing toward Galbumin release, followed by further T1 prolongation up to day 21.
Figure 7.

In vivo MRI of hydrogels after injection in rat brain. Representative GE3D images of axial (left), coronal (top right), and sagittal (bottom right) rat brain sections directly after stereotaxic Galbumin-loaded gel (LC Thermo) injection into the right striatum.
Figure 8.

Serial T1 maps of rat brain after injection of different blank or Galbumin-loaded hydrogels. T1 maps of a coronal rat brain slice at different time points after stereotaxic injection of nonloaded (blank) or Galbumin-loaded hydrogel in the right striatum. Directly after injection (day 0), the Galbumin-loaded hydrogel appears as an area with relatively low T1 values due to significant Galbumin-induced T1 shortening. Hydrogel volume remained relatively stable (LC Thermo), or increased (HC Thermo), up to day 21 after injection. T1 normalization in Galbumin-loaded thermosensitive gels during the first week after injection pointed toward release of Galbumin. A significant prolongation of T1 was observed in tissue surrounding the injection area of Galbumin-loaded or blank LC Thermo gel on day 2 and 7 after implantation (white arrows). Additionally, a prominent rim with relatively low T1 values enveloping the LC Thermo gels injection site formed around day 7 and remained present up to day 21 (black arrows).
Biomaterials science is striving to design hydrogels that are biocompatible with the implanted tissue environment. Often, injected materials induce a foreign body reaction, and the inflammatory response varies depending on the material.53 Some natural polymers, such as hyaluronic acid (HA) in thermosensitive hydrogels, have intrinsic anti-inflammatory properties, which may negate inflammation at the site of delivery.54 Interestingly, after injection of Galbumin-loaded or blank LC Thermo gel, a significant increase of T1 was observed in tissue surrounding the injection area on day 2 and 7 after implantation, which was less obvious or absent after implantation of the HC Thermal gel (Figure 8, white arrows, and Figure 10). This T1 prolongation in adjacent tissue may have been caused by elevated fluid accumulation. Additionally, a marked rim with relatively short T1, enveloping the LC Thermo gels injection site, formed around day 7 and remained present up to the final MRI measurement (Figure 8, black arrows). This effect, which was not obvious after injection of the HC Thermo gel, may reflect gliosis.55
Figure 10.

T1 of surrounding ipsilateral and homologous contralateral brain tissue at different time points after unilateral implantation of the hydrogels. *P < 0.05 vs day 0.
The success of a biocompatible drug delivery system depends on its ability to deliver pharmacologically active compounds to the treatment area at specific rates, throughout the entire therapy regimen.12In vivo Galbumin release from the hydrogels was quantified from the T1 measurements, similar to the in vitro MRI experiments. We corrected for volume changes in order to standardize the release kinetics between the two hydrogels, in the same way as for the in vitro experiment (eq 5) and present the results in a Galbumin release graph (Figure 9). Within 2 days after intracerebral injection, the LC Thermo and HC Thermo gels lost 69 ± 12% and 24 ± 15% of their initial protein load (after volume correction), respectively. In the subsequent weeks, the gradual Galbumin release persisted, resulting in residual levels (after volume correction) of approximately 0% and 20% at 21 days postinjection for LC Thermo and HC Thermo gels, respectively.
Figure 9.

In vivo Galbumin release from intracerebrally injected hydrogels. In vivo cumulative Galbumin release from LC Thermo and HC Thermo gels as a function of time after intracerebral injection in a rat brain. Data are shown as mean ± SD (LC Thermo, n = 3; HC Thermo, n = 3).
Theoretically, a relatively high polymer weight fraction is expected to yield a gel with slower degradation kinetics and prolonged release of the loaded protein compared to a gel with a lower polymer weight fraction.56,57 In line with this, the HC Thermo gel, having a higher polymer weight fraction, demonstrated slower Galbumin release both in vitro (Figure 5) and in vivo (Figure 9) compared to the LC Thermo gel. Both gels demonstrated first order release kinetics in vitro, meaning that the size of the protein is smaller than the mesh size of the hydrogel matrices. Moreover, for both gels, Galbumin release reached higher values in vivo after intracerebral implantation of the gel, compared to in vitro. Until the end of the first week after intracerebral injection, LC Thermo and HC Thermo gels had already released 83 ± 16% and 57 ± 15% of their protein loading into the brain, respectively. This may have been caused by the specificity of the tissue environment58 and the potential enzymatic degradation of the polymer matrix in vivo,59,60 increasing the release rate compared to in vitro conditions. In particular, the action of hyaluronidases in the brain may be responsible for cleaving the HA component of the thermosensitive hydrogel network.61 Indeed, in vivo and in vitro correlation of hydrogel controlled release systems has been hardly investigated, and may be affected by the environment at the site of administration. Assessment of in vitro release kinetics describes a hydrogel formed under idealized conditions of pure buffer solutions, in the absence of tissue, CSF or blood factors that are present in vivo. In vivo conditions that affect drug release can be independent of the delivery system, such as, drug diffusion barriers (fluid viscosity, connective tissue), drug partitioning at the site (possible uptake into fatty tissue), the fluid volume present at the site and specific tissue dynamics.62 Delivery system dependent factors, on the other hand are specific to a particular delivery system and range from enzymatic degradation, protein adsorption, phagocytosis, as well as any possible inflammatory reaction to the delivery system.62 With the thermosensitive hydrogel in this study, the smaller volume used in vivo (5 μL) compared to in vitro (40 μL), resulting in a larger surface/volume ratio, may have influenced the swelling behavior and release kinetics. Also, potential dilution may have occurred during injection in the brain while the gel was formed, which is absent during in vitro hydrogel formation, since no excess fluid was present and release medium was added at a later time point.
The thermosensitive gels used in the present study were first described by Censi et al., and were suggested as a slow release systems suitable for in vivo applications.31 Yet, the behavior of these hydrogels in the brain have not been previously addressed. In the present study, the high concentration (HC) Thermo gel had a large swelling ratio, particularly after implantation in the brain. Biomaterials with enhanced capacity to absorb water from the surrounding environment are prone to have increased contact with the ECM, however an uncontrolled swelling profile may affect the structural stability of the material, causing compressive pressures on the surrounding tissue.63 This, on the other hand may evoke a local tissue response and cerebral edema formation that may be detected with T1 MRI. Changes in T1 values outside the area of gel implantation were not detected for the HC Thermo gel. However, we did find an increase in T1 values after injection of the LC Thermo gel, both in the absence and presence of Galbumin loading (Figure 10). Because LC Thermo gel degrades and releases its contents faster than the HC Thermo gel, we speculate that T1 prolongation in adjacent tissue was at least partly due to elevated fluid accumulation potentially as a result of discharged degradation products. These degradation products diffuse into the surrounding tissue, thereby increasing the water content in the extracellular space via osmosis. Additionally, it may be possible that the injection procedure and/or the faster degradation of the LC Thermo gel evokes an inflammatory response prompting glial activation around the gel.64 Thus, the rim with relatively short T1 around the hydrogel may be similar to MRI-based observations of a fibrous pseudocapsule as a result of scar tissue formation in the case of tissue gel implants, such as dermal fillers and mammoplasty.65,66 In the chronic phase of inflammation, gliosis may result in isolation of the delivery system and a consequent reduction in the fluid volume, which in turn will alter the release kinetics.62 The rim-like T1 shortening around the gel cannot be explained by a peripheral retention of Galbumin, as the same feature was observed around the blank LC Thermo gel implants (Figure 8).
The observed in vivo volume increase for both thermosensitive gels, accompanied by signs of fluid accumulation in surrounding tissue of implanted LC Thermo gels at day 2 and 7, did not result in significant behavioral changes in the sensorimotor performance score (SPS). SPS values were 0 ± 0 (i.e., no deficits) for all experimental groups at all time points (data not shown).
Conclusion
While many hydrogel-based drug delivery systems have been developed for localized treatment, the scarcity of noninvasive imaging techniques to get insight into the relationship between in vitro and in vivo release behavior remains a limiting factor. The MRI methodology presented in this study provides a unique approach to noninvasively monitor controlled protein release from a locally injected hydrogel formulation into the brain of living animals. This strategy allowed the longitudinal assessment in individual animals, therefore substantially decreasing the number of experimental animals required to obtain high-quality data. After injection into the rat brain, the release kinetics of a gadolinium-labeled model protein (Galbumin) from two thermosensitive hydrogels of the same chemical composition but different initial water content could be determined by changes in T1 up to 3 weeks after implantation. The evaluation of discrepancies between in vitro and in vivo release profiles and volume changes suggests that the local microenvironment may have a significant impact on hydrogel behavior. Moreover, within the same imaging session, characterization of hydrogel behavior can be done in conjunction with an estimation of the effects on the surrounding tissue using structural and functional imaging protocols.
Our MRI approach enables noninvasive release profile measurement of not only albumin but also other MR contrast agent-associated proteins from injected hydrogel matrices. This could aid in the development of innovative tailor-made carrier systems for prolonged drug release in the injured brain.
Supporting Information Available
The Supporting Information is available free of charge at https://pubs.acs.org/doi/10.1021/acsbiomaterials.2c01224.
Supplementary Figure 1, Galbumin release from in vitro hydrogel samples at 37 °C over the first 24 h after gelation; Supplementary Figure 2, T1 maps of a coronal brain slice for each rat included in the study, acquired directly after stereotaxic injection of 5 μL thermosensitive gel in healthy rat brain; diffusion coefficient estimation using mathematical models for diffusion from a slab of gel in a reservoir system (PDF)
Author Contributions
Pavel Yanev: Conceptualization, Methodology, Formal analysis, Investigation, Writing - Original draft preparation, Visualization. Geralda A.F. van Tilborg: Data curation, Writing - Review & Editing, Methodology. Kristel W.M. Boere: Resources. Ann M. Stowe: Validation. Annette van der Toorn: Software, Methodology. Max A. Viergever: Validation. Wim E. Hennink: Validation, Writing - Review & Editing. Tina Vermonden: Resources, Validation. Rick M. Dijkhuizen: Writing - Review & Editing, Project administration, Supervision, Funding acquisition.
This work was supported by The Netherlands Organization for Scientific Research [NWO-Vici 016.130.662].
The authors declare no competing financial interest.
Supplementary Material
References
- Alavijeh M. S.; Chishty M.; Qaiser M. Z.; Palmer A. M. Drug metabolism and pharmacokinetics, the blood-brain barrier, and central nervous system drug discovery. NeuroRx 2005, 2, 554–571. 10.1602/neurorx.2.4.554. [DOI] [PMC free article] [PubMed] [Google Scholar]
- Barar J.; Rafi M. A.; Pourseif M. M.; Omidi Y. Blood-brain barrier transport machineries and targeted therapy of brain diseases. Bioimpacts 2016, 6, 225–248. 10.15171/bi.2016.30. [DOI] [PMC free article] [PubMed] [Google Scholar]
- Daneman R. The blood-brain barrier in health and disease. Ann. Neurol. 2012, 72, 648–672. 10.1002/ana.23648. [DOI] [PubMed] [Google Scholar]
- Daneman R.; Prat A. The blood-brain barrier. Cold Spring Harb. Perspect. Biol. 2015, 7, a020412. 10.1101/cshperspect.a020412. [DOI] [PMC free article] [PubMed] [Google Scholar]
- Choonara Y. E.; Kumar P.; Modi G.; Pillay V. Improving drug delivery technology for treating neurodegenerative diseases. Expert Opin Drug Deliv 2016, 13, 1029–1043. 10.1517/17425247.2016.1162152. [DOI] [PubMed] [Google Scholar]
- Duncan R. The dawning era of polymer therapeutics. Nat. Rev. Drug Discovery 2003, 2, 347–360. 10.1038/nrd1088. [DOI] [PubMed] [Google Scholar]
- Solaro R.; Chiellini F.; Battisti A. Targeted Delivery of Protein Drugs by Nanocarriers. Materials 2010, 3, 1928–1980. 10.3390/ma3031928. [DOI] [Google Scholar]
- Bergonzi M. C.; Guccione C.; Grossi C.; Piazzini V.; Torracchi A.; Luccarini I.; Casamenti F.; Bilia A. R. Albumin Nanoparticles for Brain Delivery: A Comparison of Chemical versus Thermal Methods and in vivo Behavior. ChemMedChem. 2016, 11, 1840–1849. 10.1002/cmdc.201600080. [DOI] [PubMed] [Google Scholar]
- Huang M.; Gu X.; Gao X., 13 - Nanotherapeutic strategies for the treatment of neurodegenerative diseases. In Gao H., Gao X., Eds.; Brain Targeted Drug Delivery System; Academic Press, 2019; pp 321–356. [Google Scholar]
- Ghuman H.; Massensini A. R.; Donnelly J.; Kim S. M.; Medberry C. J.; Badylak S. F.; Modo M. ECM hydrogel for the treatment of stroke: Characterization of the host cell infiltrate. Biomaterials 2016, 91, 166–181. 10.1016/j.biomaterials.2016.03.014. [DOI] [PMC free article] [PubMed] [Google Scholar]
- Nih L. R.; Carmichael S. T.; Segura T. Hydrogels for brain repair after stroke: an emerging treatment option. Curr. Opin. Biotechnol. 2016, 40, 155–163. 10.1016/j.copbio.2016.04.021. [DOI] [PMC free article] [PubMed] [Google Scholar]
- Hoare T. R.; Kohane D. S. Hydrogels in drug delivery: Progress and challenges. Polymer 2008, 49, 1993–2007. 10.1016/j.polymer.2008.01.027. [DOI] [Google Scholar]
- Fleming A. B.; Saltzman W. M. Pharmacokinetics of the carmustine implant. Clin. Pharmacokinet. 2002, 41, 403–419. 10.2165/00003088-200241060-00002. [DOI] [PubMed] [Google Scholar]
- Fung L. K.; Shin M.; Tyler B.; Brem H.; Saltzman W. M. Chemotherapeutic drugs released from polymers: distribution of 1,3-bis(2-chloroethyl)-1-nitrosourea in the rat brain. Pharm. Res. 1996, 13, 671–682. 10.1023/A:1016083113123. [DOI] [PubMed] [Google Scholar]
- Vermonden T.; Censi R.; Hennink W. E. Hydrogels for protein delivery. Chem. Rev. 2012, 112, 2853–2888. 10.1021/cr200157d. [DOI] [PubMed] [Google Scholar]
- Jiang Y.; Chen J.; Deng C.; Suuronen E. J.; Zhong Z. Click hydrogels, microgels and nanogels: emerging platforms for drug delivery and tissue engineering. Biomaterials 2014, 35, 4969–4985. 10.1016/j.biomaterials.2014.03.001. [DOI] [PubMed] [Google Scholar]
- Buwalda S. J.; Vermonden T.; Hennink W. E. Hydrogels for Therapeutic Delivery: Current Developments and Future Directions. Biomacromolecules 2017, 18, 316–330. 10.1021/acs.biomac.6b01604. [DOI] [PubMed] [Google Scholar]
- Aurand E. R.; Wagner J.; Lanning C.; Bjugstad K. B. Building biocompatible hydrogels for tissue engineering of the brain and spinal cord. J. Funct Biomater 2012, 3, 839–863. 10.3390/jfb3040839. [DOI] [PMC free article] [PubMed] [Google Scholar]
- Rossi B.; Venuti V.; D’Amico F.; Gessini A.; Mele A.; Punta C.; Melone L.; Crupi V.; Majolino D.; Masciovecchio C. Guest-matrix interactions affect the solvation of cyclodextrin-based polymeric hydrogels: a UV Raman scattering study. Soft Matter 2016, 12, 8861–8868. 10.1039/C6SM01647B. [DOI] [PubMed] [Google Scholar]
- Weber L. M.; Lopez C. G.; Anseth K. S. Effects of PEG hydrogel crosslinking density on protein diffusion and encapsulated islet survival and function. J. Biomed. Mater. Res., Part A 2009, 90, 720–729. 10.1002/jbm.a.32134. [DOI] [PMC free article] [PubMed] [Google Scholar]
- Singh N. K.; Lee D. S. In situ gelling pH- and temperature-sensitive biodegradable block copolymer hydrogels for drug delivery. J. Controlled Release 2014, 193, 214–227. 10.1016/j.jconrel.2014.04.056. [DOI] [PubMed] [Google Scholar]
- Thambi T.; Phan V. H.; Lee D. S. Stimuli-Sensitive Injectable Hydrogels Based on Polysaccharides and Their Biomedical Applications. Macromol. Rapid Commun. 2016, 37, 1881–1896. 10.1002/marc.201600371. [DOI] [PubMed] [Google Scholar]
- Nguyen Q. V.; Huynh D. P.; Park J. H.; Lee D. S. Injectable polymeric hydrogels for the delivery of therapeutic agents: A review. Eur. Polym. J. 2015, 72, 602–619. 10.1016/j.eurpolymj.2015.03.016. [DOI] [Google Scholar]
- Bakaic E.; Smeets N.; Hoare T. Injectable Hydrogels Based on Poly(Ethylene Glycol) and Derivatives as Functional Biomaterials. RSC Adv. 2015, 5, 35469–35486. 10.1039/C4RA13581D. [DOI] [Google Scholar]
- Klouda L. Thermoresponsive hydrogels in biomedical applications: A seven-year update. Eur. J. Pharm. Biopharm. 2015, 97, 338–349. 10.1016/j.ejpb.2015.05.017. [DOI] [PubMed] [Google Scholar]
- Brahima S.; Boztepe C.; Kunkul A.; Yuceer M. Modeling of drug release behavior of pH and temperature sensitive poly(NIPAAm-co-AAc) IPN hydrogels using response surface methodology and artificial neural networks. Mater. Sci. Eng. C Mater. Biol. Appl. 2017, 75, 425–432. 10.1016/j.msec.2017.02.081. [DOI] [PubMed] [Google Scholar]
- Wang Q.; He Y.; Zhao Y.; Xie H.; Lin Q.; He Z.; Wang X.; Li J.; Zhang H.; Wang C.; Gong F.; Li X.; Xu H.; Ye Q.; Xiao J. A Thermosensitive Heparin-Poloxamer Hydrogel Bridges aFGF to Treat Spinal Cord Injury. ACS Appl. Mater. Interfaces 2017, 9, 6725–6745. 10.1021/acsami.6b13155. [DOI] [PubMed] [Google Scholar]
- Hong L. T. A.; Kim Y. M.; Park H. H.; Hwang D. H.; Cui Y.; Lee E. M.; Yahn S.; Lee J. K.; Song S. C.; Kim B. G. An injectable hydrogel enhances tissue repair after spinal cord injury by promoting extracellular matrix remodeling. Nat. Commun. 2017, 8, 533. 10.1038/s41467-017-00583-8. [DOI] [PMC free article] [PubMed] [Google Scholar]
- Li J.; Darabi M.; Gu J.; Shi J.; Xue J.; Huang L.; Liu Y.; Zhang L.; Liu N.; Zhong W.; Zhang L.; Xing M.; Zhang L. A drug delivery hydrogel system based on activin B for Parkinson’s disease. Biomaterials 2016, 102, 72–86. 10.1016/j.biomaterials.2016.06.016. [DOI] [PubMed] [Google Scholar]
- Peppas N. A.; Khare A. R. Preparation, structure and diffusional behavior of hydrogels in controlled release. Adv. Drug Delivery Rev. 1993, 11, 1–35. 10.1016/0169-409X(93)90025-Y. [DOI] [Google Scholar]
- Censi R.; Fieten P. J.; di Martino P.; Hennink W. E.; Vermonden T. In Situ Forming Hydrogels by Tandem Thermal Gelling and Michael Addition Reaction between Thermosensitive Triblock Copolymers and Thiolated Hyaluronan. Macromolecules 2010, 43, 5771–5778. 10.1021/ma100606a. [DOI] [PubMed] [Google Scholar]
- Malana M. A.; Zohra R. The release behavior and kinetic evaluation of tramadol HCl from chemically cross linked Ter polymeric hydrogels. Daru 2013, 21, 10. 10.1186/2008-2231-21-10. [DOI] [PMC free article] [PubMed] [Google Scholar]
- Vermonden T.; Jena S. S.; Barriet D.; Censi R.; van der Gucht J.; Hennink W. E.; Siegel R. A. Macromolecular Diffusion in Self-Assembling Biodegradable Thermosensitive Hydrogels. Macromolecules 2010, 43, 782–789. 10.1021/ma902186e. [DOI] [PMC free article] [PubMed] [Google Scholar]
- De Smedt S. C.; Meyvis T. K. L.; Demeester J.; Van Oostveldt P.; Blonk J. C. G.; Hennink W. E. Diffusion of Macromolecules in Dextran Methacrylate Solutions and Gels As Studied by Confocal Scanning Laser Microscopy. Macromolecules 1997, 30, 4863–4870. 10.1021/ma970100y. [DOI] [Google Scholar]
- Liu J.; Wang K.; Luan J.; Wen Z.; Wang L.; Liu Z.; Wu G.; Zhuo R. Visualization of in situ hydrogels by MRI in vivo. J. Mater. Chem. B 2016, 4, 1343–1353. 10.1039/C5TB02459E. [DOI] [PubMed] [Google Scholar]
- Chen Z.; Yan C.; Yan S.; Liu Q.; Hou M.; Xu Y.; Guo R. Non-invasive monitoring of in vivo hydrogel degradation and cartilage regeneration by multiparametric MR imaging. Theranostics 2018, 8, 1146–1158. 10.7150/thno.22514. [DOI] [PMC free article] [PubMed] [Google Scholar]
- Viglianti B. L.; Abraham S. A.; Michelich C. R.; Yarmolenko P. S.; MacFall J. R.; Bally M. B.; Dewhirst M. W. In vivo monitoring of tissue pharmacokinetics of liposome/drug using MRI: illustration of targeted delivery. Magn. Reson. Med. 2004, 51, 1153–1162. 10.1002/mrm.20074. [DOI] [PubMed] [Google Scholar]
- Gupta N. V.; Shivakumar H. G. Investigation of Swelling Behavior and Mechanical Properties of a pH-Sensitive Superporous Hydrogel Composite. Iran J. Pharm. Res. 2012, 11, 481–493. [PMC free article] [PubMed] [Google Scholar]
- Park H.; Guo X.; Temenoff J. S.; Tabata Y.; Caplan A. I.; Kasper F. K.; Mikos A. G. Effect of swelling ratio of injectable hydrogel composites on chondrogenic differentiation of encapsulated rabbit marrow mesenchymal stem cells in vitro. Biomacromolecules 2009, 10, 541–546. 10.1021/bm801197m. [DOI] [PMC free article] [PubMed] [Google Scholar]
- Kratz F. Albumin as a drug carrier: design of prodrugs, drug conjugates and nanoparticles. J. Controlled Release 2008, 132, 171–183. 10.1016/j.jconrel.2008.05.010. [DOI] [PubMed] [Google Scholar]
- Kim I.; Kim H. G.; So J. N.; Kim J. H.; Kwak H. J.; Koh G. Y. Angiopoietin-1 regulates endothelial cell survival through the phosphatidylinositol 3′-Kinase/Akt signal transduction pathway. Circ. Res. 2000, 86, 24–29. 10.1161/01.RES.86.1.24. [DOI] [PubMed] [Google Scholar]
- Atallah P.; Schirmer L.; Tsurkan M.; Putra Limasale Y. D.; Zimmermann R.; Werner C.; Freudenberg U. In situ-forming, cell-instructive hydrogels based on glycosaminoglycans with varied sulfation patterns. Biomaterials 2018, 181, 227–239. 10.1016/j.biomaterials.2018.07.056. [DOI] [PubMed] [Google Scholar]
- Yanev P.; Jolkkonen J.; Airenne K.; Ylä-Herttuala S.; Wirth T. Enhanced angiogenesis and reduced infarct size by vascular endothelial growth factor D is not translated to behavioral outcome in a rat model of ischemic stroke. J. Exp. Stroke Transl. Med. 2010, 3 (2), 1–12. 10.4172/1939-067X.1000126.21423790 [DOI] [Google Scholar]
- Puurunen K.; Jolkkonen J.; Sirvio J.; Haapalinna A.; Sivenius J. Selegiline combined with enriched-environment housing attenuates spatial learning deficits following focal cerebral ischemia in rats. Exp. Neurol. 2001, 167, 348–355. 10.1006/exnr.2000.7563. [DOI] [PubMed] [Google Scholar]
- Caravan P.; Ellison J. J.; McMurry T. J.; Lauffer R. B. Gadolinium(III) Chelates as MRI Contrast Agents: Structure, Dynamics, and Applications. Chem. Rev. 1999, 99, 2293–2352. 10.1021/cr980440x. [DOI] [PubMed] [Google Scholar]
- Kamdi S.; Krishna R. Image Segmentation and Region Growing Algorithm. Int. J. Comput. Technol. 2012, 2, 103–107. [Google Scholar]
- Passat N.; Ronse C.; Baruthio J.; Armspach J. P.; Maillot C.; Jahn C. Region-growing segmentation of brain vessels: an atlas-based automatic approach. J. Magn. Reson. Imaging 2005, 21, 715–725. 10.1002/jmri.20307. [DOI] [PubMed] [Google Scholar]
- Peppas N. A. 1. Commentary on an exponential model for the analysis of drug delivery: Original research article: a simple equation for description of solute release: I II. Fickian and non-Fickian release from non-swellable devices in the form of slabs, spheres, cylinders or discs, 1987. J. Controlled Release 2014, 190, 31–32. [PubMed] [Google Scholar]
- Siepmann J.; Siepmann F. Modeling of diffusion controlled drug delivery. J. Controlled Release 2012, 161, 351–362. 10.1016/j.jconrel.2011.10.006. [DOI] [PubMed] [Google Scholar]
- Siepmann J.; Peppas N. A. Higuchi equation: derivation, applications, use and misuse. Int. J. Pharm. 2011, 418, 6–12. 10.1016/j.ijpharm.2011.03.051. [DOI] [PubMed] [Google Scholar]
- Khorolskyi O.; Malomuzh N. Macromolecular sizes of serum albumins in its aqueous solutions. AIMS Biophysics 2020, 7, 219–235. 10.3934/biophy.2020017. [DOI] [Google Scholar]
- Anderson J. M.; Rodriguez A.; Chang D. T. Foreign body reaction to biomaterials. Semin. Immunol. 2008, 20, 86–100. 10.1016/j.smim.2007.11.004. [DOI] [PMC free article] [PubMed] [Google Scholar]
- Marinho A.; Nunes C.; Reis S. Hyaluronic Acid: A Key Ingredient in the Therapy of Inflammation. Biomolecules 2021, 11, 1518. 10.3390/biom11101518. [DOI] [PMC free article] [PubMed] [Google Scholar]
- Fujioka M.; Taoka T.; Matsuo Y.; Mishima K.; Ogoshi K.; Kondo Y.; Tsuda M.; Fujiwara M.; Asano T.; Sakaki T.; Miyasaki A.; Park D.; Siesjo B. K. Magnetic resonance imaging shows delayed ischemic striatal neurodegeneration. Ann. Neurol. 2003, 54, 732–747. 10.1002/ana.10751. [DOI] [PubMed] [Google Scholar]
- Hennink W. E.; Talsma H.; Borchert J. C. H.; De Smedt S. C.; Demeester J. Controlled release of proteins from dextran hydrogels. J. Controlled Release 1996, 39, 47–55. 10.1016/0168-3659(95)00132-8. [DOI] [Google Scholar]
- Peppas N. A.; Bures P.; Leobandung W.; Ichikawa H. Hydrogels in pharmaceutical formulations. Eur. J. Pharm. Biopharm. 2000, 50, 27–46. 10.1016/S0939-6411(00)00090-4. [DOI] [PubMed] [Google Scholar]
- Arifin D. Y.; Lee K. Y.; Wang C. H. Chemotherapeutic drug transport to brain tumor. J. Controlled Release 2009, 137, 203–210. 10.1016/j.jconrel.2009.04.013. [DOI] [PubMed] [Google Scholar]
- Kazazi-Hyseni F.; van Vuuren S. H.; van der Giezen D. M.; Pieters E. H.; Ramazani F.; Rodriguez S.; Veldhuis G. J.; Goldschmeding R.; van Nostrum C. F.; Hennink W. E.; Kok R. J. Release and pharmacokinetics of near-infrared labeled albumin from monodisperse poly(d,l-lactic-co-hydroxymethyl glycolic acid) microspheres after subcapsular renal injection. Acta Biomater. 2015, 22, 141–154. 10.1016/j.actbio.2015.04.030. [DOI] [PubMed] [Google Scholar]
- Makadia H. K.; Siegel S. J. Poly Lactic-co-Glycolic Acid (PLGA) as Biodegradable Controlled Drug Delivery Carrier. Polymers (Basel) 2011, 3, 1377–1397. 10.3390/polym3031377. [DOI] [PMC free article] [PubMed] [Google Scholar]
- Perkins K. L.; Arranz A. M.; Yamaguchi Y.; Hrabetova S. Brain extracellular space, hyaluronan, and the prevention of epileptic seizures. Rev. Neurosci. 2017, 28, 869–892. 10.1515/revneuro-2017-0017. [DOI] [PMC free article] [PubMed] [Google Scholar]
- Zolnik B. S.; Burgess D. J. Evaluation of in vivo-in vitro release of dexamethasone from PLGA microspheres. J. Controlled Release 2008, 127, 137–145. 10.1016/j.jconrel.2008.01.004. [DOI] [PubMed] [Google Scholar]
- Boga J. C.; Miguel S. P.; de Melo-Diogo D.; Mendonca A. G.; Louro R. O.; Correia I. J. In vitro characterization of 3D printed scaffolds aimed at bone tissue regeneration. Colloids Surf. B. Biointerfaces 2018, 165, 207–218. 10.1016/j.colsurfb.2018.02.038. [DOI] [PubMed] [Google Scholar]
- Censi R.; van Putten S.; Vermonden T.; di Martino P.; van Nostrum C. F.; Harmsen M. C.; Bank R. A.; Hennink W. E. The tissue response to photopolymerized PEG-p(HPMAm-lactate)-based hydrogels. J. Biomed. Mater. Res., Part A 2011, 97, 219–229. 10.1002/jbm.a.33048. [DOI] [PubMed] [Google Scholar]
- Mundada P.; Kohler R.; Boudabbous S.; Toutous Trellu L.; Platon A.; Becker M. Injectable facial fillers: imaging features, complications, and diagnostic pitfalls at MRI and PET CT. Insights Imaging 2017, 8, 557–572. 10.1007/s13244-017-0575-0. [DOI] [PMC free article] [PubMed] [Google Scholar]
- Teo S. Y.; Wang S. C. Radiologic features of polyacrylamide gel mammoplasty. AJR Am. J. Roentgenol. 2008, 191, W89–95. 10.2214/AJR.07.3616. [DOI] [PubMed] [Google Scholar]
- Deichmann R.; Haase A. Quantification of T1 values by SNAPSHOT-FLASH NMR imaging. J. Magn. Reson. 1969, 96 (1992), 608–612. 10.1016/0022-2364(92)90347-A. [DOI] [Google Scholar]
Associated Data
This section collects any data citations, data availability statements, or supplementary materials included in this article.